In this issue:
Homebuilders: Negative Momentum
Abrdn: Structural Decline
UK Rising Stars
272 UK Equity Funds, AUM $185bn
Homebuilders: Negative Momentum
Sentiment reversal in UK Homebuilding stocks drives fund weights to 6-year lows.
Long-Term Trends & Short-Term Fund Activity
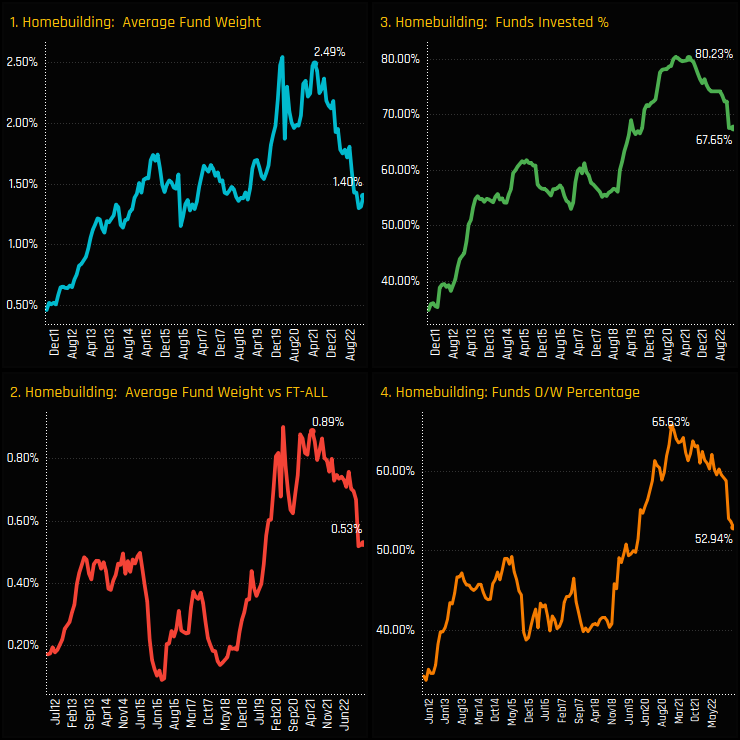
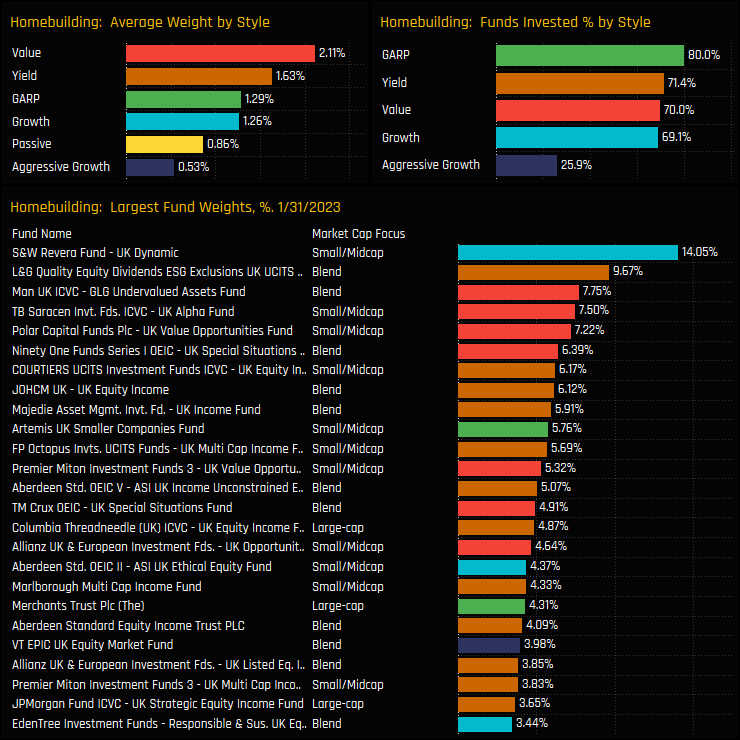
UK active funds continue to scale back exposure to the Homebuilding sector. The bullish ownership trend that stretched the best part of the last decade has peaked, reversed, and continues to track a downward course. Average weights peaked at 2.5% in mid-2021 (ch1), with 80.2% of funds invested (ch3) and a net overweight of +0.89% (ch2). Since that peak, UK funds started to sell out of the sector, putting pressure on prices which in turn prompted further selling. This self re-enforcing loop pushed average weights to a 6-year low of 1.4%.
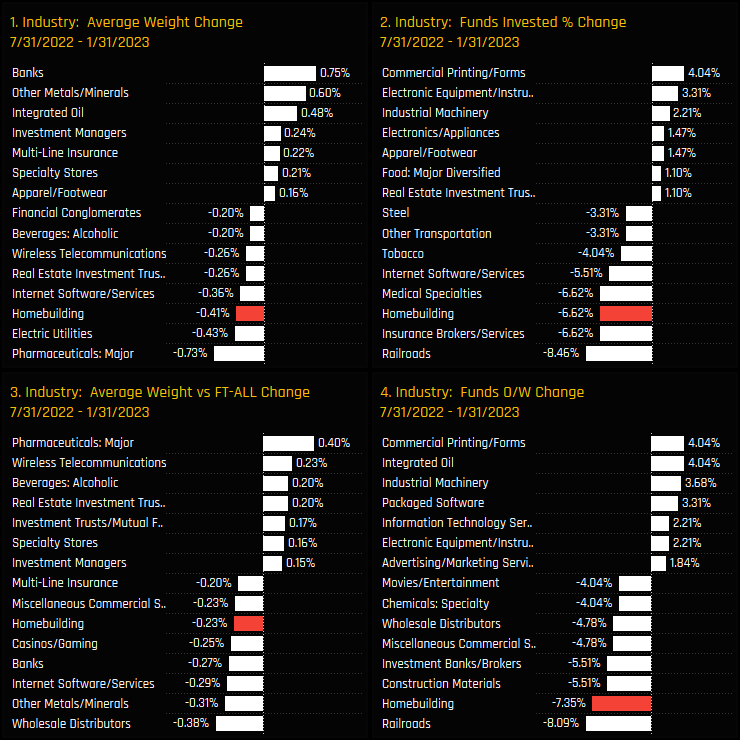
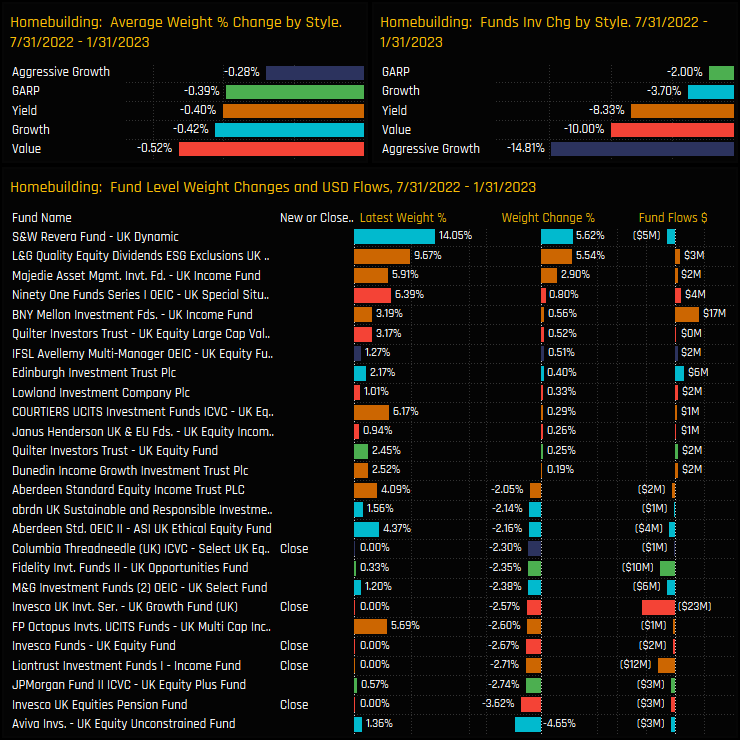
Compared to industry peers, ownership decreases in Homebuilding stocks have been among the worst over the last 6-months, with both absolute and relative measures of exposure moving lower. The decrease in average weights of -0.4% was only bettered by Electric Utilities and Pharmaceuticals, with UK managers instead increasing weights in Banks, Metals/Minerals and Integrated Oil (ch1). Be in no doubt this was an active rotation.
Industry Holdings & Sentiment
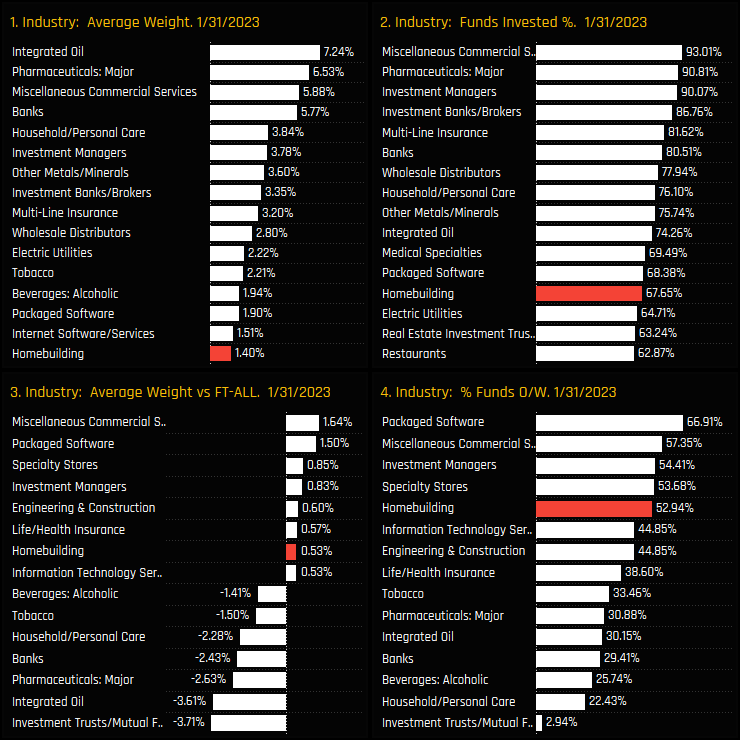
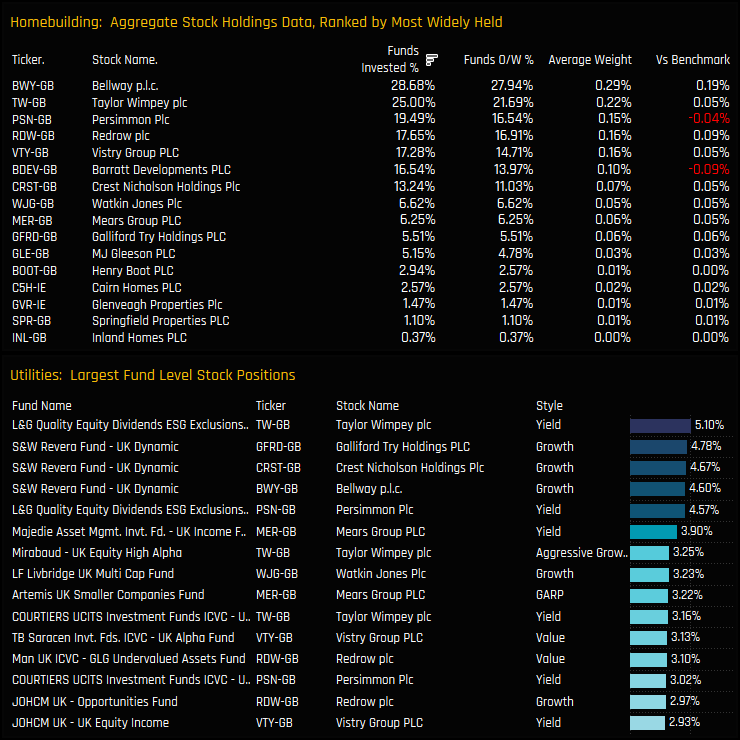
Homebuilding now sits well down the pecking order of Industry level allocations among UK managers, which are dominated by Integrated Oil, Pharmaceuticals, Commercial Services and Banks (ch1). Relative to the benchmark SPDRs FTSE All Share ETF however, Homebuilders still represent the 7th largest overweight holding (ch3) and the 5th most overweighted industry group, with the slight majority of UK invested positioned above the benchmark index (ch4)
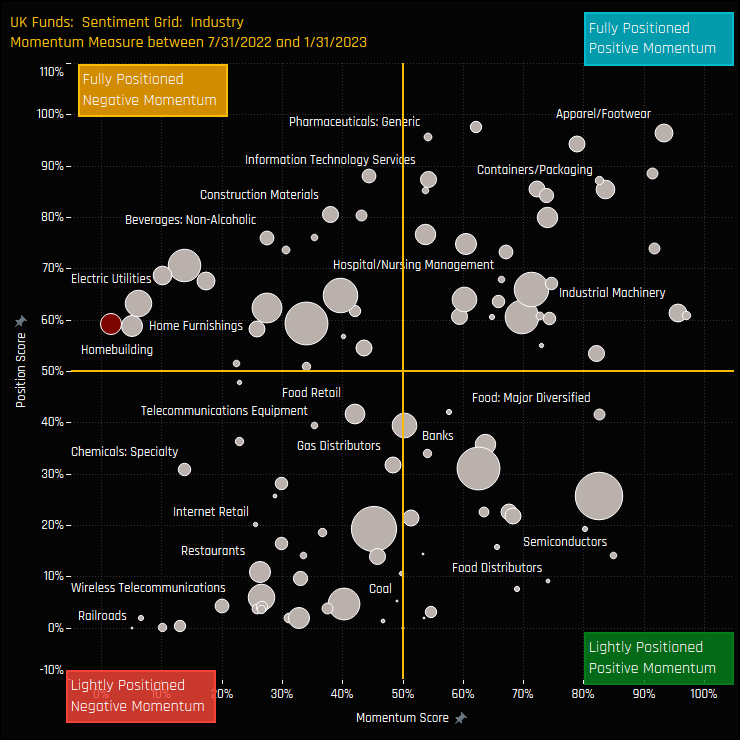
The Sentiment Grid opposite shows where current positioning in each UK Industry group sits versus its own history going back to 2011 on a scale of 0-100% (y-axis), against a measure of fund activity for each Industry between 07/31/2022 and 01/31/2023 (x-axis). Homebuilders sit in a precarious position in the middle-left of the Grid, with strong negative momentum among managers, but positioning levels still in the middle of the range. We are nowhere close to depressed levels of positioning.
Latest Holdings & Fund Activity
Fund holdings in the Homebuilding industry group are correlated to Style, with UK Value managers allocating 2.11% on average versus Aggressive Growth 0.53%. Indeed, only 25.9% of the Aggressive Growth funds in our analysis have any exposure to the sector, with the top order dominated by Yield and Value funds. The larger holders are at the lower-end of the market cap spectrum too, led by the Small/Midcap strategy of S&W Revera UK Dynamic (14.05%) and Blend strategy of L&G Quality Equity Dividend (9.67%).
The last 6-months has seen a number of well known UK managers cut exposure to the Homebuilding industry group, or reduce holdings significantly. Aviva UK Unconstrained reduced weights by -4.35%, whilst Invesco UK Pension, Liontrust UK Income and Invesco UK Equity were among those to close out. All Style groups saw exposure fall over the period, with 14.8% of Aggressive Growth funds closing out positions and 10% of Value funds.
Stock Holdings & Activity
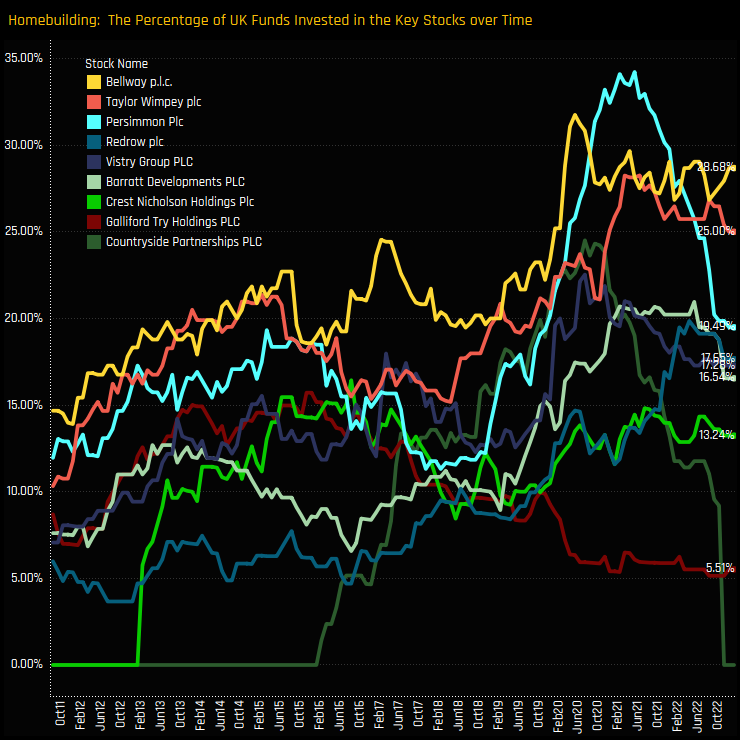
On a stock level, Bellway PLC and Taylor Wimpey PLC are the most widely held companies, owned by 28.7% and 25% of UK managers respectively. There is some depth to the sector outside of these 2 names, with Persimmon, Redrow and Vistry Group making up the 2nd tier. There are a number of sizeable holdings shown in the bottom chart that indicate a high degree of conviction in selected stocks from selected UK funds.
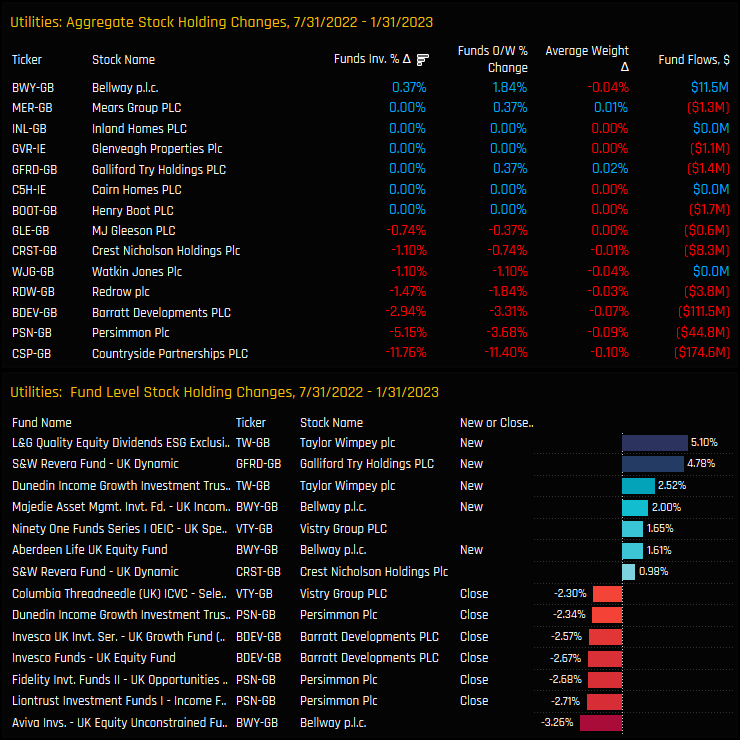
The charts below highlight the stocks that have driven allocations lower in the Homebuilding industry group over the last 6-months. Activity has been heavily skewed to the sell-side, with Persimmon PLC, Barratt Developments PLC and Redrow PLC all seeing ownership levels fall, in addition to the closing out of Countryside Partnerships positions following the Vistry takeover.
Conclusion and Links
Our UK fund ownership data shows a distinct change in sentiment towards the UK Homebuilding sector. Since peaking in 2021 after a decade long bull market in ownership, active UK managers have rotated out of key holdings or cut exposure significantly.
The chart to the right shows the time-series of the percentage of UK funds invested in the key Homebuilding stocks over the last decade. The industry wide trends are reflected on the single company level, with the majority of the larger holdings seeing a sharp reversal in ownership after peaking in 2021.
But even after the recent rotation, our data shows that Homebuilders are still far from underowned, with the majority of active funds positioned overweight the FTSE All Share benchmark. With this combination of overweight positioning and negative momentum, investors should tread carefully before trying picking a bottom.
Please click on the link below for more charts and data on the Homebuilding industry group among active UK Fund Managers.
Changing of the guard among UK Investment Managers as Abrdn hits lowest ownership levels on record.
Time-Series Analysis & Stock Activity
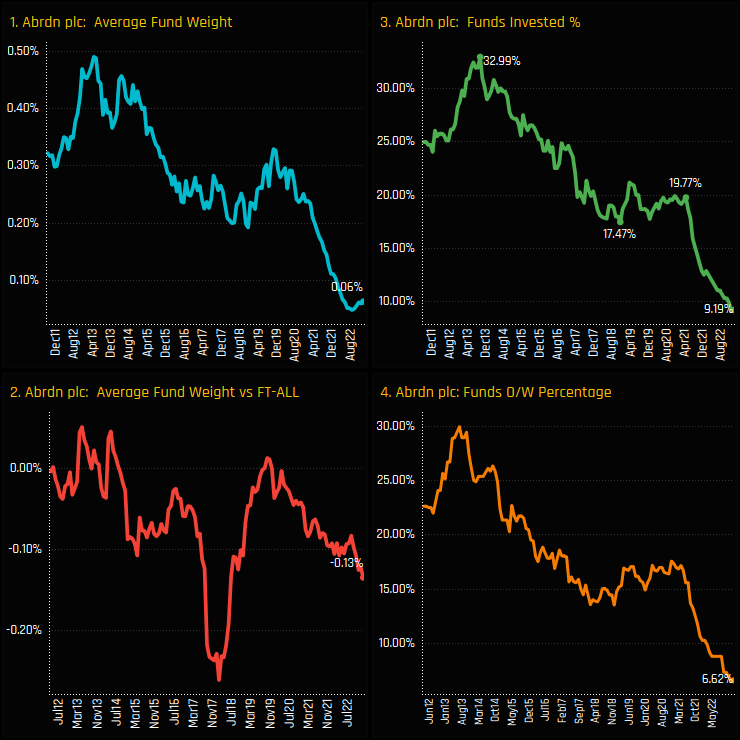
Investment levels in Abrdn PLC among UK active funds are at record lows. The decline in ownership came in two waves. The first a multi-year fall from the peak in 2013, where the percentage of funds invested in Abrdn fell from 33% to 17.5% in late 2018 (ch3). Selling was reignited again in April 2021, when the percentage of funds invested fell from 19.8% to just 9.2% today, the lowest level of investment ever recorded in our analysis.
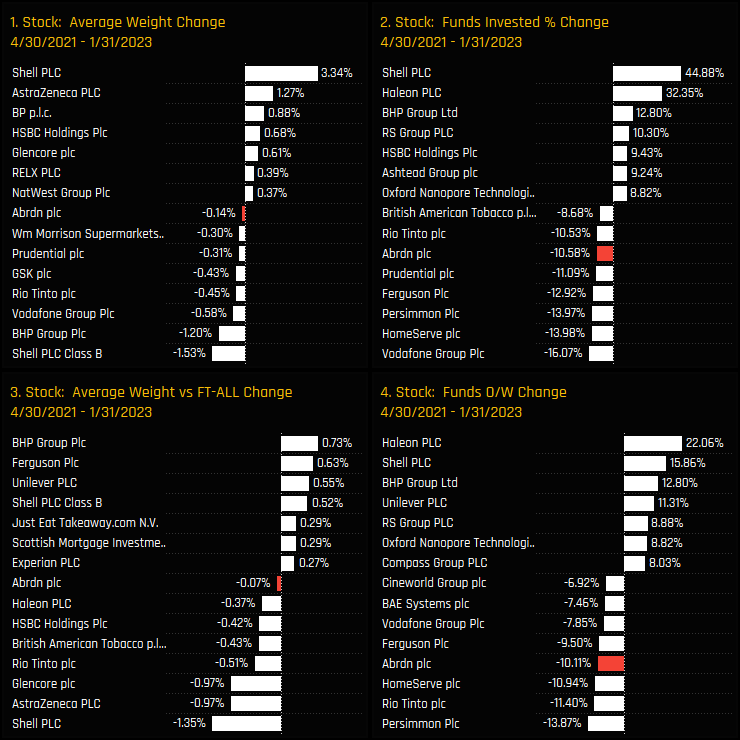
The below charts capture the changes in UK stock ownership over the period from the recent highs in April 2021 to today. Abrdn’s decrease in the percentage of funds invested of 10.6% was one of the highest among all UK stocks, putting it in the same category as Vodafone and Homeserve PLC that have also faced disapproval from UK investors. Haleon, RS Group and HSBC Holdings were among those on the other side of the rotation.
Fund Holdings & Activity
The fund activity that has underpinned the decline in ownership in Abrdn is shown in the charts below. On a Style basis, GARP and Value investors led the exodus, with 18.8% and 16.7% of funds closing exposure respectively between 04/30/2021 and 01/31/2023. On a fund level, closures from S&W Revera UK Dynamic (-3.04%), TB Saracen UK Alpha (-3.01%) and Liontrust UK Income (-2.9%) led a total of 29 UK funds who could no longer find reason to stay invested.
The fund ownership picture now is thin. Other than the GVQ UK Focus position of 5.59%, the majority of funds hold a sub 1% allocation, with the larger holders in the Value and Yield categories. Growth and Aggressive Growth funds are largely absent from the register. Abrdn has become at best a fringe holding, and at worst an easy stock avoid.
Peer Group Positioning
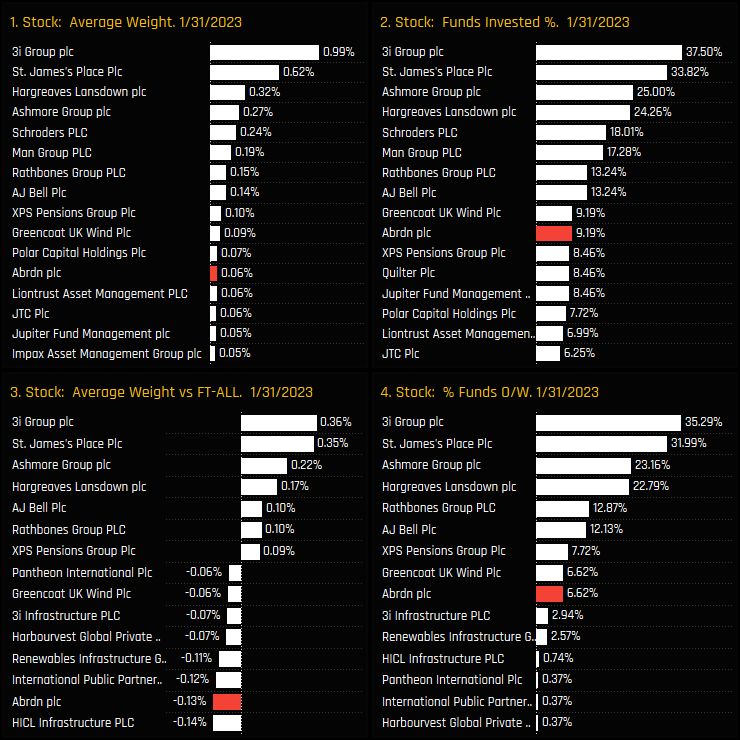
The charts below highlight how Abrdn has fallen down the ranks of fund ownership in the Investment Managers industry group. It is now the 10th most widely held company and the 12th largest average holding weight. The charts also highlight that low ownership isn’t an industry wide phenomenon, and that companies such as 3i Group plc, St. James’s Place and Ashmore Group have a widespread investor base. Versus the FTSE All Share benchmark, just under 95% of UK active managers are positioned underweight, or to put it another way, are entirely comfortable running the risk of Abrdn outperforming.
Finally, the below chart plots the percentage of funds invested in the key names in the UK Investment Managers industry group over the last decade. It highlights a changing of the guard, with Abrdn and Jupiter Fund Management seeing a structural decline in ownership, replaced by Ashmore Group, Hargreaves Lansdown, Man Group and Schroders PLC. Perhaps a name change might be in order to turns things around?
Links
Click on the link opposite for the full data report on Abrdn PLC positioning among active UK funds.
We screen for UK companies that are not widely held but are at record levels of ownership among actively managed funds.
Stock Sentiment Analysis
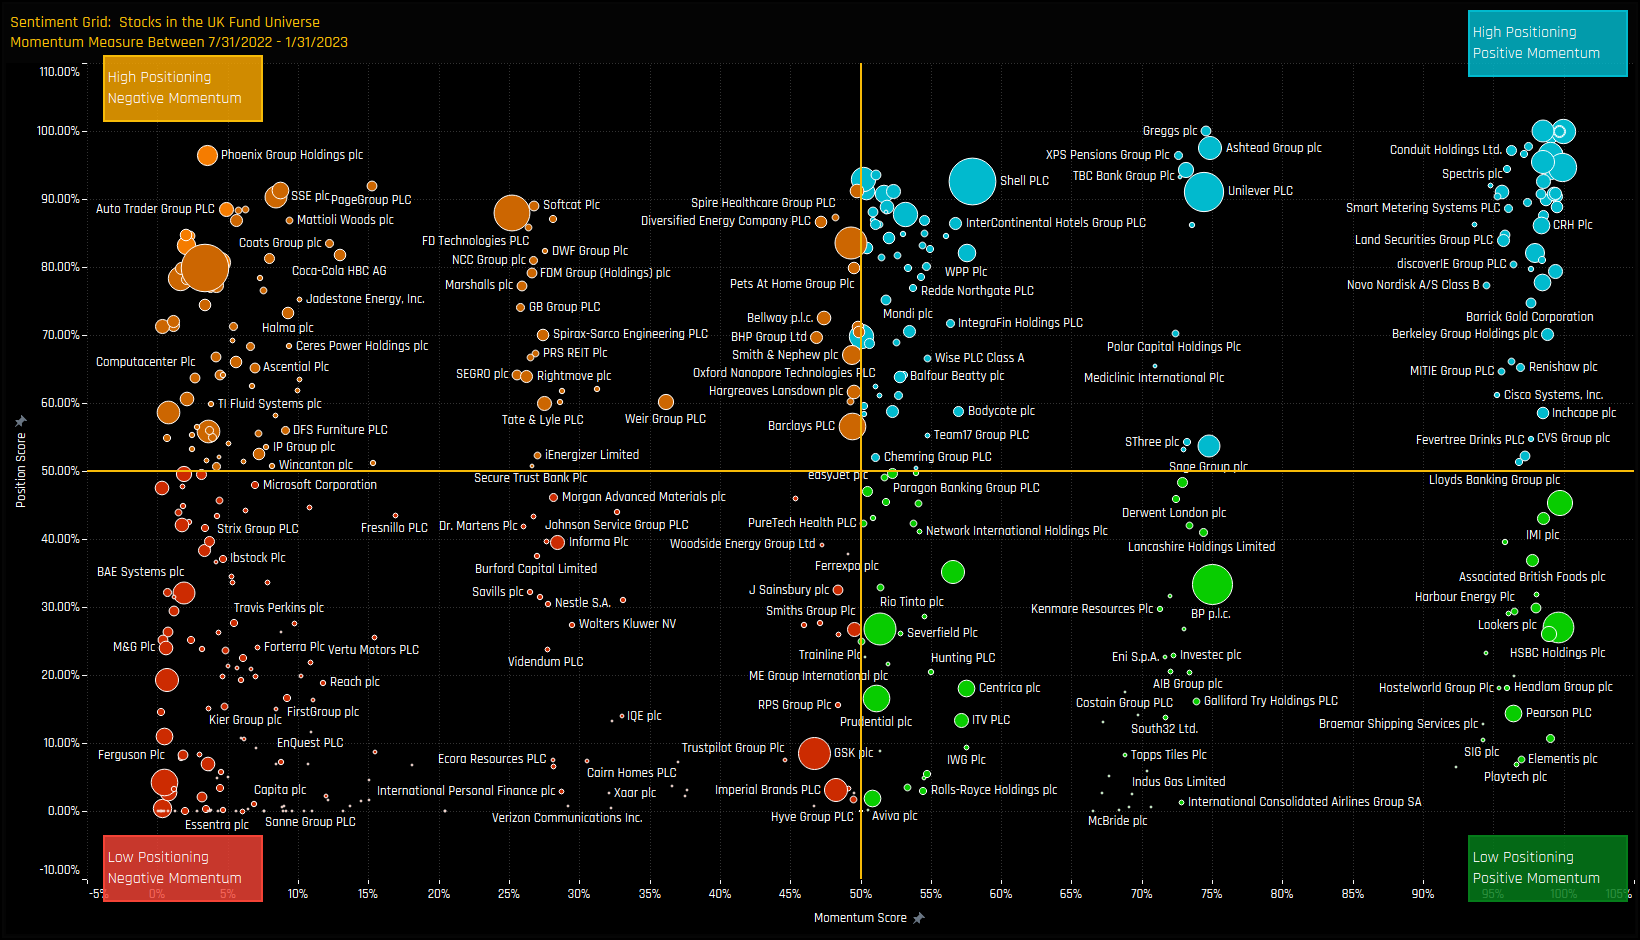
The sentiment grid below shows where current positioning in each stock in our UK Fund universe sits versus its own history going back to 2011 on a scale of 0-100% (y-axis), against a measure of fund activity for each stock between 07/31/2022 and 01/31/2023 (x-axis). The positioning score is based on a stock’s average weight, the percentage of funds who hold that stock and the percentage who are overweight. The momentum score is based on the change in those metrics over the last 6-months.
There is a broad spectrum of positioning and momentum levels among companies. For this analysis, we are interested in the extreme top-right of the grid. Stocks with record levels of positioning after capturing some of the largest increases in ownership over the last 6-months.
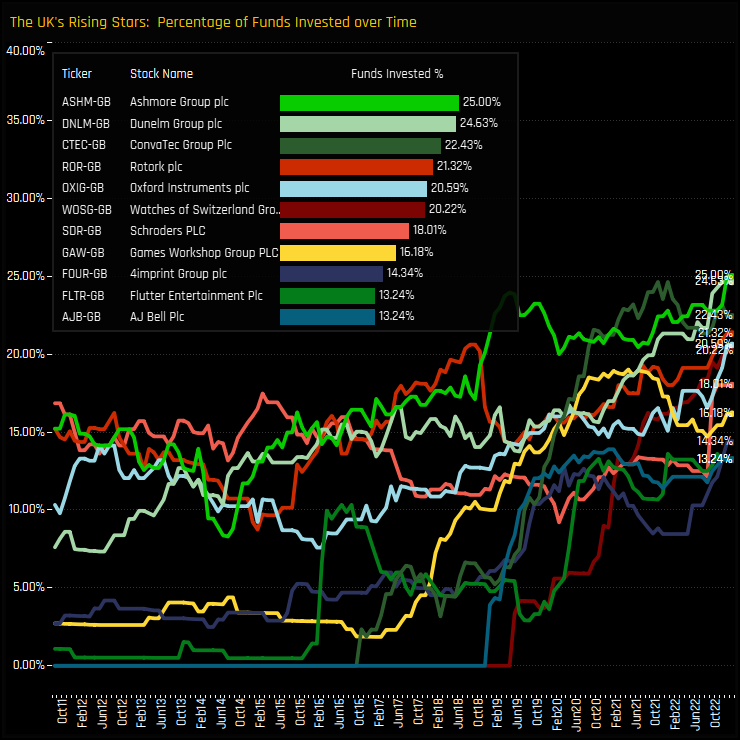
Rising Stars Stocks Screen
The below table shows stocks with positioning scores above 90% and momentum scores above 98%. We also remove stocks that are owned by less than 10% of funds and more than 30% – we want companies that have established an ownership base but are not universally held. 11 companies make the list, headed by Ashmore Group plc, a stock owned by a record 25% of managers and capturing strong ownership growth over the last 6-months.
The below charts displays the path of investment growth for each stock over the past decade. For most stocks, the percentage of funds invested is at or close to all-time highs, with strong investment growth seen over the last 6-months, though for many the path of rising ownership has been a multi-year process.
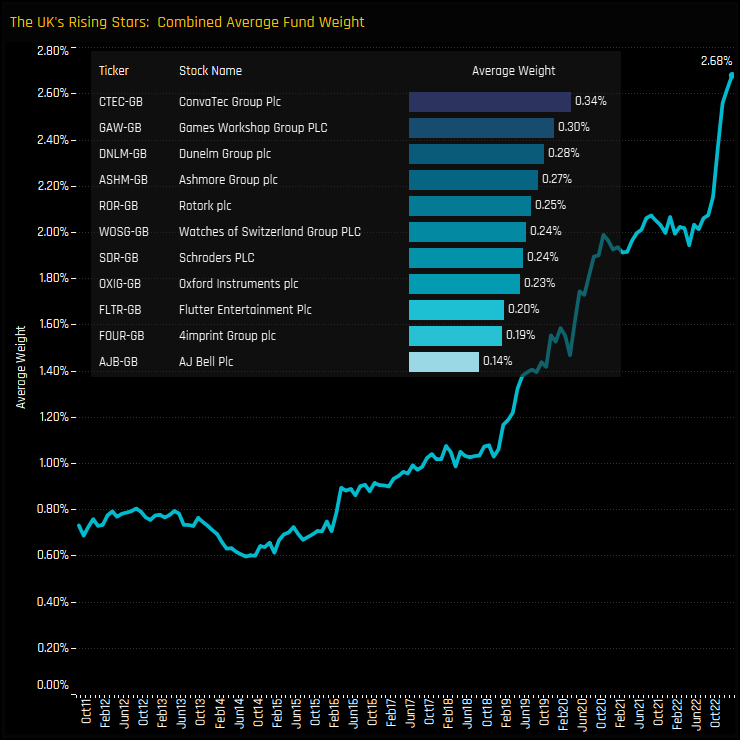
Conclusions & Data Reports
On an average fund weight basis, these 11 stocks have accelerated to a combined record weight of 2.68% as at the end of last month. Whilst impressive, this is still small compared to the UK’s largest stock holdings. For example, the average holding weight for the 11 most widely held stocks in our UK analysis is 24.1%. Our UK Rising Stars are in their ownership infancy, but clearly have a big potential upside. Click below for fund profiles on all 8 stocks.
For more analysis, data or information on active investor positioning in your market, please get in touch with me on steven.holden@copleyfundresearch.com


