• UK Real Estate Hots Up: Record number of UK funds now exposed to Real Estate sector.
• UK Stock Radar: Natwest and Serco among 10 stocks at the extreme ends of their positioning and momentum ranges
• Stock Activity Data. They key moves in stock positioning over the last 6-months
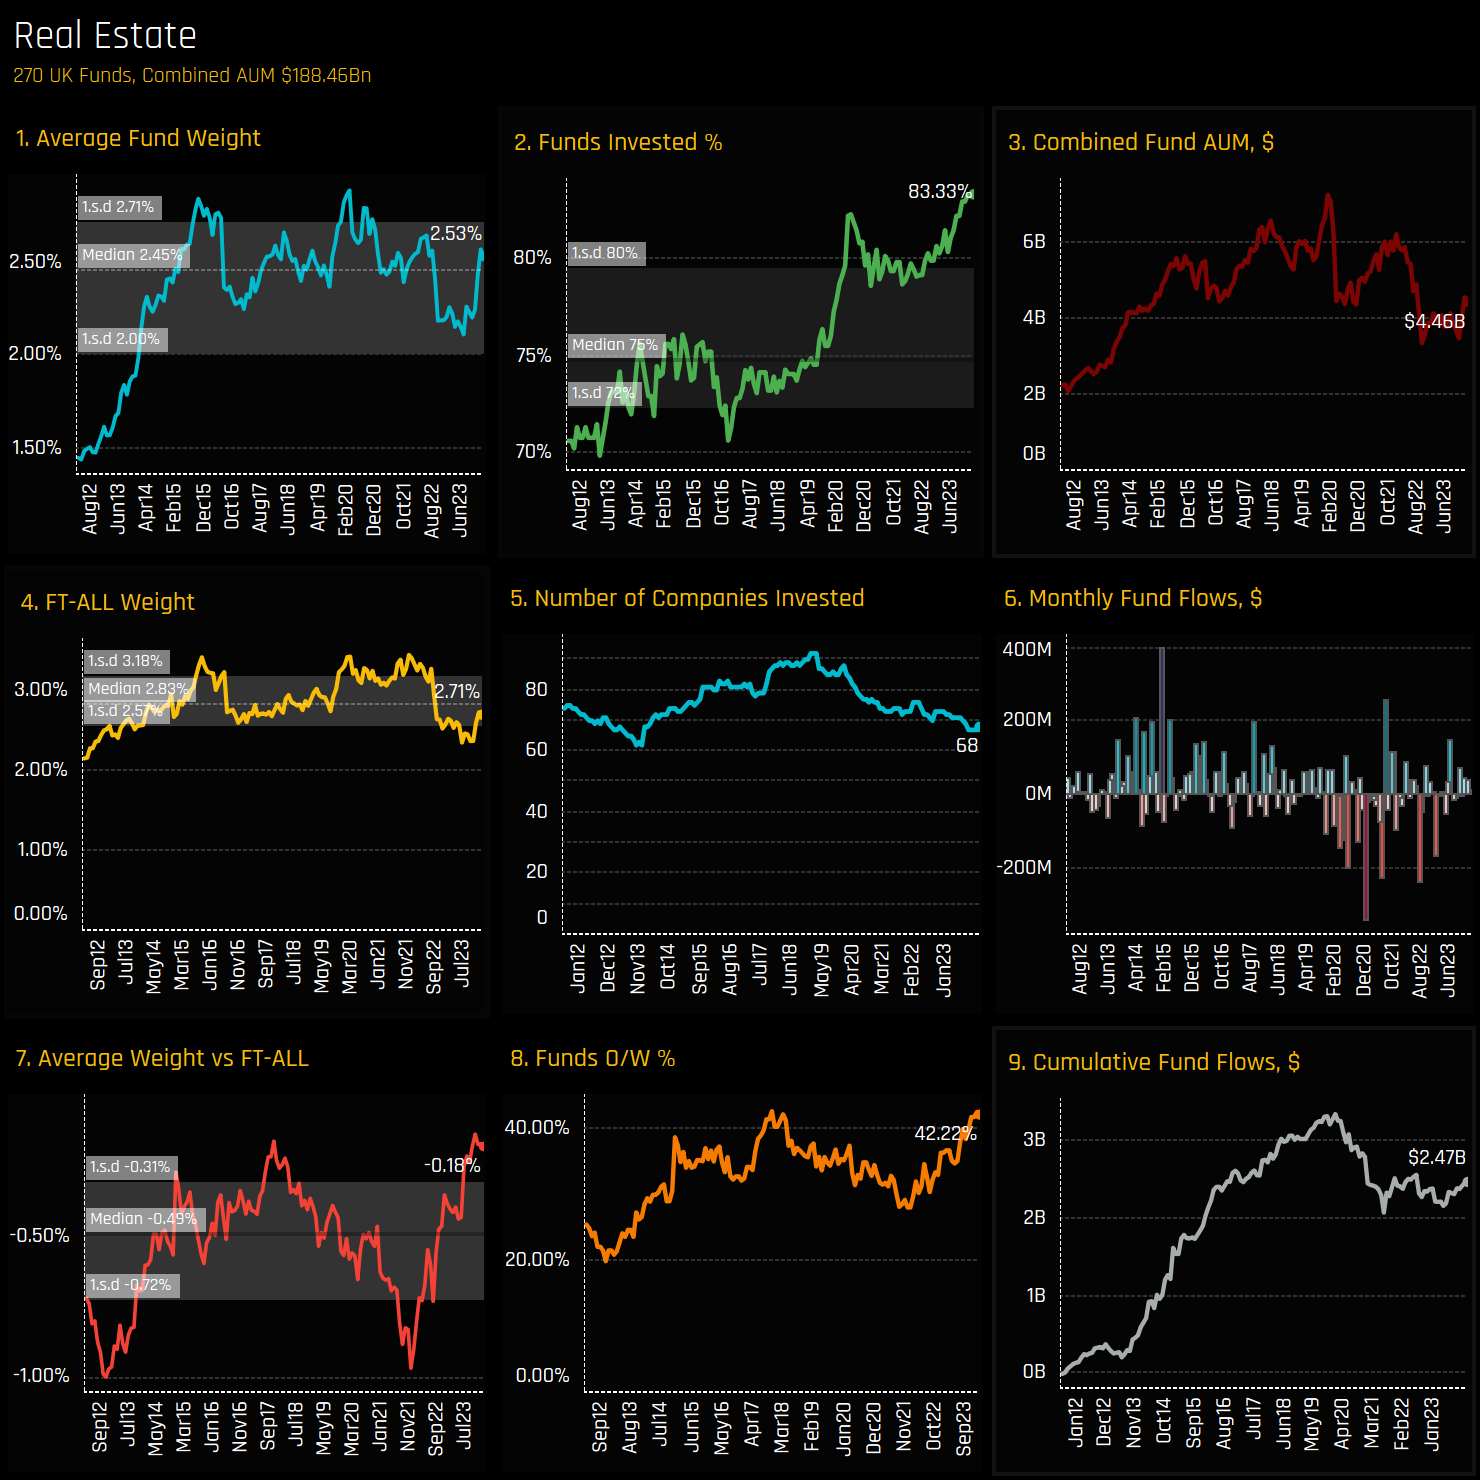
270 UK Equity Funds, AUM $190bn
UK Real Estate Hots Up
• Record number of UK funds now exposed to Real Estate sector.
• CT, BlackRock and Quilter among funds adding to exposure since mid 2023.
• SEGRO and Land Securities the key holdings and the drivers behind the recent rotation
Time-Series Analysis
The percentage of UK equity funds invested in the Real Estate sector has hit an all-time high this month. As chart 2 below shows, a record 83.3% of the 270 UK funds in our analysis now own a position in the Real Estate sector, pushing average weights higher at a faster pace than the FTSE All Share index in recent months (ch1&4). As such, the net underweight has tightened from -1% to just -0.18%, with a record 42.2% of funds positioned overweight the benchmark index.
Sector Activity
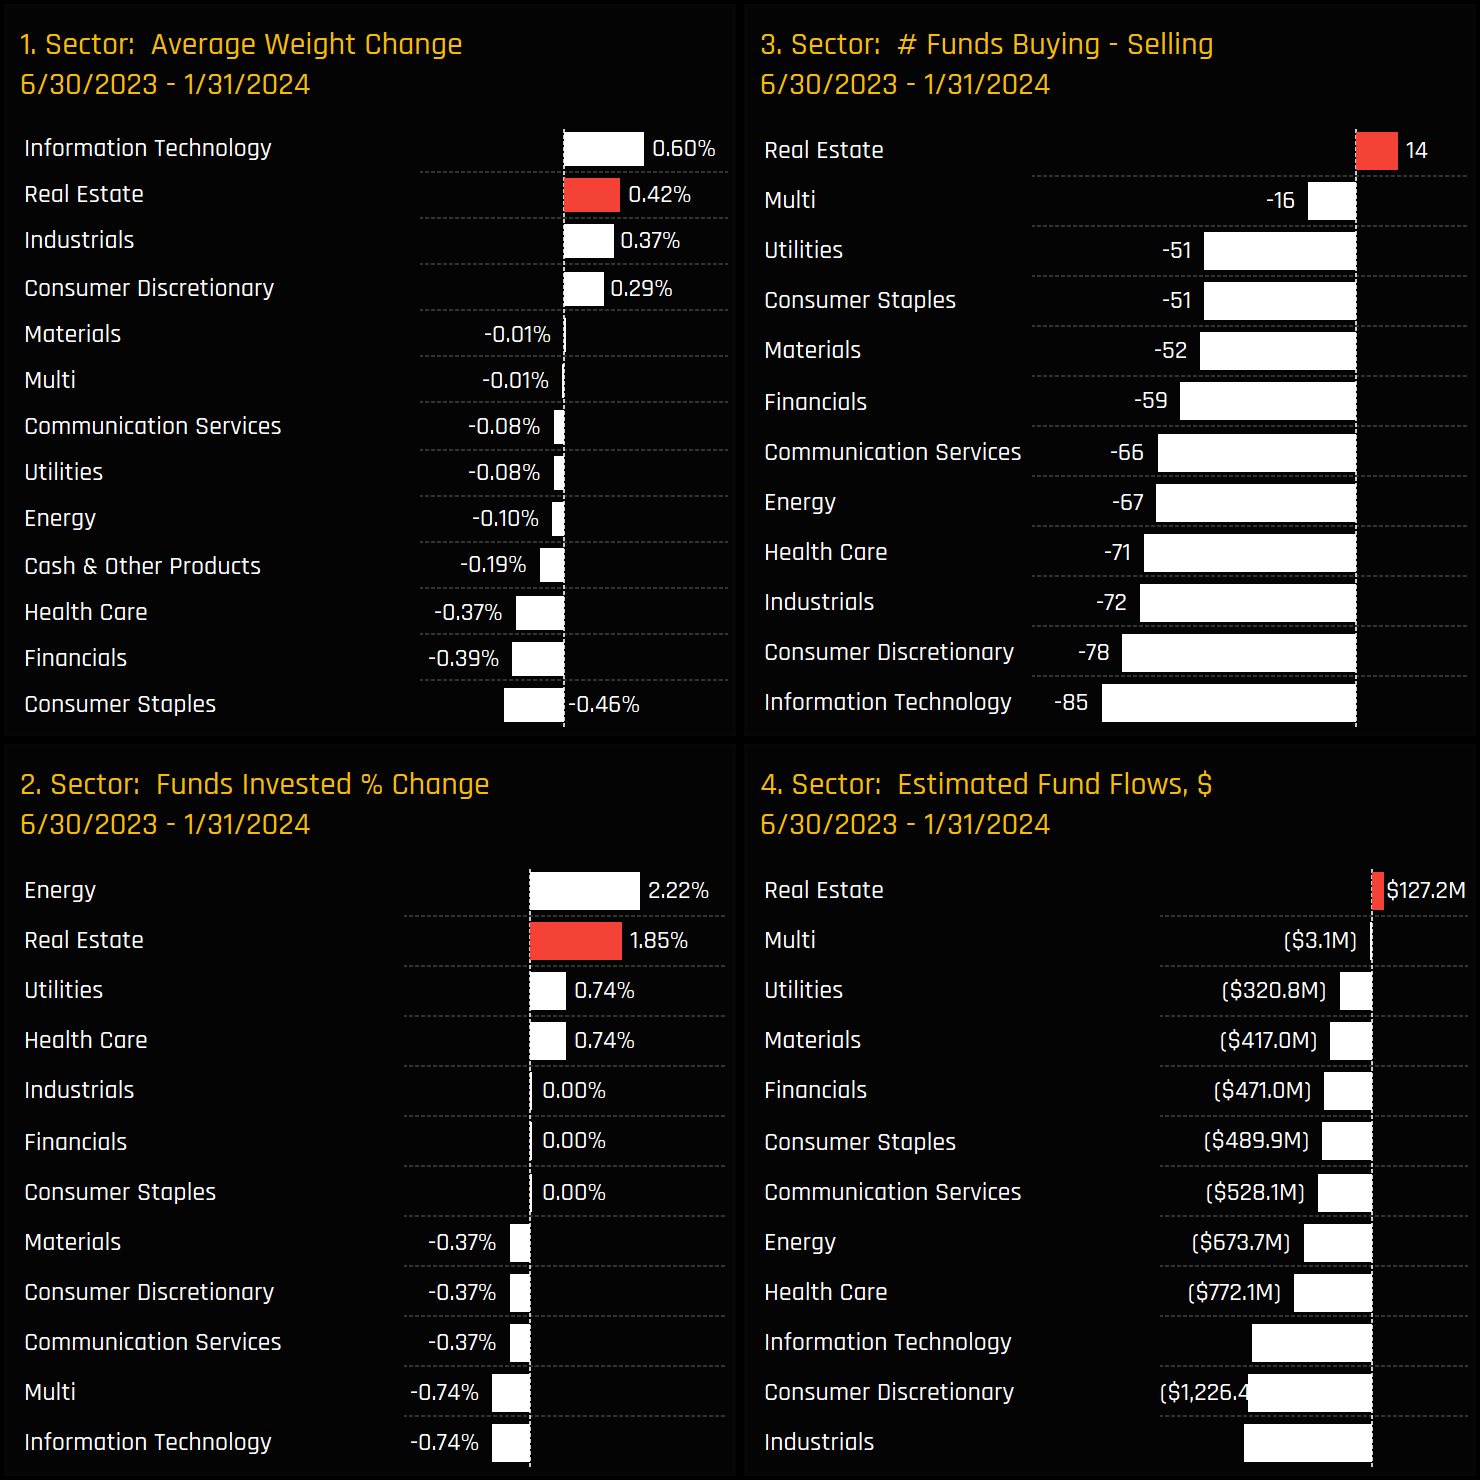
The charts below show the changes in sector exposure and ownership between the recent lows of 6/30/2023 and 01/31/2024. Real Estate emerged as a major beneficiary over the period, securing the second-largest increase in average weight and funds invested of 0.42% and 1.85% respectively. It was the only sector to see net inflows and more buyers than sellers.
Fund Level Activity
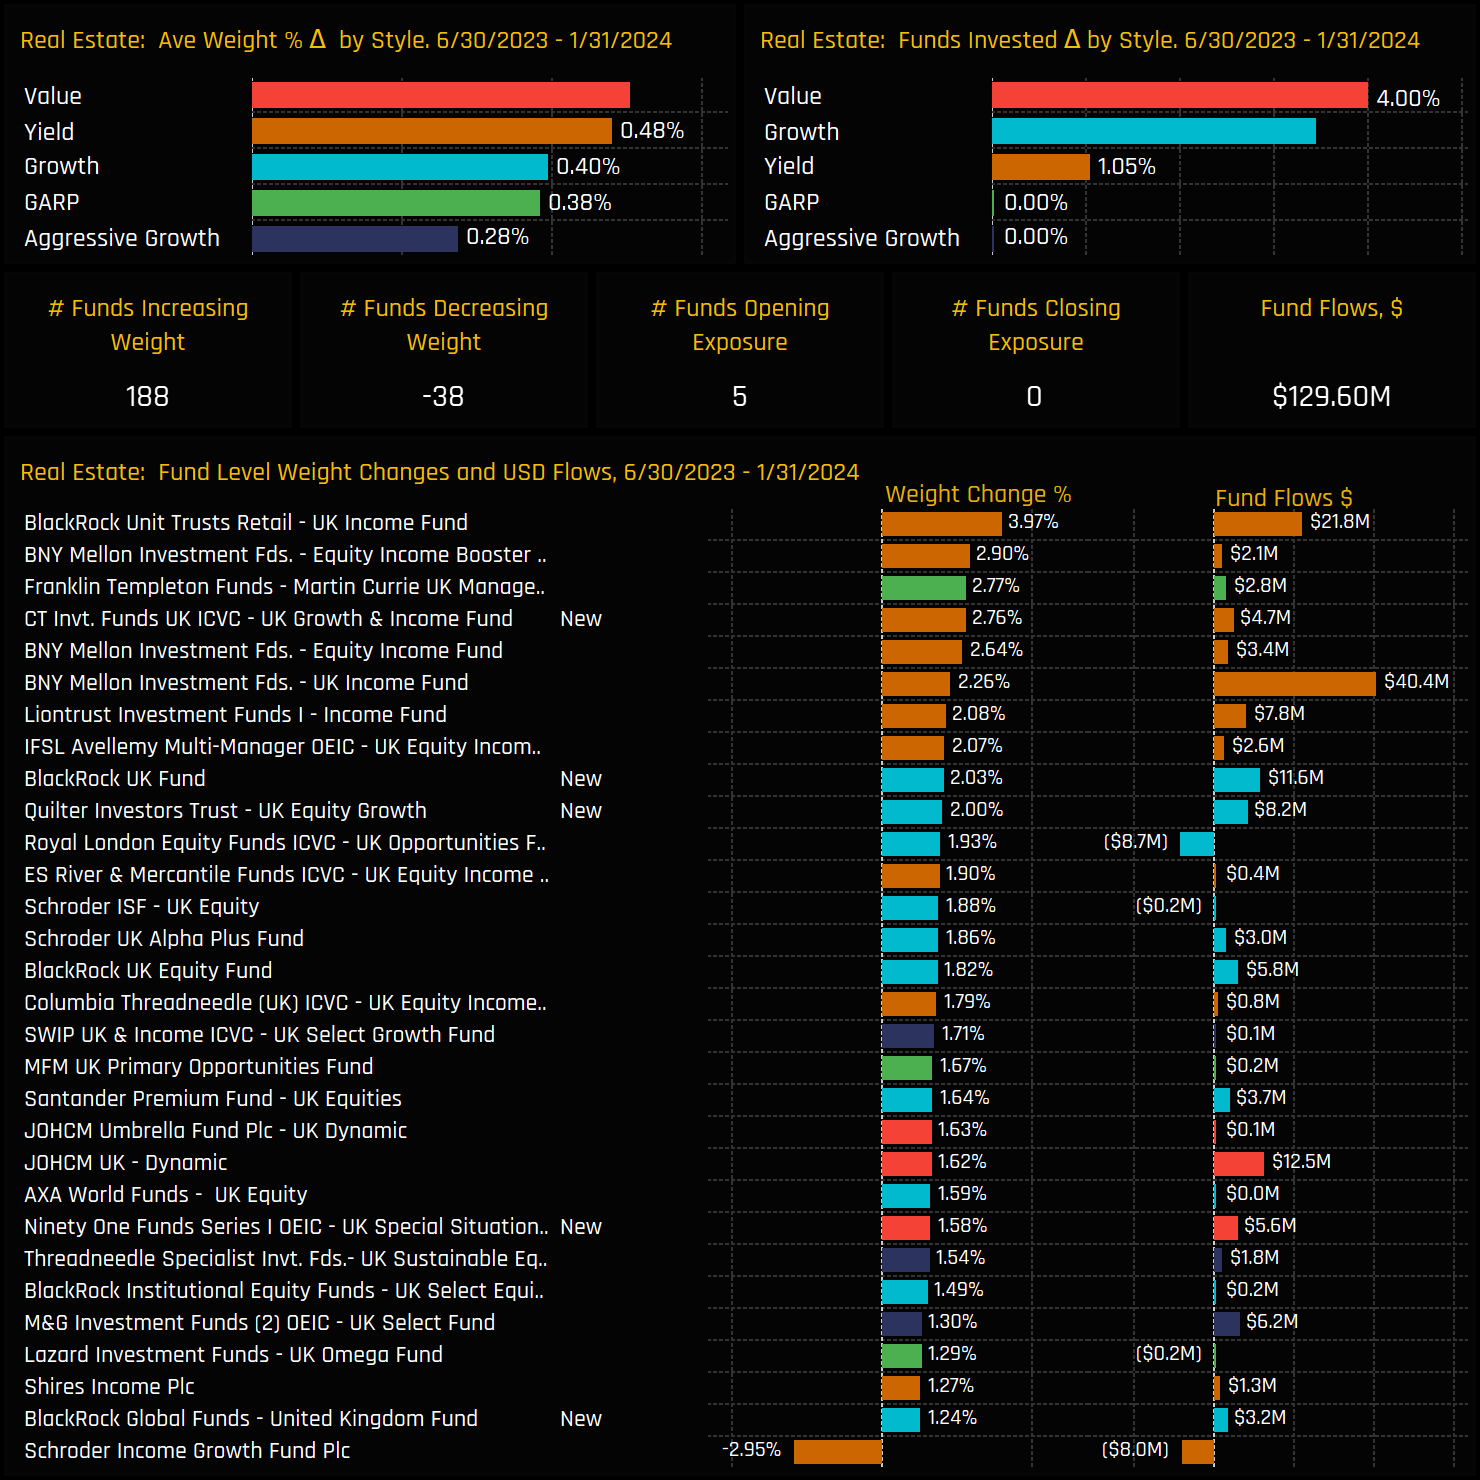
On a fund level, 188 funds increased their Real Estate holdings from 06/30/2023 to 01/31/2024, compared to 38 funds that reduced their stakes. Additionally, 5 funds opened new Real Estate positions, with no exits reported. Value and Yield funds saw the most significant increases, though Growth funds also participated.
The largest gains in Real Estate exposure were recorded by BlackRock UK Income (3.97%) and BNY Mellon UK Income (2.9%), with Yield managers making up 7 of the top 10 increases.
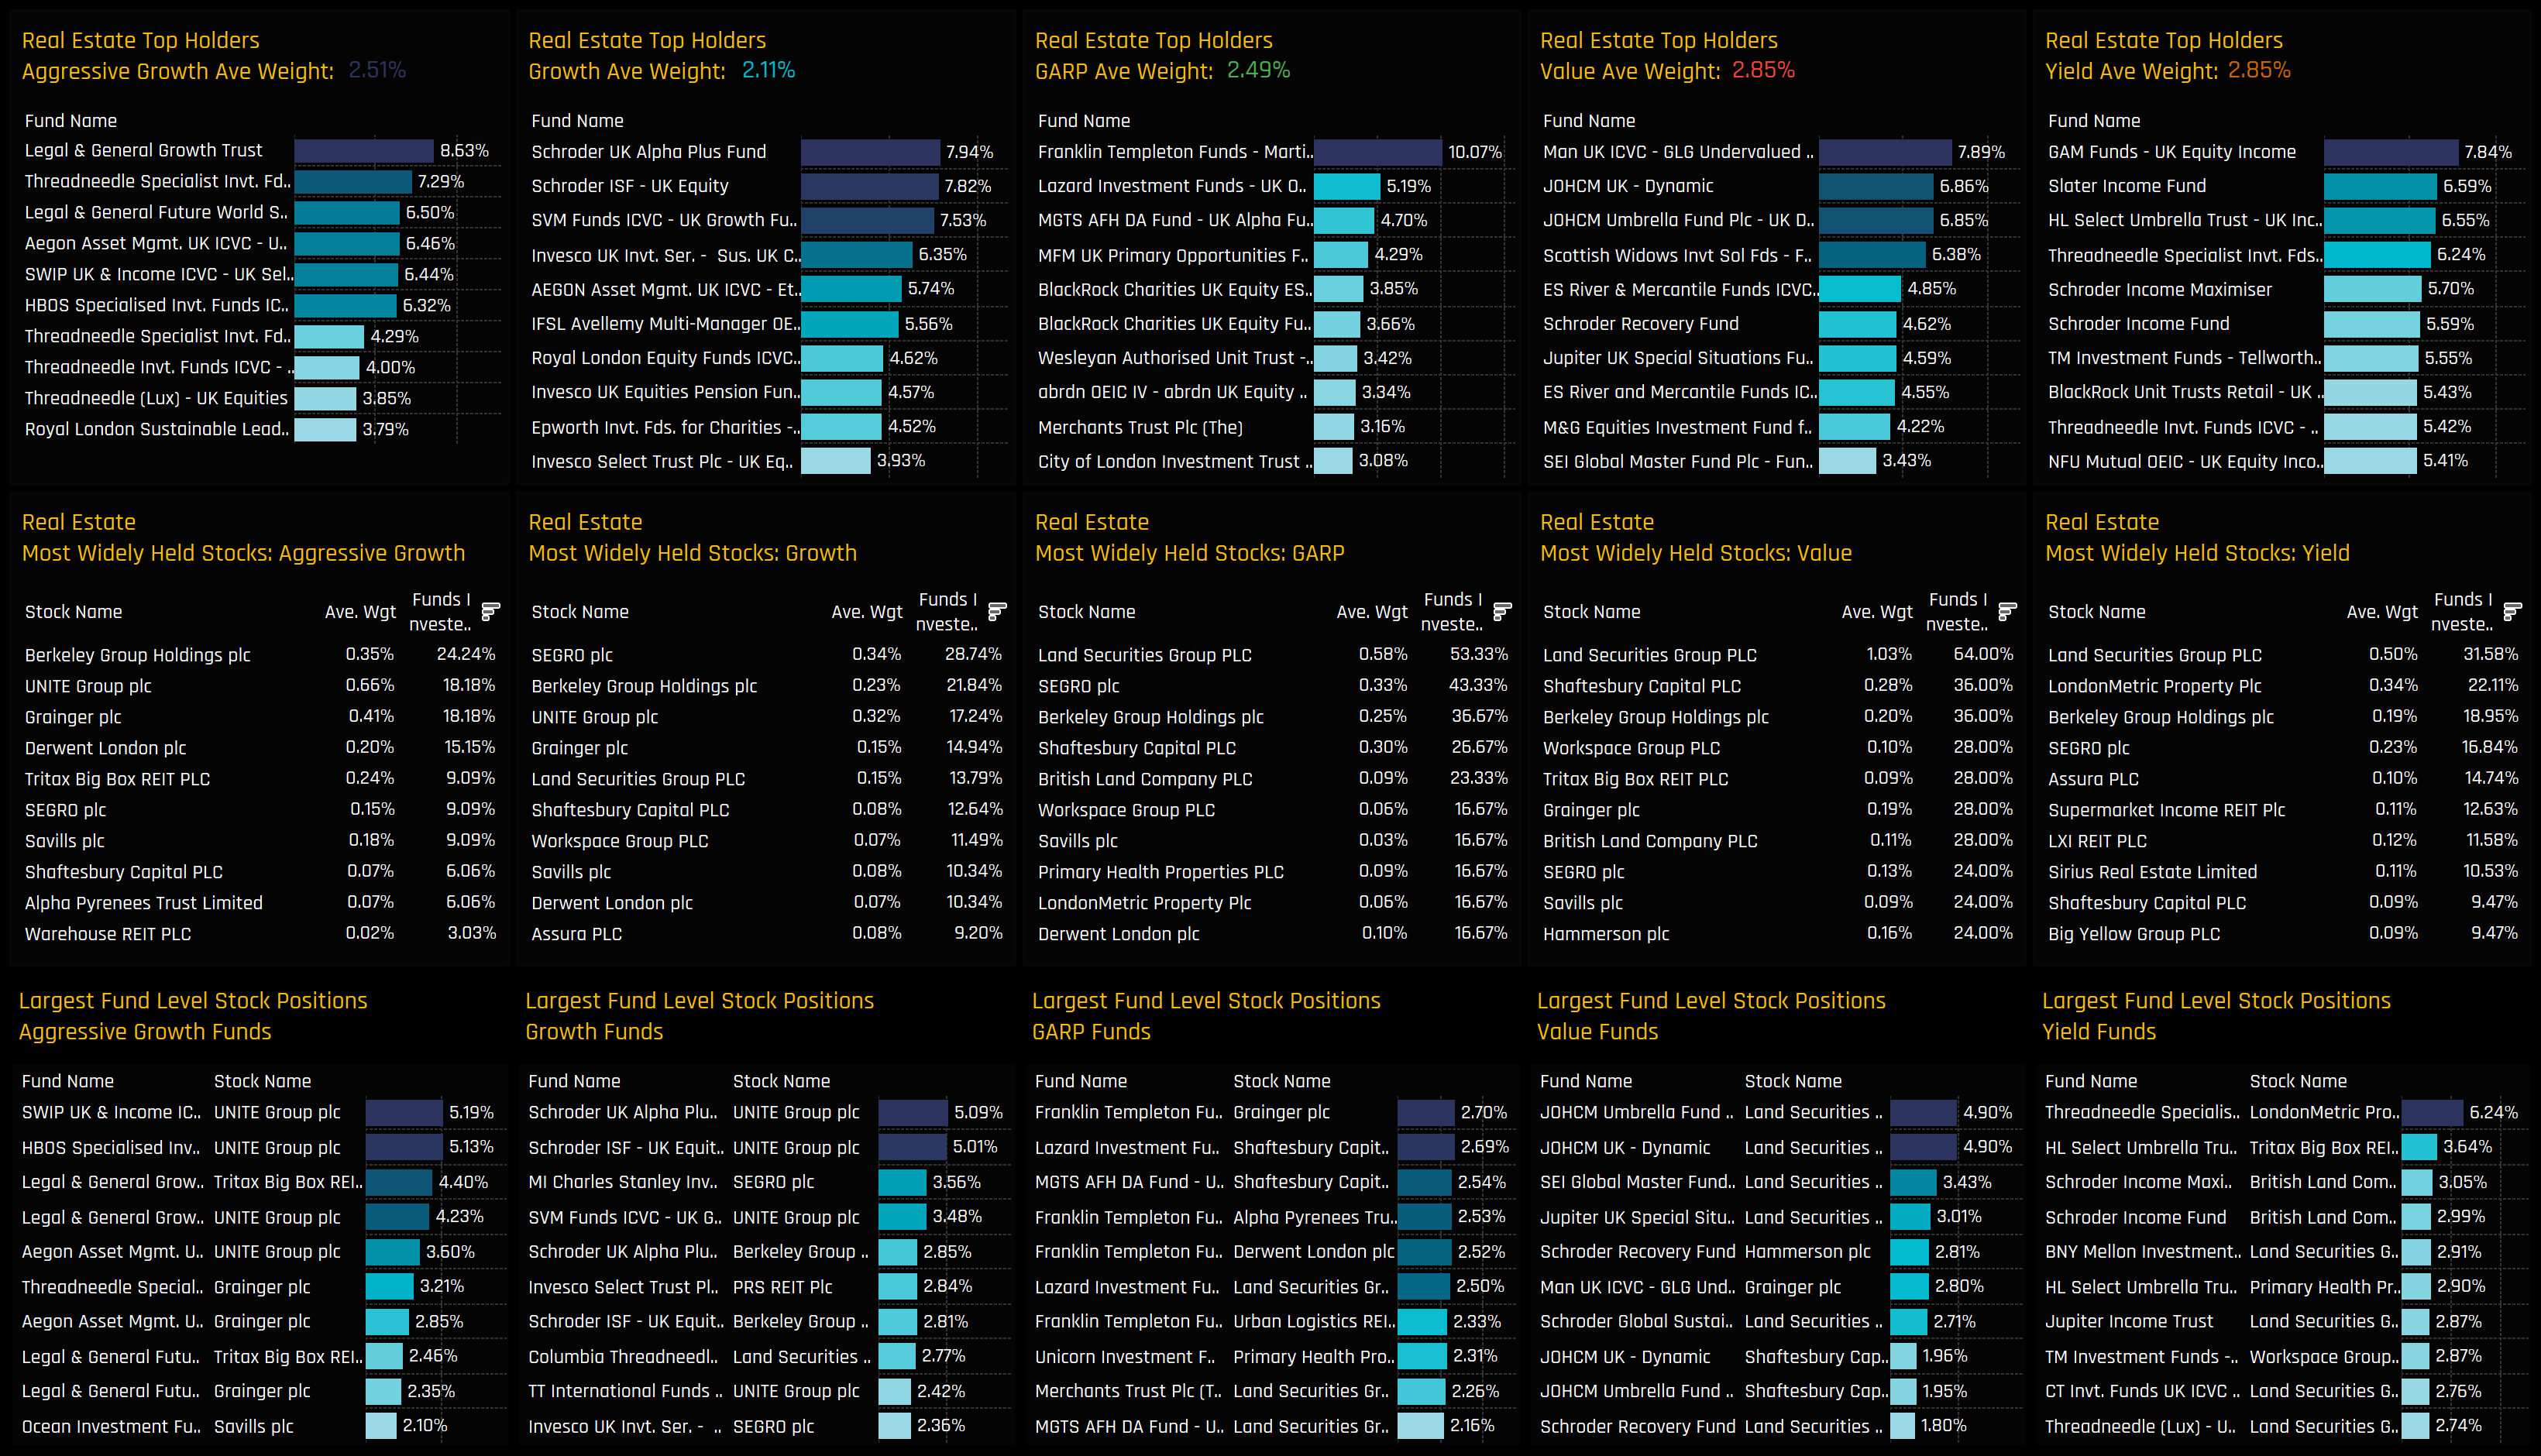
Scroll down to view the major stock holdings in the Real Estate sector, split by fund style. Click on the link below for a more granular look at Real Estate positioning among UK active equity funds.
• Investment levels vary significantly across the UK investible universe, with some stocks being widely held while others are scarcely owned, and these ownership levels fluctuate monthly.
• Our analysis synthesizes current and historical data on fund positioning with recent manager activity to accurately assess sentiment for each stock within our UK coverage.
• We spotlight 10 stocks that not only sit at the extreme ends of their historical position ranges, but have also experienced notable shifts in fund ownership in recent months.
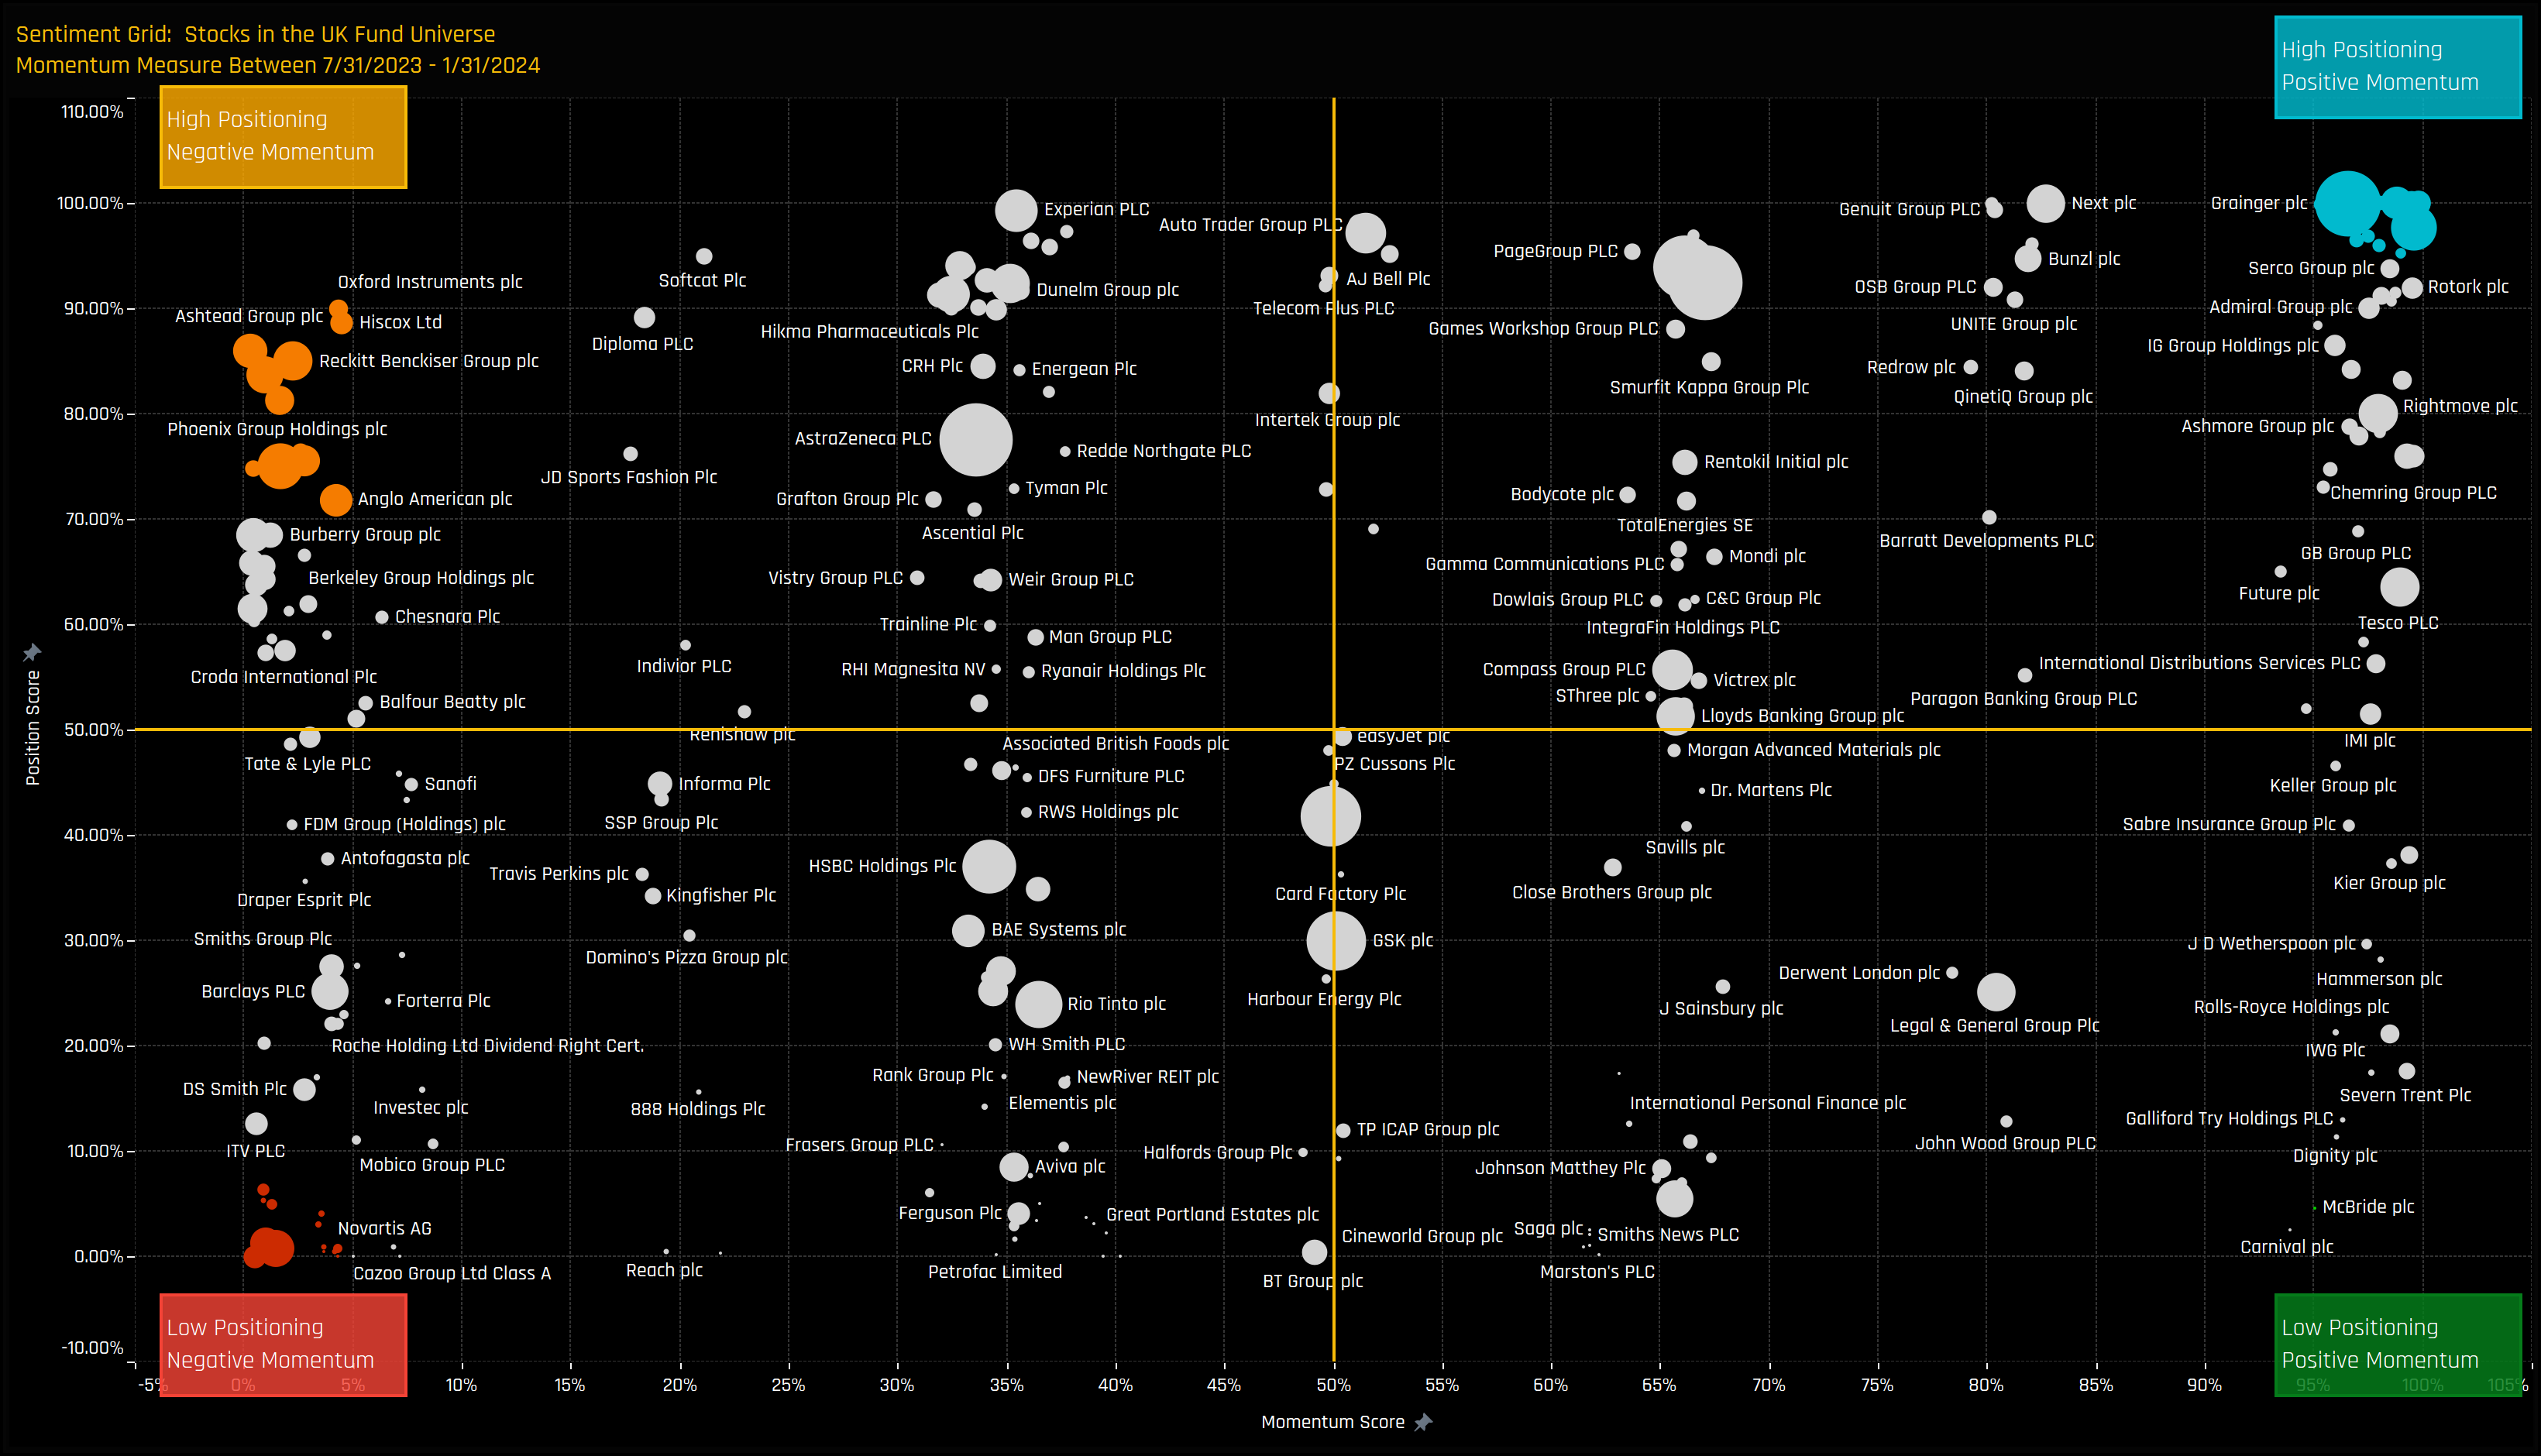
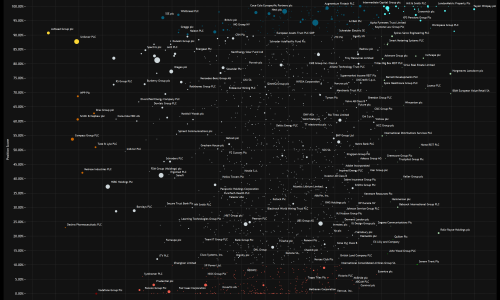
Stock Sentiment
The Sentiment Grid below is designed to visualize the interplay between current fund positioning, long-term fund positioning and shorter-term fund manager activity for all stocks in the UK fund active universe. The Y-axis shows the ‘Position Score’, a measure of current positioning in each stock compared to its own history going back to 2012 on a scale of 0-100%. It takes in to account the percentage of funds invested in each stock versus history, the average fund weight versus history and the percentage of funds overweight the benchmark versus history. The higher the number, the more heavily a stock is owned by active UK managers compared to its own history.
The X-Axis shows the ‘Momentum Score’, a measure of fund manager activity for each stock between 07/31/2023 and 1/31/2024 on a scale of 0% (maximum negative activity) to 100% (maximum positive activity). The Momentum Score takes in to account the change in the percentage of funds invested in each stock over the period, the change in average weight and the change in the percentage of funds overweight. The chart also highlights the companies at the extreme ends of each quadrant by colour, which will shall explore in more detail below.
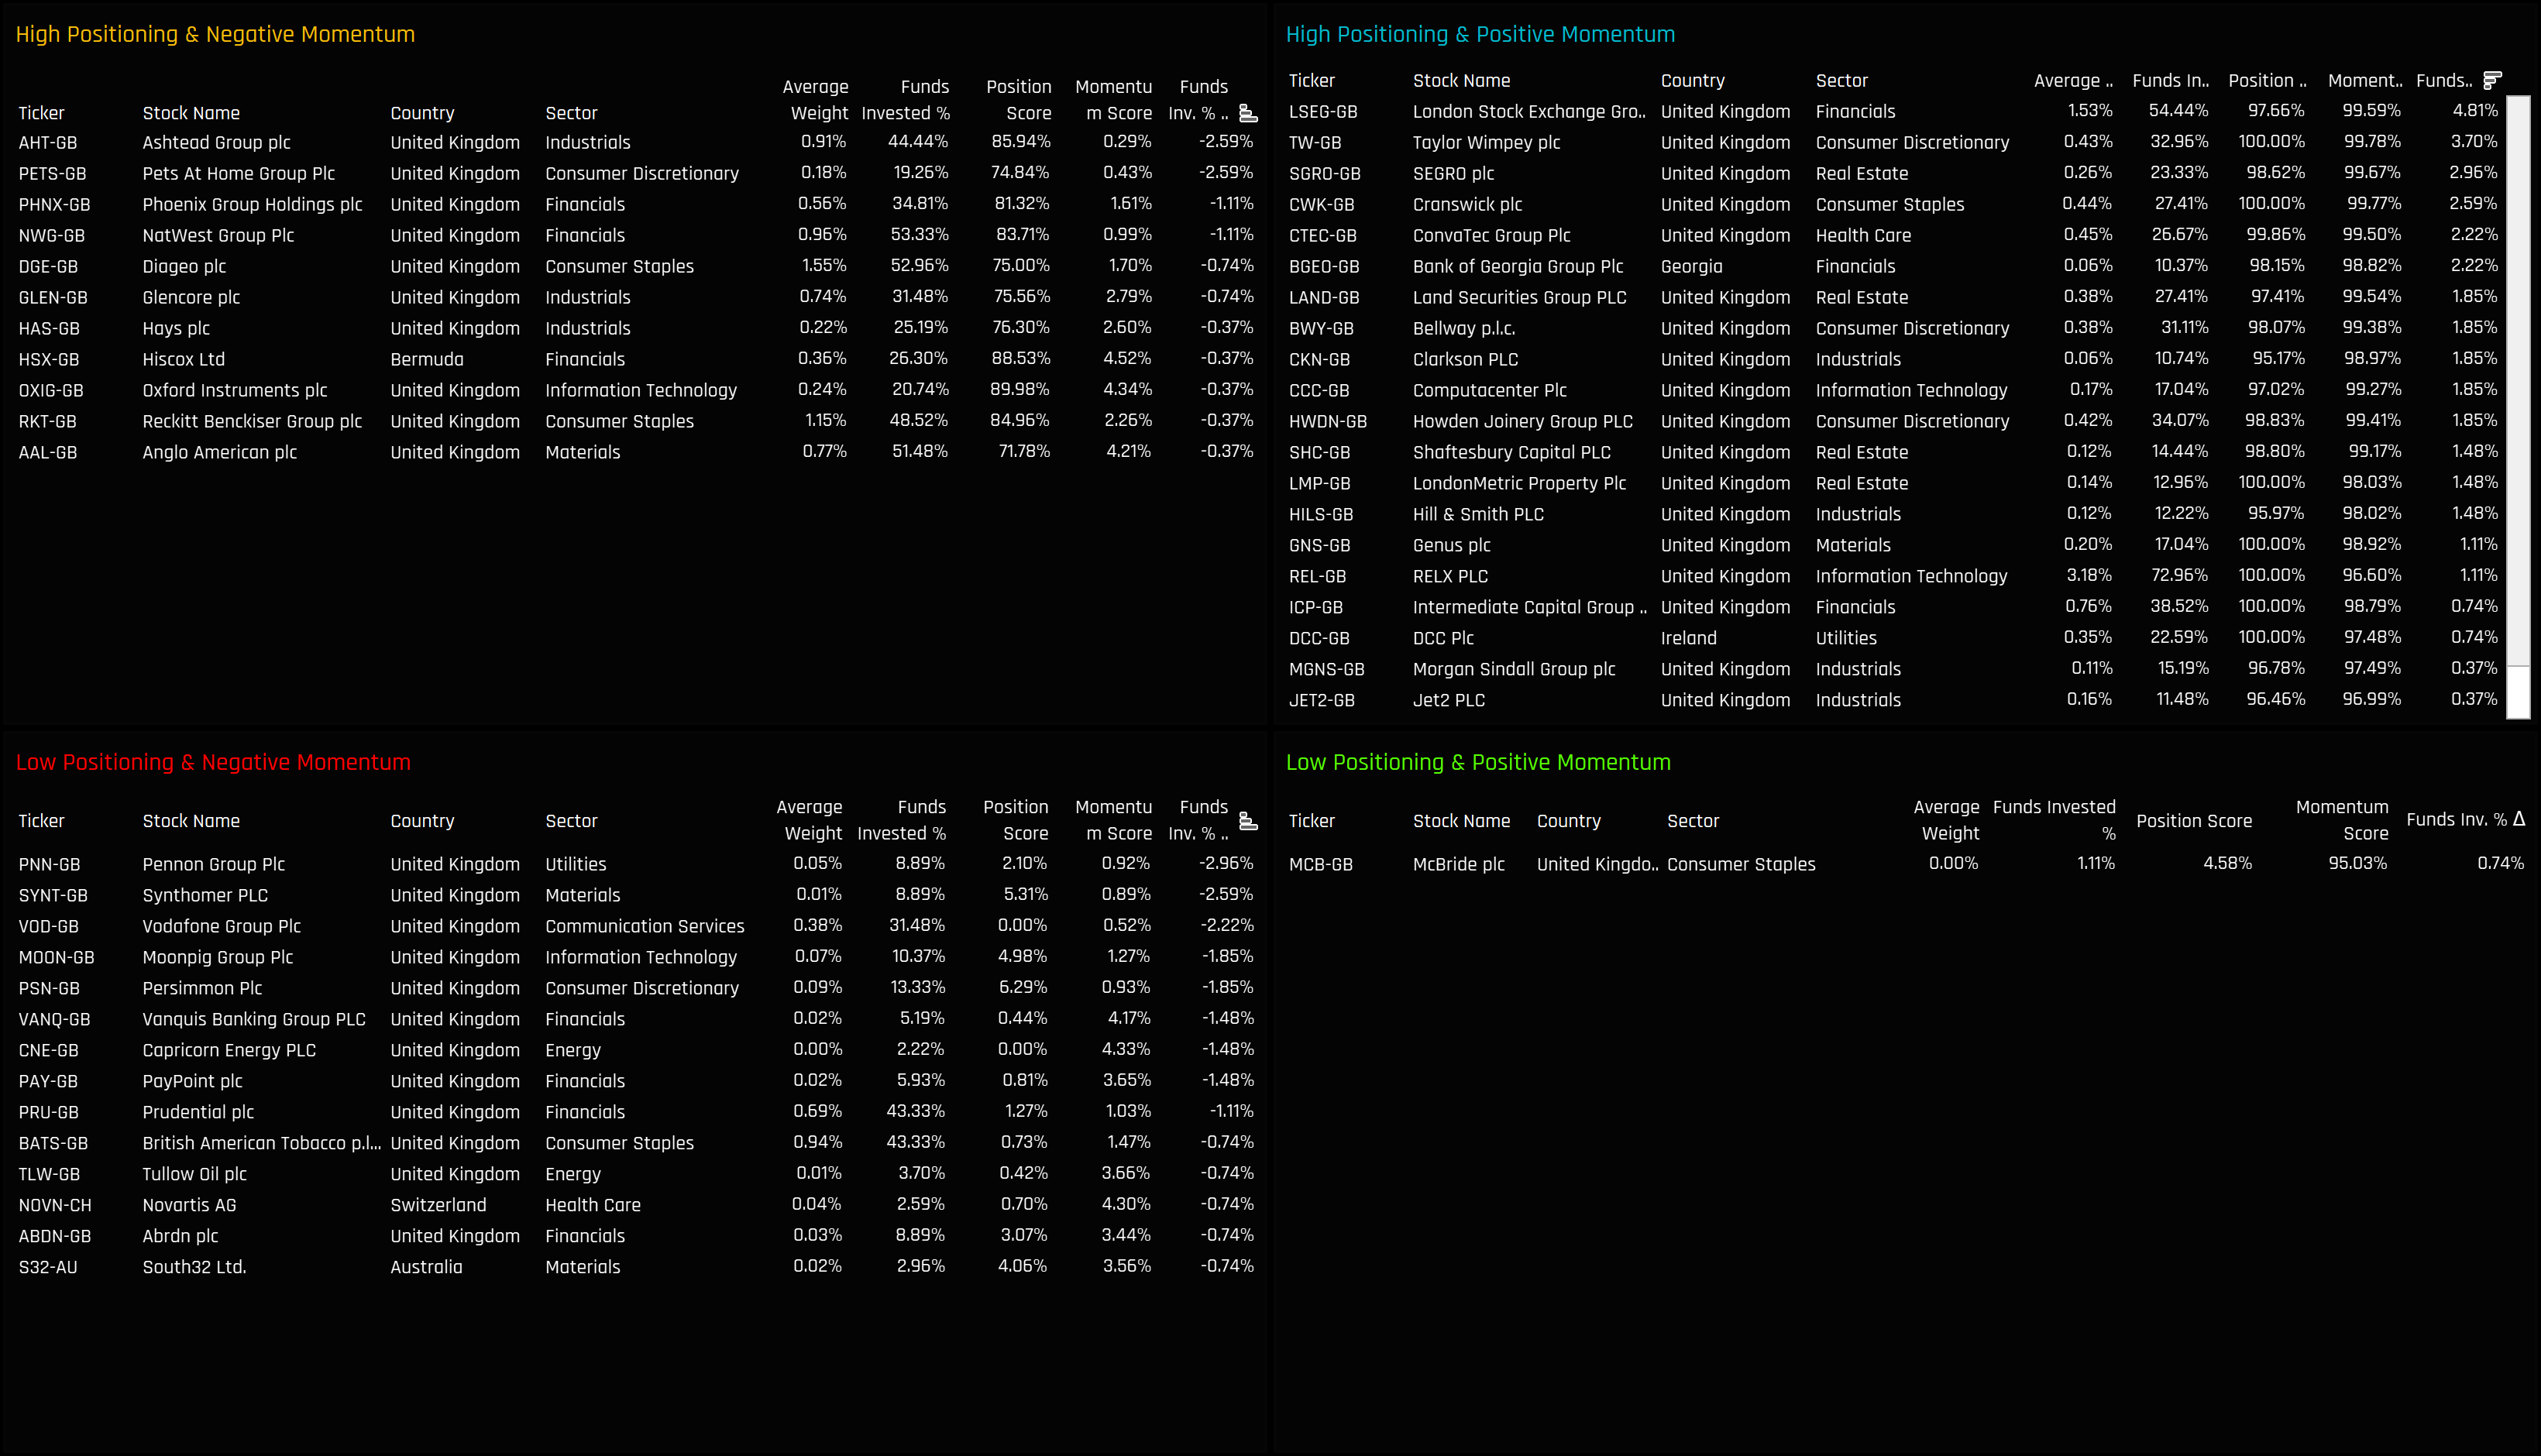
Extreme Stocks
The tables below list the stocks in the extreme corners of each quadrant. The screening methodology is as follows:
High Positioning & Negative Momentum: Position Score > 70%. Momentum Score < 5%
High Positioning & Positive Momentum: Position Score > 95%. Momentum Score > 95%
Extreme Stock Focus
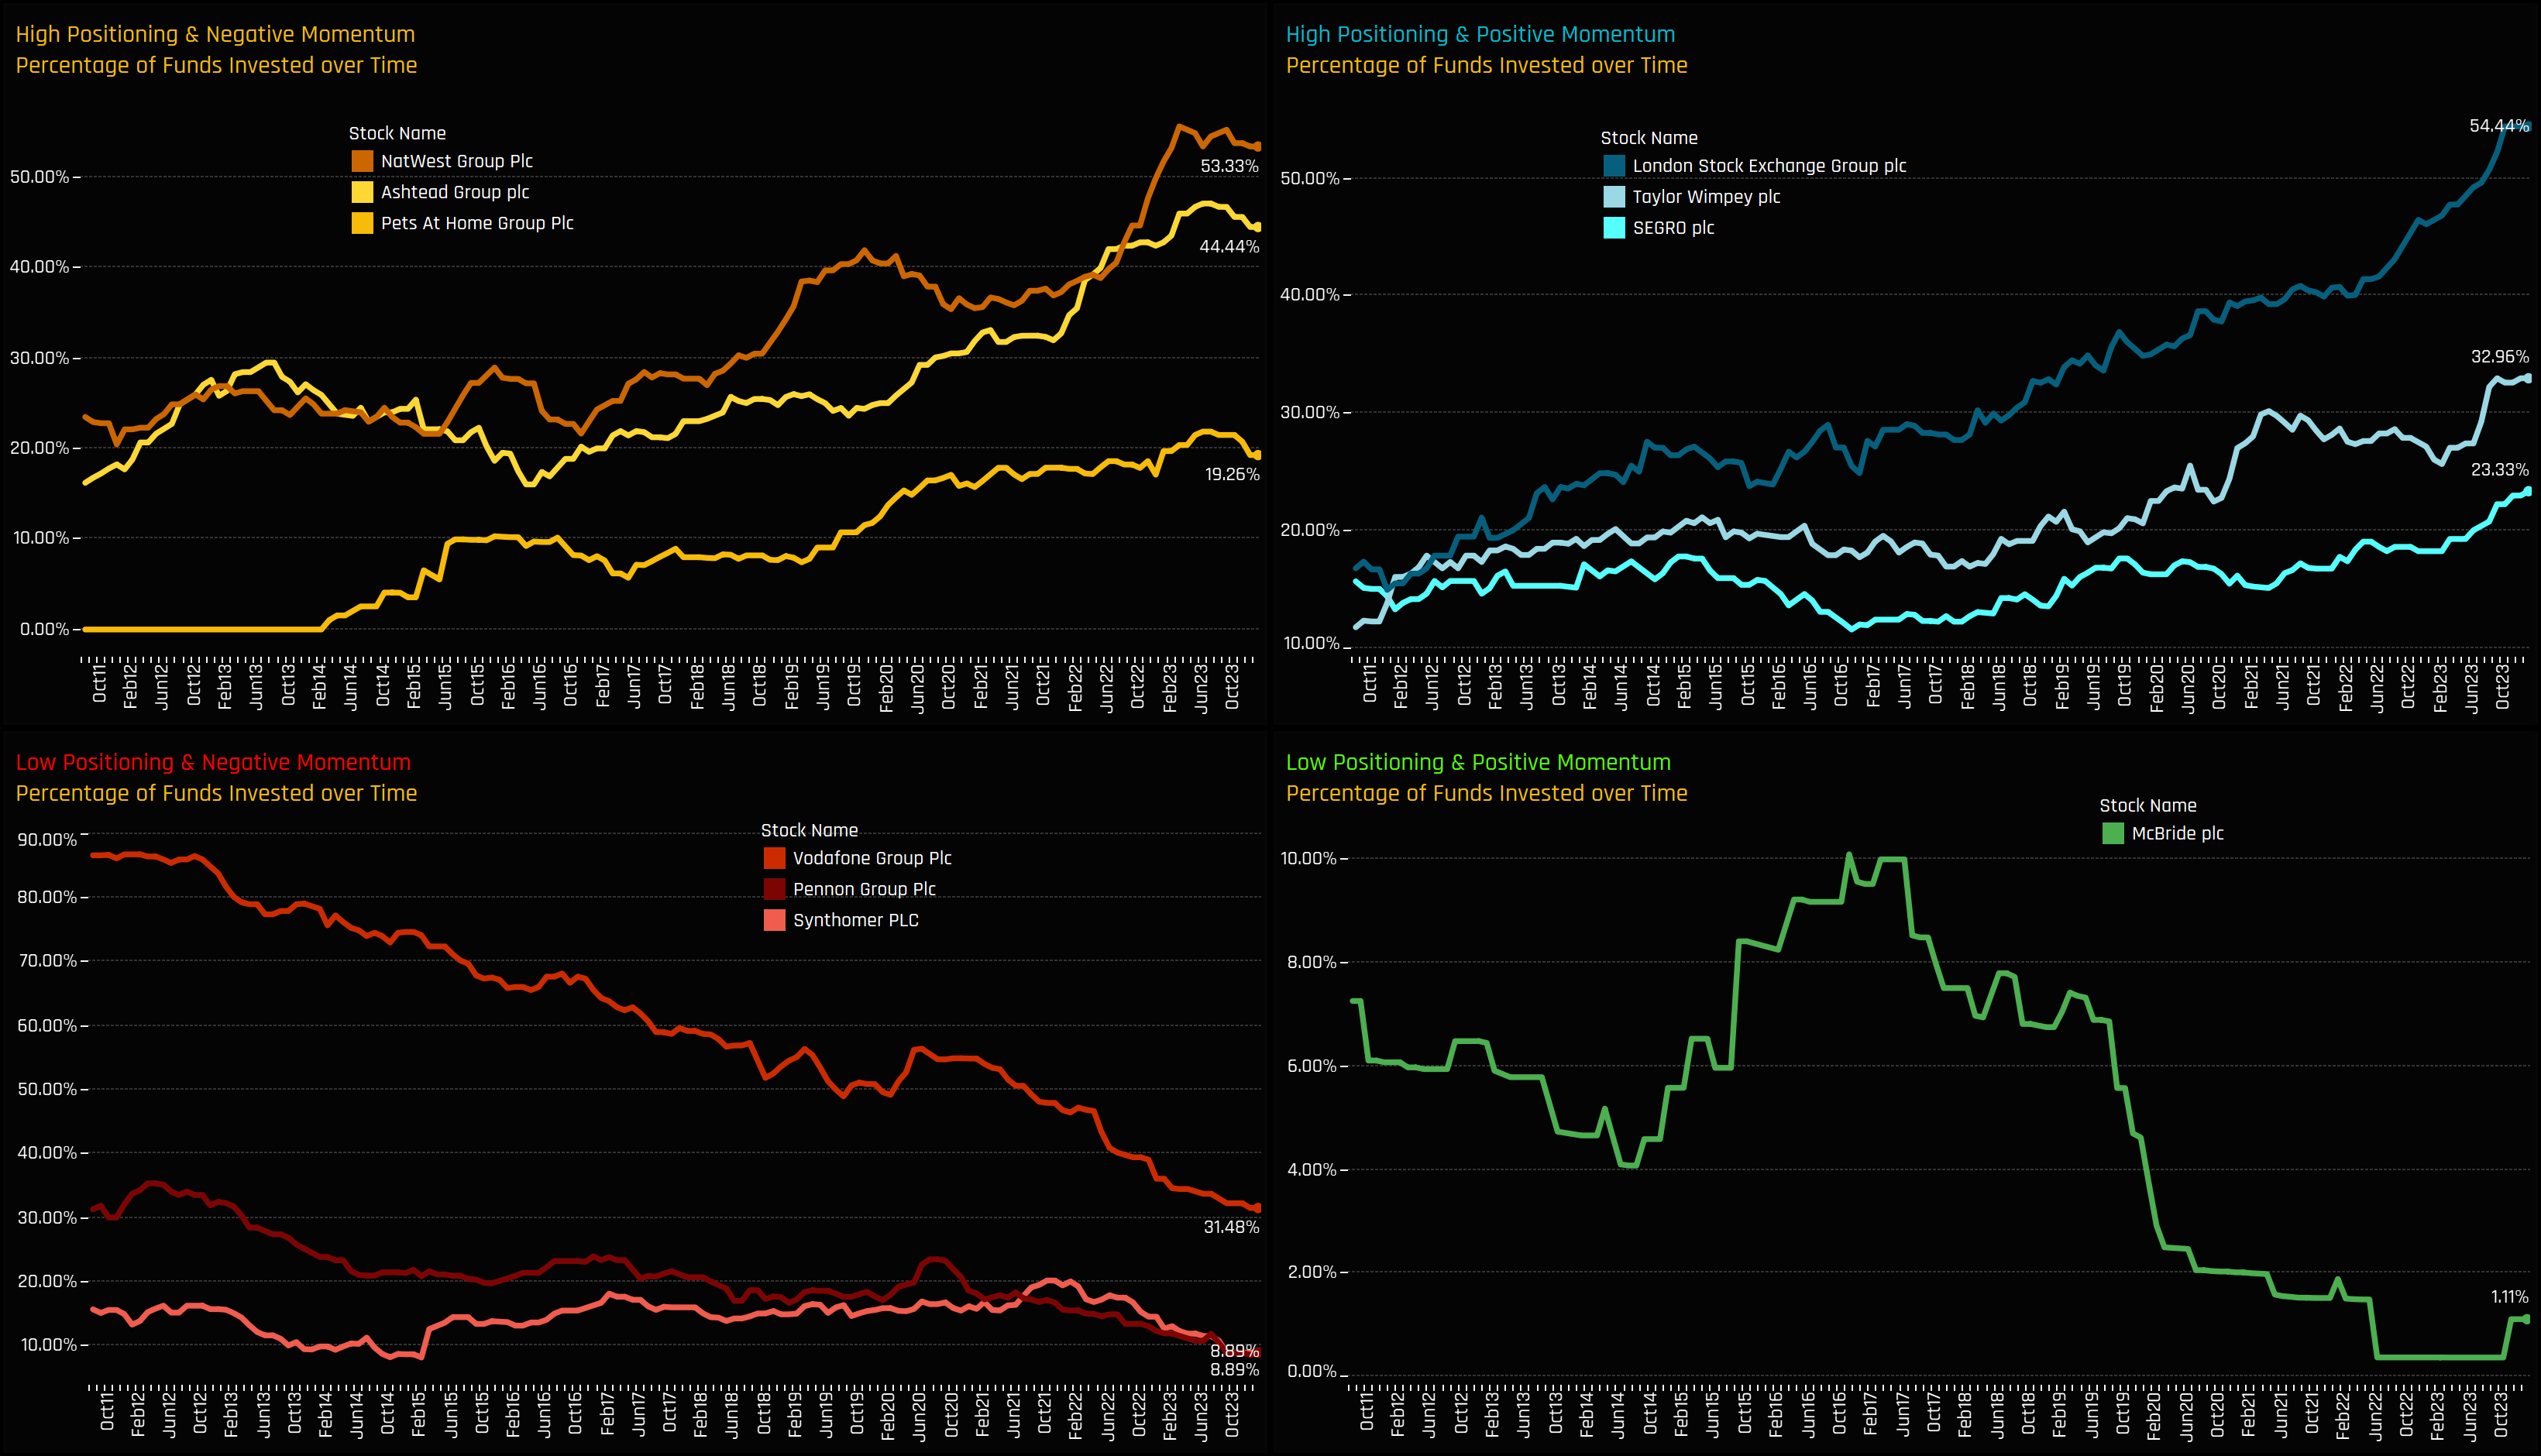
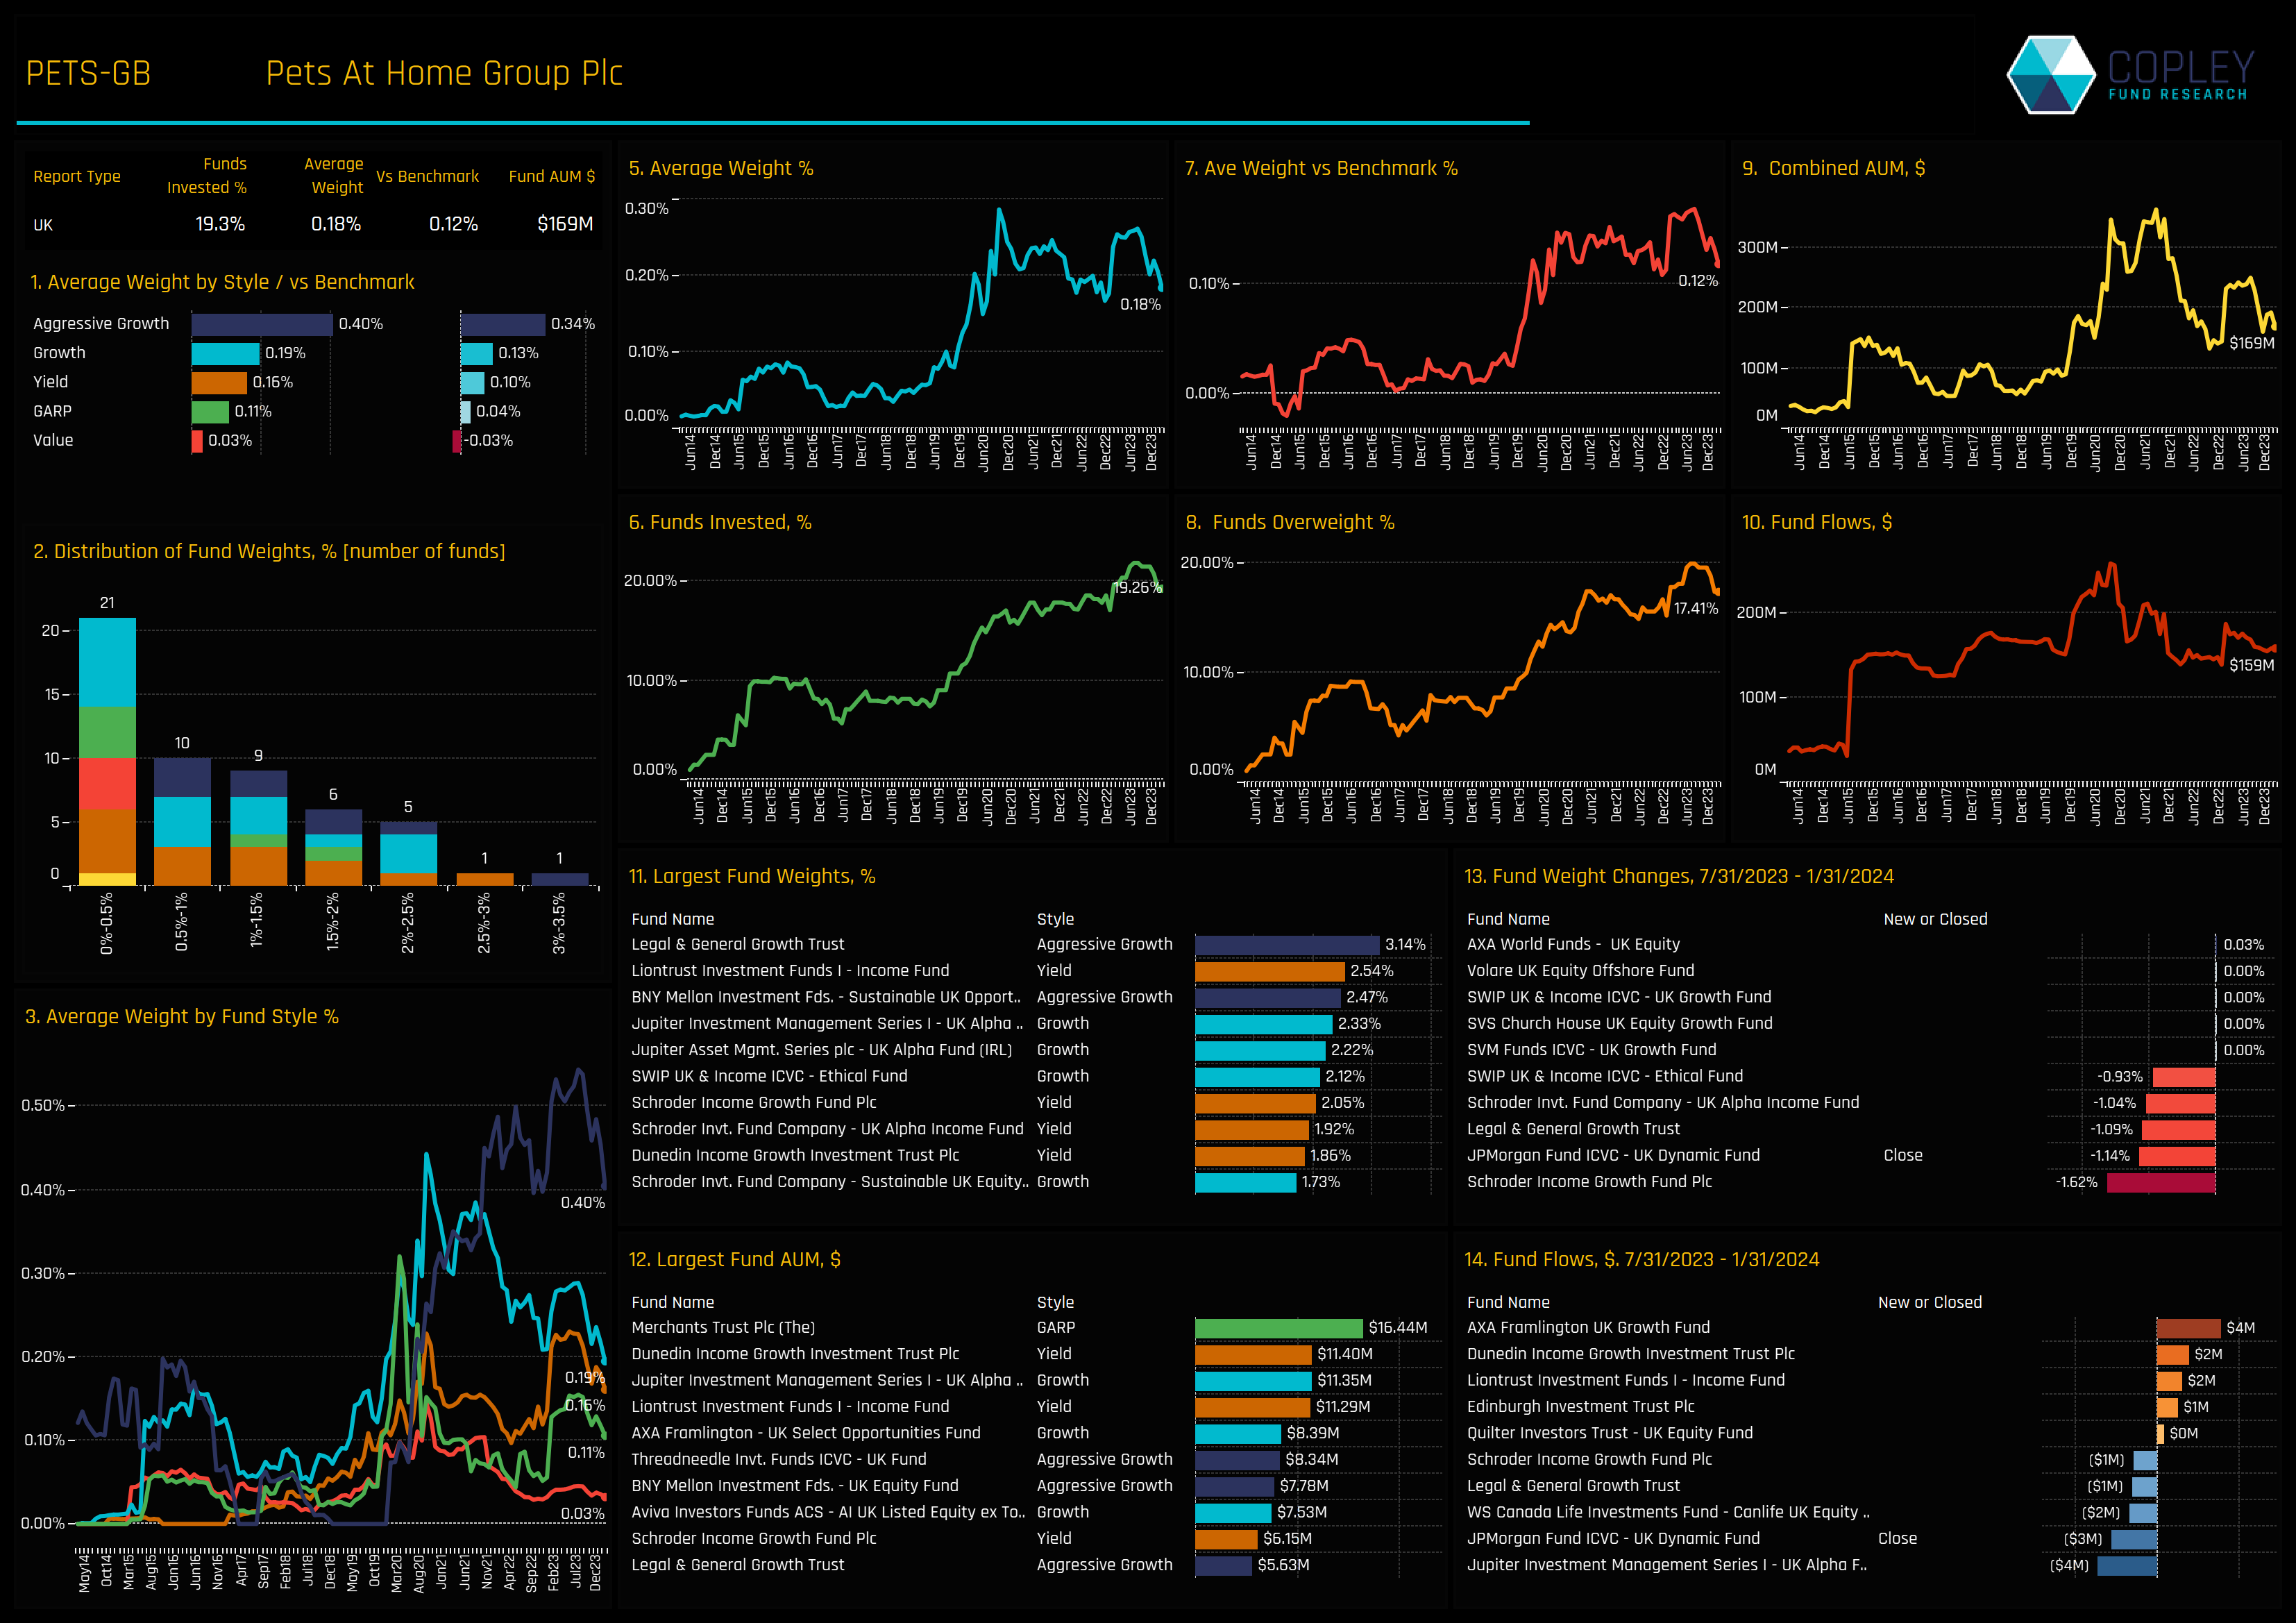
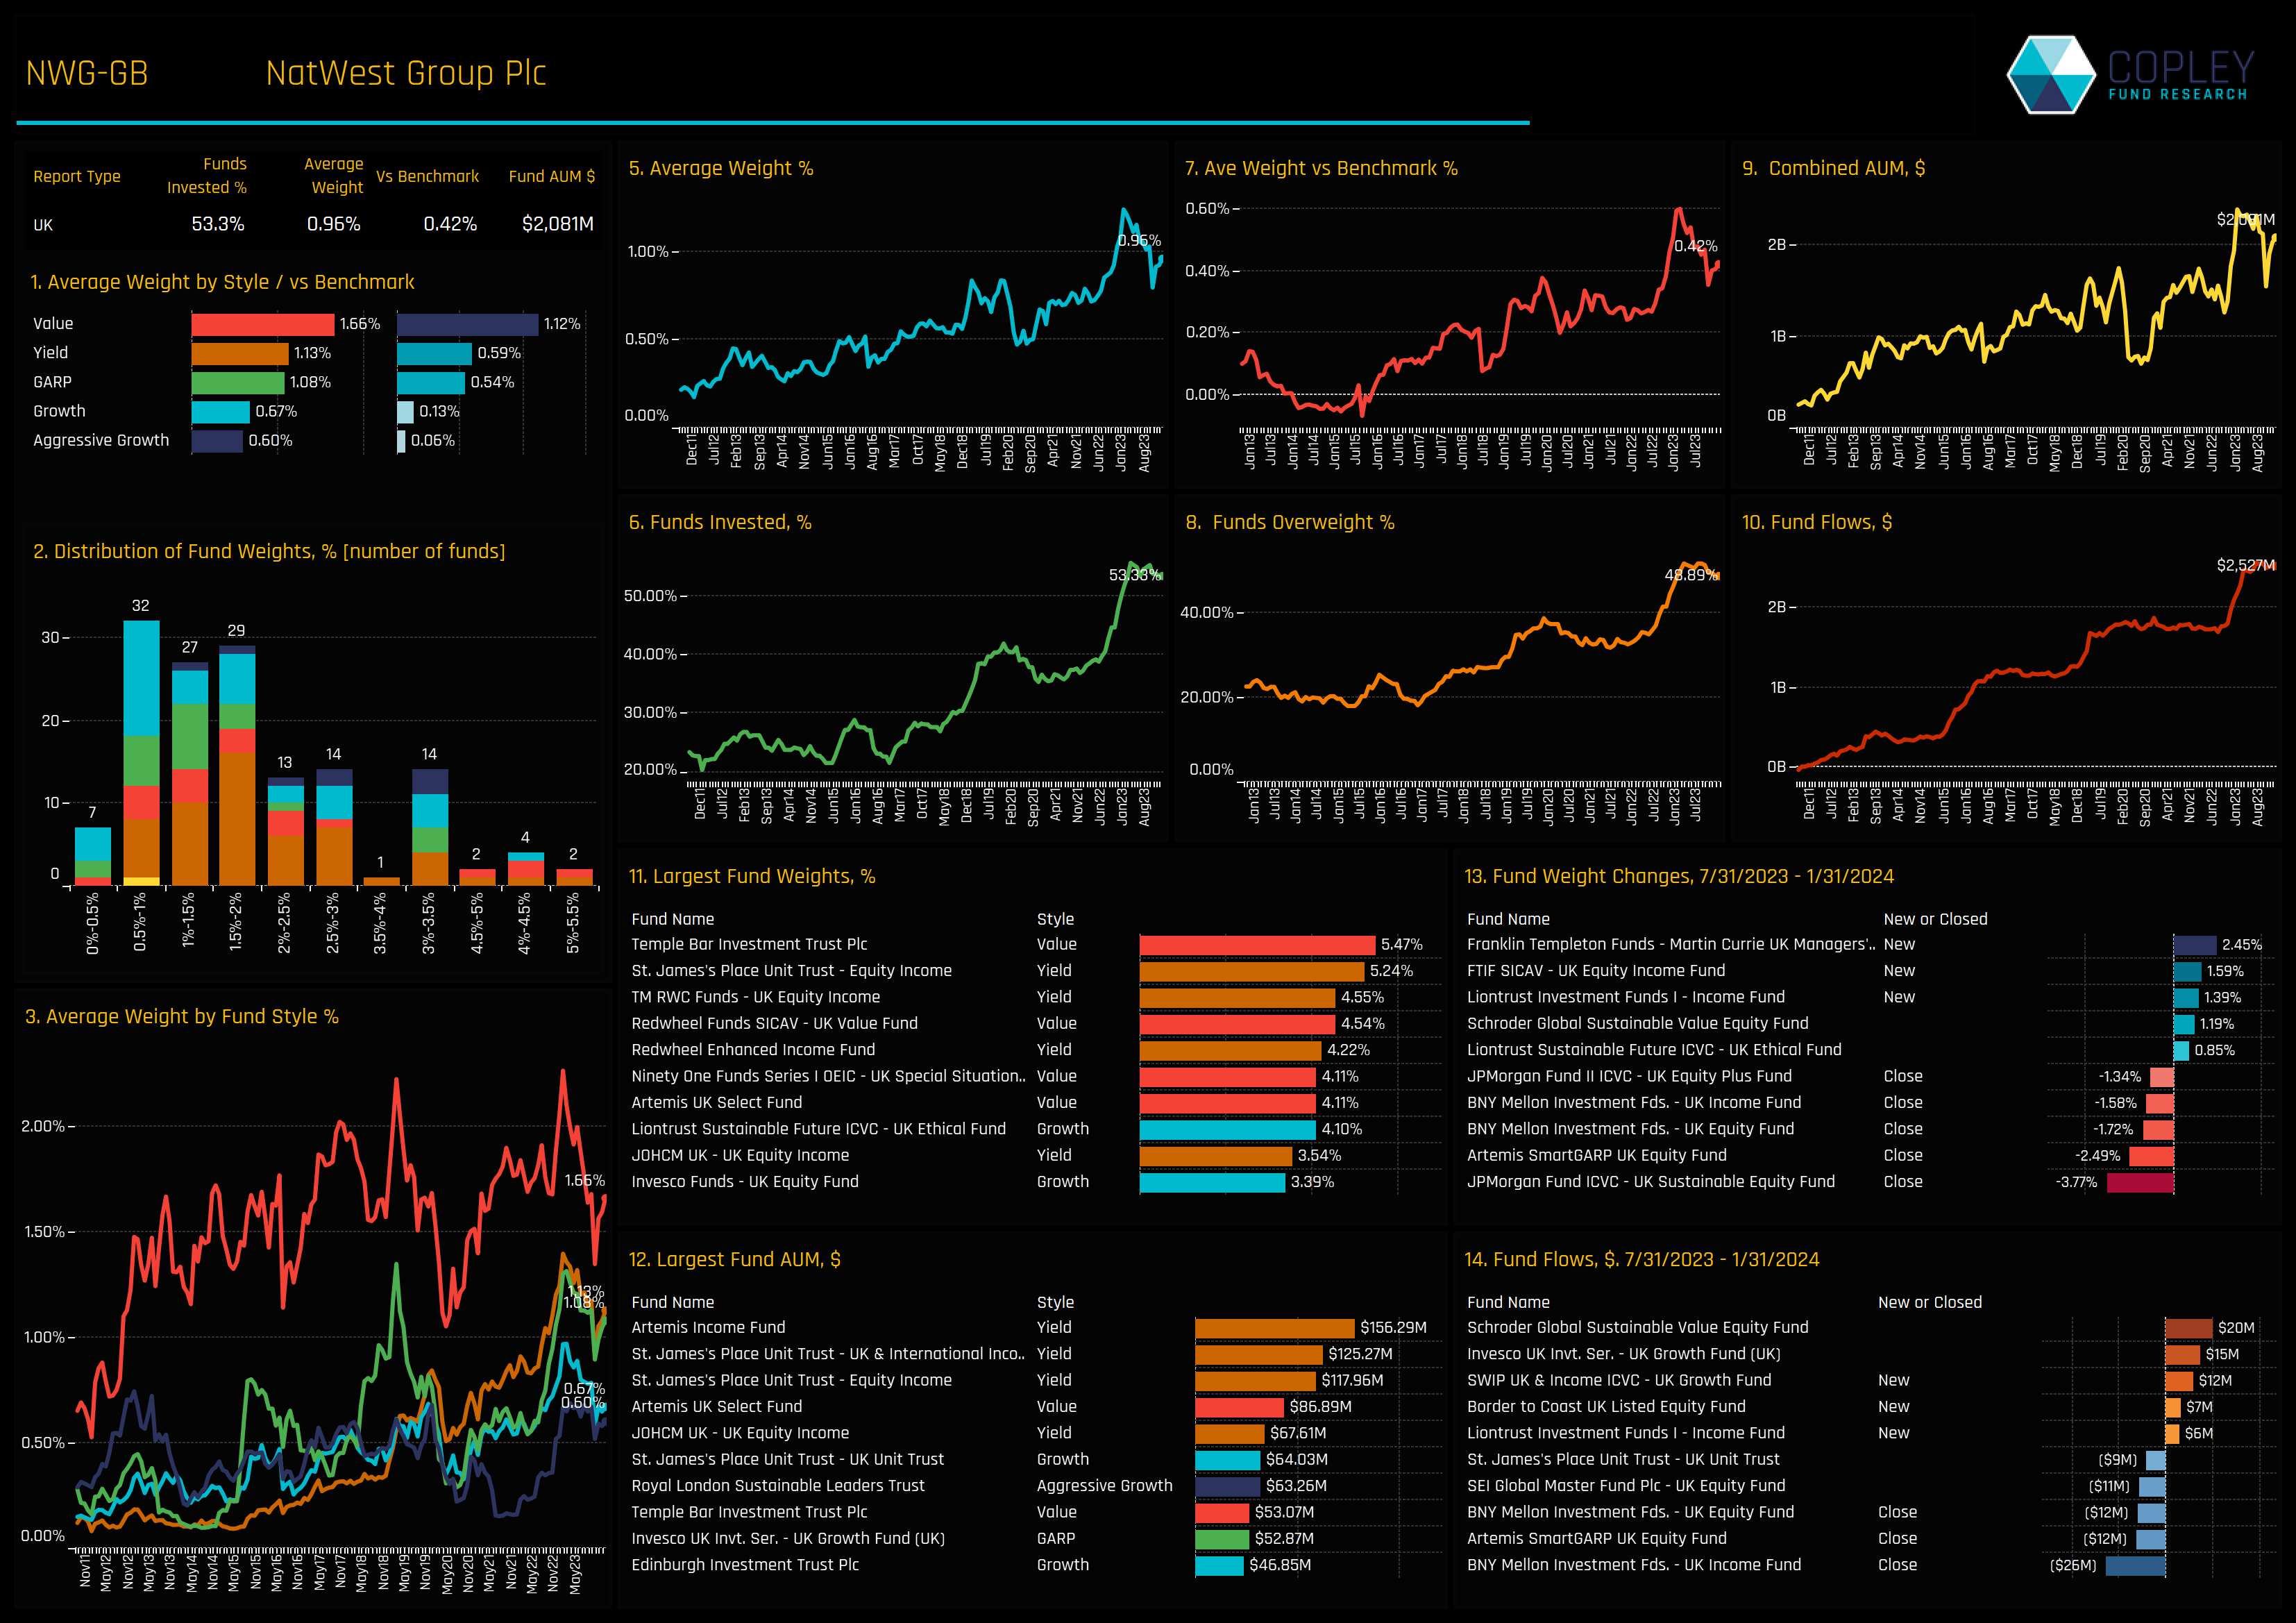
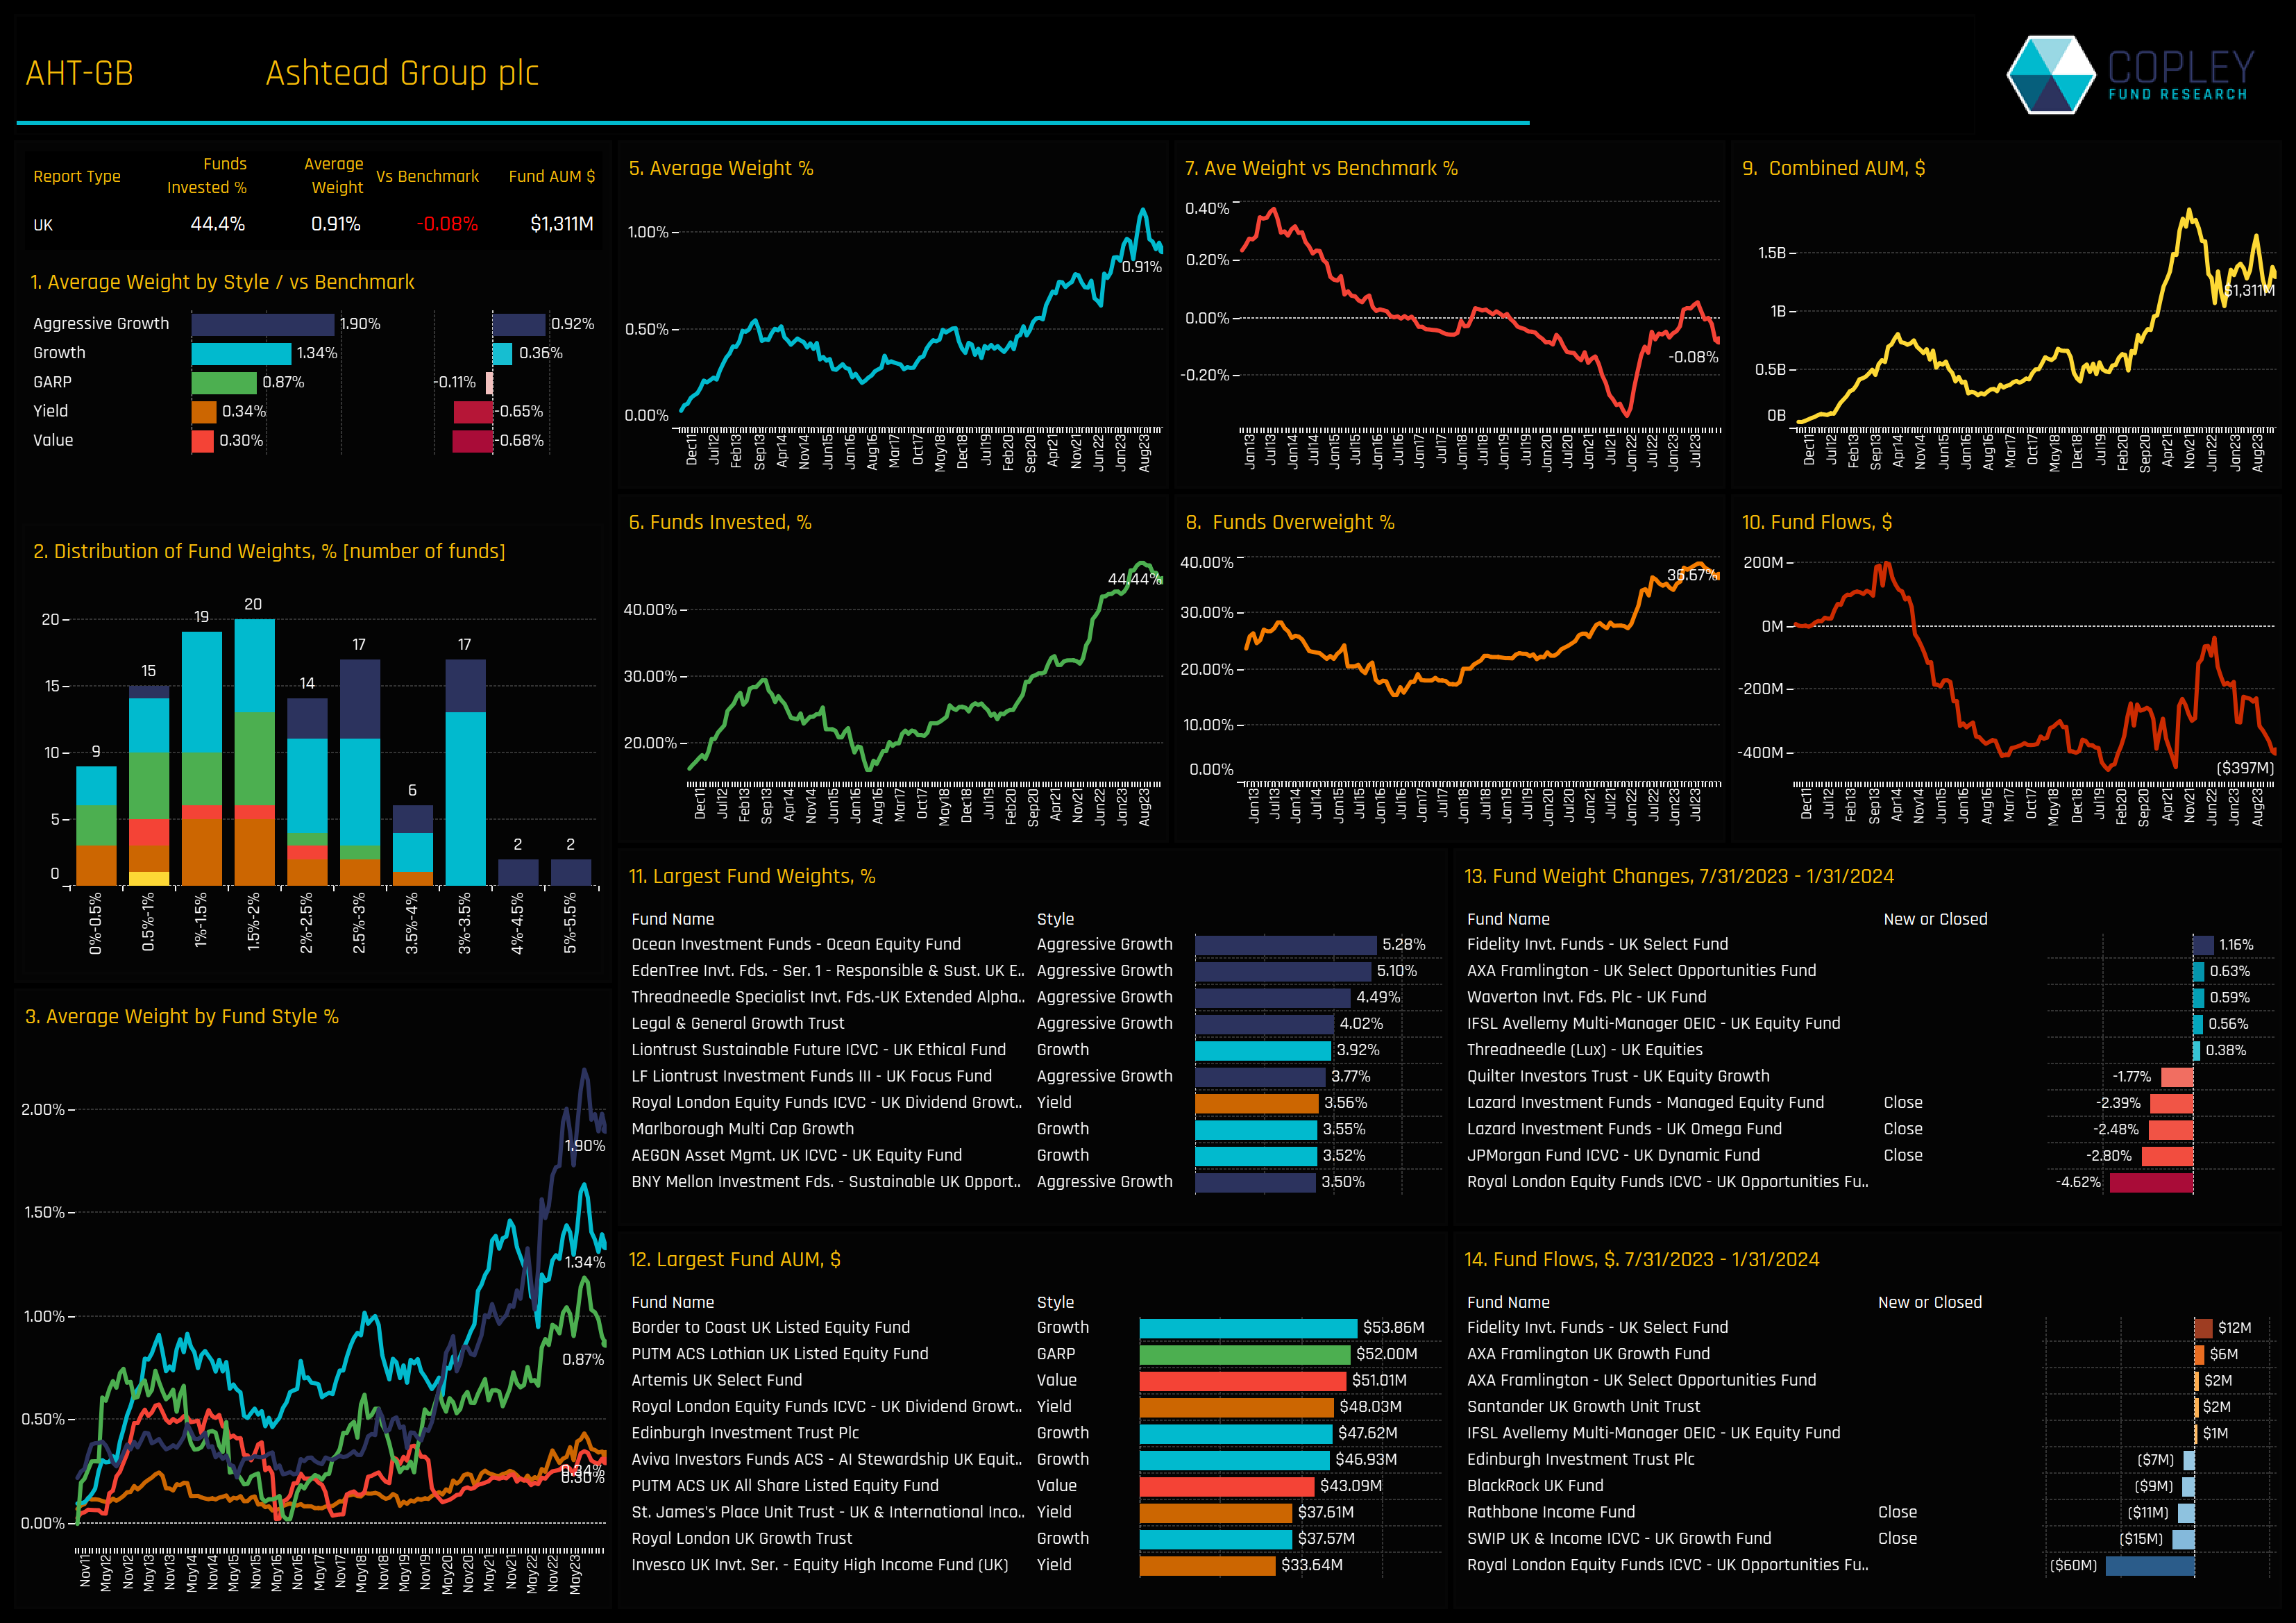
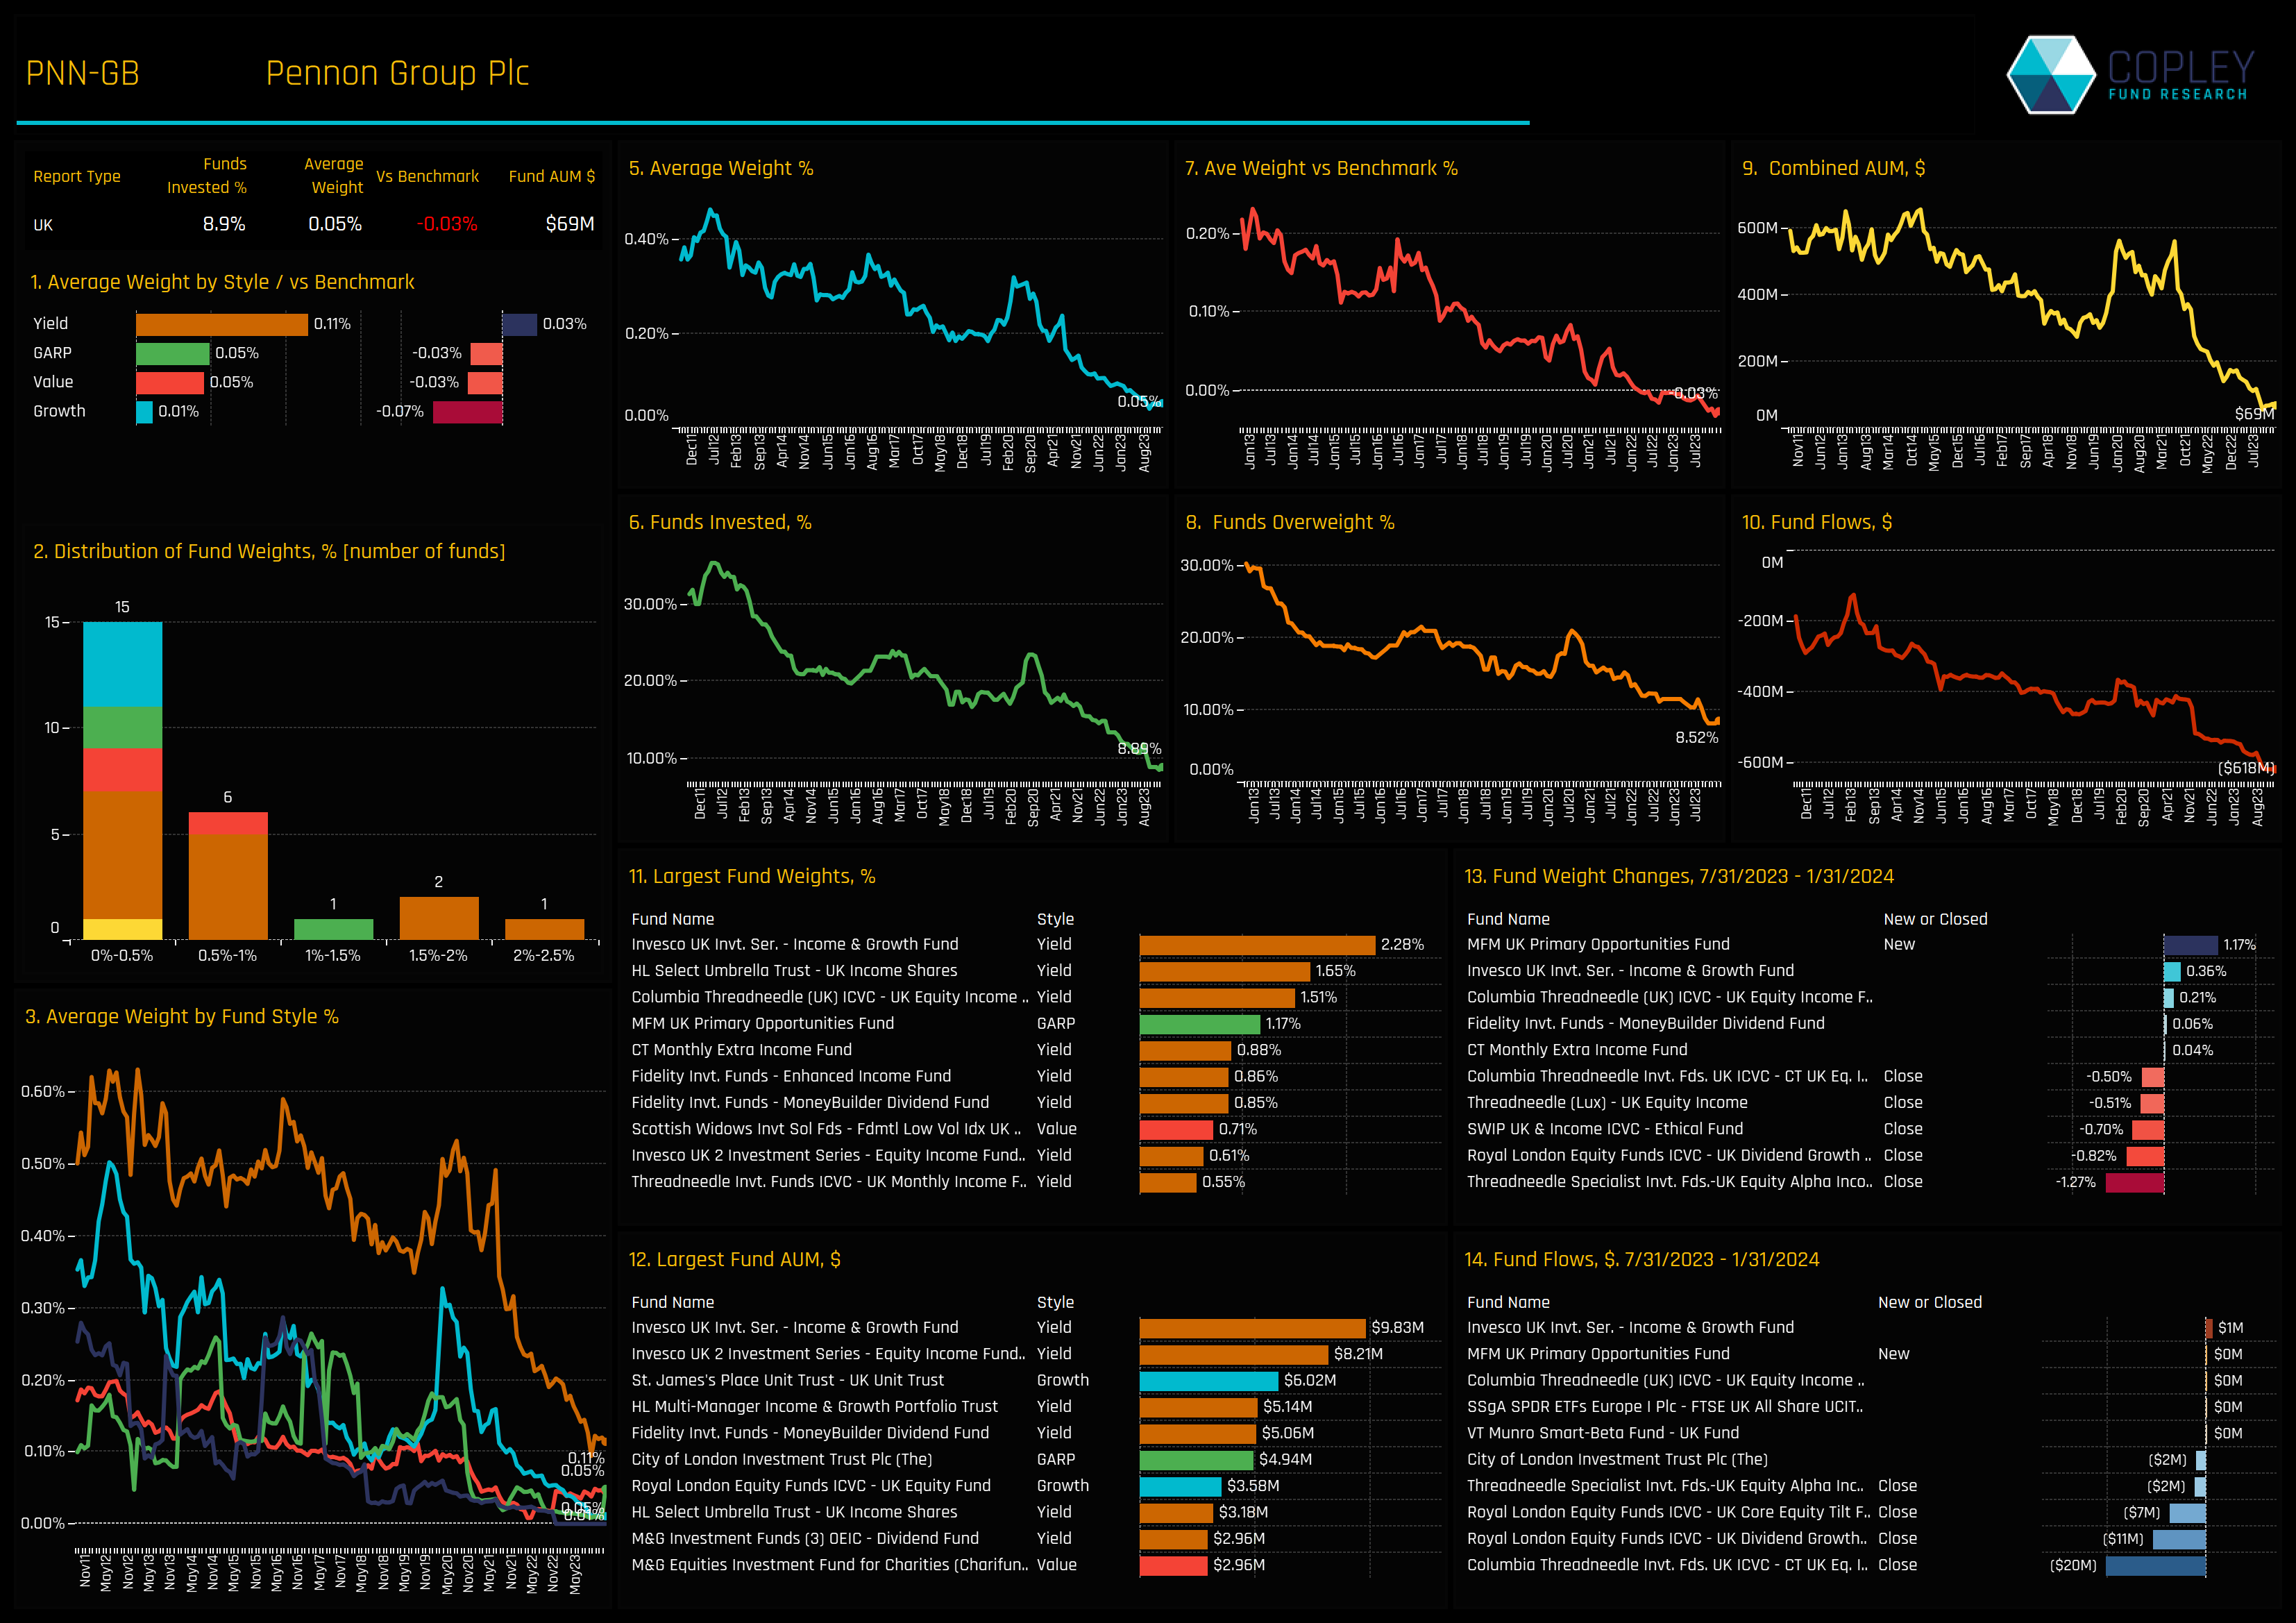
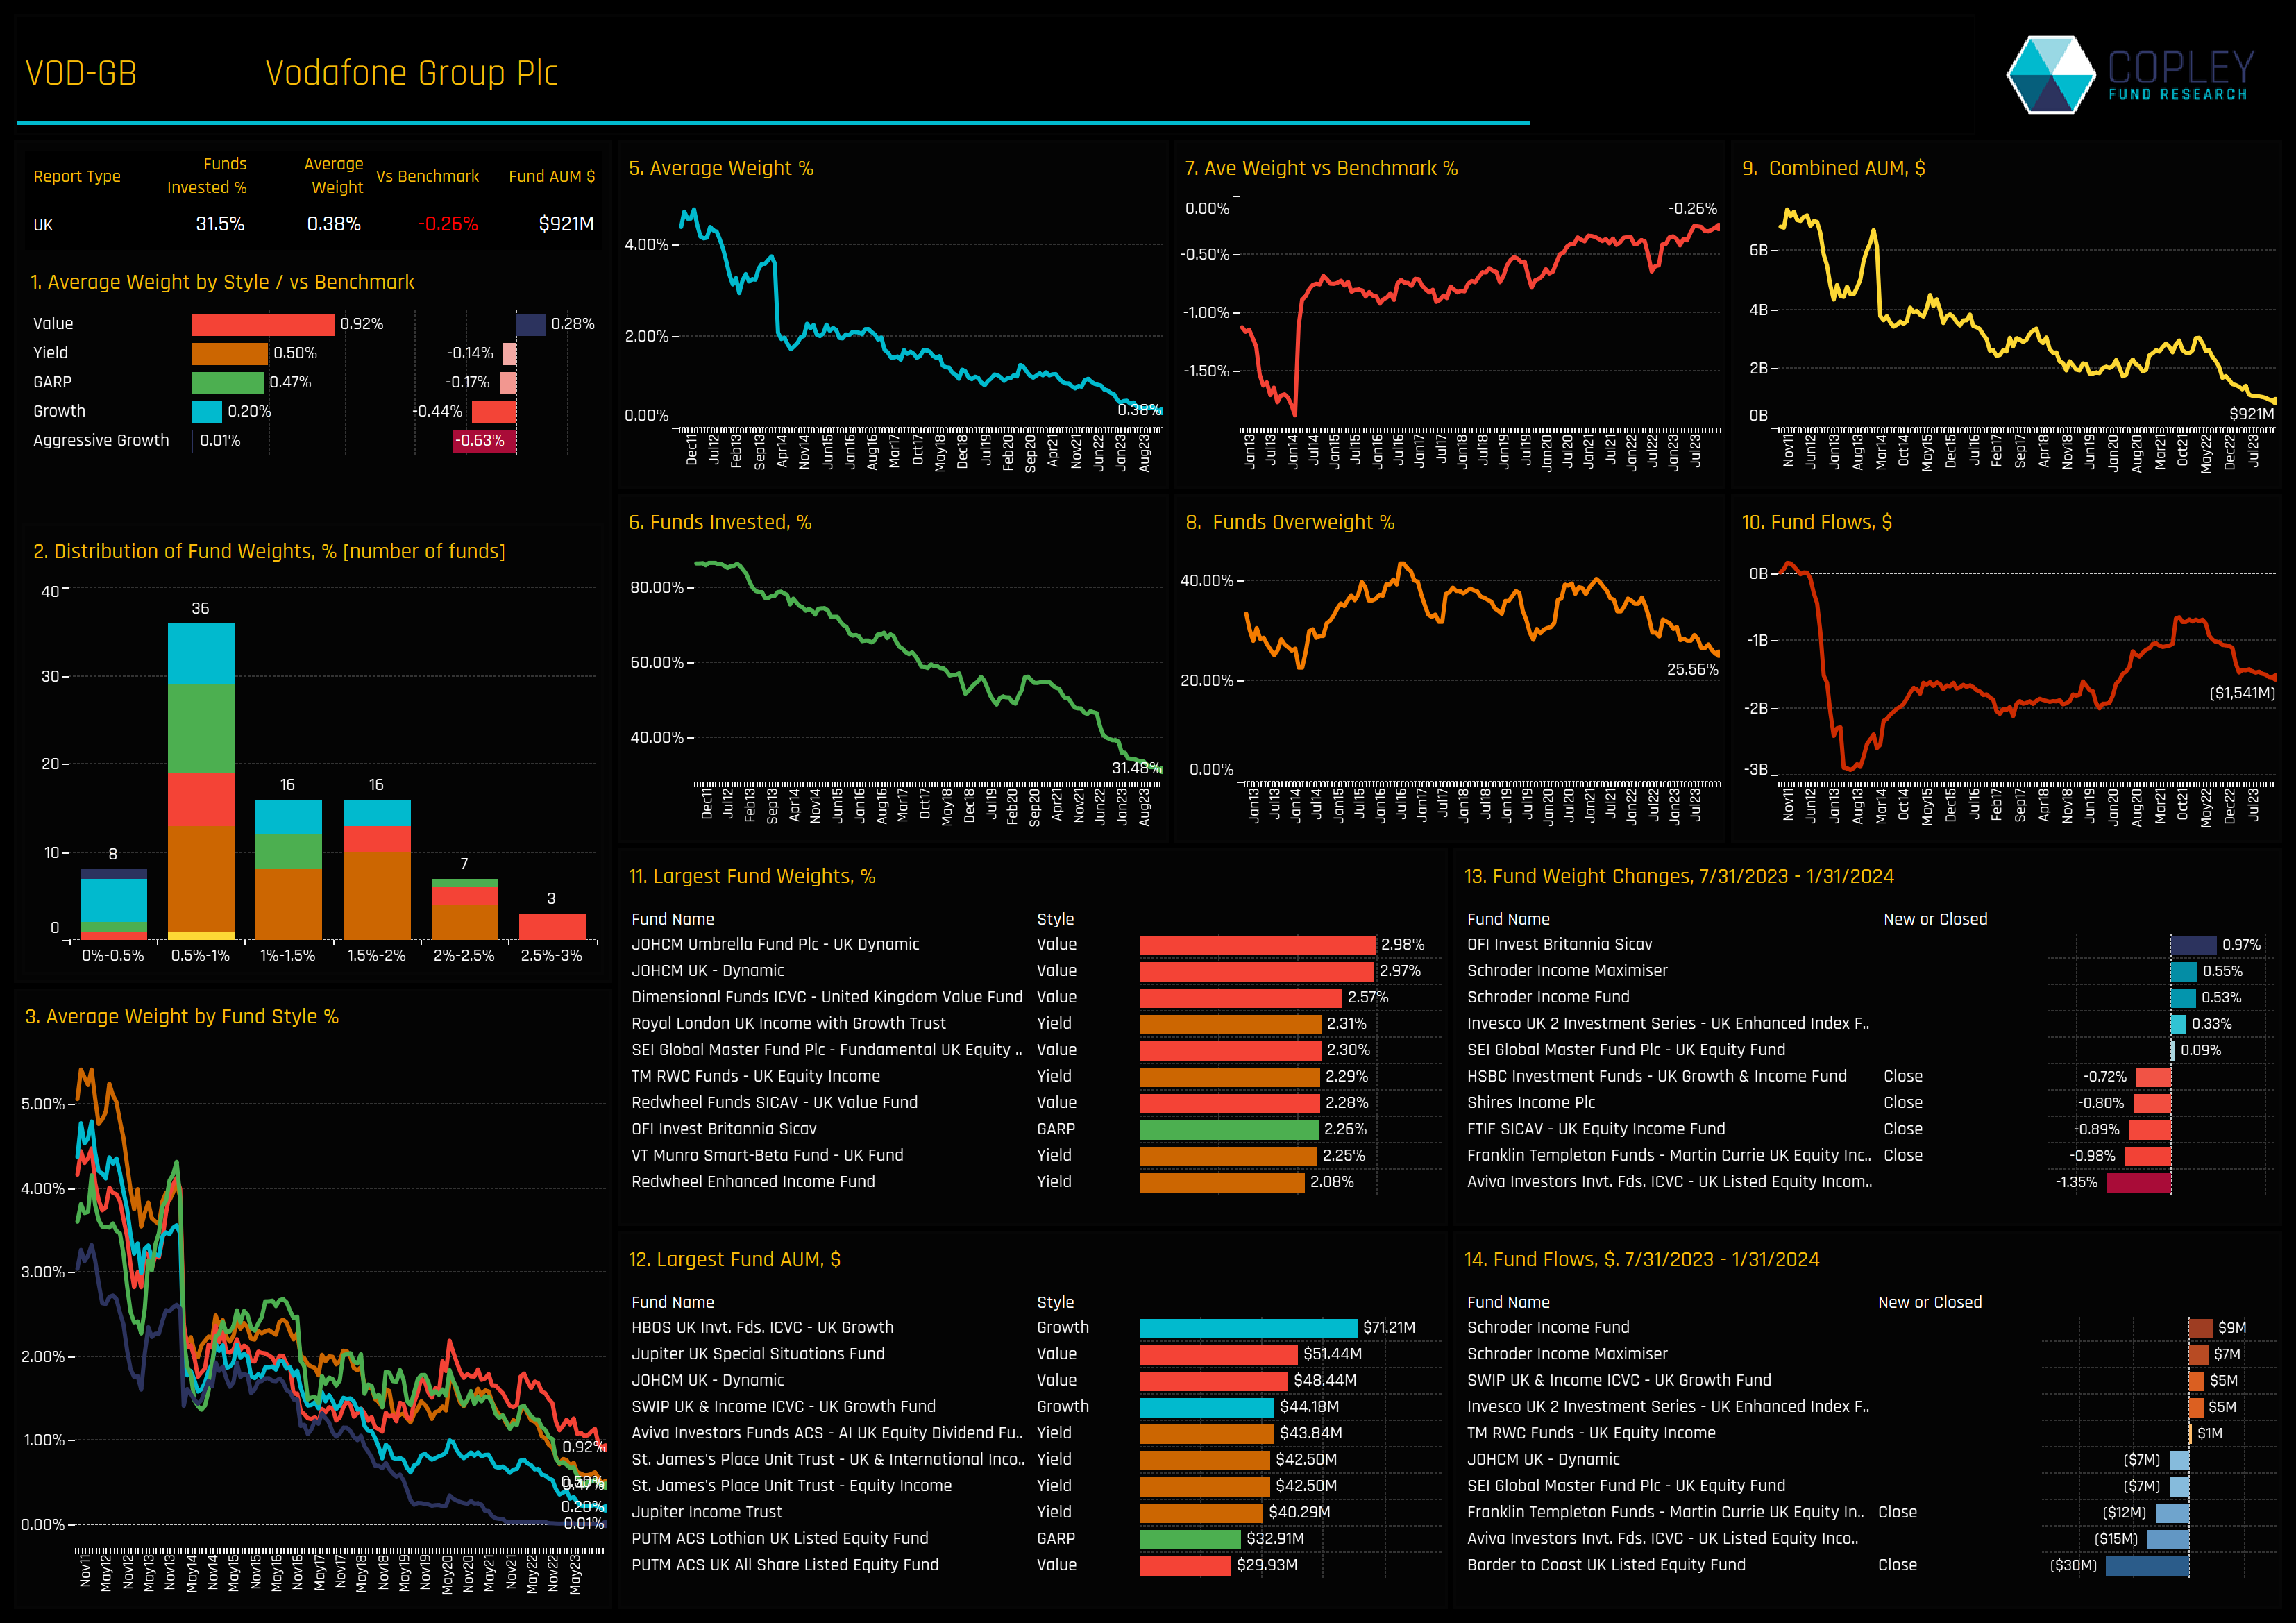
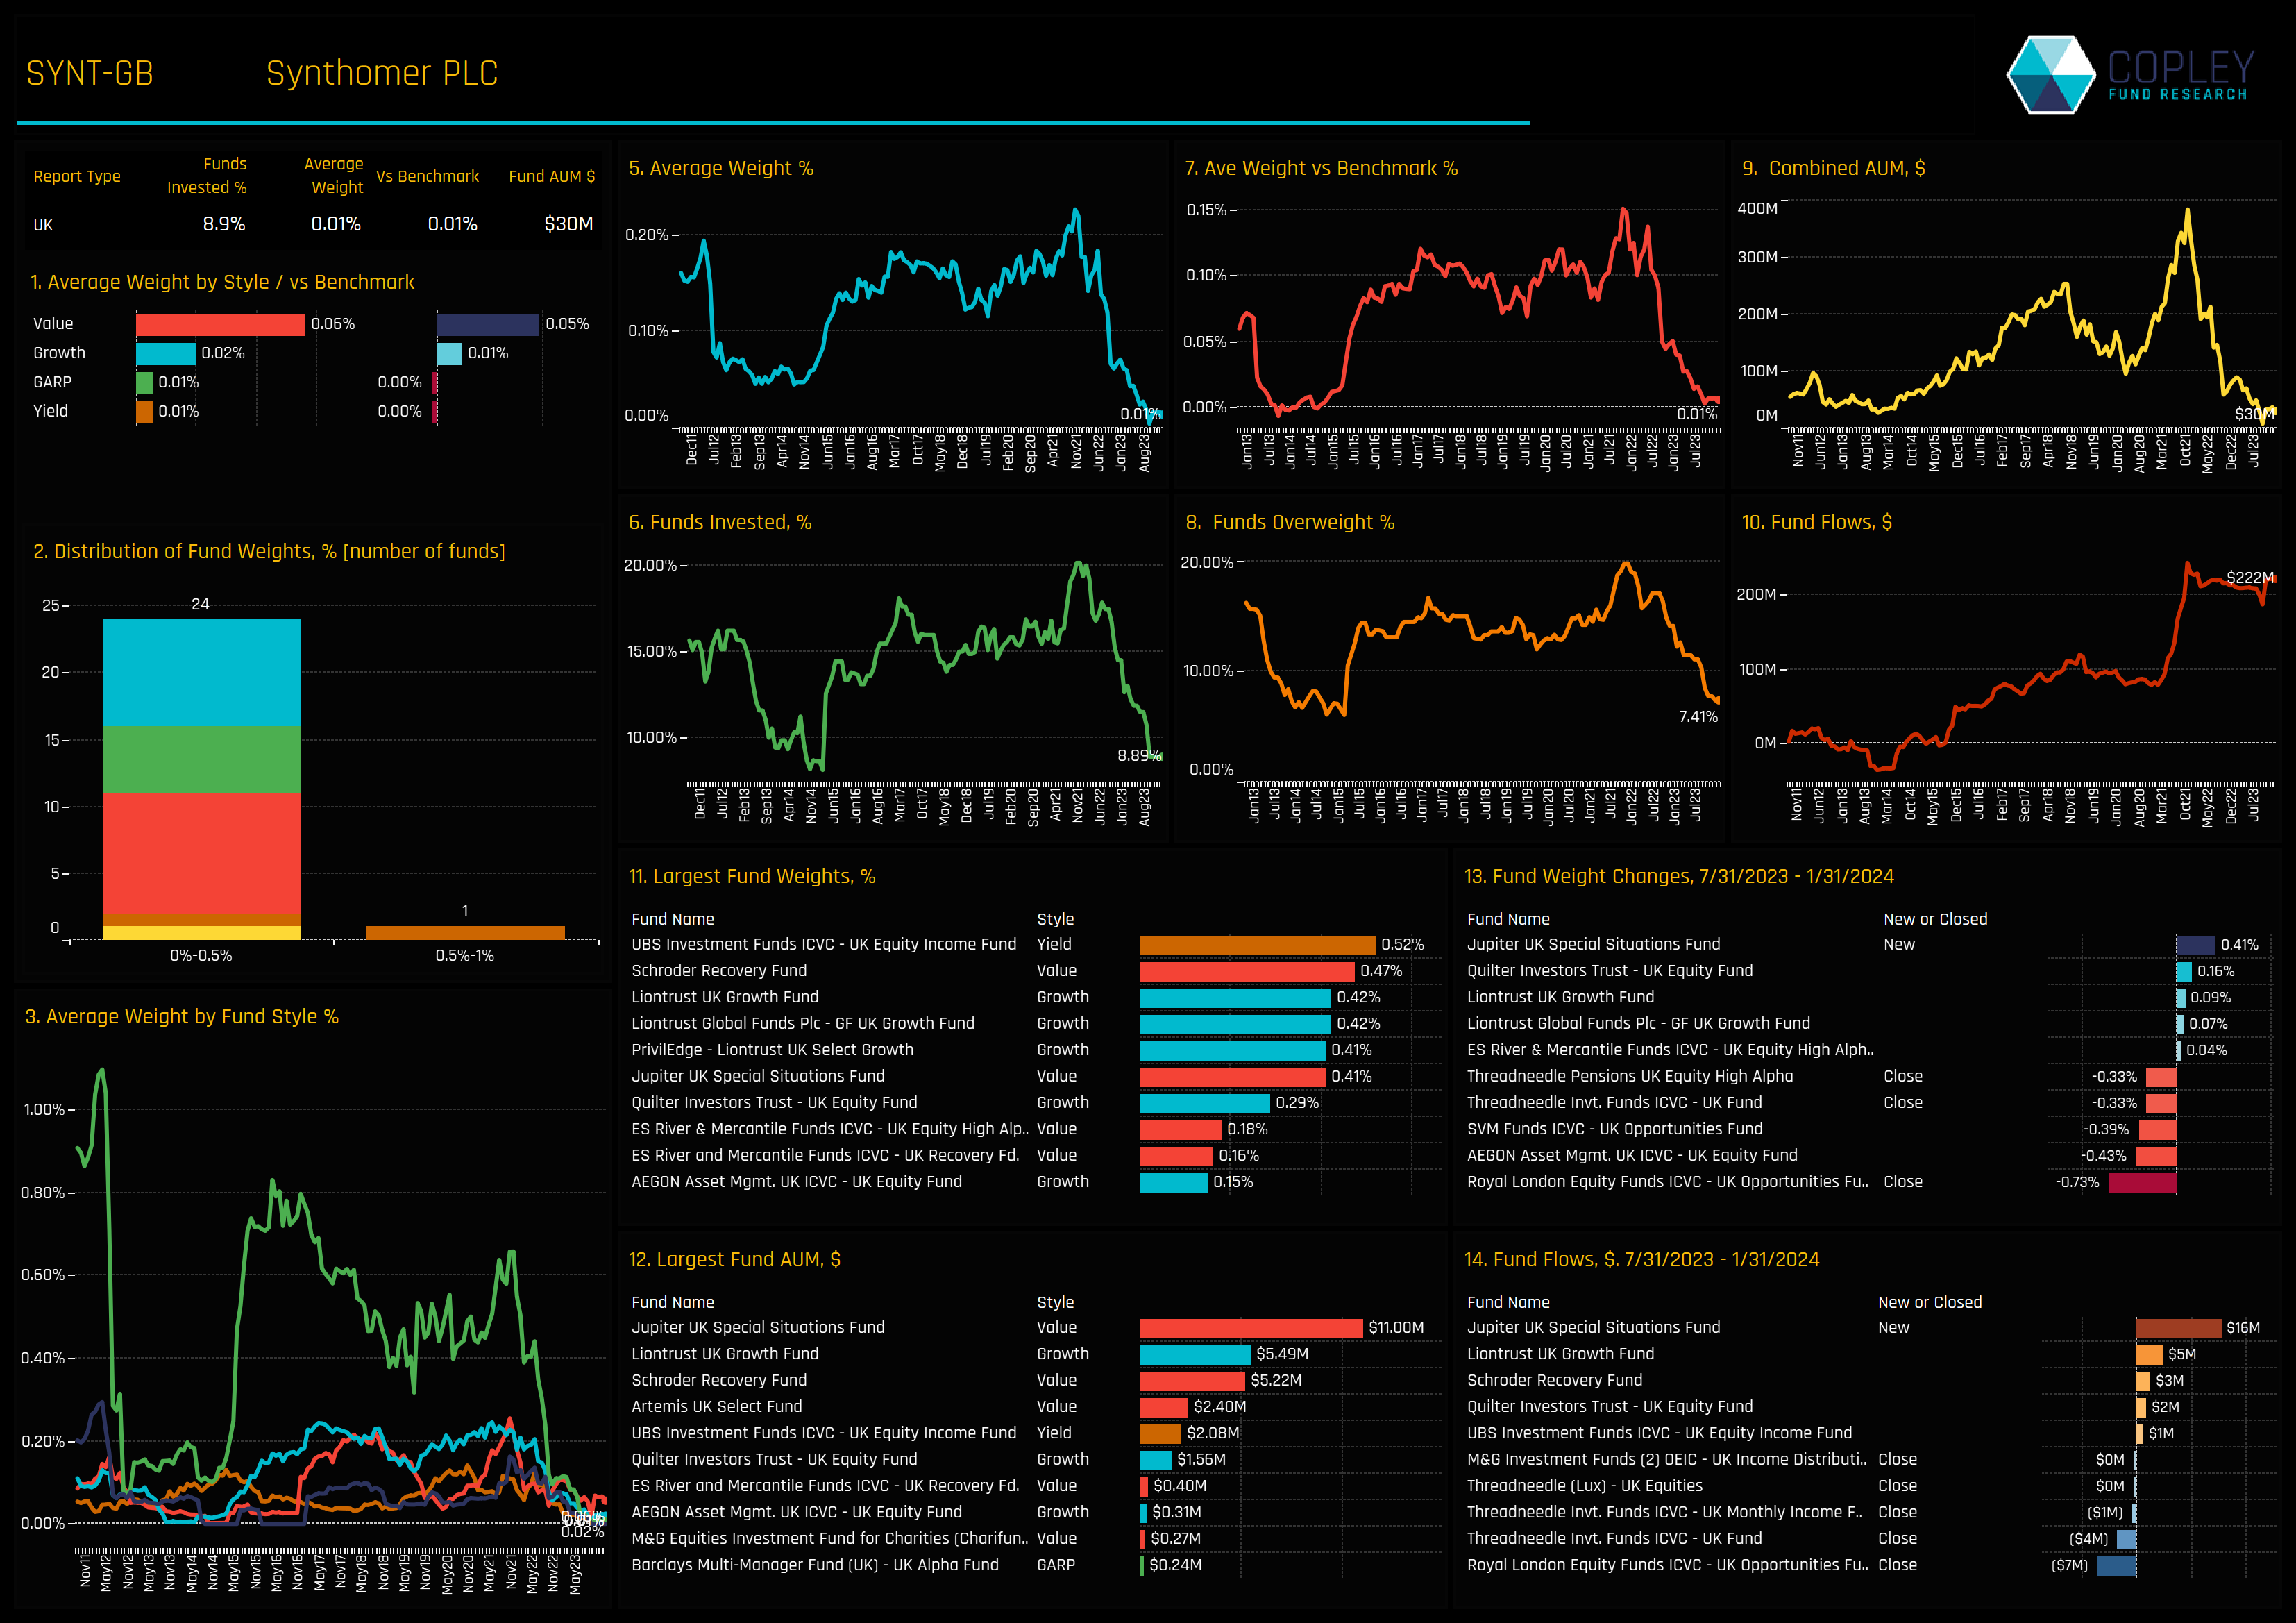
The following charts illustrate the proportion of active funds invested in the top 3 stocks within each of the 4 categories. This visualization provides an additional perspective on how the Sentiment Grid works. The top-left chart reveals a downturn in holdings for NatWest Group, Ashtead Group and Pets At Home Group following a sustained period of growth. In contrast, the bottom-left chart illustrates a consistent decrease in fund investment in Vodafone, Pennon Group and Synthomer plc, with recent sell-offs driving ownership to a 13-year low.
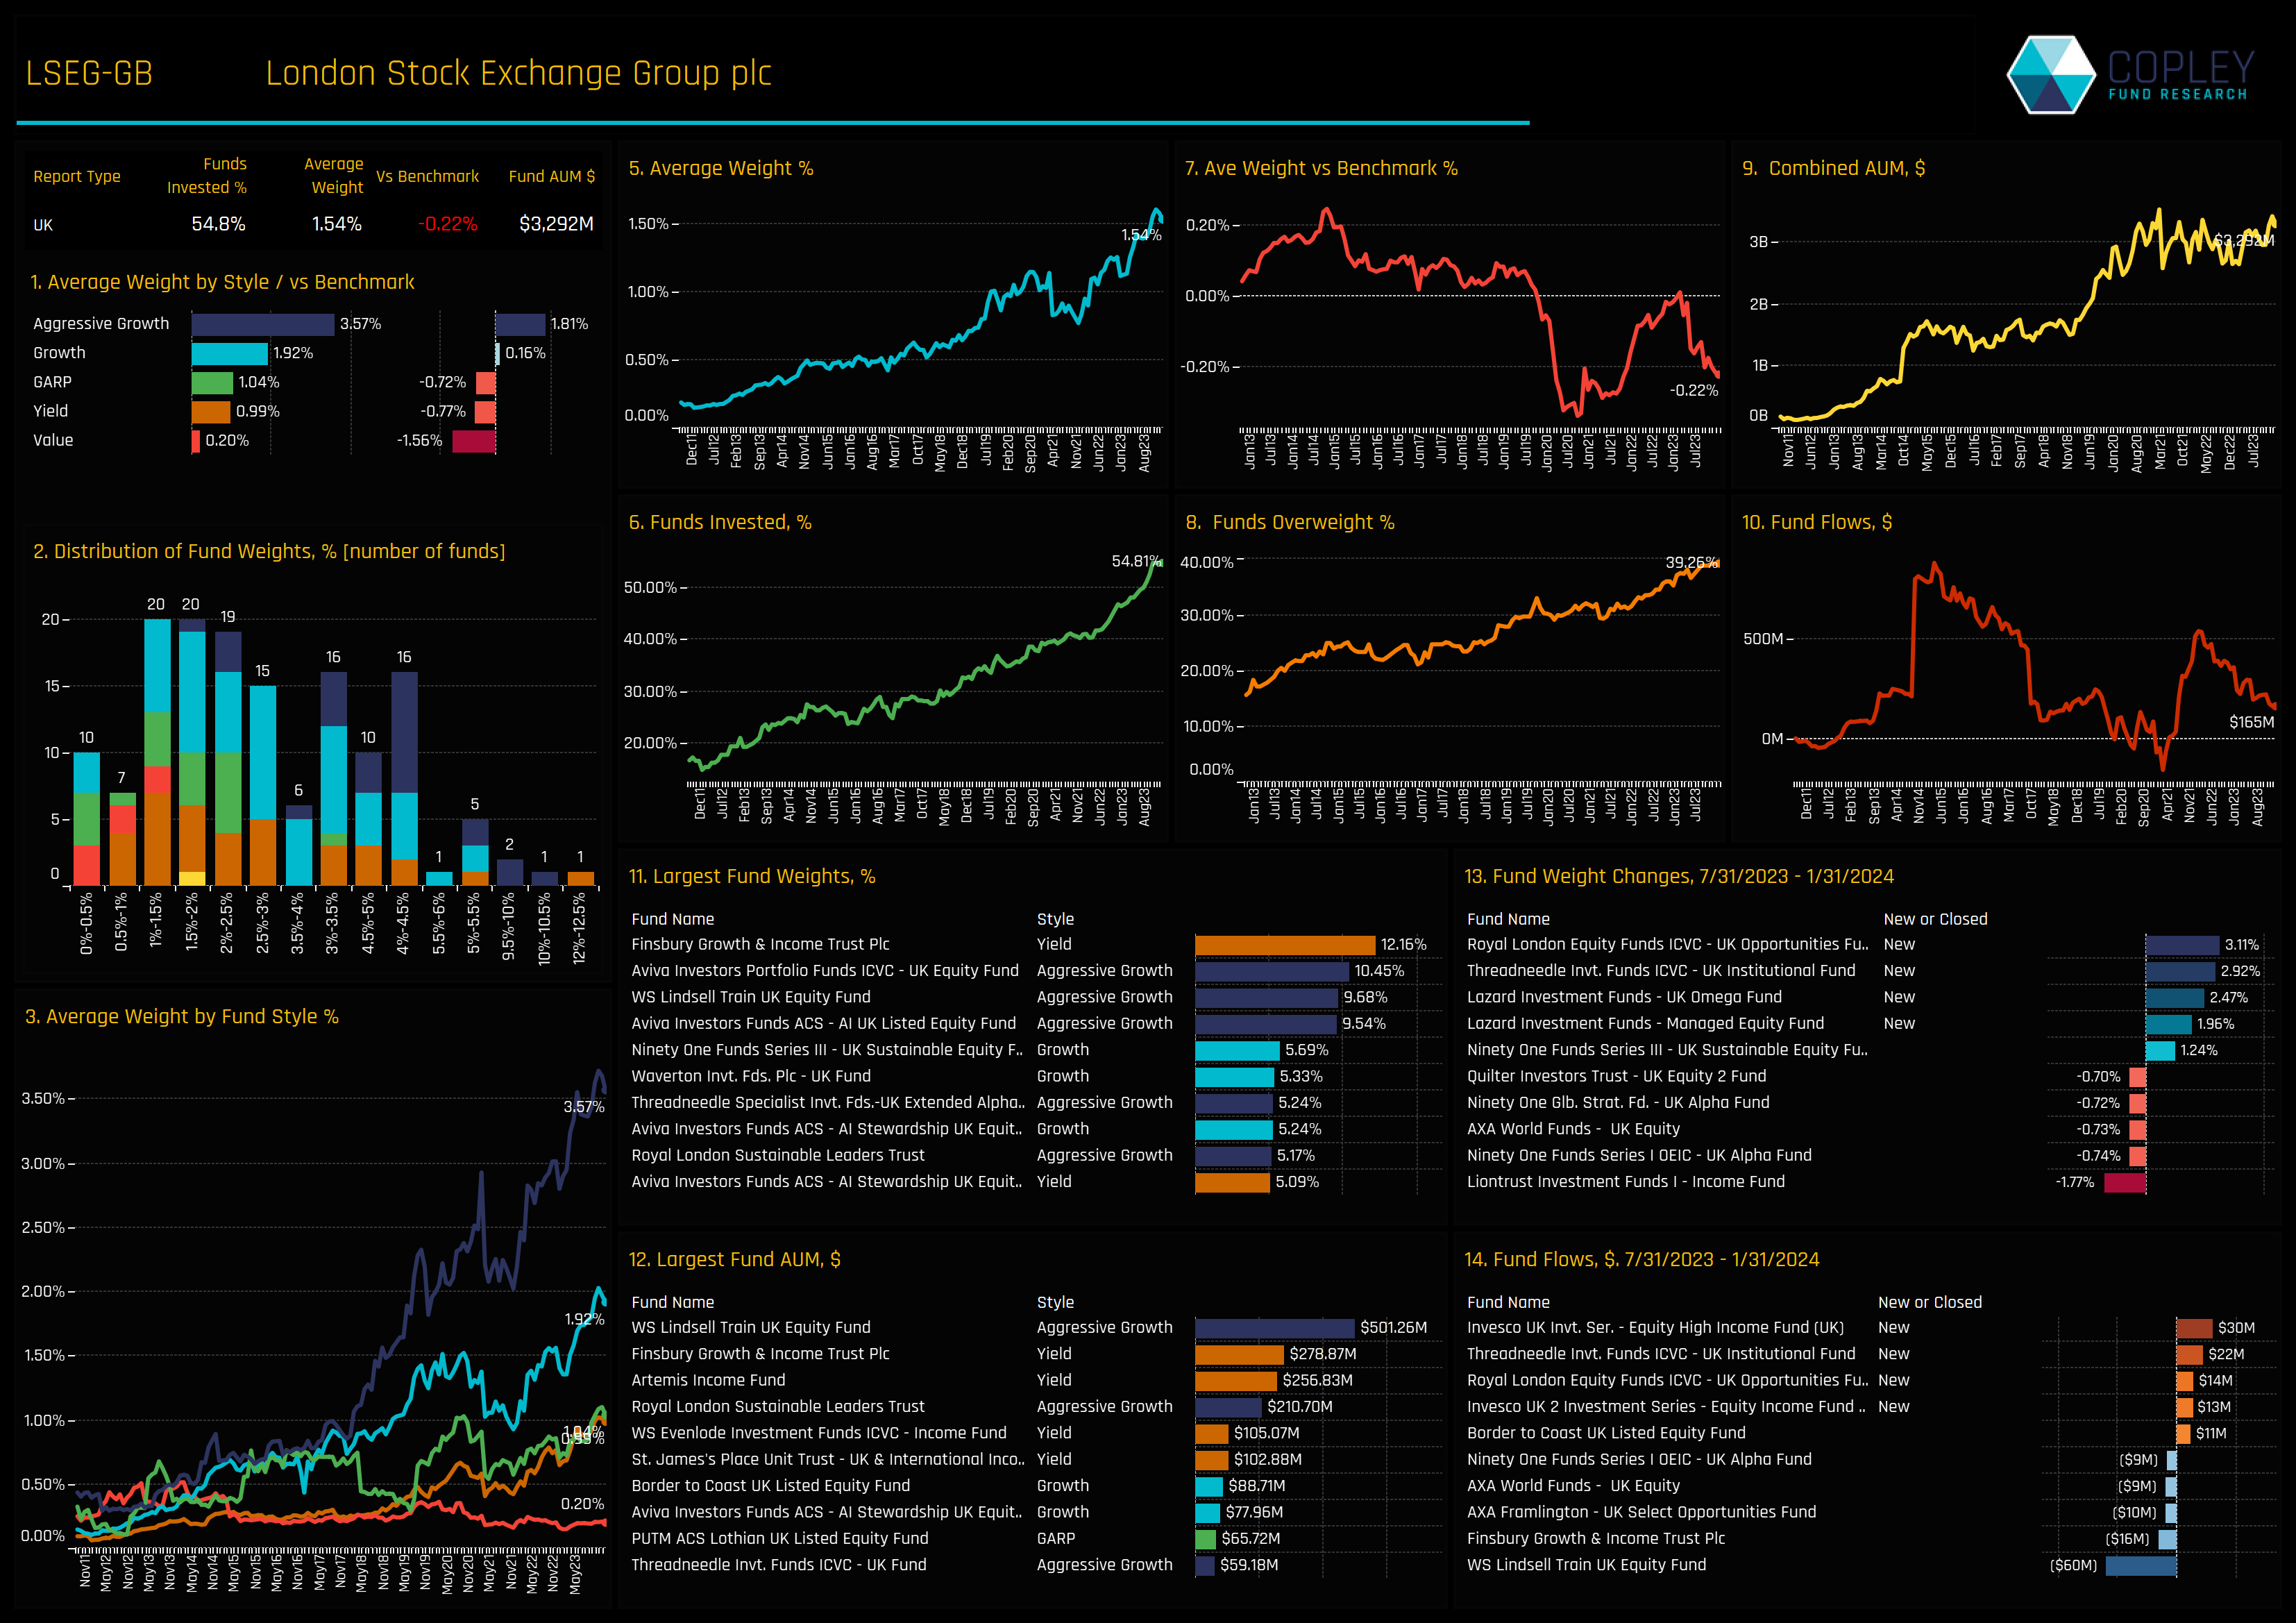
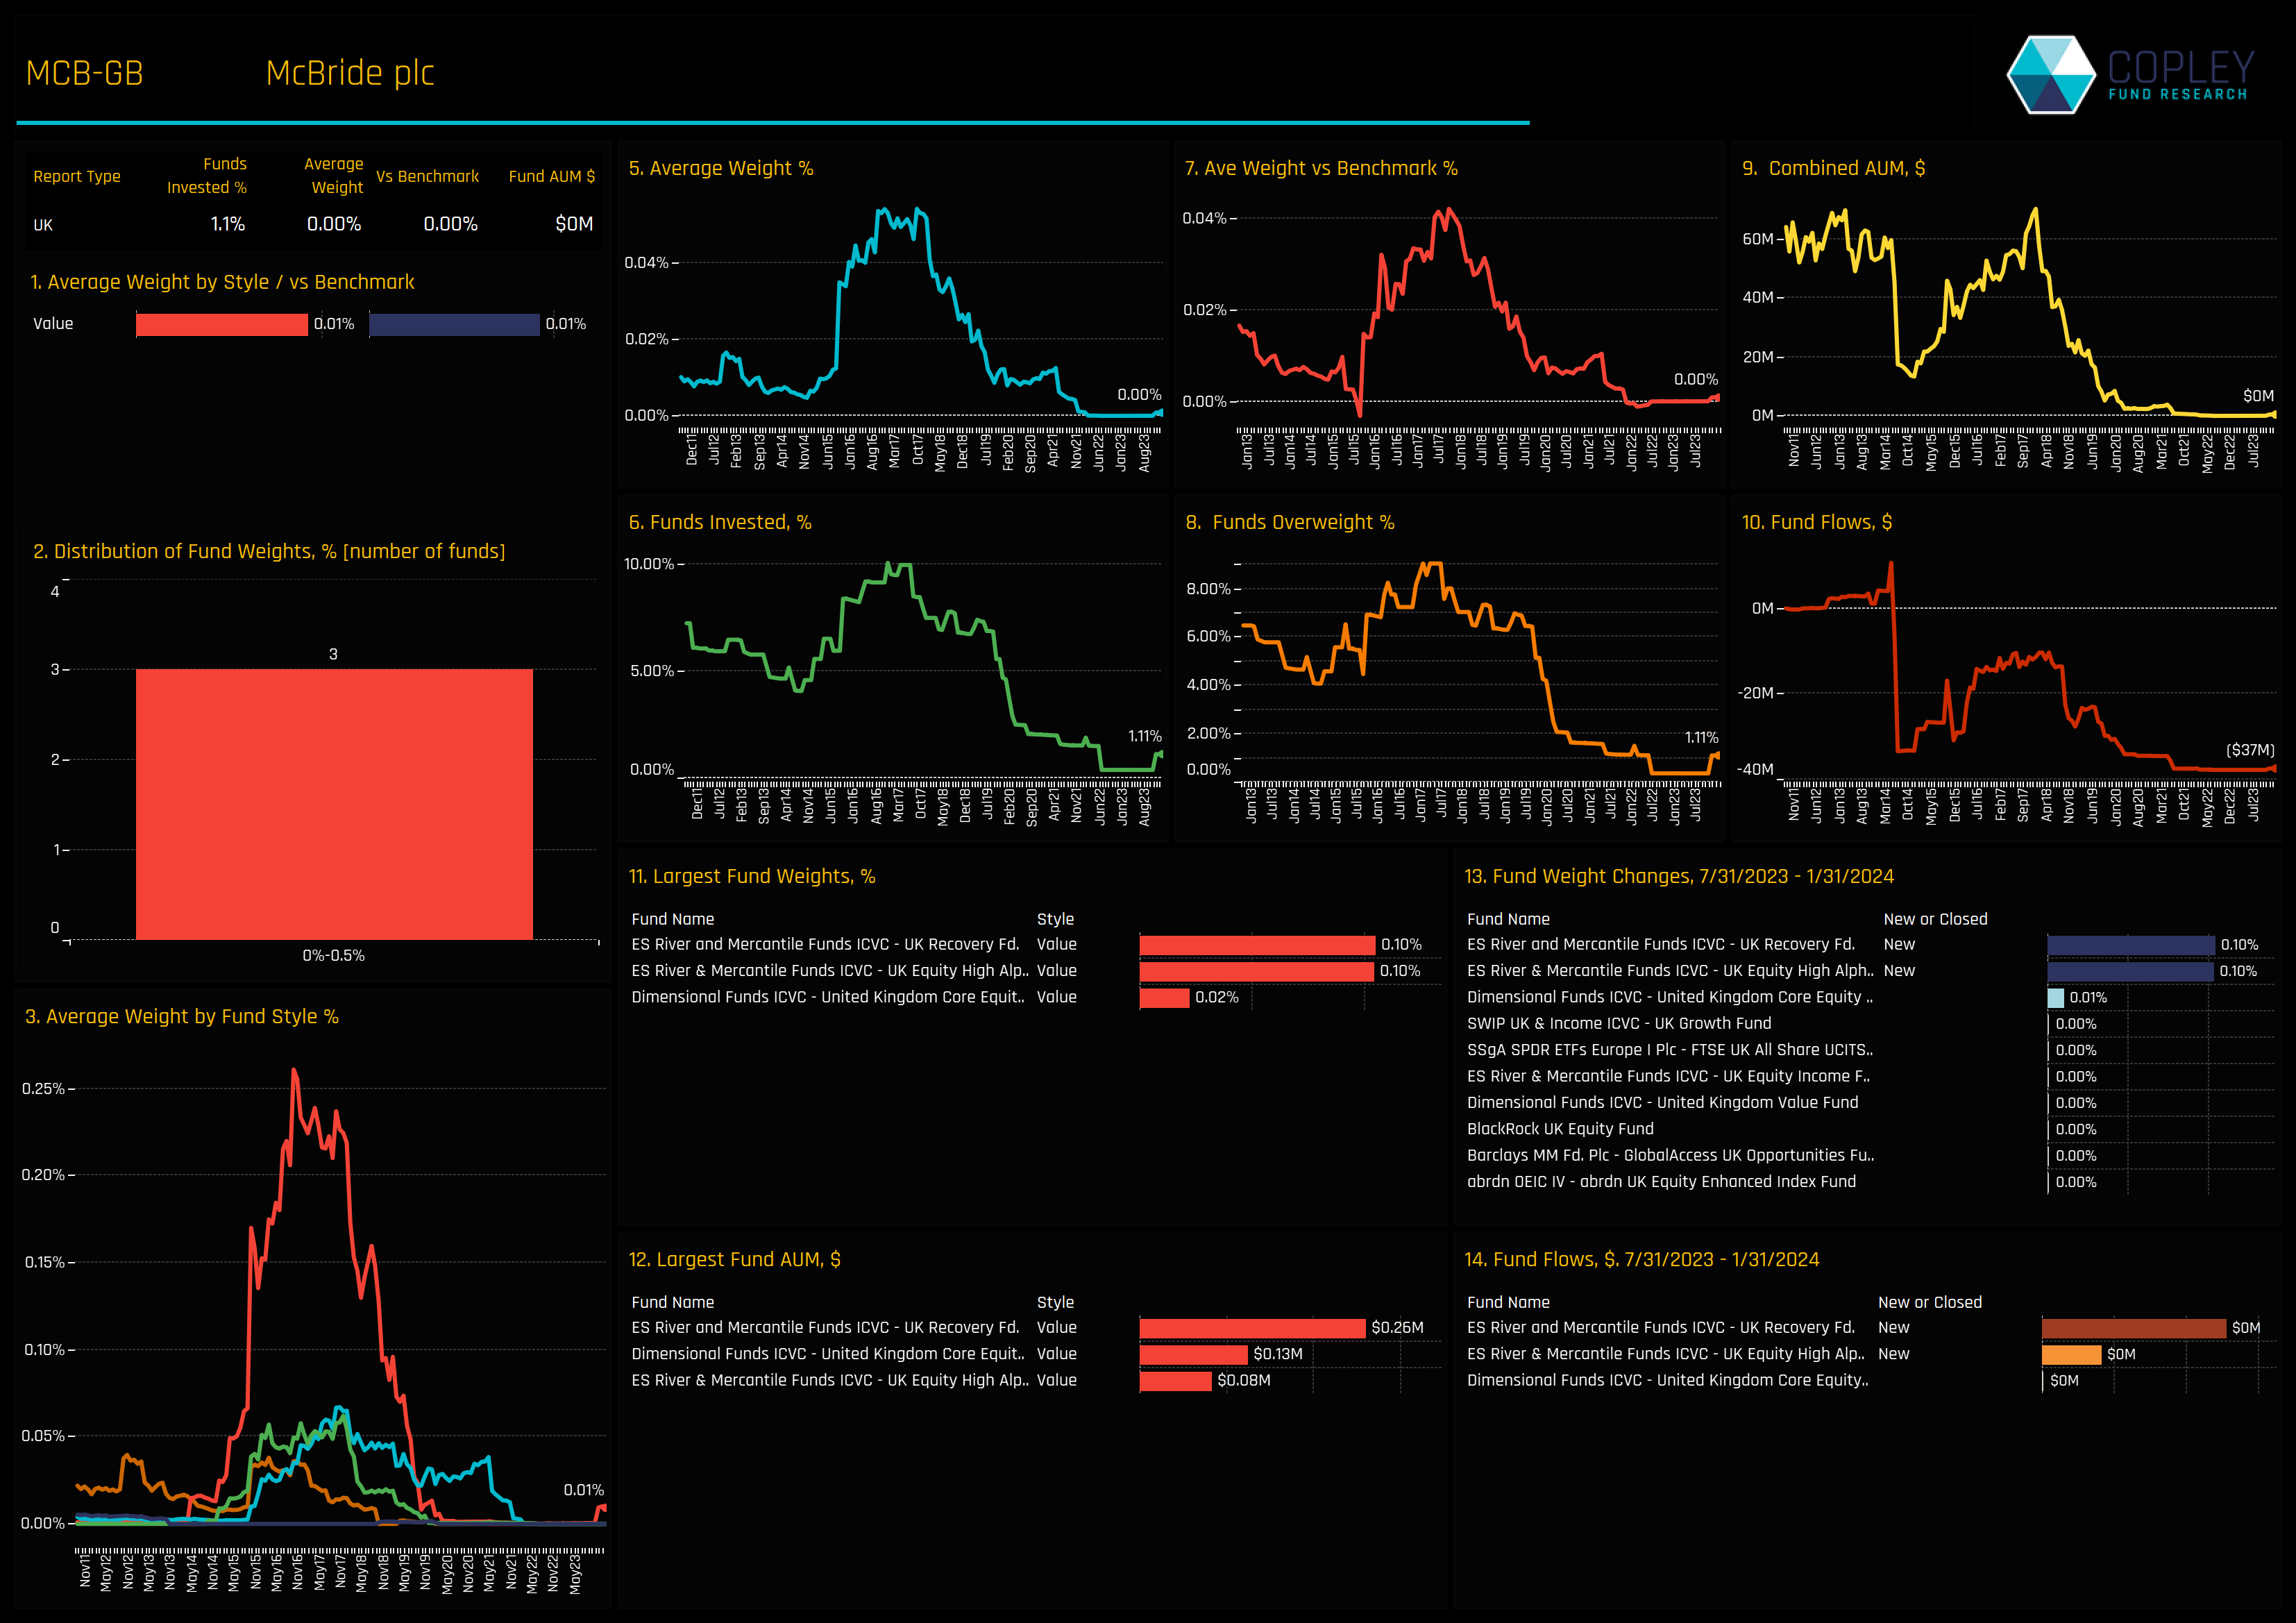
Focusing on the bottom right chart, we see McBride plc positioned at the lower extremes of its ownership history, though a small uptick has occurred more recently. The top right chart indicates that LSE Group, Taylor Wimpey and SEGRO plc have reached record levels of ownership after months of increasing fund engagement. More in-depth profiles of these 10 key stocks from the extremes of our Sentiment Grid are detailed in the charts below.
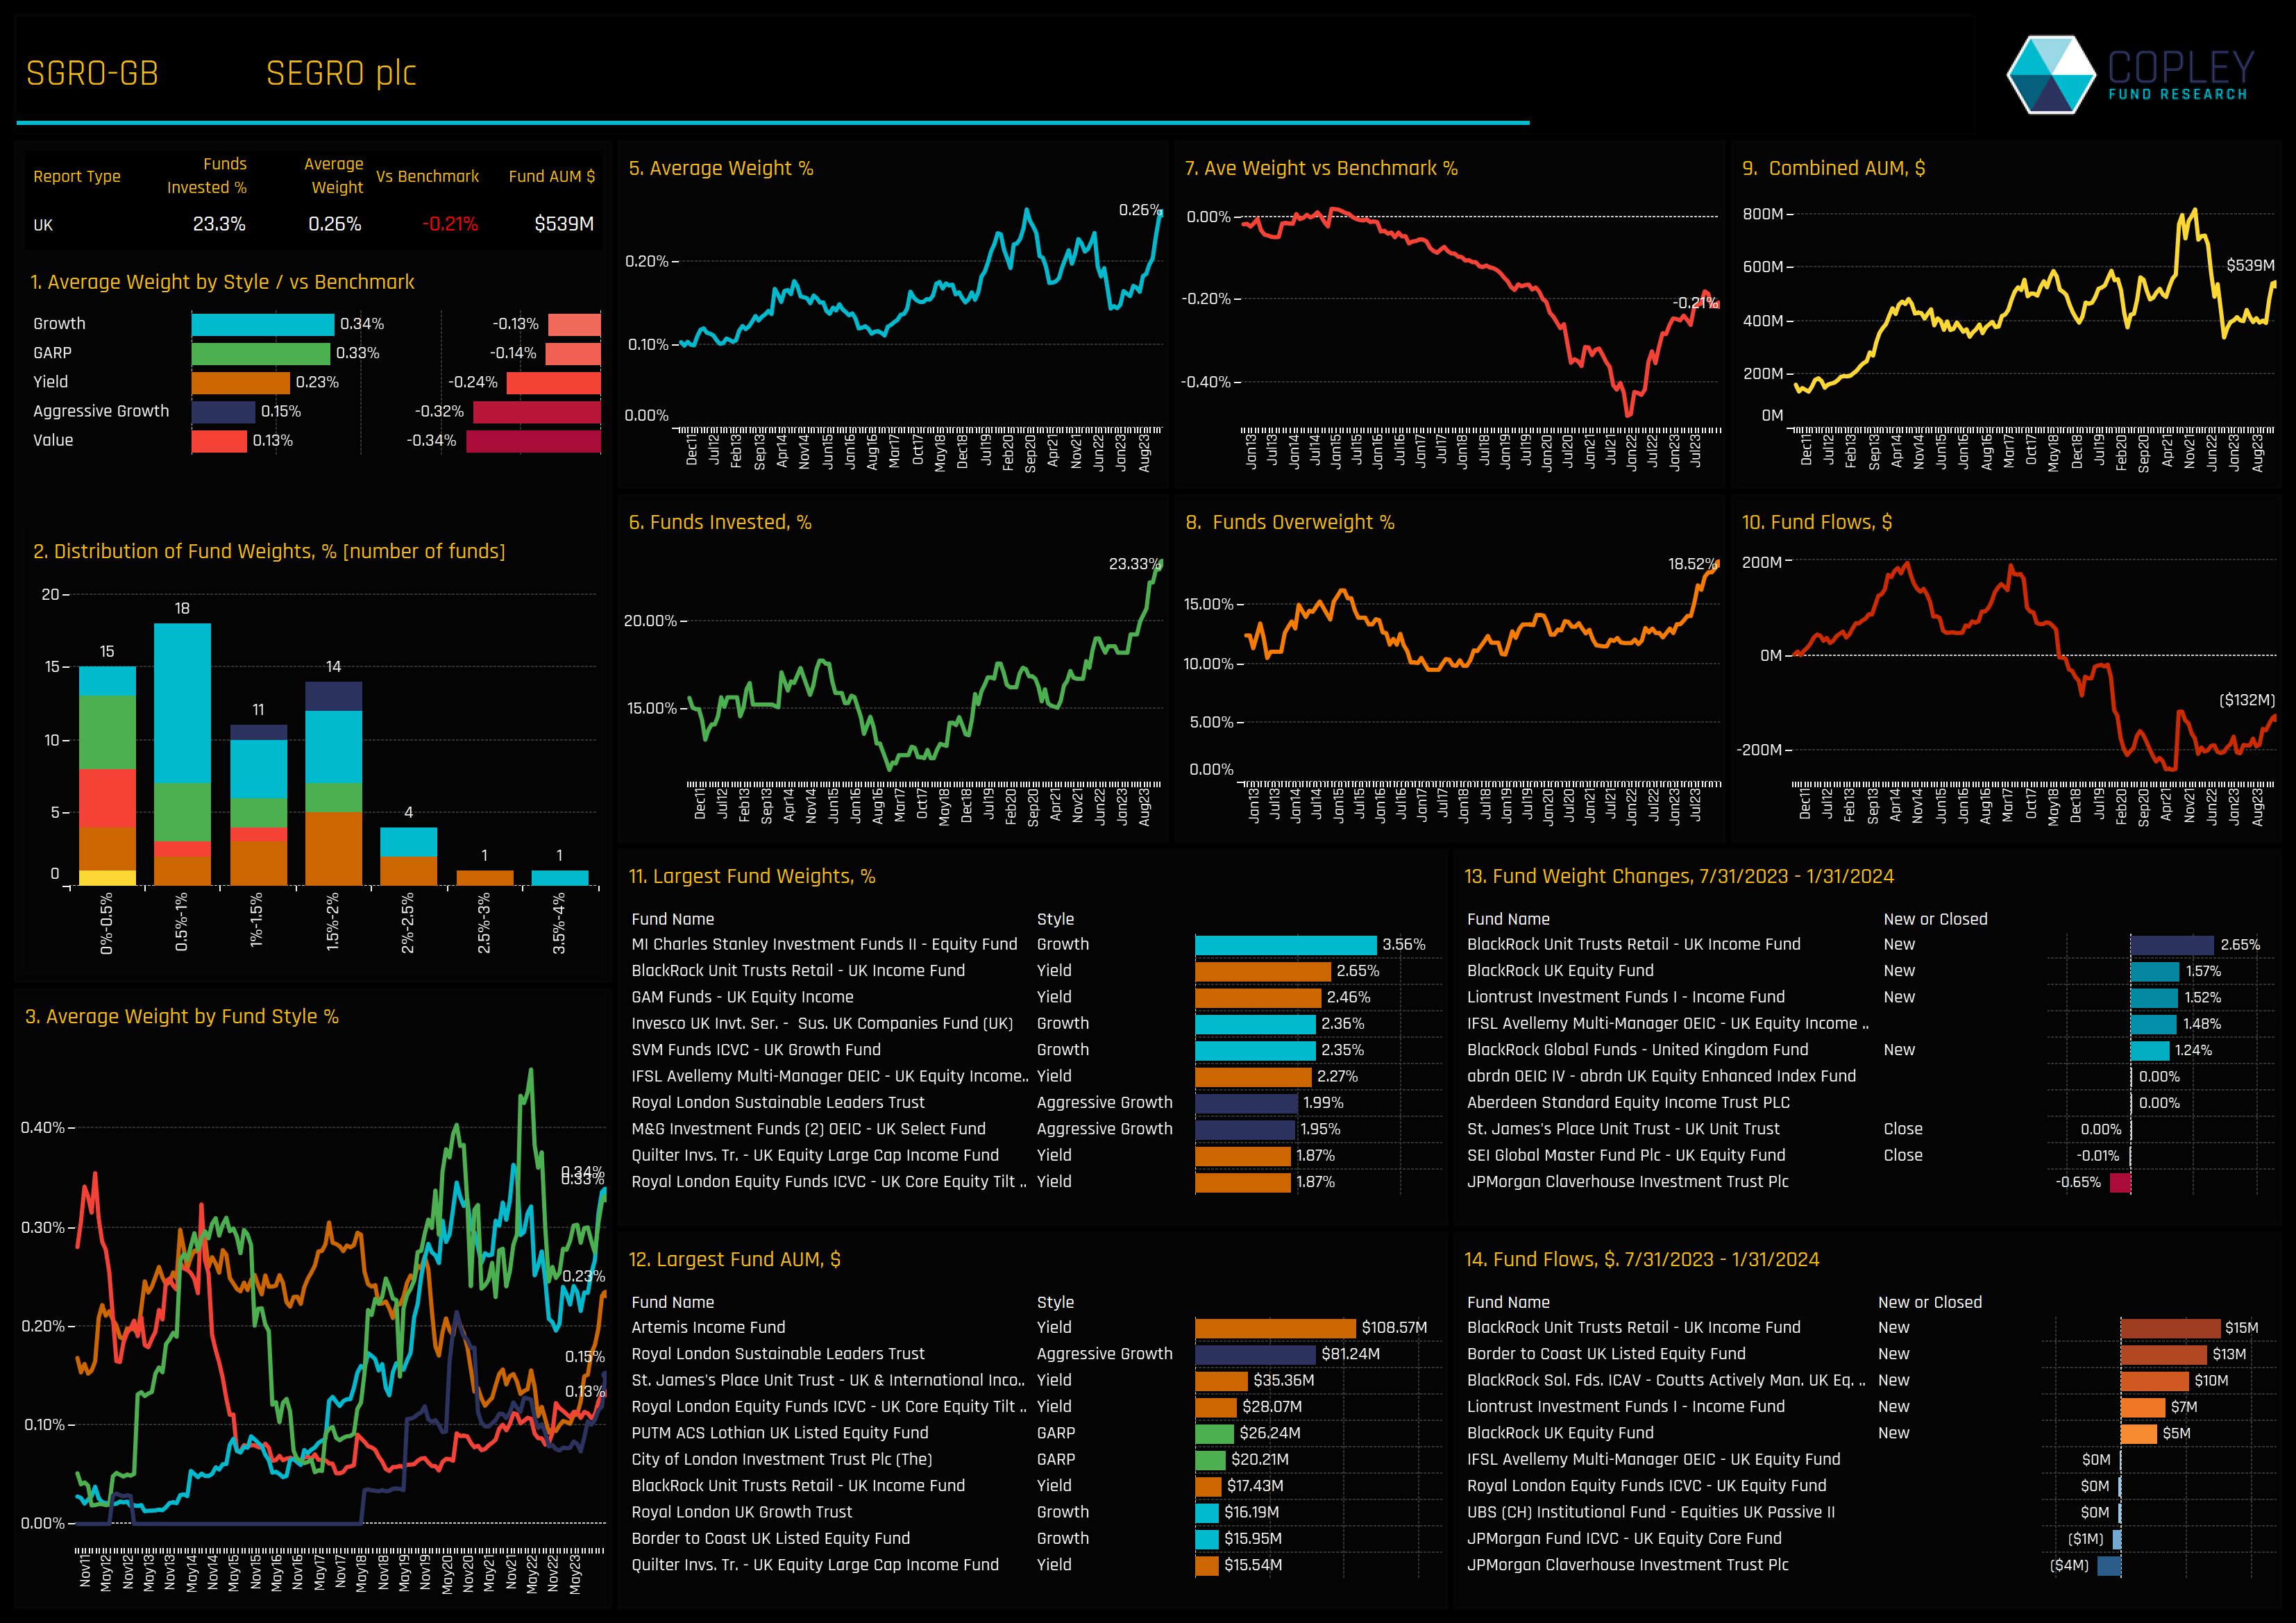
Stock Profile: SEGRO plc
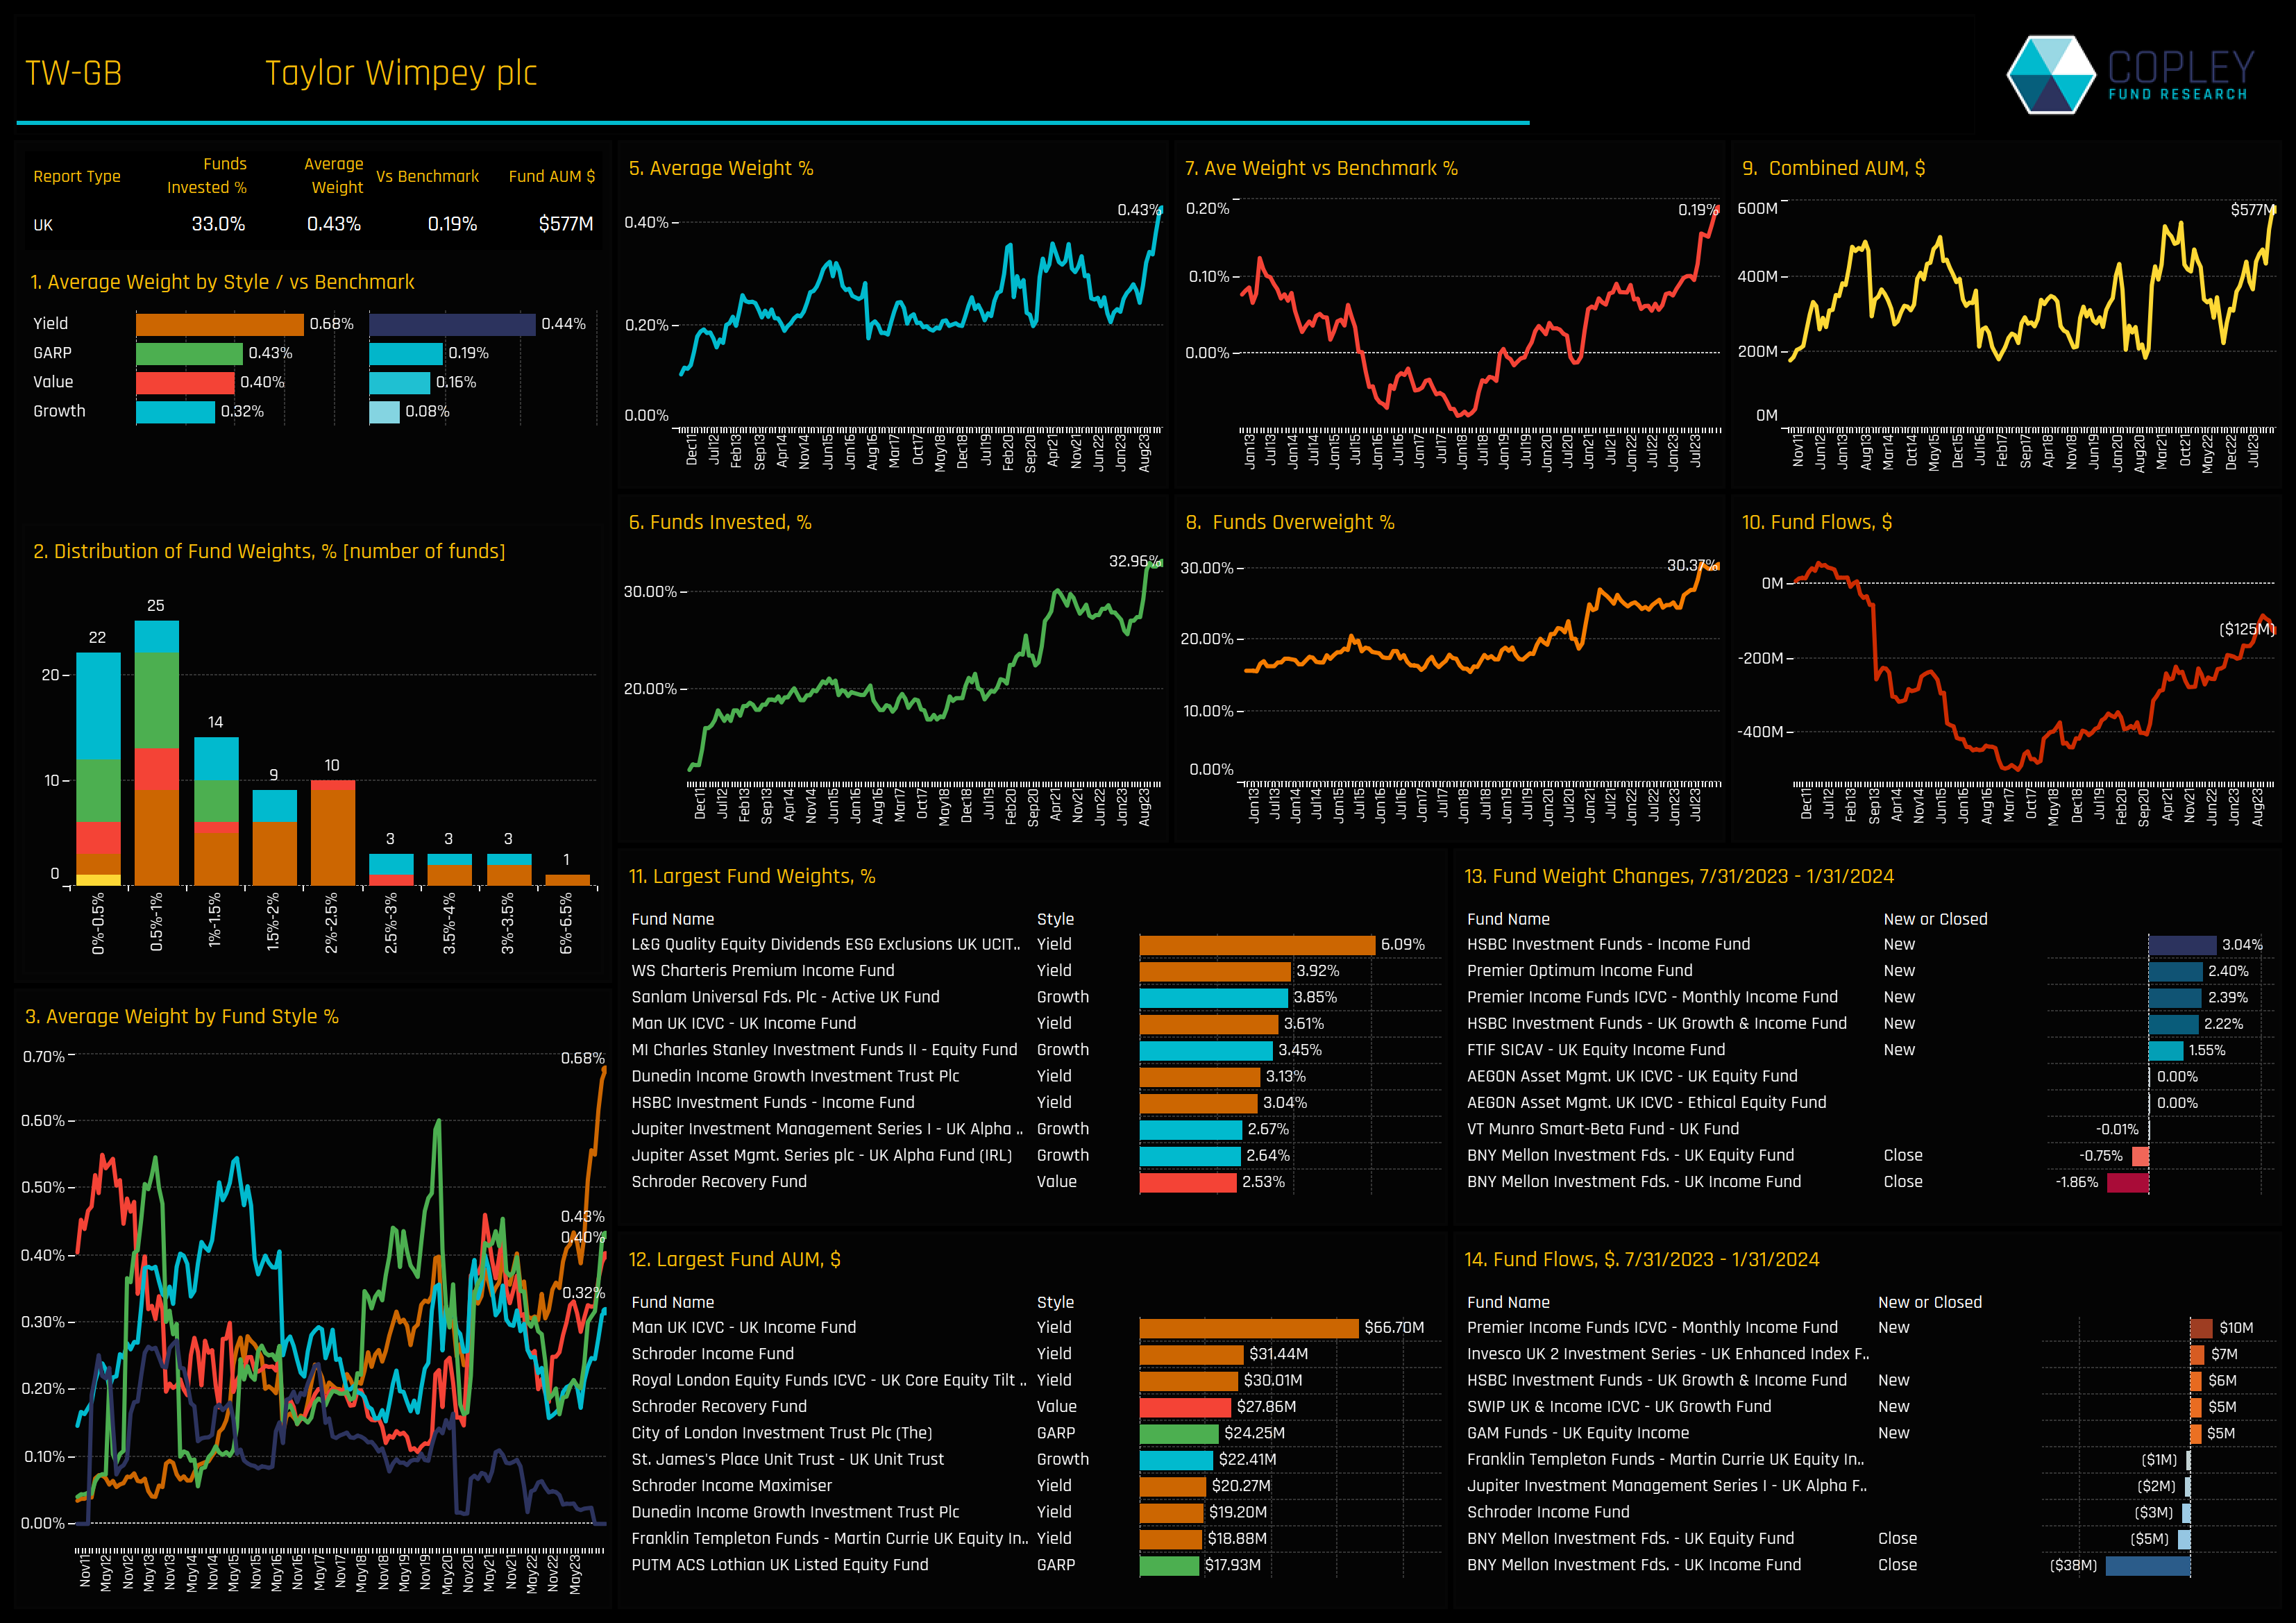
Stock Profile: Taylor Wimpey plc
Stock Profile: London Stock Exchange Group plc
Stock Profile: Pets At Home plc
Stock Profile: Natwest Group plc
Stock Profile: Ashtead Group plc
Stock Profile: Pennon Group plc
Stock Profile: Vodafone Group plc
Stock Profile: Synthomer plc
Stock Profile: McBride plc
270 UK Equity Funds, AUM $190bn
UK Fund Stock Activity Data
The latest stock activity data for UK equity funds over the last 6-months.
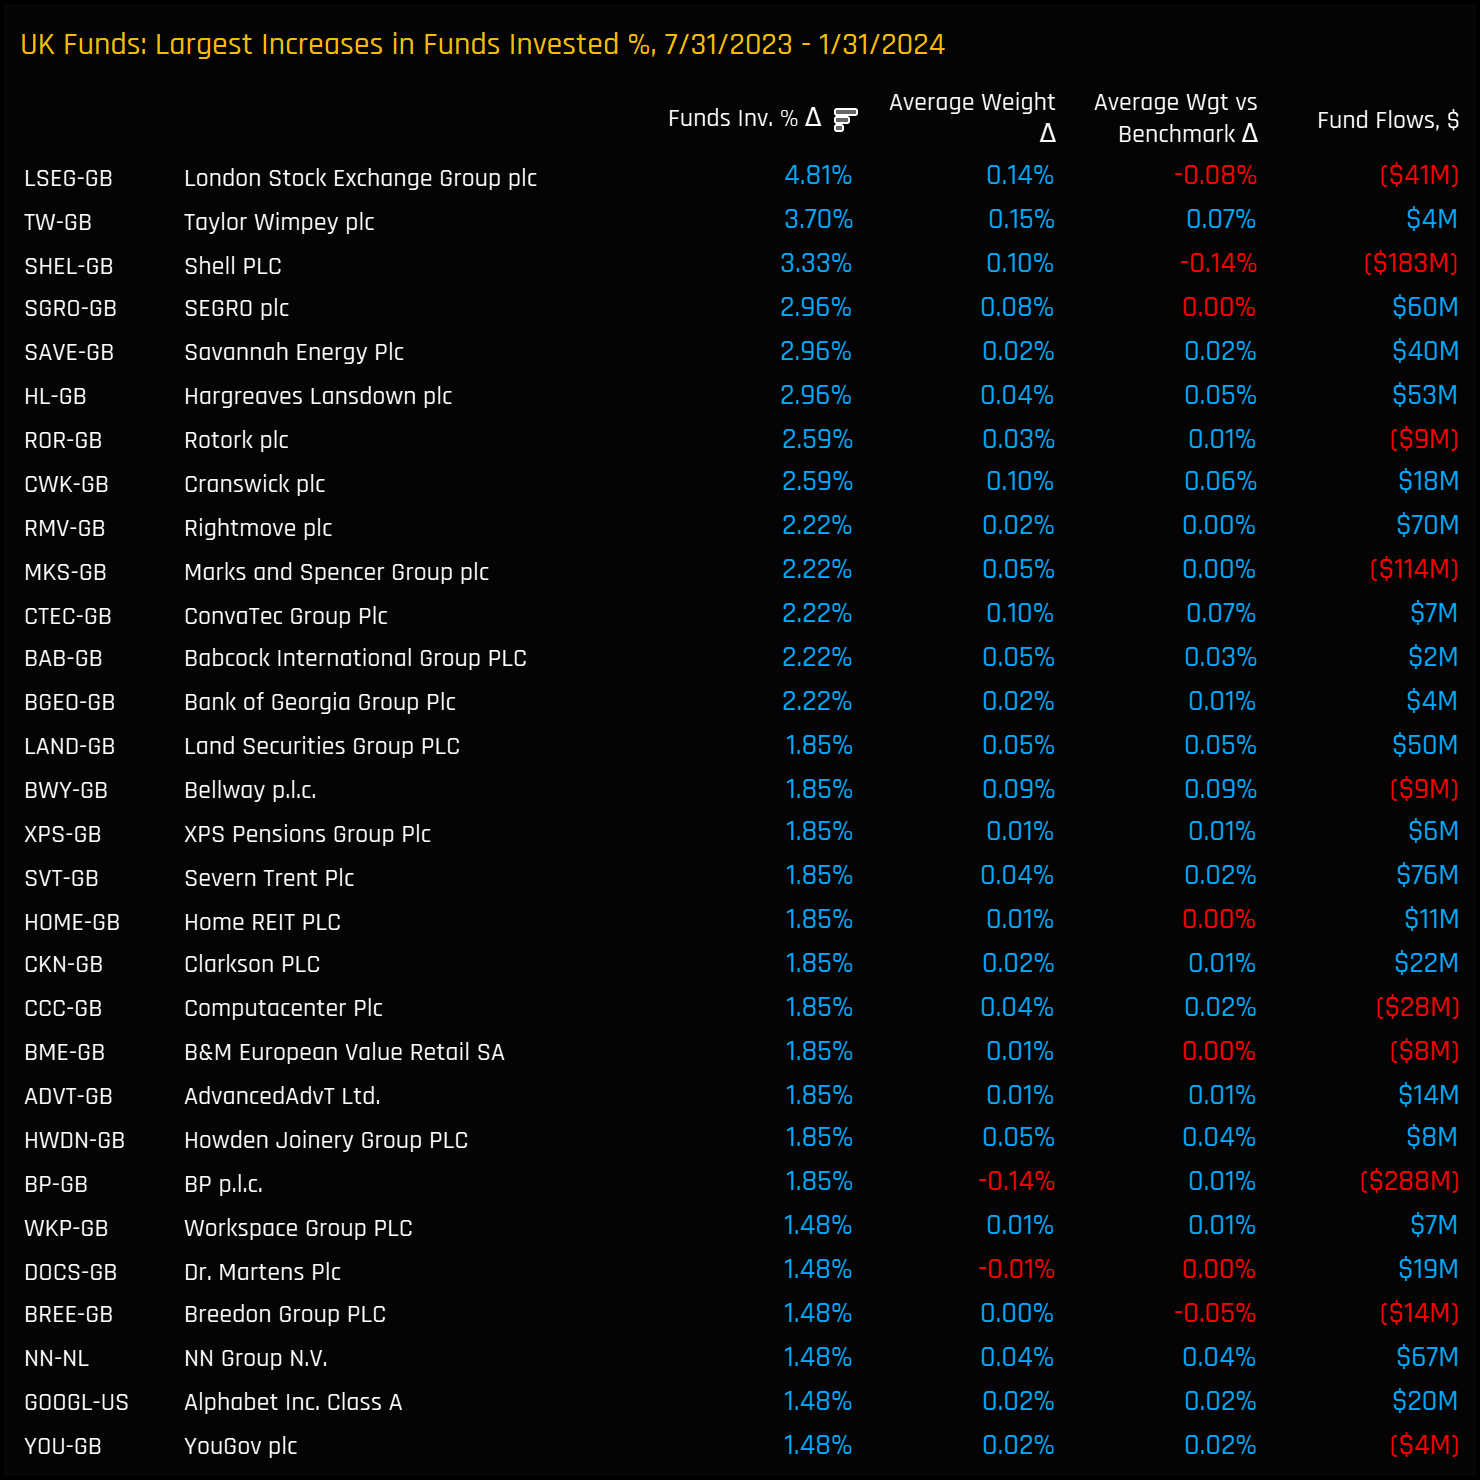
Largest Aggregate Increases in Ownership
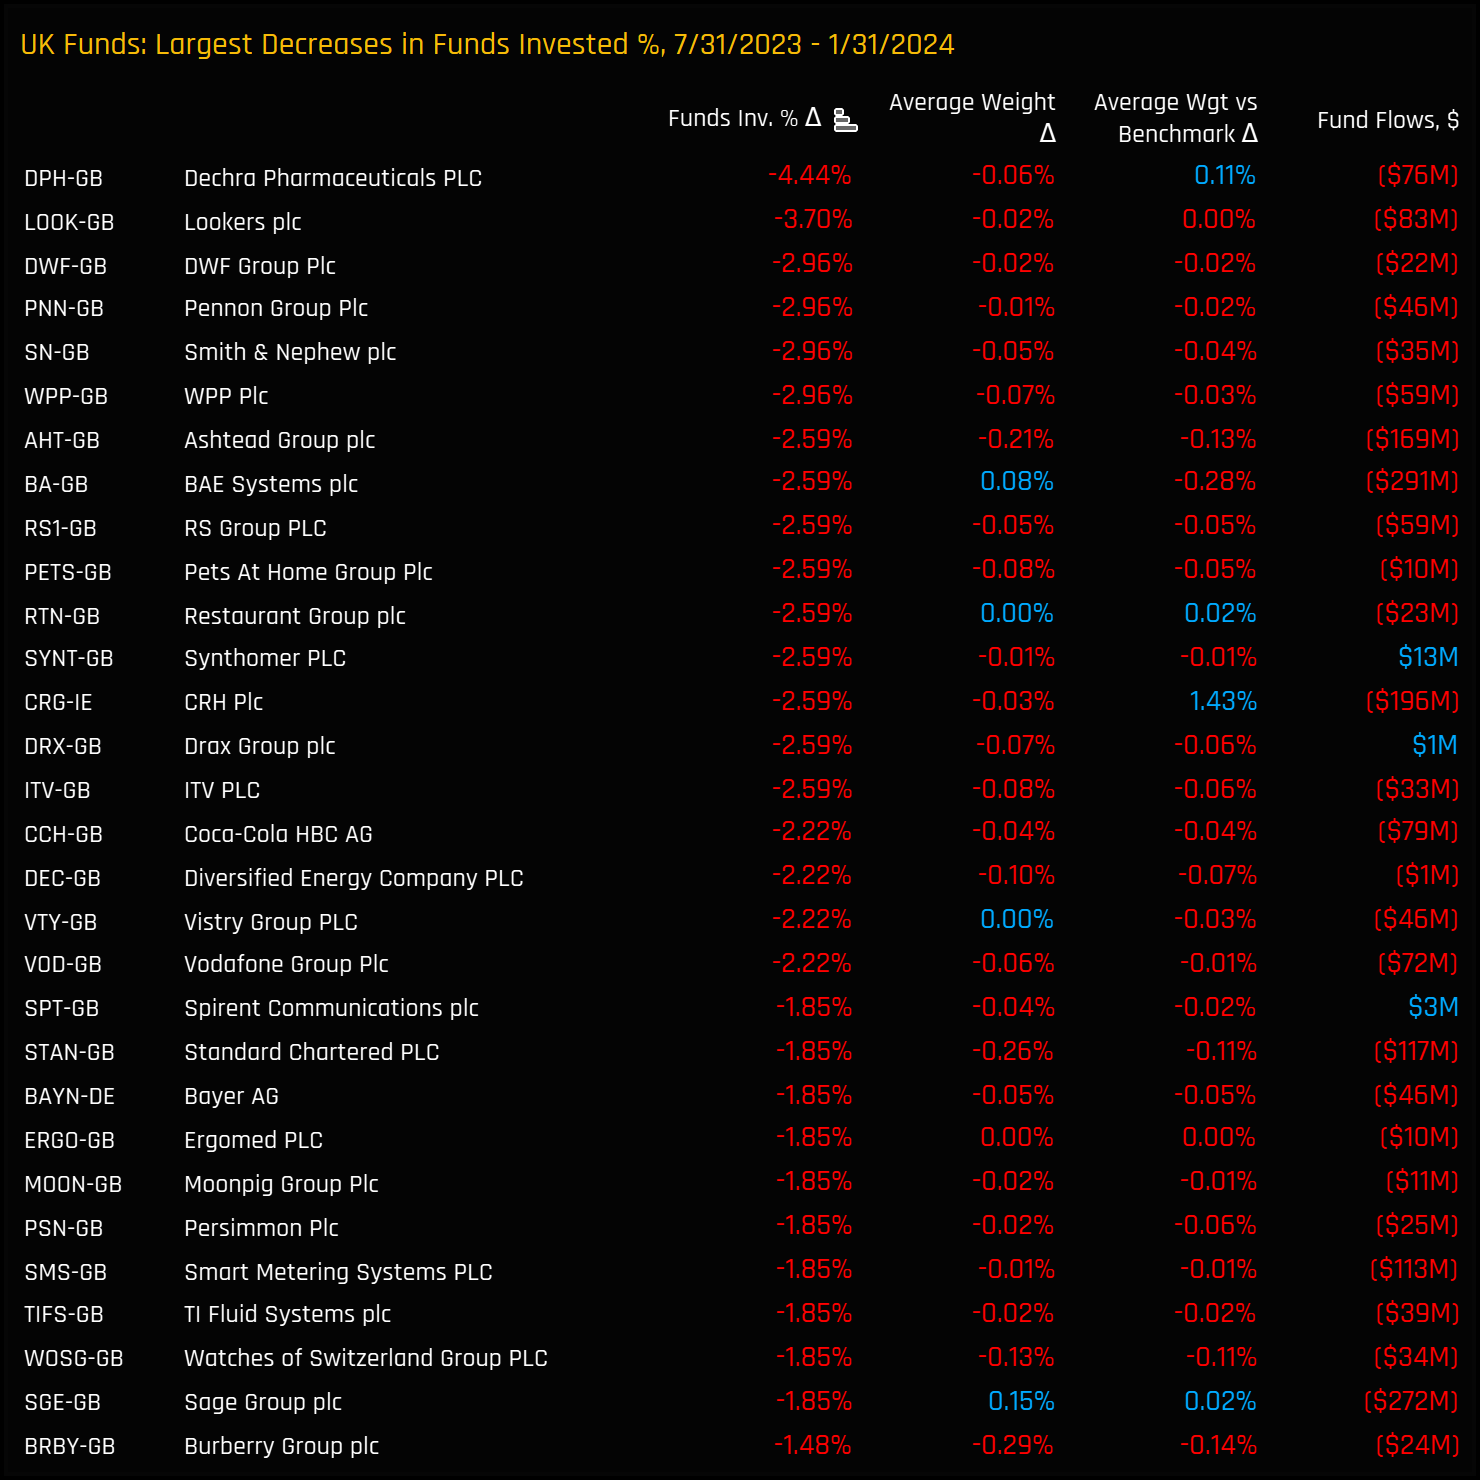
Largest Aggregate Decreases in Ownership
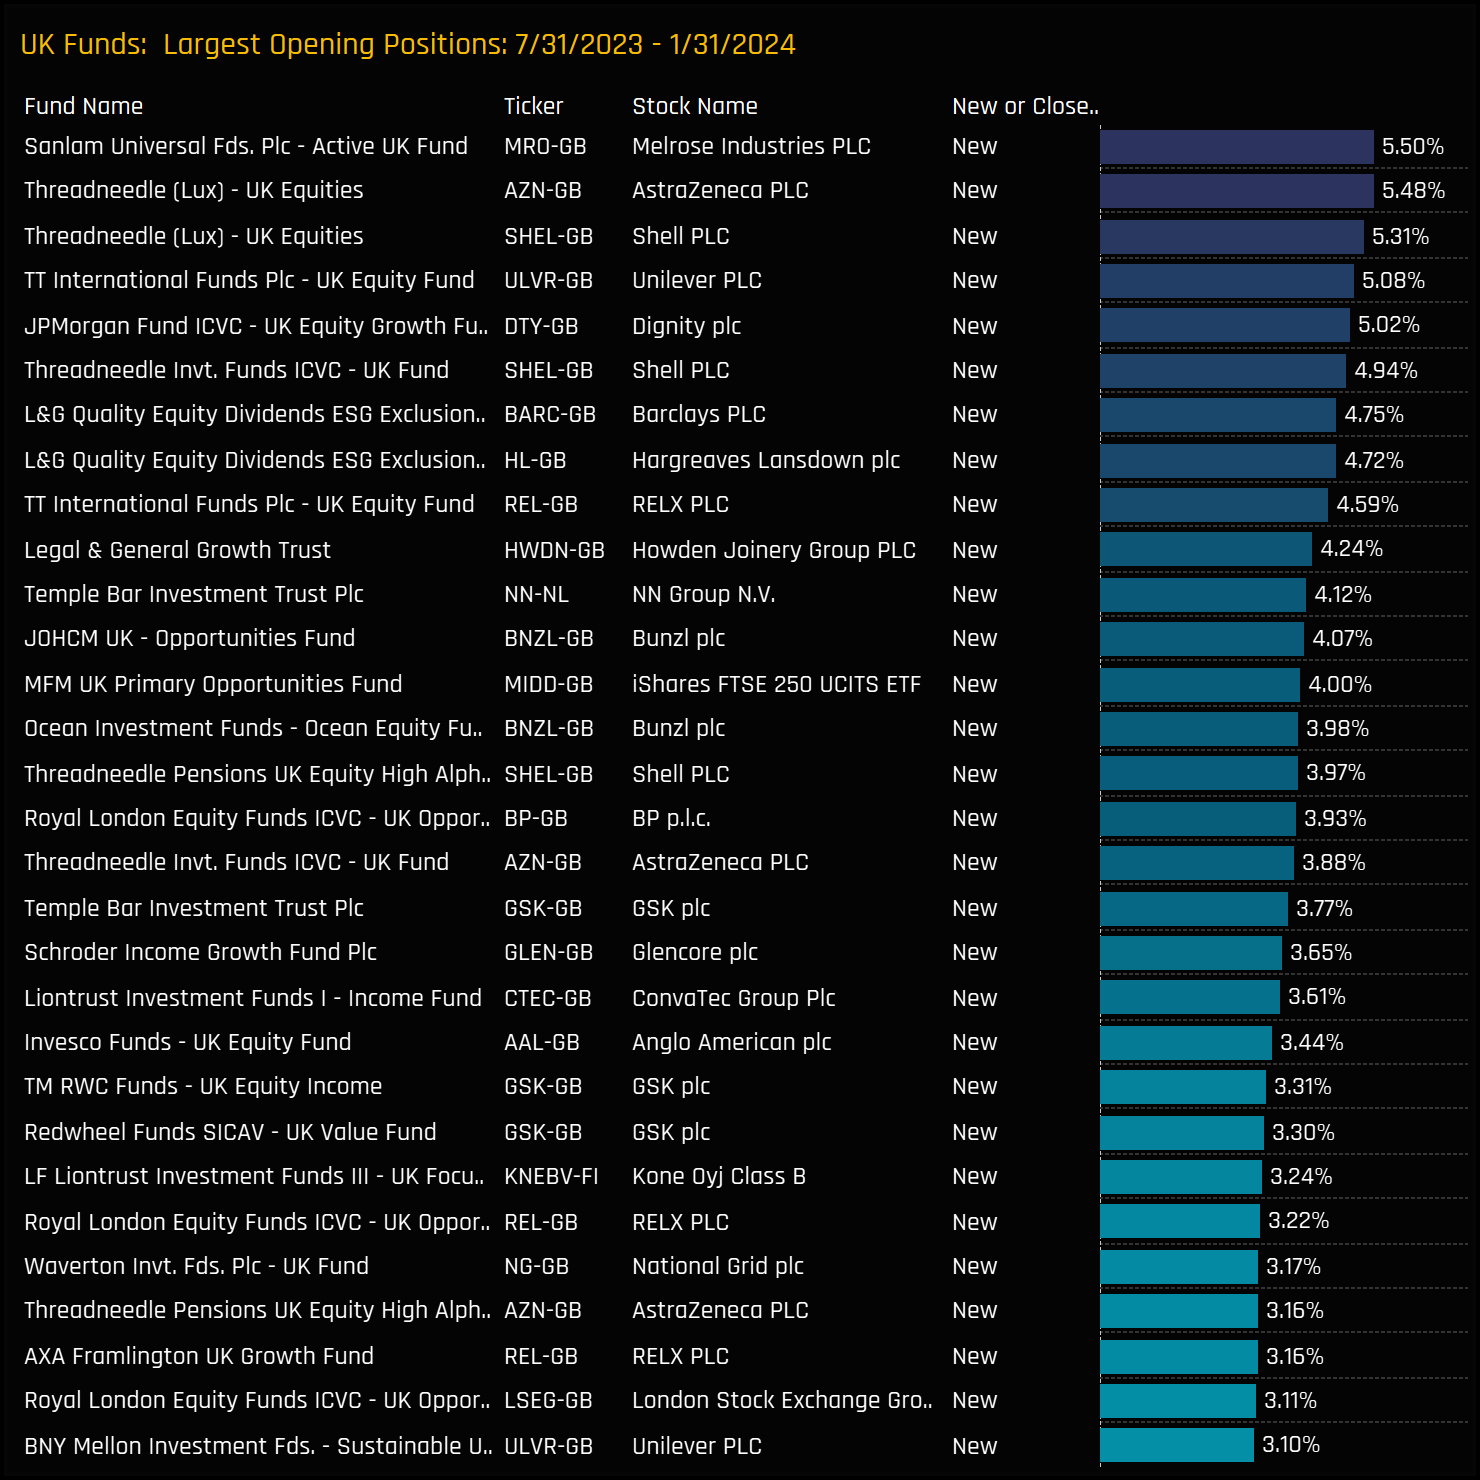
Largest Fund Level New Positions
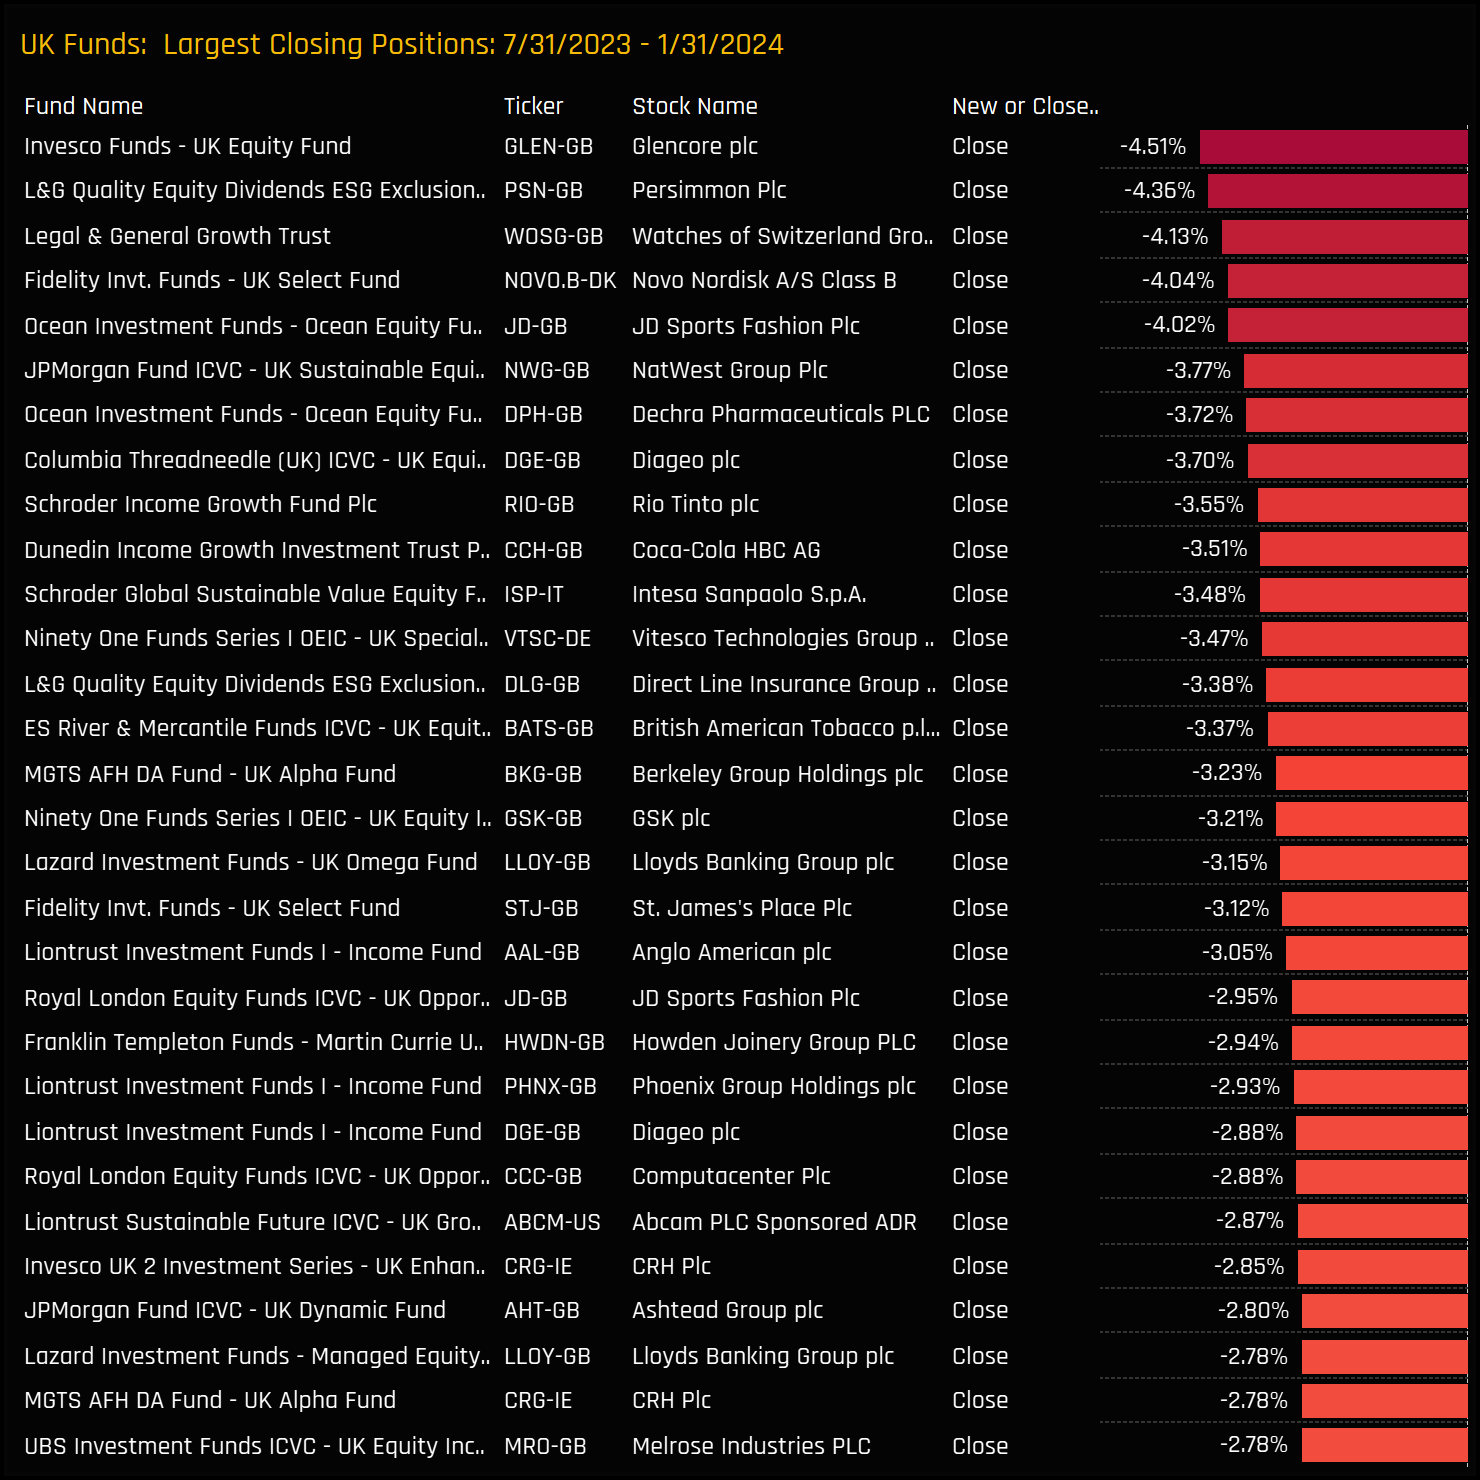
Largest Fund Level Closed Positions
270 UK Equity Funds, AUM $190bn
UK Equity Fund Positioning Report
Click on the link below for the full data report on fund positioning among the 270 UK funds in our analysis.
For more analysis, data or information on active investor positioning in your market, please get in touch with me on steven.holden@copleyfundresearch.com
Investor Positioning Report — Copley Fund Research Ltd · Last updated: July 2026 · Registered in England and Wales
1. Who we are
Copley Fund Research Ltd provides proprietary institutional fund intelligence to listed companies and investor relations professionals. These terms govern every purchase of an Investor Positioning Report. By completing a purchase you confirm you have read, understood, and agreed to these terms in full.
2. What you are purchasing
The Investor Positioning Report is a bespoke PDF report mapping the institutional fund universe around your stock. It covers current investors, past investors, competitor investors, and white space investors. Every report is built from scratch for the specific company ordered and is not a standardised or templated product.
3. Delivery and process
Following payment or invoice issuance, Copley Fund Research will contact you within one working day to agree your competitor set. Production begins once the competitor set is confirmed in writing. The completed report will be released to you within 48 hours of production starting, provided payment has been received in full; where payment is outstanding, the report will be withheld until payment clears. If the requested company falls outside our covered fund universes, or a competitor set cannot be agreed, Copley Fund Research will issue a full refund or cancel the outstanding invoice.
4. Competitor set agreement
The competitor set is agreed with you in writing prior to production, and the report is built to that agreed specification. Requests to amend the competitor set after delivery, based on a change of preference rather than an error, may be treated as a new order.
5. Refund policy
Because each report is produced individually for your company, orders are non-refundable once production has begun, except as set out in clauses 3 and 5a below. By purchasing, you agree not to dispute the charge with your card provider on the basis that the service was not as described, provided the report has been delivered to the agreed specification or corrected under clause 5a.
5a. Quality remedy
If a delivered report contains a material error caused by Copley Fund Research — for example, an incorrect company analysed, a competitor omitted from the agreed set, or content missing from the specification in clause 2 — Copley Fund Research will correct and redeliver the report at no additional charge, within a reasonable timeframe. This is your sole remedy for such errors.
6. Data and accuracy
All fund positioning data in the report reflects holdings as disclosed at the most recently available reporting date at the time of compilation. The timing of fund holdings disclosures is determined by regulatory requirements applicable to each fund and is outside the control of Copley Fund Research Ltd. This data may not reflect current fund positions. Copley Fund Research takes reasonable care to ensure accuracy but makes no warranty, express or implied, as to the completeness or current accuracy of the underlying data — though this does not affect the quality remedy in clause 5a for errors in how that data was analysed or presented. Past fund positioning is not indicative of future fund behaviour or investment decisions.
7. Not investment advice
The Investor Positioning Report is produced for investor relations intelligence purposes only. It does not constitute investment advice, financial advice, or a recommendation to buy, hold, or sell any security. The data reflects historical fund positioning and must not be relied upon as a prediction of future fund behaviour or investment decisions. Copley Fund Research Ltd is not authorised or regulated by the Financial Conduct Authority for the provision of investment advice.
8. Permitted use and confidentiality
The report is licensed for internal use by the purchasing organisation only. You may share it with employees and directors of your organisation. You may not: reproduce, redistribute, publish, or resell the report or any part of it; share it with any third party outside your organisation without prior written consent; use the fund or portfolio manager names contained in the report to approach those individuals on behalf of Copley Fund Research or in a manner that could damage Copley Fund Research's relationships with those funds; or use the data for any purpose other than your own investor relations strategy. The data, analysis, and methodology contained in the report are the intellectual property of Copley


