In this issue:
H1 Performance & Attribution
Softcat PLC: Record Overweight as UK Funds Buy In
UK Stock Radar: Haleon/Next/GSK/BATS
266 UK Equity Funds, AUM $179bn
H1 Performance & Attribution
A look at performance and the drivers of performance among active UK Equity Funds for the first half of 2023
Performance
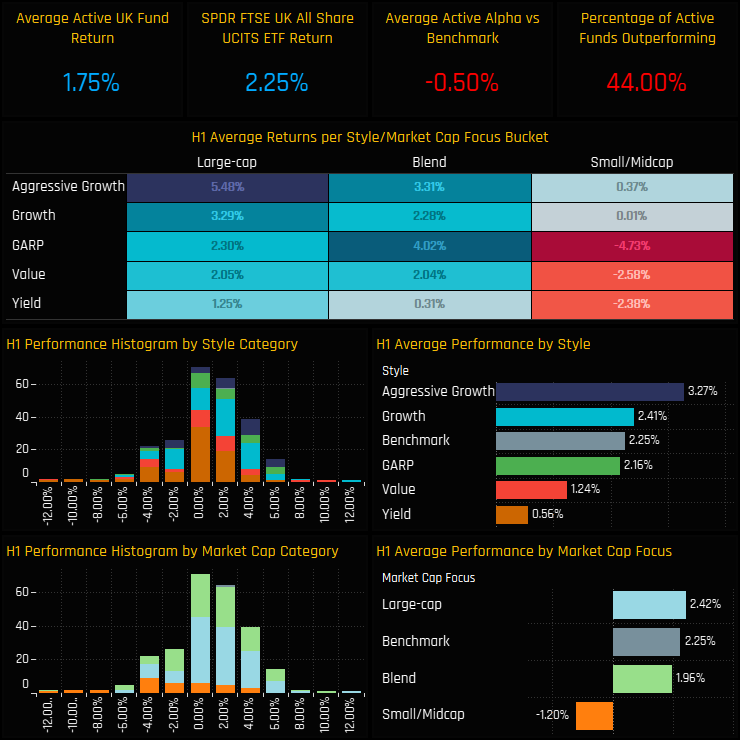
Active UK managers returned an average +1.75% in the first half of 2023, slightly behind the FTSE All Share ETF (FTAL) by -0.5% and with 44% of the 266 funds in our analysis outperforming. Returns were heavily effected by both Style and Market Cap Focus, with Aggressive Growth funds the outperformers on 3.27% against Yield on 0.56%. Small/Midcap strategies posted negative returns of -1.2% on average, with those at the Value end of the spectrum doing even worse.
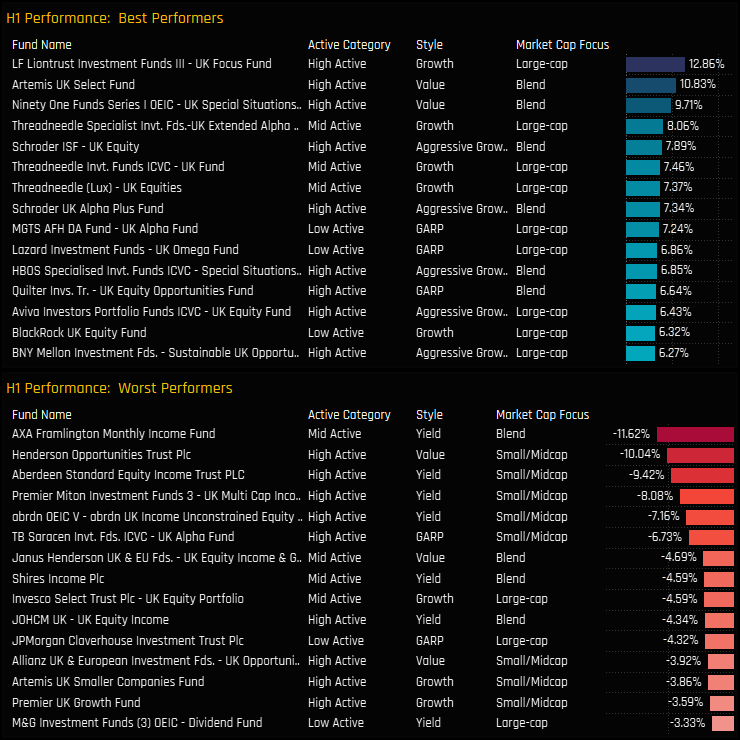
On a single fund level there were exceptions to the Style averages, with the Value strategies of Artemis UK Select (+10.83%) and Ninety One UK Special Situations (+9.71%) among the top performers, but behind LF Liontrust UK Focus on +12.86%. A host of Small/Midcap strategies fill the lower order, but the Blend/Yield strategy of Axa Framlington Income takes the wooden spoon, losing -11.6% over the first half of the year.
Performance Contribution & Attribution
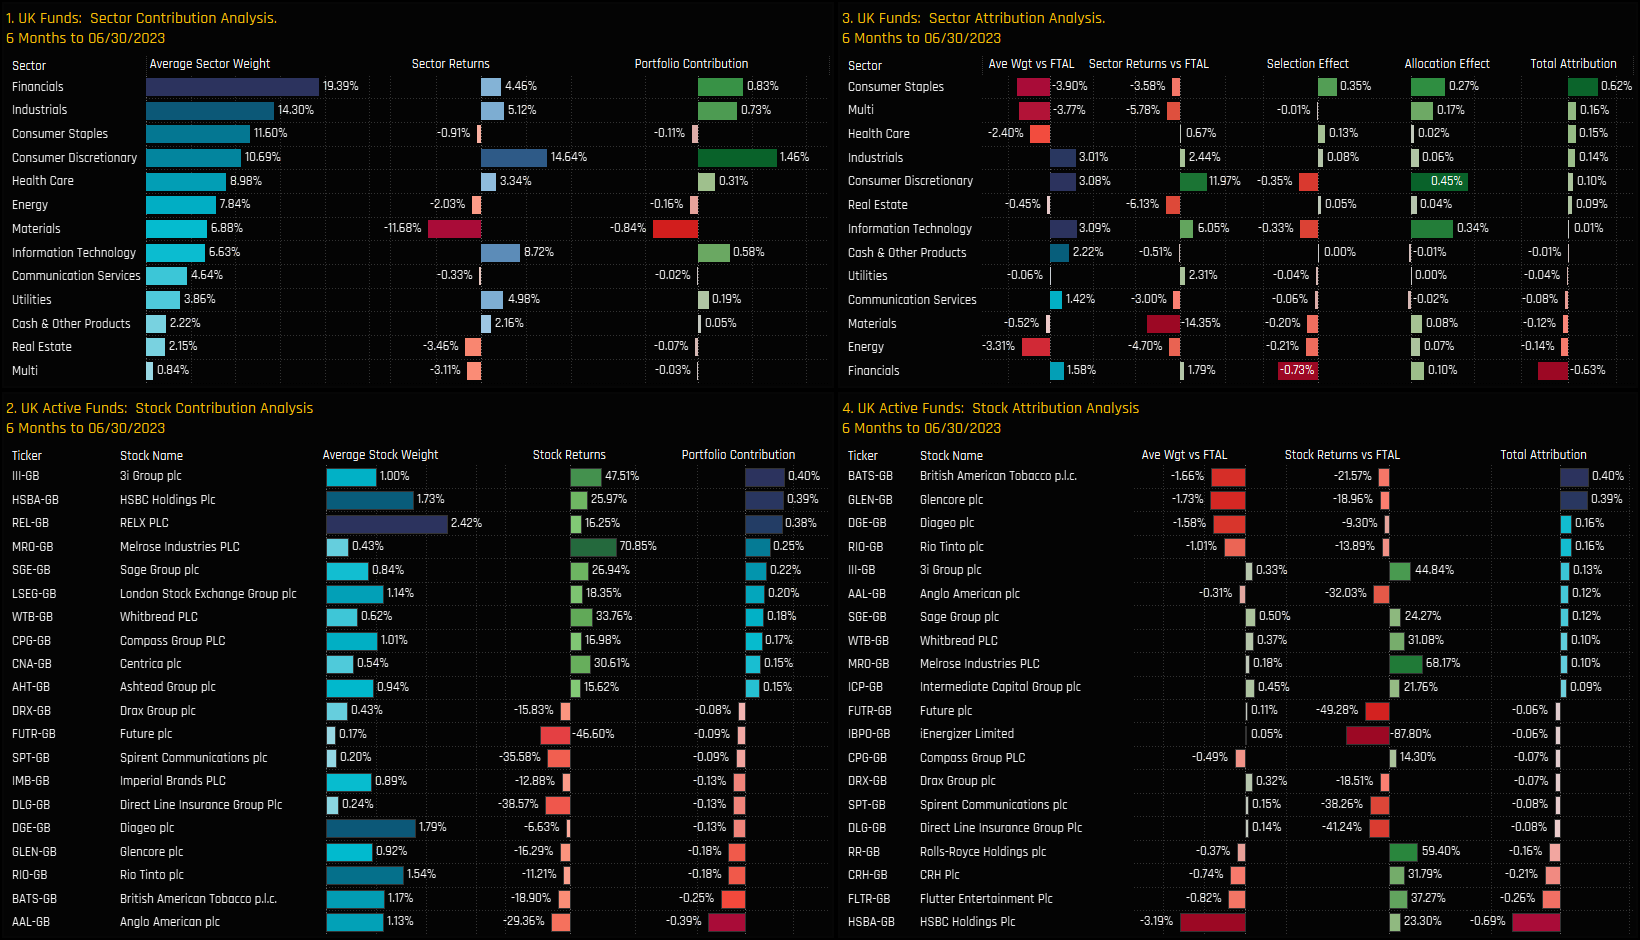
We perform attribution analysis on a portfolio based on the average allocations of the 266 active UK funds in our analysis, versus a representation of the benchmark based on the SPDRs FTSE All Share ETF.
The moderately positive returns among UK active managers was driven by strong performance in the Consumer Discretionary and Technology sectors, which contributed +1.45% and +0.58% to Q1 returns respectively. Positive returns from the top sector weights of Financials and Industrials also contributed a combined +1.56% to H1 returns, offsetting -0.84% from losses in the Materials sector. Exposure to 3i Group, HSBC Holdings and RELX contributed the most on a stock level, whilst negative returns from Anglo American and British American Tobacco dragged on quarterly performance.
From an attribution perspective, good stock selection and a net underweight in the Consumer Staples sector generated +0.62% of relative outperformance over the period. Overweights in Consumer Discretionary and Information Technology were the right call, but poor stock selection offset the majority of the gains. Of the detractors to performance, poor stock selection in the Financials sector was the standout, losing -0.73% of performance against the SPDRs FTSE All Share ETF. On a stock level, underweights in Glencore, British American Tobacco and Diageo plc performed well, whilst underweights in HSBC, Flutter Entertainment, CRH Plc and Rolls Royce were costly to active UK managers over H1 2023.
Long Term Performance
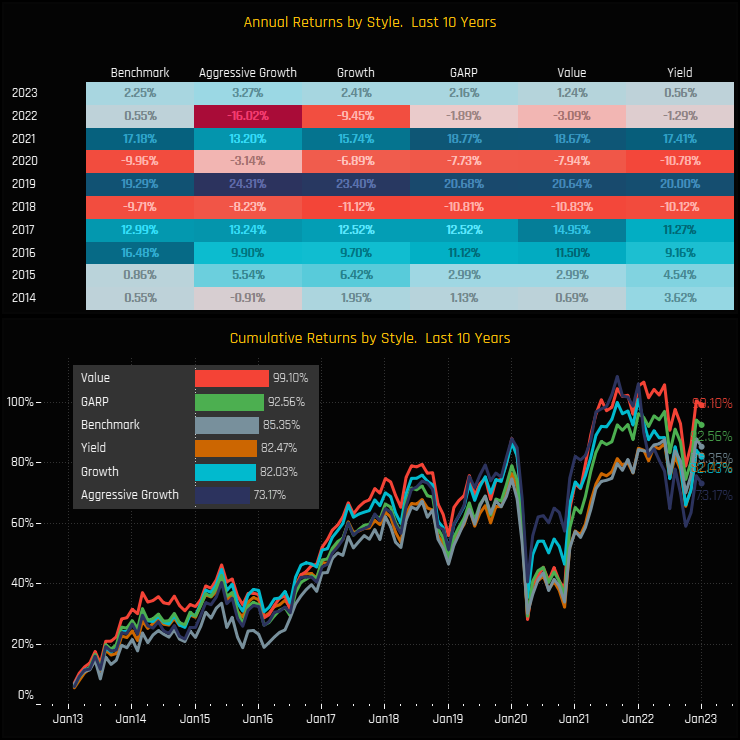
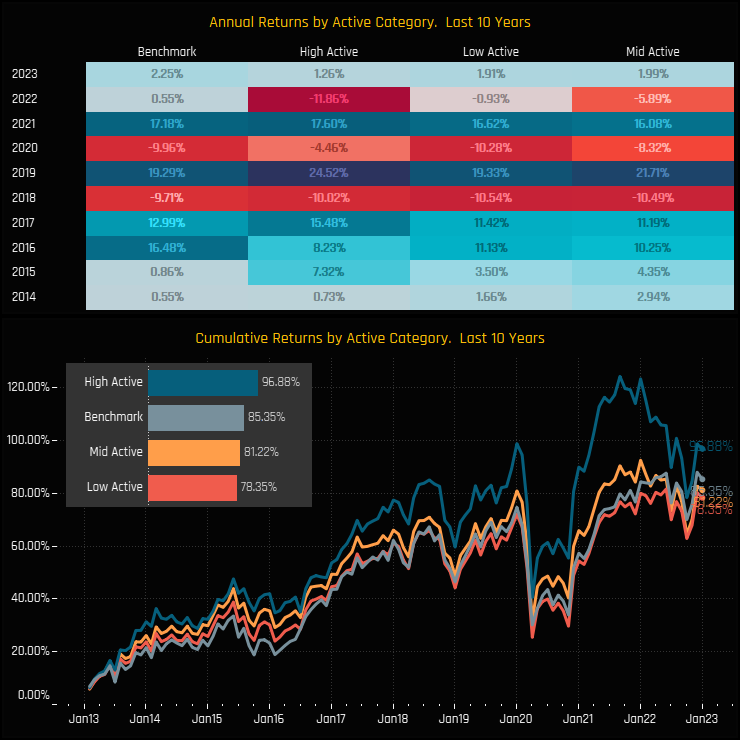
Over the past 10-years, returns have been largely correlated to fund Style. Value funds are the top performers with returns of 99.1% (in USD) and GARP on 92.6%, both ahead of the SPDRs FTSE All Share ETF Benchmark’s return of 85.4%. After 2022’s annus horribilis, Aggressive Growth and Growth managers lost their performance advantage, with both now underperforming the benchmark and peers over the 10-year period.
Split by the ‘activeness’ of the fund, things look good for those with a less benchmark centric approach. High Active funds – those with active shares versus the FTSE All Share Index of >75% have beaten then benchmark by over 10%, whilst Mid Active (60%<active share<75%) and Low Active (active share <60%) have underperformed over the longer term.
266 UK Equity Funds, AUM $179bn
Softcat PLC: Record Overweight as UK Managers Buy In
Ownership levels hit new highs as active UK managers increase exposure.
Time-Series & Tech Stock Positioning
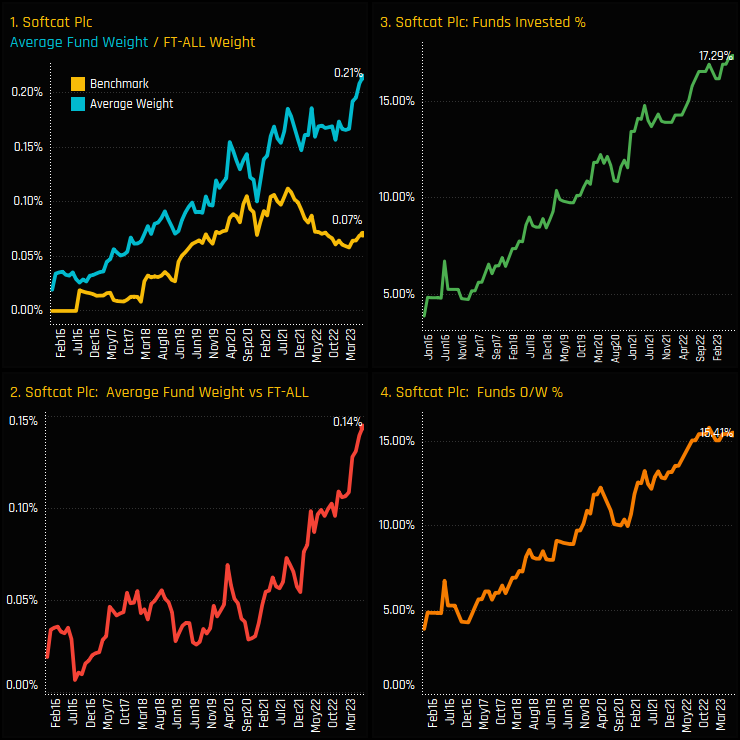
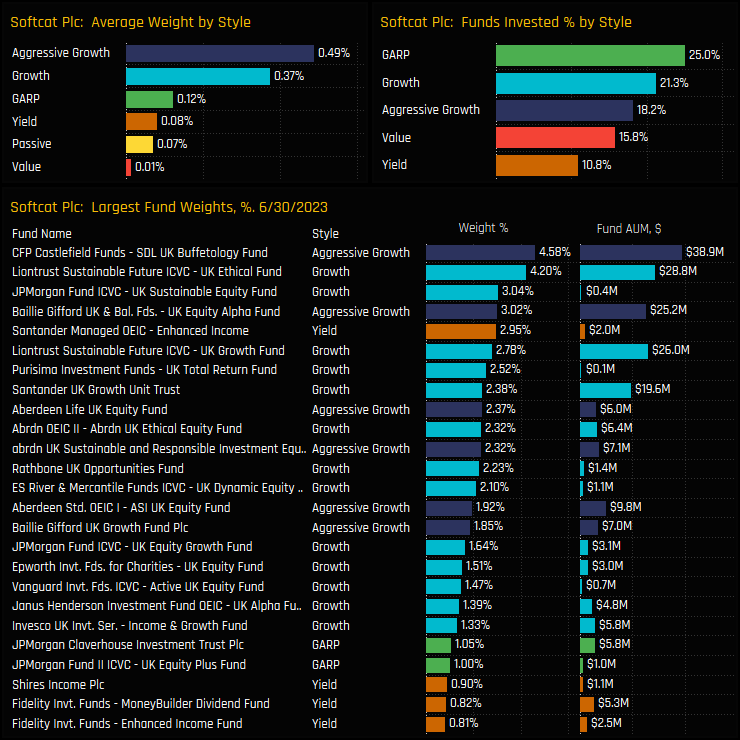
UK Fund exposure in Softcat PLC has reached new highs. The percentage of UK funds invested in Softcat PLC now stands at a record 17.3% (ch3) after seeing an almost linear growth in investment over the past decade. This has pushed average holding weights to 0.21%, breaking away from the FTSE All Share index weight in recent months to place active managers at record overweights of +0.14% (ch1&2).
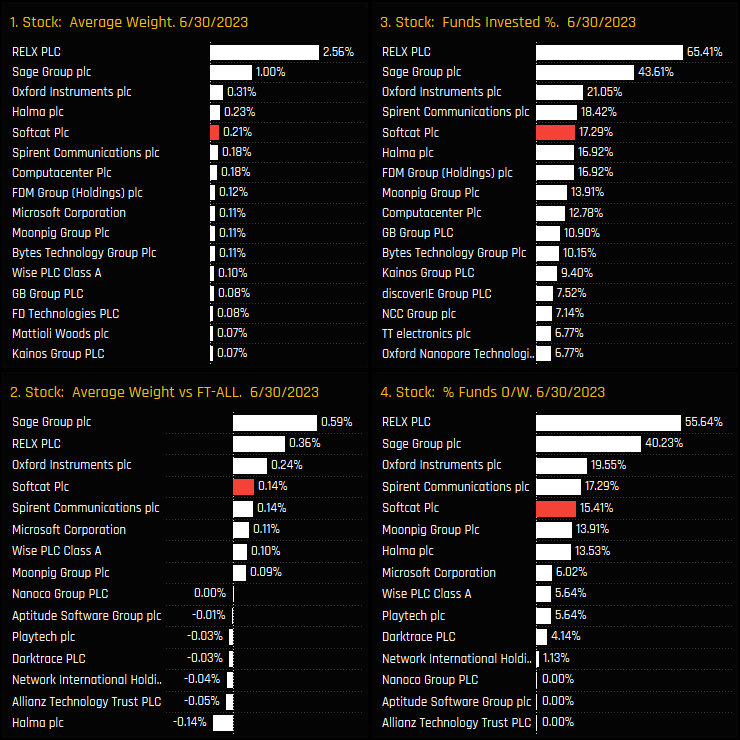
The below charts show our ownership statistics for stocks in the UK Information Technology sector. The recent ownership surge has moved Softcat PLC to the 5th most widely held Technology stock in the UK, sharing similar ownership characteristics to Spirent Communications, Halma PLC and Oxford Instruments. The sector leaders by some distance are RELX PLC and Sage Group PLC.
Fund Holdings
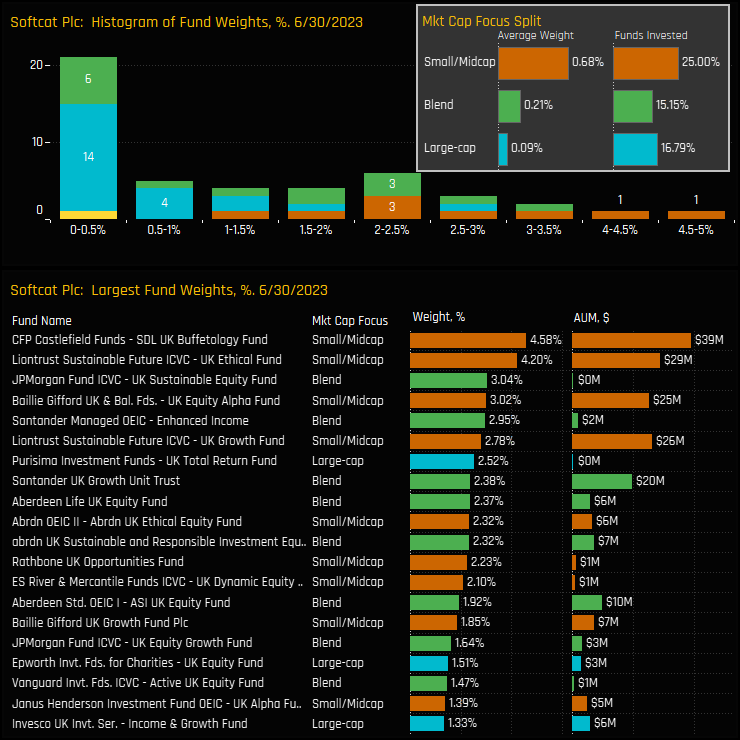
The distribution of fund weights in Softcat in the top chart below shows that most strategies hold less than a 0.5% weight, though higher conviction positions top out with Castlefield UK Buffetology (4.58%) and Liontrust UK Ethical (4.2%). Small/Midcap strategies are the most prominent holders on account of Softcat’s FTSE 250 status, but Large Cap and Blend funds do have some skin in the game. A quarter of the Small/Midcap strategies in our UK analysis hold exposure to Softcat at an average weight of 0.68%.
In terms of Style, Softcat’s appeal to high growth managers is evident in the charts below, with Aggressive Growth and Growth funds the larger allocators on average, and Value/Yield almost non-existent. The prominence of GARP funds, with 25% of funds invested infers that this growth isn’t unreasonably priced. The list of top holders in the bottom chart is dominated by high growth strategies.
Conclusions & Data Report
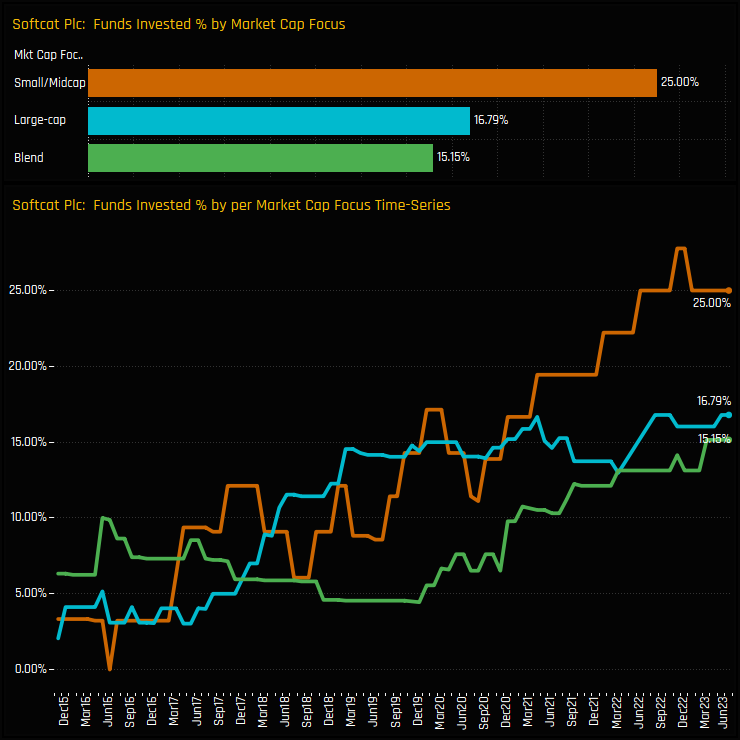
The chart to the right shows the percentage of funds invested in Softcat over time for each of our Market Cap Focus categories. Given Softcat’s market capitalization of <£3bn, the growth in exposure among Small/Midcap strategies is understandable. The fact that exposure is also at record highs among Largecap funds highlights Softcat’s appeal as a genuine alternative to the more established large-cap companies in the UK market.
But whilst investment growth in Softcat has been impressive, there is clearly room for ownership to move higher from here. Remember, over 80% of the 266 UK Equity funds in our analysis still do not hold a position. With Softcat approaching the boundaries of FTSE 100 inclusion, it’s not hard to envisage investment levels moving higher from here.
Click on the link below for an extended data report on Softcat PLC positioning among active UK Equity Funds.
Investment levels among the thousands of stocks in the investible UK universe differ greatly. Some stocks are widely owned, others largely avoided with ownership levels changing every month. We combine current and historical positioning against shorter-term manager activity to get a handle on where sentiment lies for every stock in our UK analysis. We highlight 8 stocks at the extreme ends of their own positioning ranges whilst also seeing significant changes in fund ownership.
The Sentiment Grid
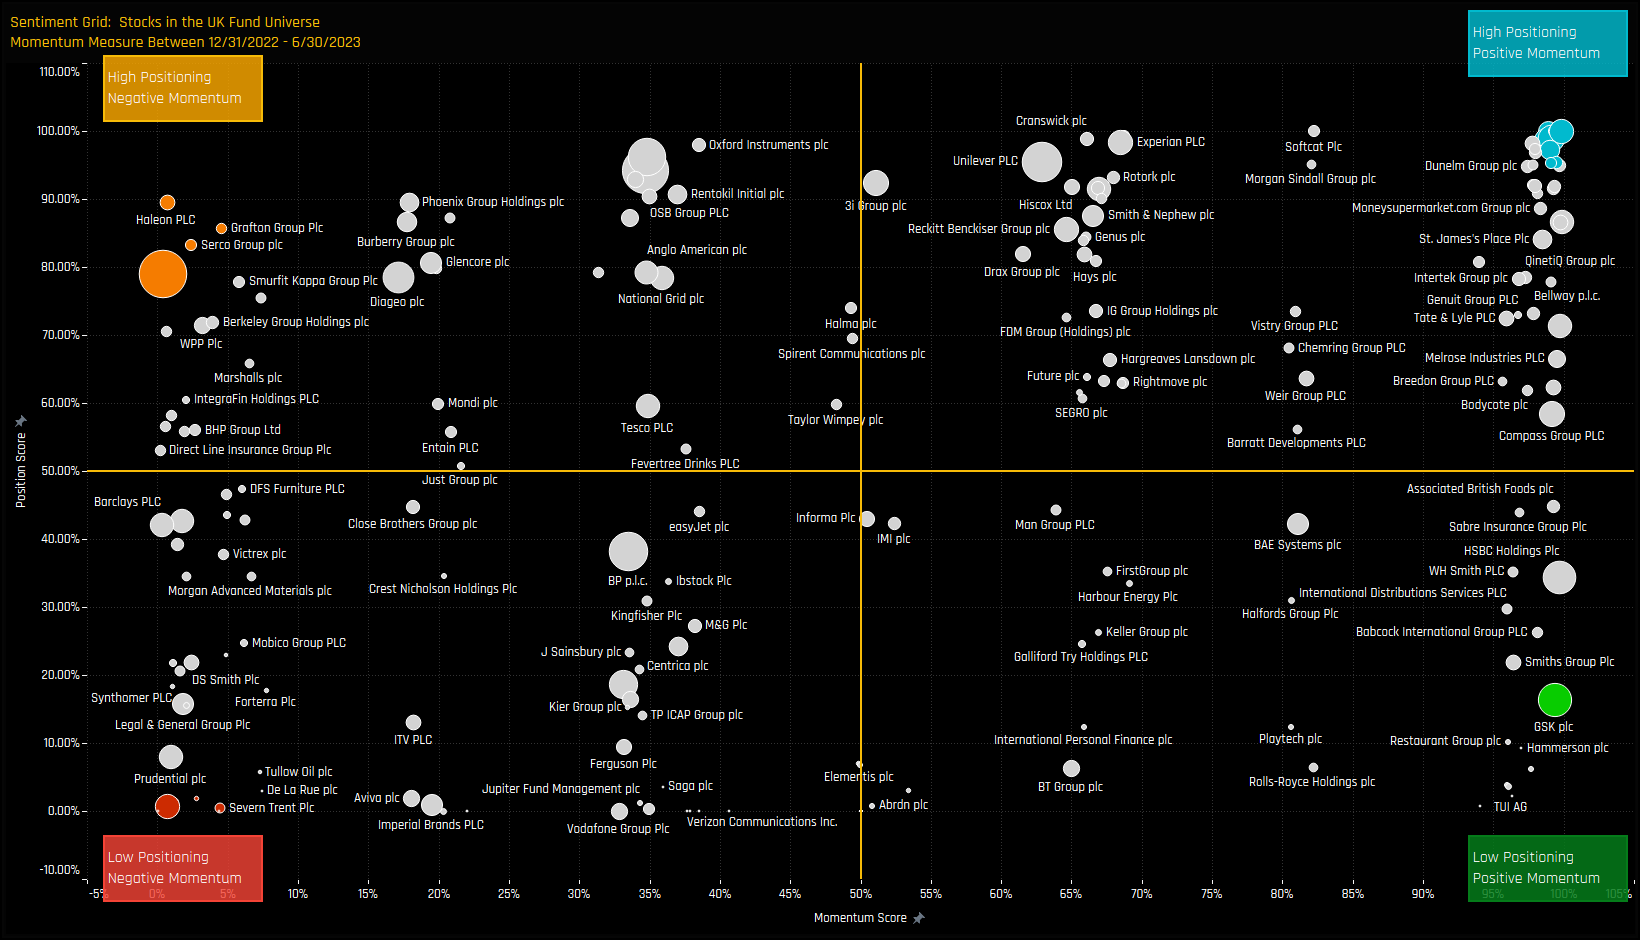
The Sentiment Grid below is designed to visualize the interplay between current fund positioning, long-term fund positioning and shorter-term fund manager activity for all stocks in the UK active fund universe. The Y-axis shows the ‘Position Score’, a measure of current positioning in each stock compared to its own history going back to 2012 on a scale of 0-100%. It takes in to account the percentage of funds invested in each stock versus history, the average fund weight versus history and the percentage of funds overweight the benchmark versus history. The higher the number, the more heavily a stock is owned by active Global managers compared to its own history.
The X-Axis shows the ‘Momentum Score’, a measure of fund manager activity for each stock between 11/30/2022 and 05/31/2023 on a scale of 0% (maximum negative activity) to 100% (maximum positive activity). The Momentum Score takes in to account the change in the percentage of funds invested in each stock over the period, the change in average weight and the change in the percentage of funds overweight. The chart also highlights the companies at the extreme ends of each quadrant by colour, which will shall explore in more detail below.
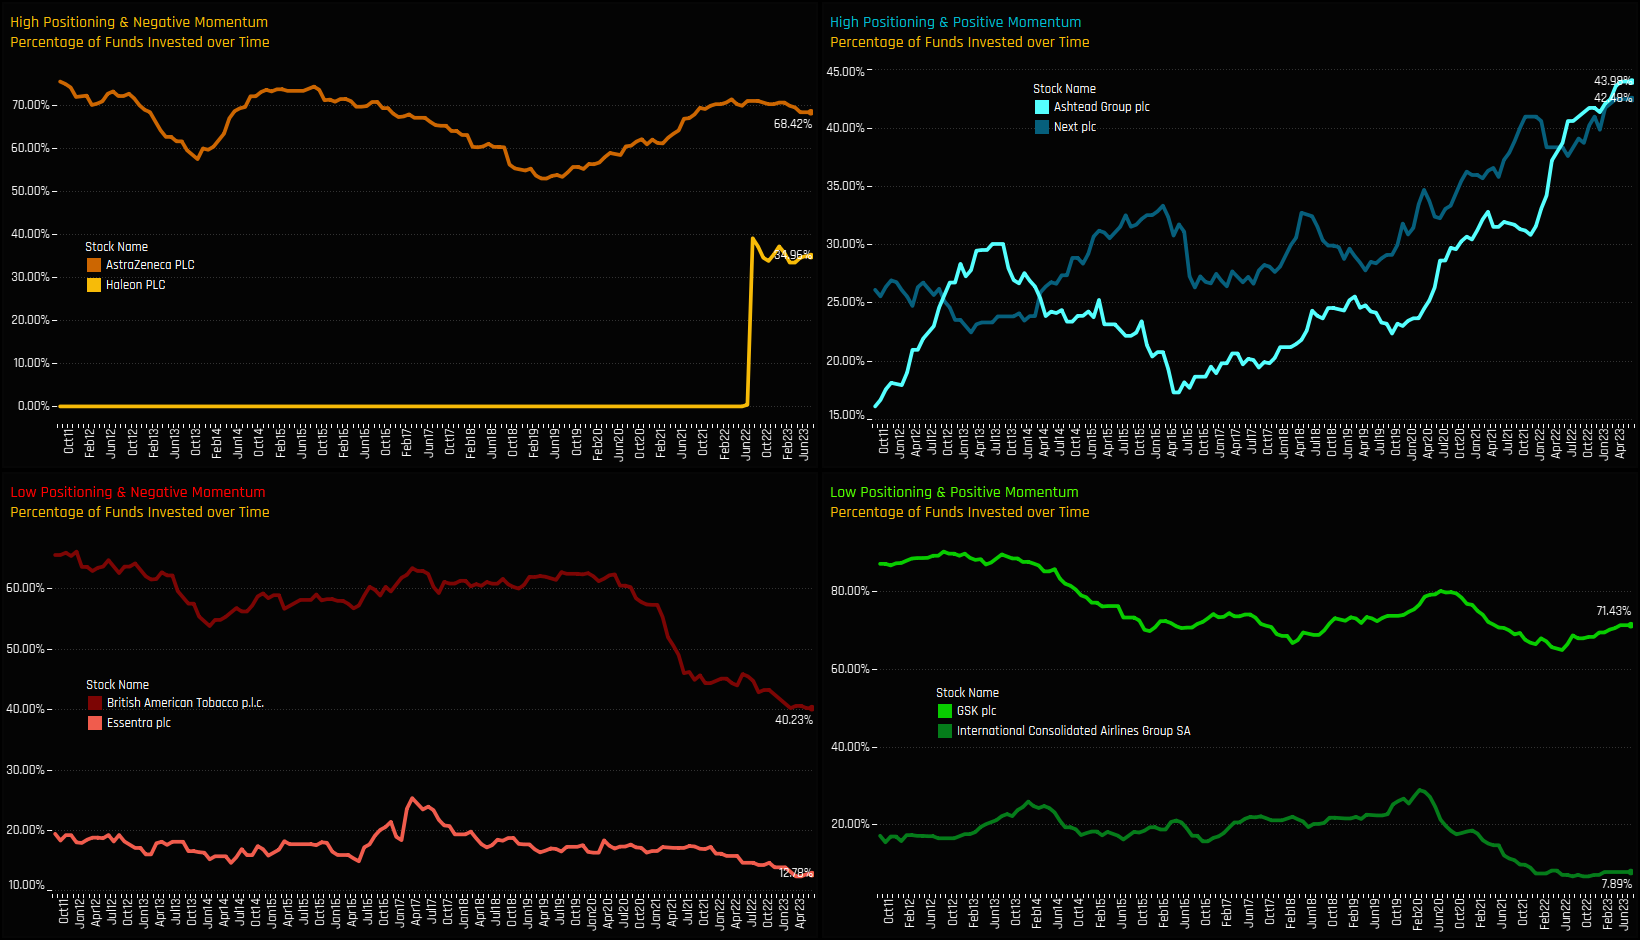
Extreme Stocks
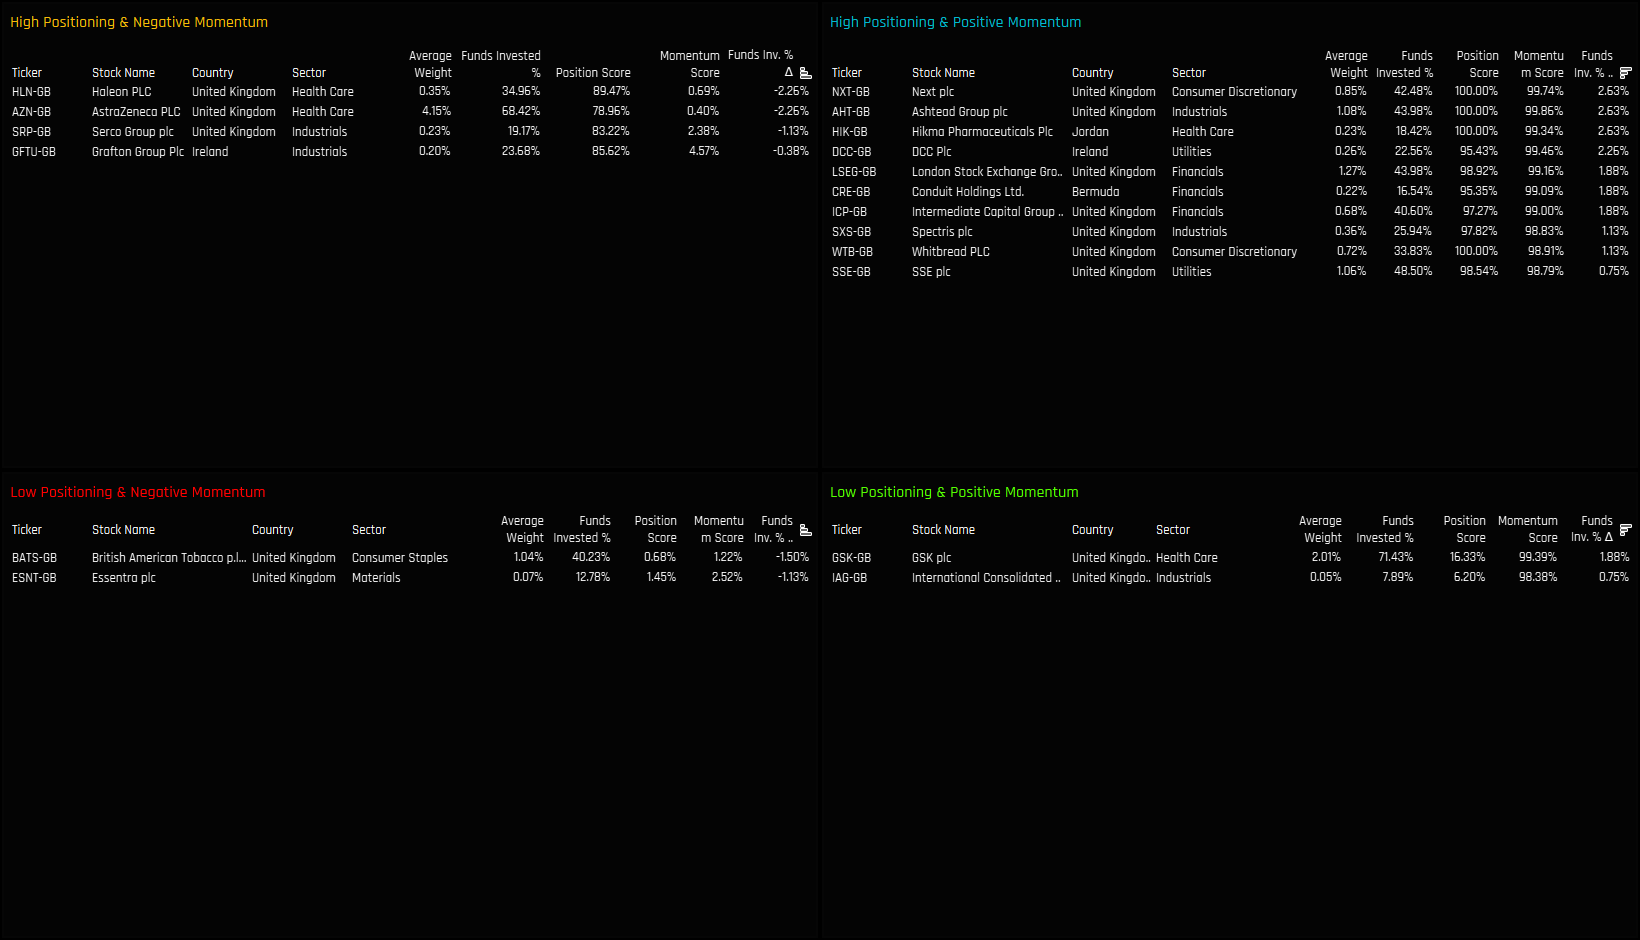
The tables below list the stocks in the extreme corners of each quadrant. The screening methodology is as follows:
High Positioning & Negative Momentum: Position Score > 75%. Momentum Score < 5%
High Positioning & Positive Momentum: Position Score > 95%. Momentum Score > 99%
Extreme Stocks
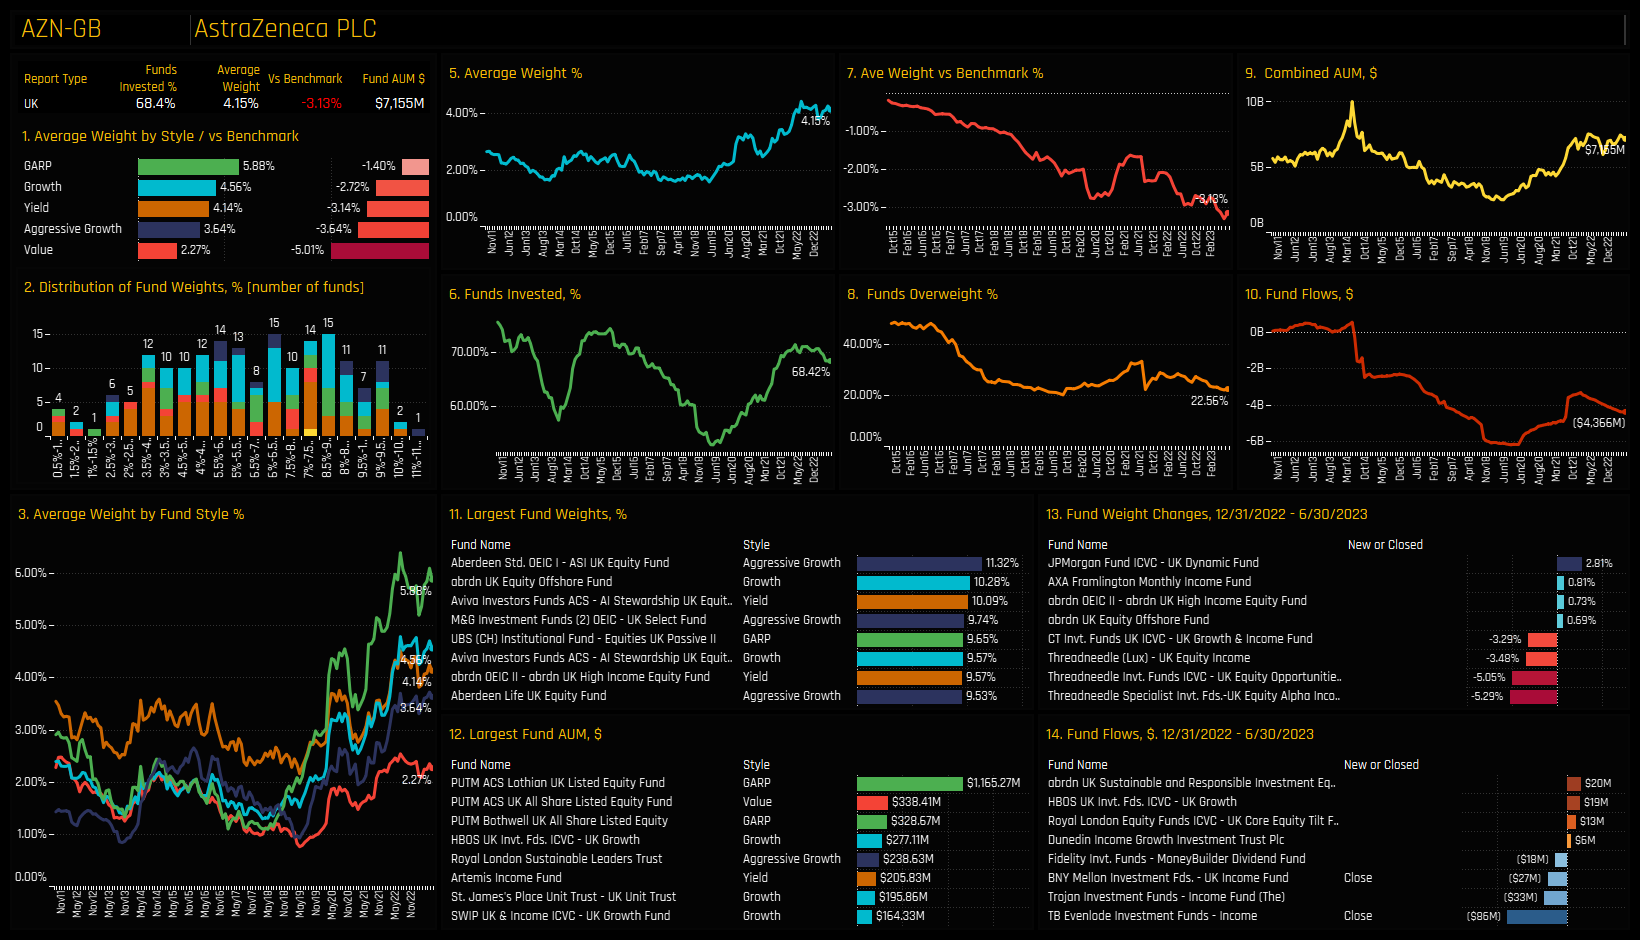
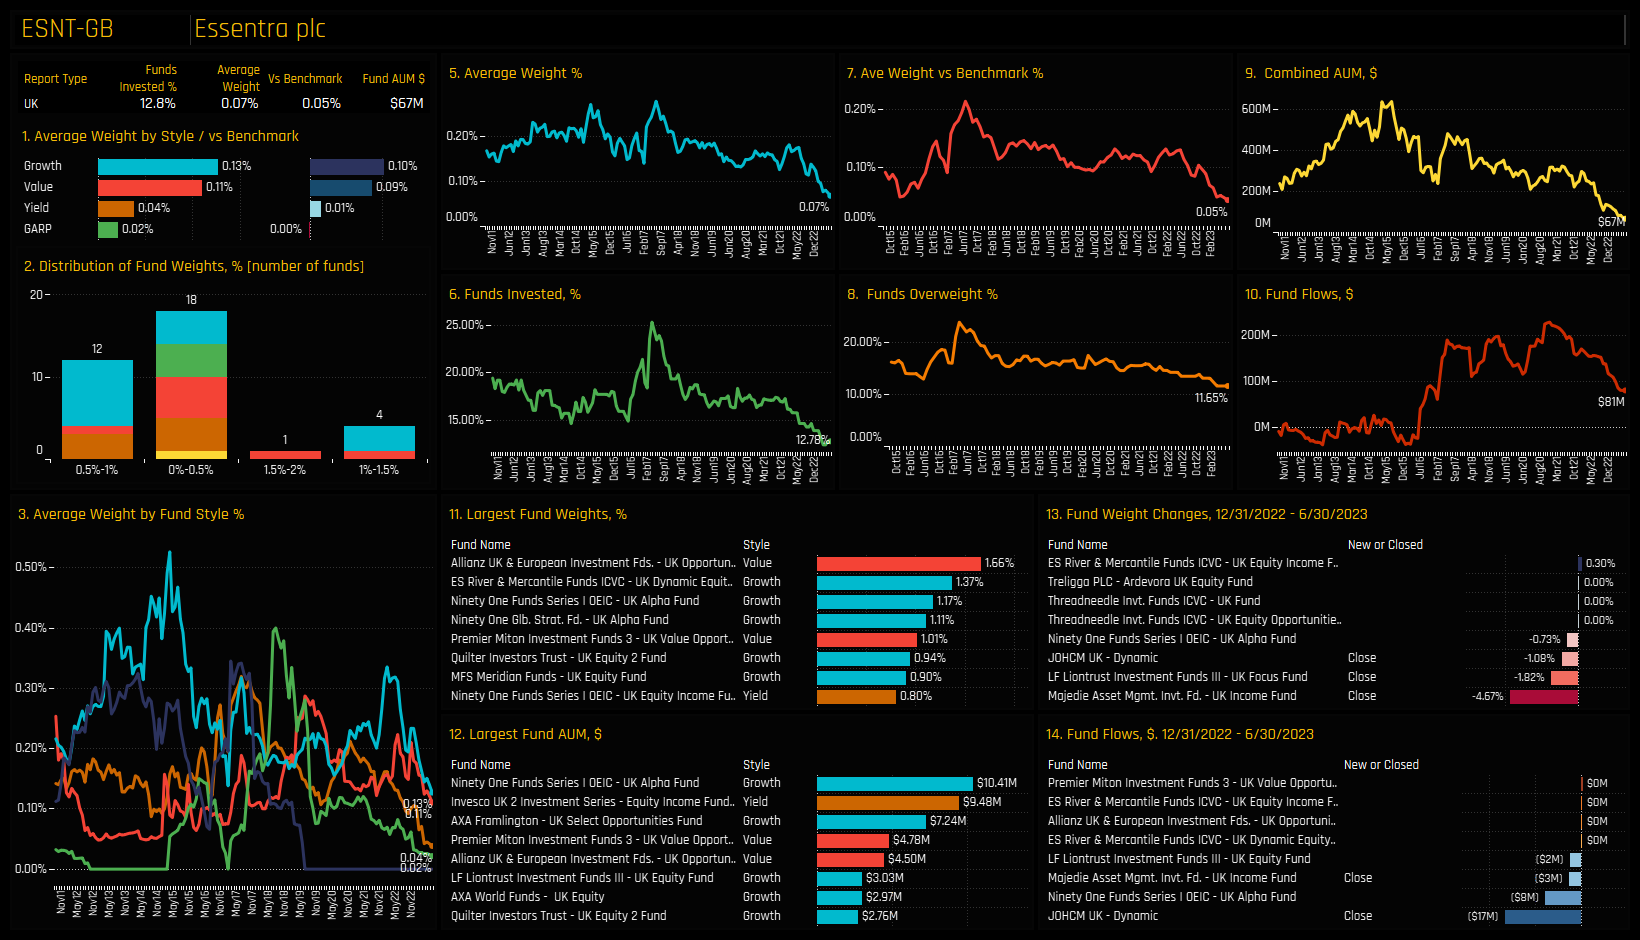
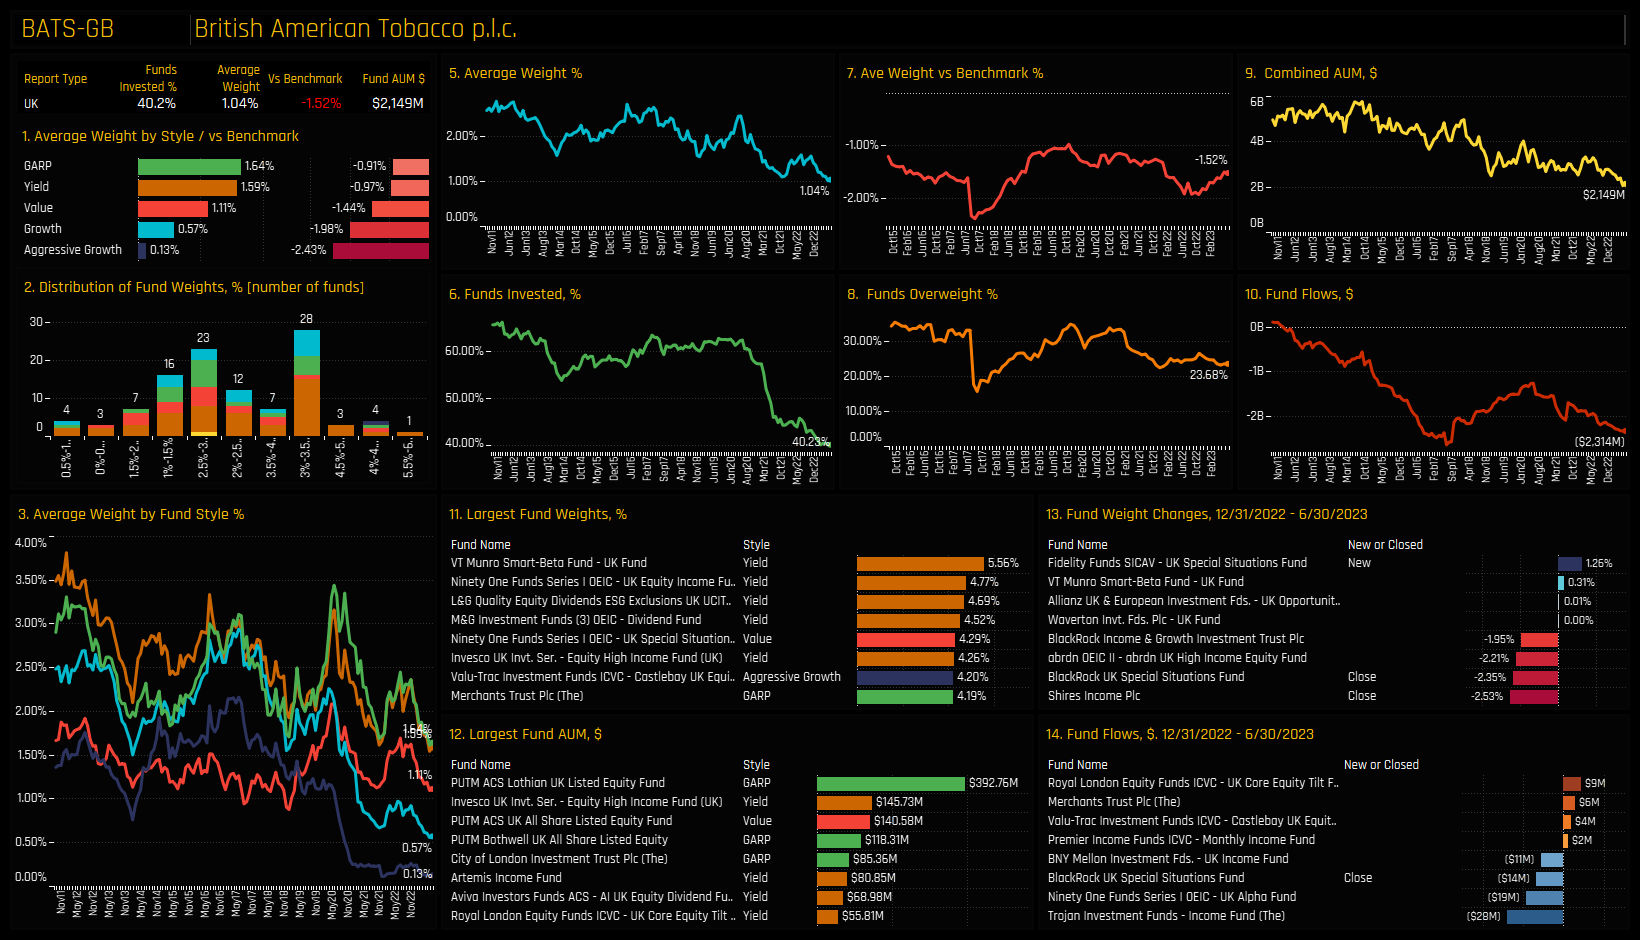
The charts below track the percentage of active funds invested in each of the top 2 stocks across the 4 categories. It’s another way to visualize how the Sentiment Grid works. For example, the top-left chart highlights AstraZeneca PLC and Haleon PLC, with the former entering a down cycle after a period of strong UK fund ownership growth between 2018 and 2022. Haleon is seeing some selling after an initially positive IPO early last year. In the bottom-left chart, BATS has seen selling by UK managers since 2020 onwards and Essentra PLC has drifted towards its lowest levels of ownership on record.
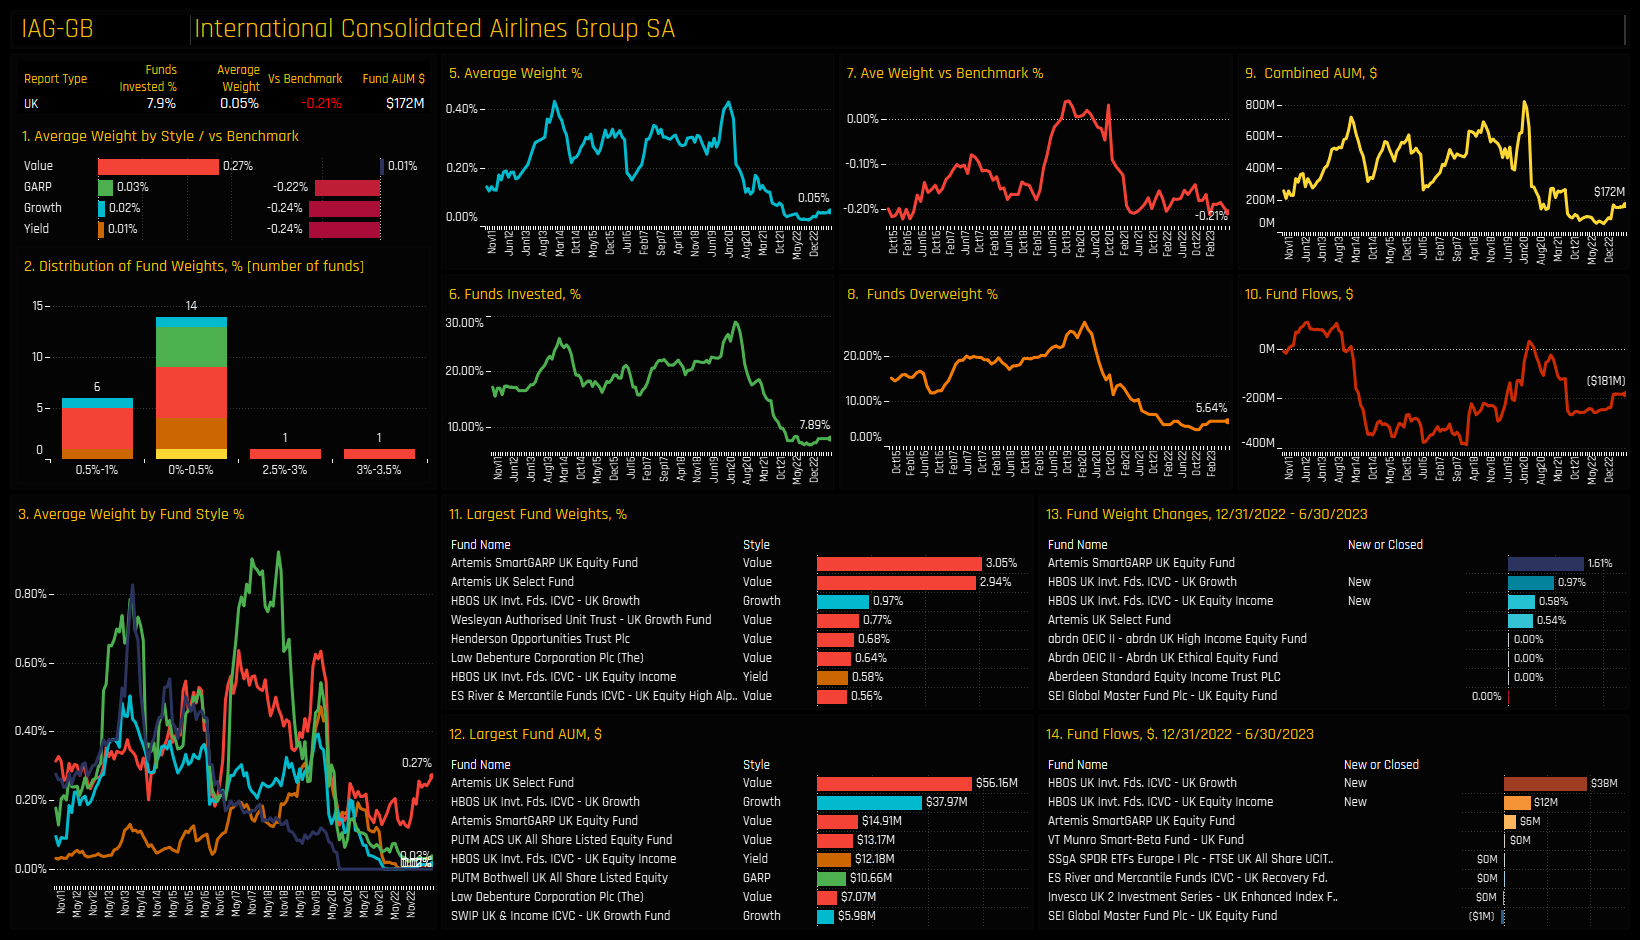
In the opposite case (bottom right), both GSK and IAG are at the bottom of their historical ownership ranges but both have started to climb from the lows. Top right shows Ashtead Group PLC and Next PLC capturing sustained increases in fund ownership in recent months to leave UK funds at their highest levels on record. In the charts that follow we provide more detailed profiles of each of the 8 stocks at the extreme corners of our Sentiment Grid.
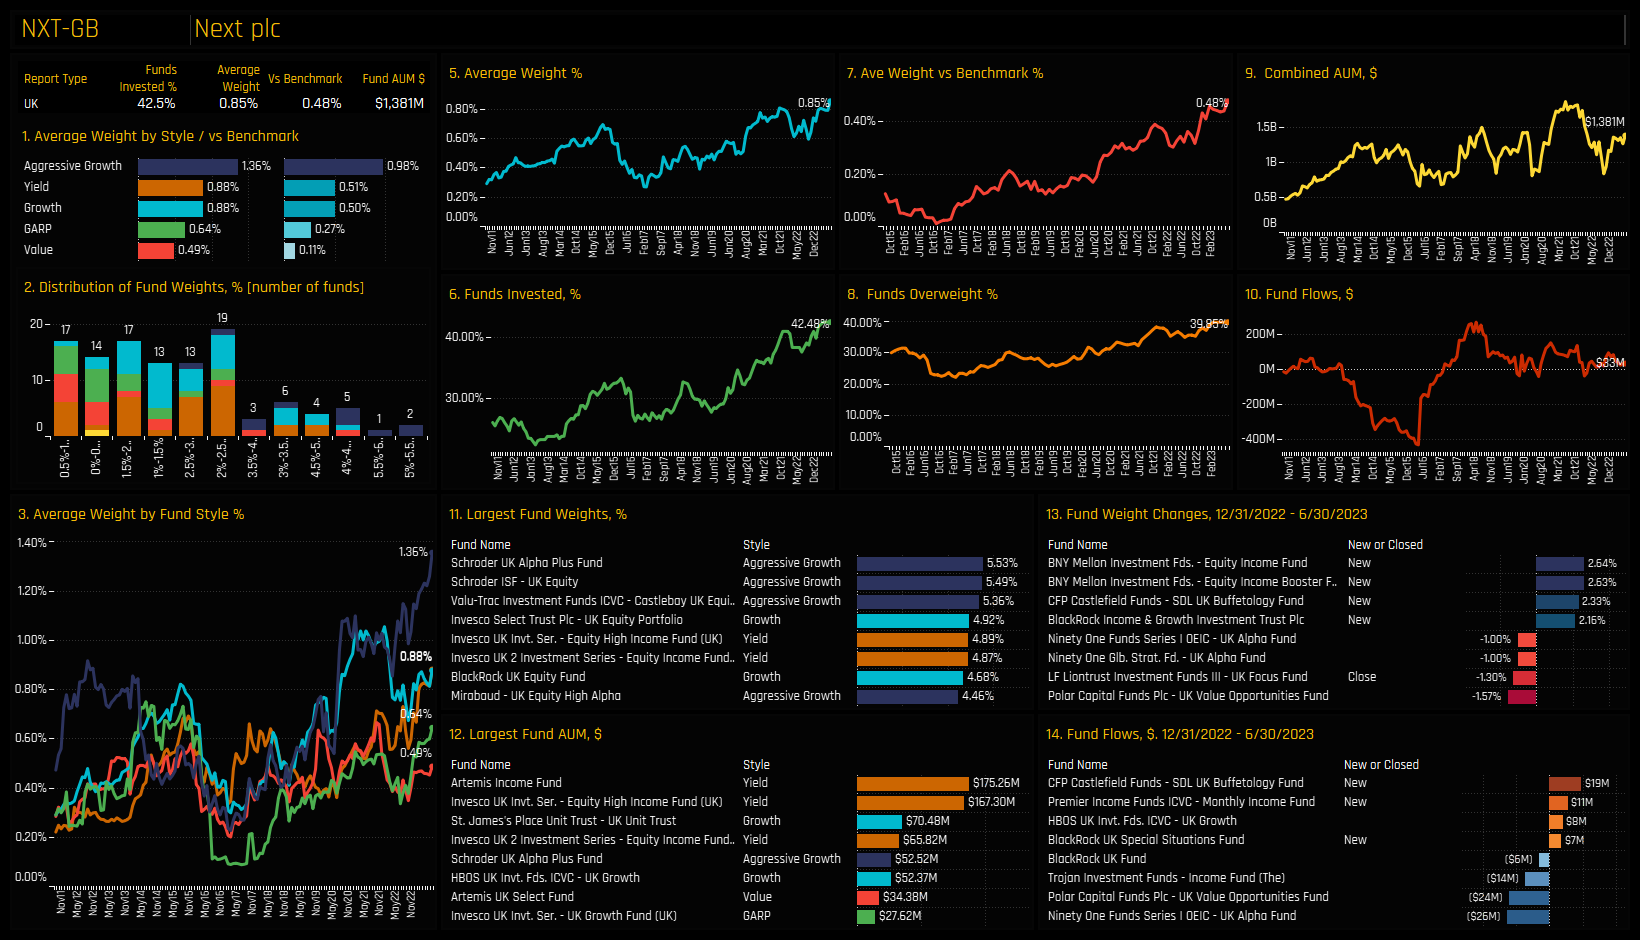
High Positioning & High Momentum: Next PLC
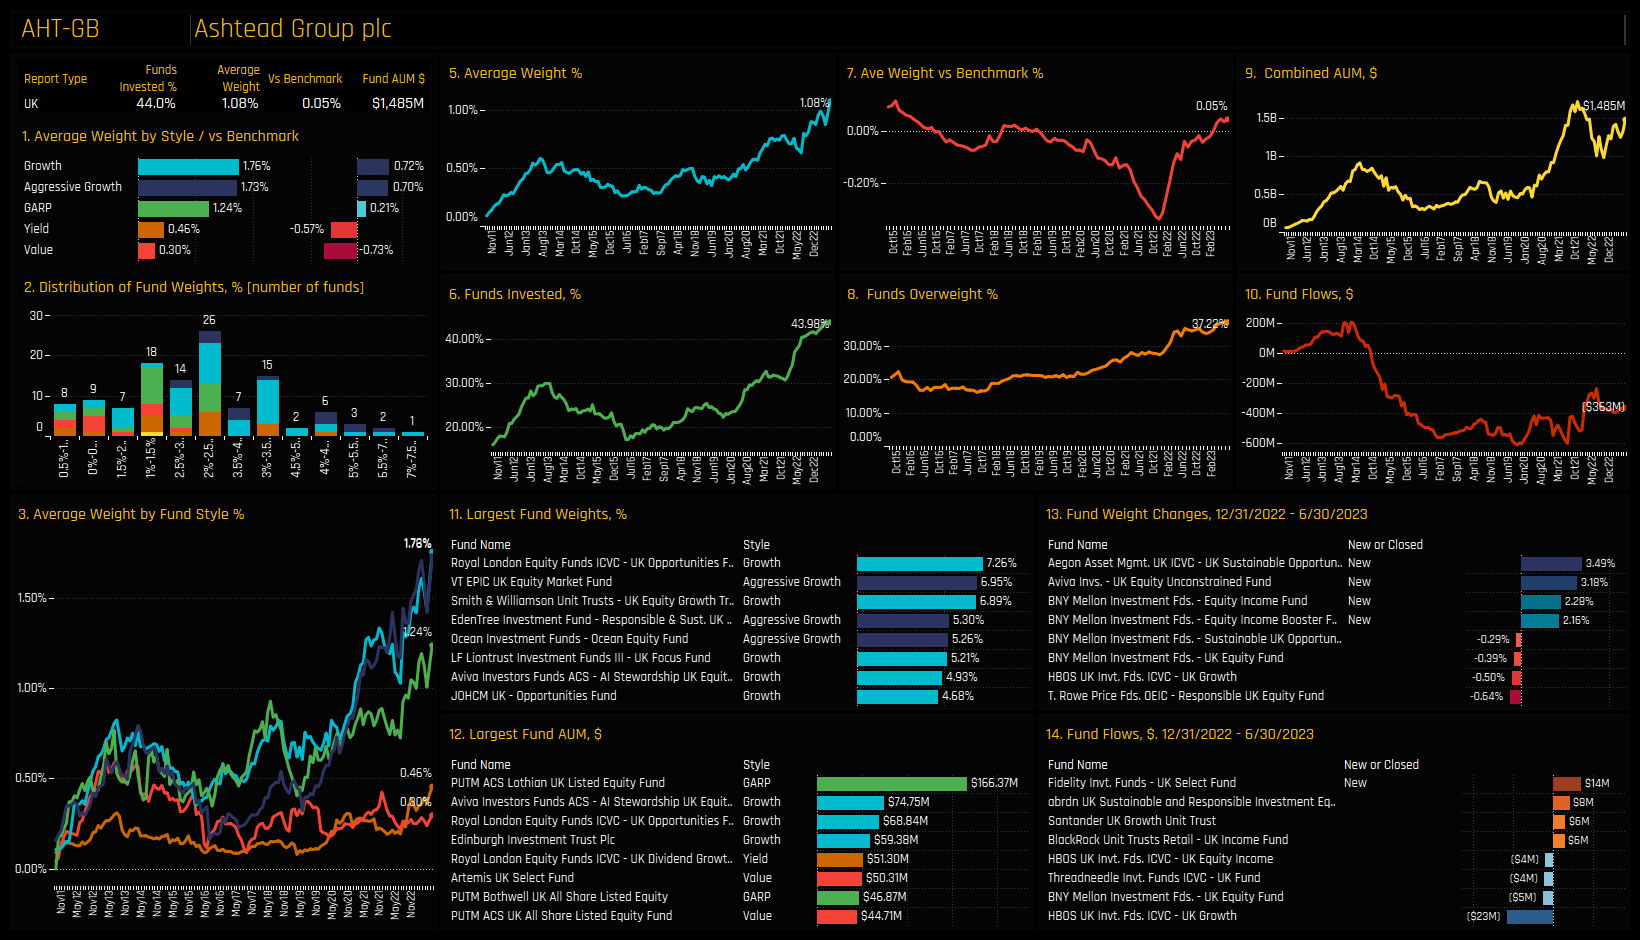
High Positioning & High Momentum: Ashtead Group PLC
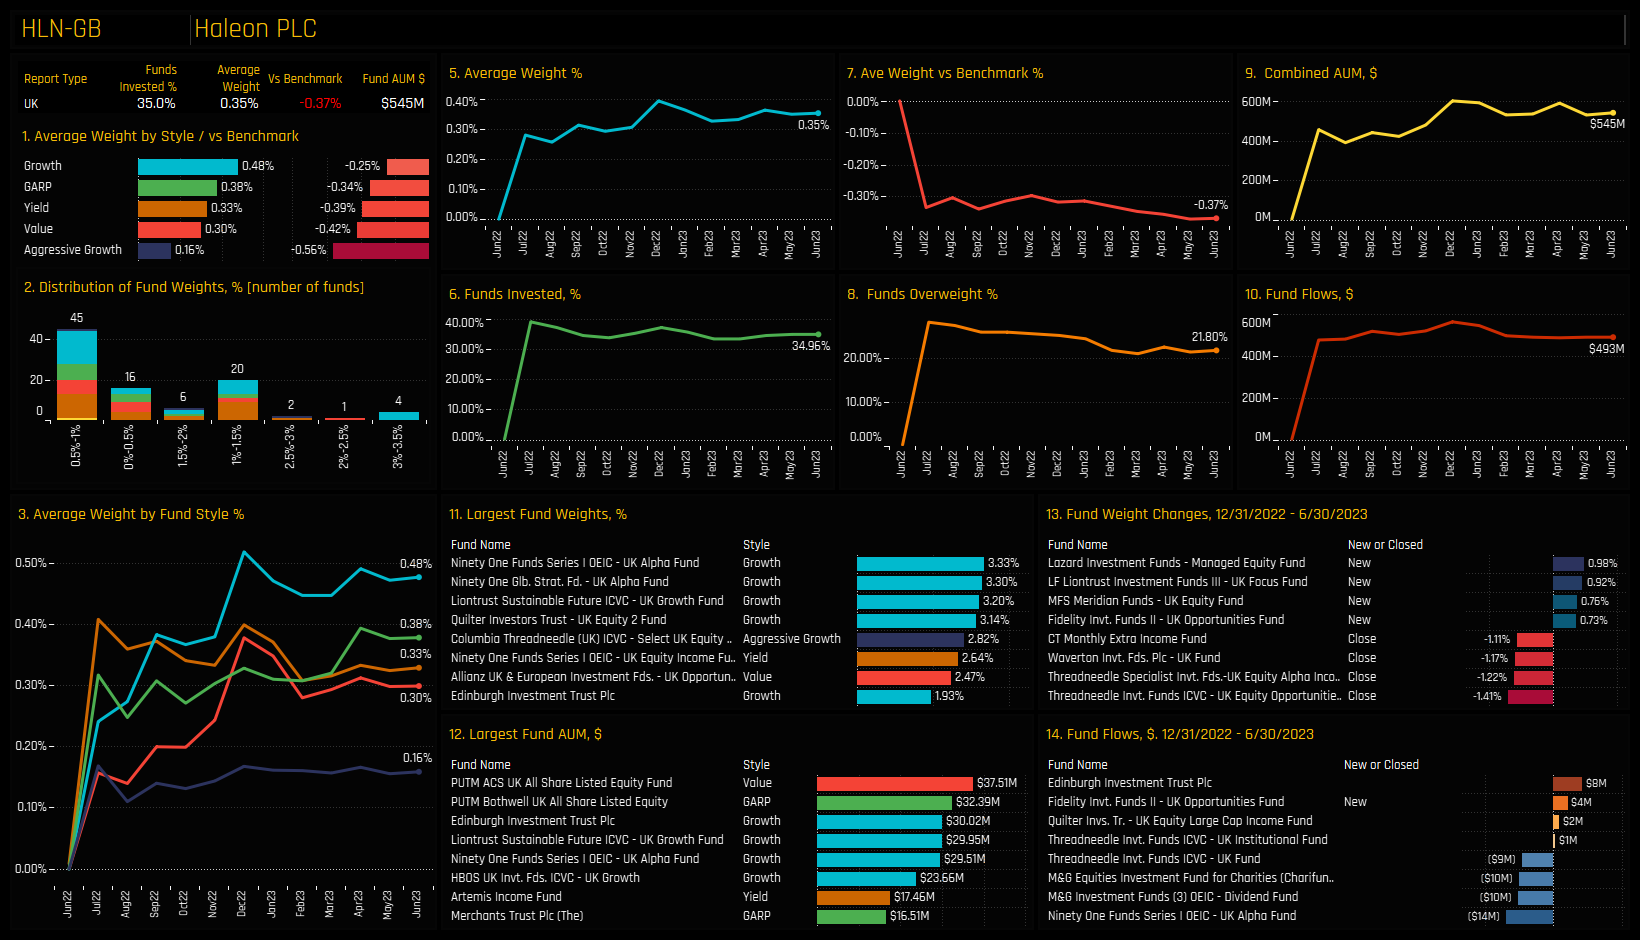
High Positioning & Low Momentum: Haleon PLC
High Positioning & Low Momentum: AstraZeneca PLC
Low Positioning & Low Momentum: Essentra PLC
Low Positioning & Low Momentum: British American Tobacco
Low Positioning & High Momentum: International Consolidated Airlines Group
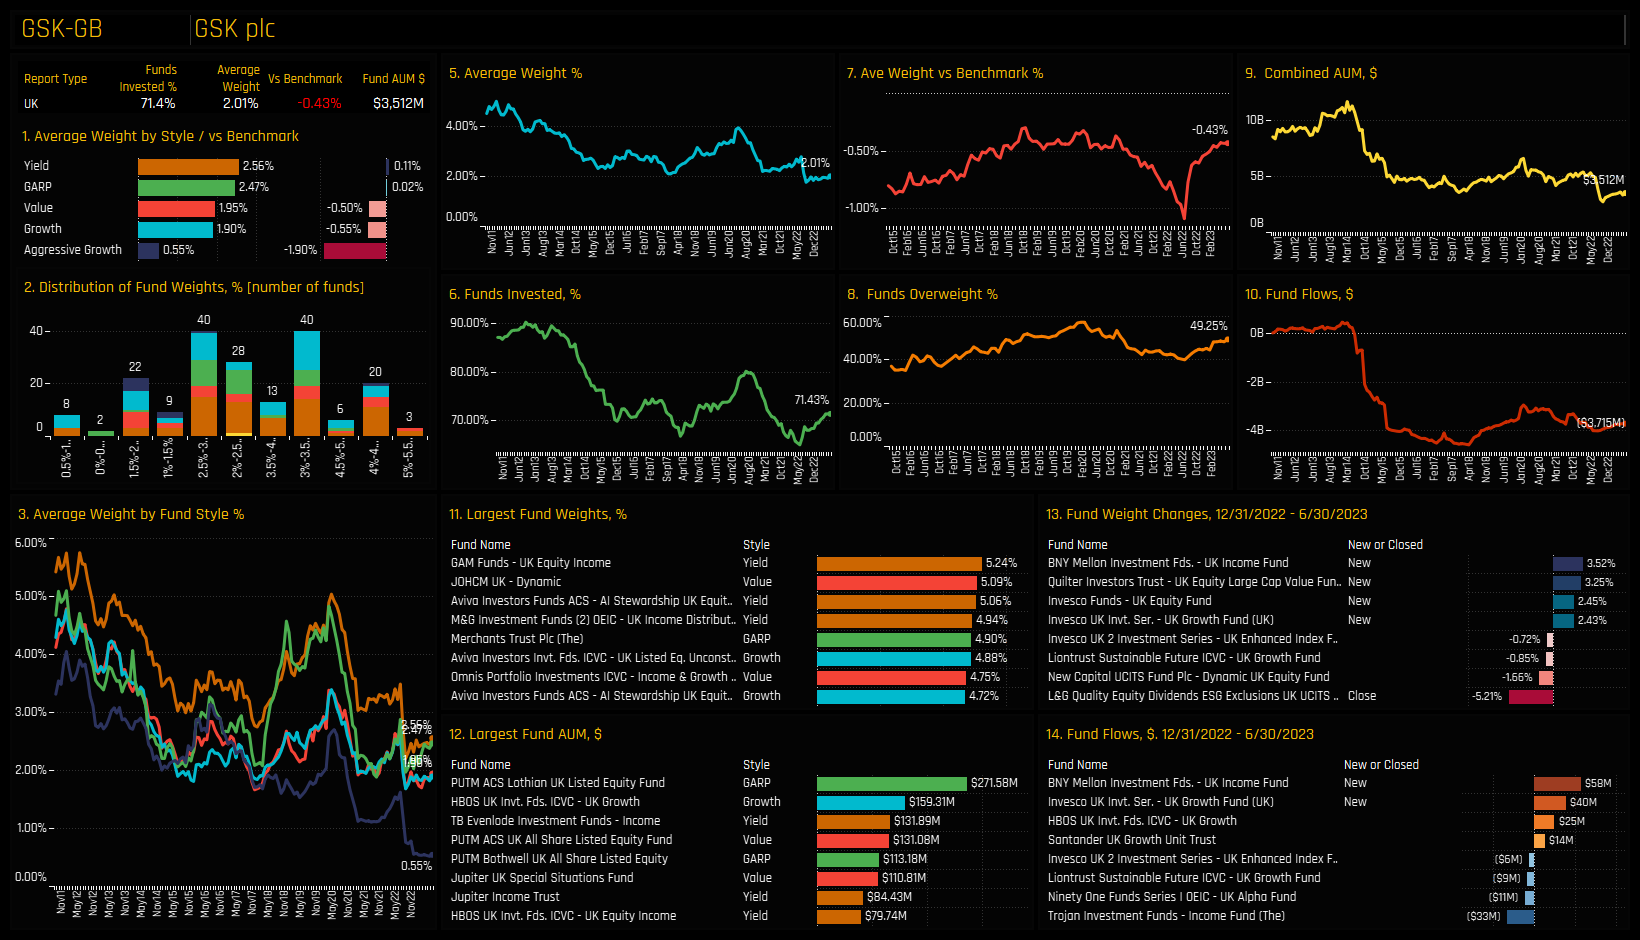
Low Positioning & High Momentum: GSK PLC
266 UK Equity Funds, AUM $179bn
UK Active Funds Ownership Report
Please click on the link below for the full data report on UK active equity fund positioning
For more analysis, data or information on active investor positioning in your market, please get in touch with me on steven.holden@copleyfundresearch.com
Investor Positioning Report — Copley Fund Research Ltd · Last updated: July 2026 · Registered in England and Wales
1. Who we are
Copley Fund Research Ltd provides proprietary institutional fund intelligence to listed companies and investor relations professionals. These terms govern every purchase of an Investor Positioning Report. By completing a purchase you confirm you have read, understood, and agreed to these terms in full.
2. What you are purchasing
The Investor Positioning Report is a bespoke PDF report mapping the institutional fund universe around your stock. It covers current investors, past investors, competitor investors, and white space investors. Every report is built from scratch for the specific company ordered and is not a standardised or templated product.
3. Delivery and process
Following payment or invoice issuance, Copley Fund Research will contact you within one working day to agree your competitor set. Production begins once the competitor set is confirmed in writing. The completed report will be released to you within 48 hours of production starting, provided payment has been received in full; where payment is outstanding, the report will be withheld until payment clears. If the requested company falls outside our covered fund universes, or a competitor set cannot be agreed, Copley Fund Research will issue a full refund or cancel the outstanding invoice.
4. Competitor set agreement
The competitor set is agreed with you in writing prior to production, and the report is built to that agreed specification. Requests to amend the competitor set after delivery, based on a change of preference rather than an error, may be treated as a new order.
5. Refund policy
Because each report is produced individually for your company, orders are non-refundable once production has begun, except as set out in clauses 3 and 5a below. By purchasing, you agree not to dispute the charge with your card provider on the basis that the service was not as described, provided the report has been delivered to the agreed specification or corrected under clause 5a.
5a. Quality remedy
If a delivered report contains a material error caused by Copley Fund Research — for example, an incorrect company analysed, a competitor omitted from the agreed set, or content missing from the specification in clause 2 — Copley Fund Research will correct and redeliver the report at no additional charge, within a reasonable timeframe. This is your sole remedy for such errors.
6. Data and accuracy
All fund positioning data in the report reflects holdings as disclosed at the most recently available reporting date at the time of compilation. The timing of fund holdings disclosures is determined by regulatory requirements applicable to each fund and is outside the control of Copley Fund Research Ltd. This data may not reflect current fund positions. Copley Fund Research takes reasonable care to ensure accuracy but makes no warranty, express or implied, as to the completeness or current accuracy of the underlying data — though this does not affect the quality remedy in clause 5a for errors in how that data was analysed or presented. Past fund positioning is not indicative of future fund behaviour or investment decisions.
7. Not investment advice
The Investor Positioning Report is produced for investor relations intelligence purposes only. It does not constitute investment advice, financial advice, or a recommendation to buy, hold, or sell any security. The data reflects historical fund positioning and must not be relied upon as a prediction of future fund behaviour or investment decisions. Copley Fund Research Ltd is not authorised or regulated by the Financial Conduct Authority for the provision of investment advice.
8. Permitted use and confidentiality
The report is licensed for internal use by the purchasing organisation only. You may share it with employees and directors of your organisation. You may not: reproduce, redistribute, publish, or resell the report or any part of it; share it with any third party outside your organisation without prior written consent; use the fund or portfolio manager names contained in the report to approach those individuals on behalf of Copley Fund Research or in a manner that could damage Copley Fund Research's relationships with those funds; or use the data for any purpose other than your own investor relations strategy. The data, analysis, and methodology contained in the report are the intellectual property of Copley


