Ford becomes one of the most unloved stocks in the USA as active funds close out positions.
Time-Series and Autos Positioning
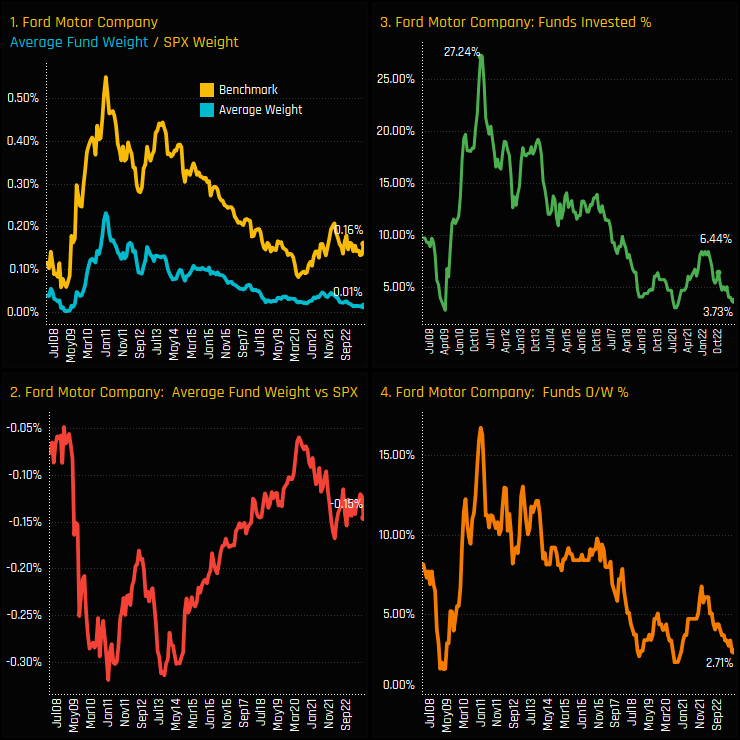
Ford Motor Company is owned by just 11, or 3.7% of the 295 US active funds in our analysis. Chart 3 below shows the decline in the percentage of funds invested in Ford, with peak ownership of 27.24% occurring in late 2010 and today’s level close to the lowest on record. Average fund weights have fallen to just 0.01%, or underweight the S&P 500 weight by -.015%).
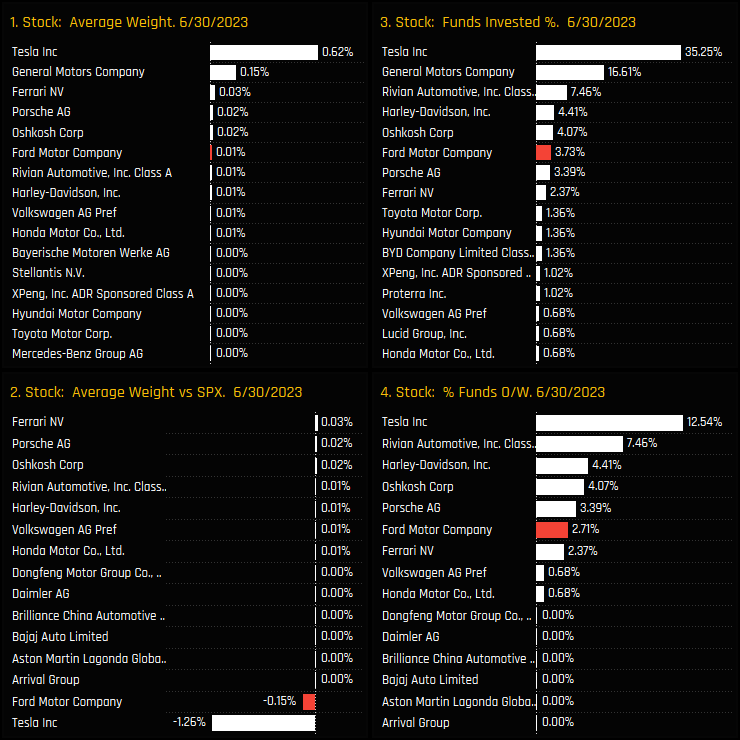
Versus Auto peers, Ford Motor Company is now the 6th most widely held Auto stock among US active investors. The most widely held is Telsa Inc, owned by 35.25% of funds at an average weight of 0.62%. Both GM, Rivian Automotive, Harley Davidson and Oshkosh Corp are all owned by more funds. Ford is the
Fund Activity & Latest Holdings
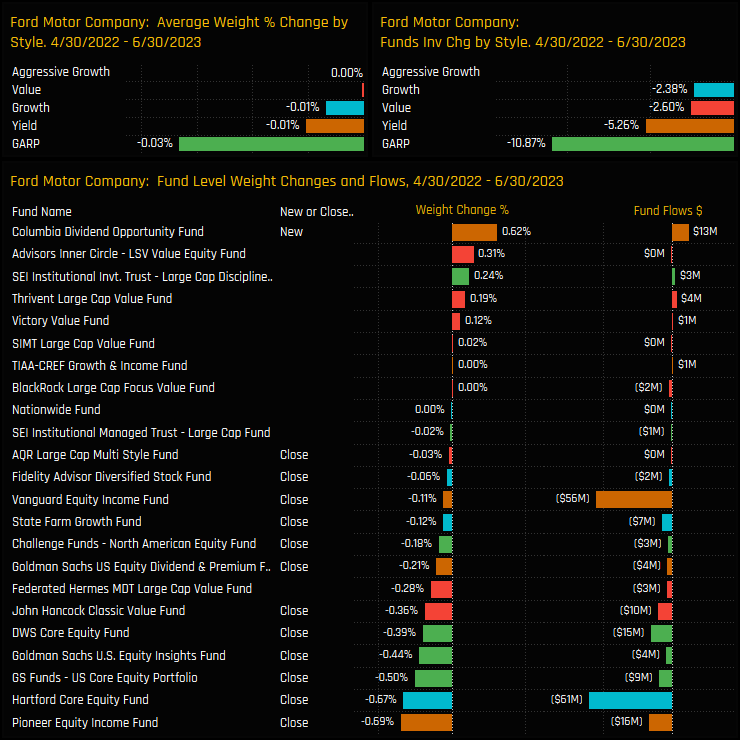
Since the most recent highs of April last year, fund activity has been overwhelmingly skewed to the sell-side. Closures were led by Pioneer Equity Income (-0.69%) and Hartford Core Equity (-0.67%), adding to a total of 12 funds who removed Ford from portfolios over the period.
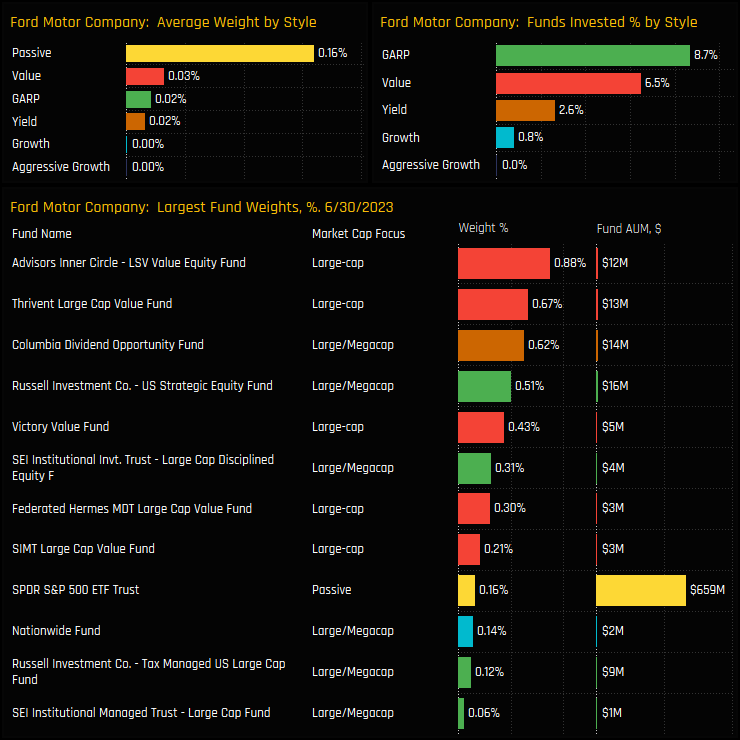
This leaves a small investor base for Ford among active US equity funds. Top holders are at the Value end of the spectrum and led by LSV Value and Thrivent Large Cap Value, but the truth is, Ford is a fringe portfolio holding for even the most bullish of US investors.
Underowned and Unloved
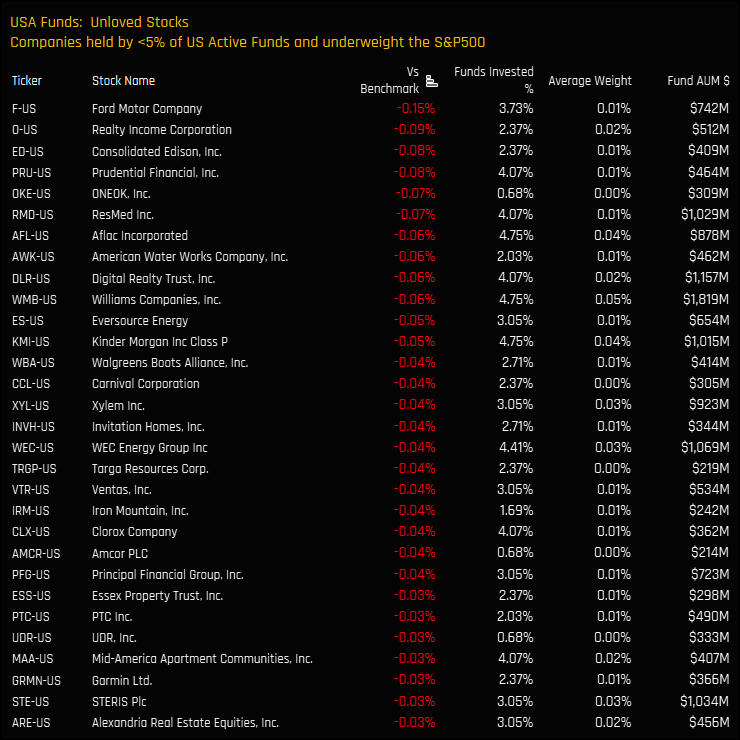
Ford now heads the unenviable list of ‘Únloved Stocks’ among active US investors. These stocks are not only held as net underweight positions compared to the S&P 500 index on average, but also by less than 5% of the 295 funds in our analysis. Very few want to own it, and the vast majority are happy to run the risk of Ford outperforming.
Click below for the full data report on Ford Motor Company among active US Equity Funds.
US Active Equity: Top Overweight & Underweight Stocks
Overweights in Visa offset by record underweights in Apple Inc.
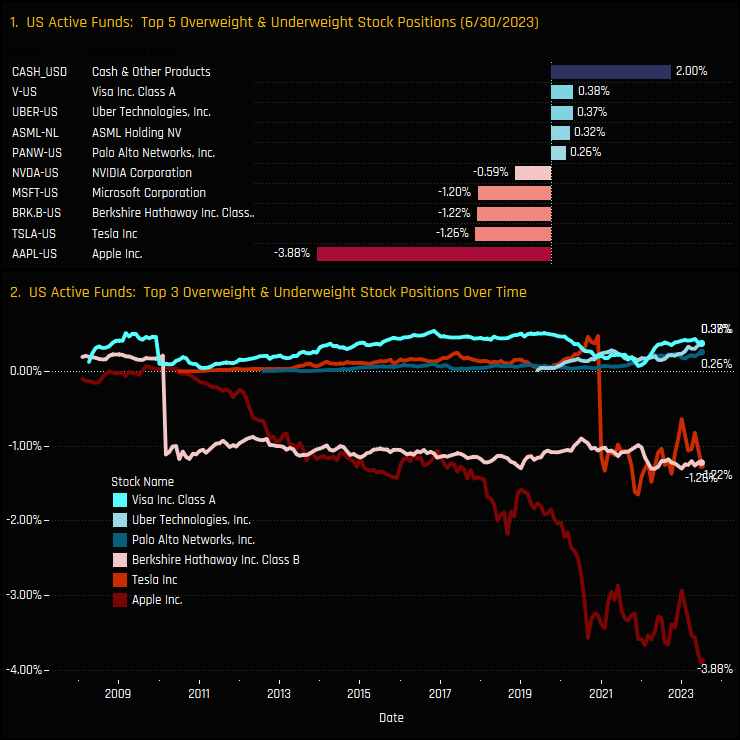
Top overweights are in Cash, Visa and then non-benchmark stocks Uber Technologies, ASML Holdings and Palo Alto Networks.
US active funds are running massive underweights in Apple Inc, with average weights of 3.8% way below the S&P 500 weight of 7.7%. In fact, the -3.88% Apple underweight is the highest on record for US active funds. Other decent sized underweights are in Telsa, Berkshire Hathaway and Microsoft Corp.
Note the size difference between the largest underweights and the largest overweights. This is a fairly common set up among active investors across the regions we cover. A few large underweights in the top index names offset by a long tail of smaller overweights.
295 US Equity Funds, AUM $3.2tr
US Active Funds Ownership Report
Please click on the link below for the full data report on US active fund positioning
For more analysis, data or information on active investor positioning in your market, please get in touch with me on steven.holden@copleyfundresearch.com
Investor Positioning Report — Copley Fund Research Ltd · Last updated: July 2026 · Registered in England and Wales
1. Who we are
Copley Fund Research Ltd provides proprietary institutional fund intelligence to listed companies and investor relations professionals. These terms govern every purchase of an Investor Positioning Report. By completing a purchase you confirm you have read, understood, and agreed to these terms in full.
2. What you are purchasing
The Investor Positioning Report is a bespoke PDF report mapping the institutional fund universe around your stock. It covers current investors, past investors, competitor investors, and white space investors. Every report is built from scratch for the specific company ordered and is not a standardised or templated product.
3. Delivery and process
Following payment or invoice issuance, Copley Fund Research will contact you within one working day to agree your competitor set. Production begins once the competitor set is confirmed in writing. The completed report will be released to you within 48 hours of production starting, provided payment has been received in full; where payment is outstanding, the report will be withheld until payment clears. If the requested company falls outside our covered fund universes, or a competitor set cannot be agreed, Copley Fund Research will issue a full refund or cancel the outstanding invoice.
4. Competitor set agreement
The competitor set is agreed with you in writing prior to production, and the report is built to that agreed specification. Requests to amend the competitor set after delivery, based on a change of preference rather than an error, may be treated as a new order.
5. Refund policy
Because each report is produced individually for your company, orders are non-refundable once production has begun, except as set out in clauses 3 and 5a below. By purchasing, you agree not to dispute the charge with your card provider on the basis that the service was not as described, provided the report has been delivered to the agreed specification or corrected under clause 5a.
5a. Quality remedy
If a delivered report contains a material error caused by Copley Fund Research — for example, an incorrect company analysed, a competitor omitted from the agreed set, or content missing from the specification in clause 2 — Copley Fund Research will correct and redeliver the report at no additional charge, within a reasonable timeframe. This is your sole remedy for such errors.
6. Data and accuracy
All fund positioning data in the report reflects holdings as disclosed at the most recently available reporting date at the time of compilation. The timing of fund holdings disclosures is determined by regulatory requirements applicable to each fund and is outside the control of Copley Fund Research Ltd. This data may not reflect current fund positions. Copley Fund Research takes reasonable care to ensure accuracy but makes no warranty, express or implied, as to the completeness or current accuracy of the underlying data — though this does not affect the quality remedy in clause 5a for errors in how that data was analysed or presented. Past fund positioning is not indicative of future fund behaviour or investment decisions.
7. Not investment advice
The Investor Positioning Report is produced for investor relations intelligence purposes only. It does not constitute investment advice, financial advice, or a recommendation to buy, hold, or sell any security. The data reflects historical fund positioning and must not be relied upon as a prediction of future fund behaviour or investment decisions. Copley Fund Research Ltd is not authorised or regulated by the Financial Conduct Authority for the provision of investment advice.
8. Permitted use and confidentiality
The report is licensed for internal use by the purchasing organisation only. You may share it with employees and directors of your organisation. You may not: reproduce, redistribute, publish, or resell the report or any part of it; share it with any third party outside your organisation without prior written consent; use the fund or portfolio manager names contained in the report to approach those individuals on behalf of Copley Fund Research or in a manner that could damage Copley Fund Research's relationships with those funds; or use the data for any purpose other than your own investor relations strategy. The data, analysis, and methodology contained in the report are the intellectual property of Copley