Samsung Electronics: Return of the King
Japan: Early Signs of Potential Re-Weight
China A-Share Sector & Stock Positioning Update
UK Half Year Performance Update
Emerging Market Stock Radar
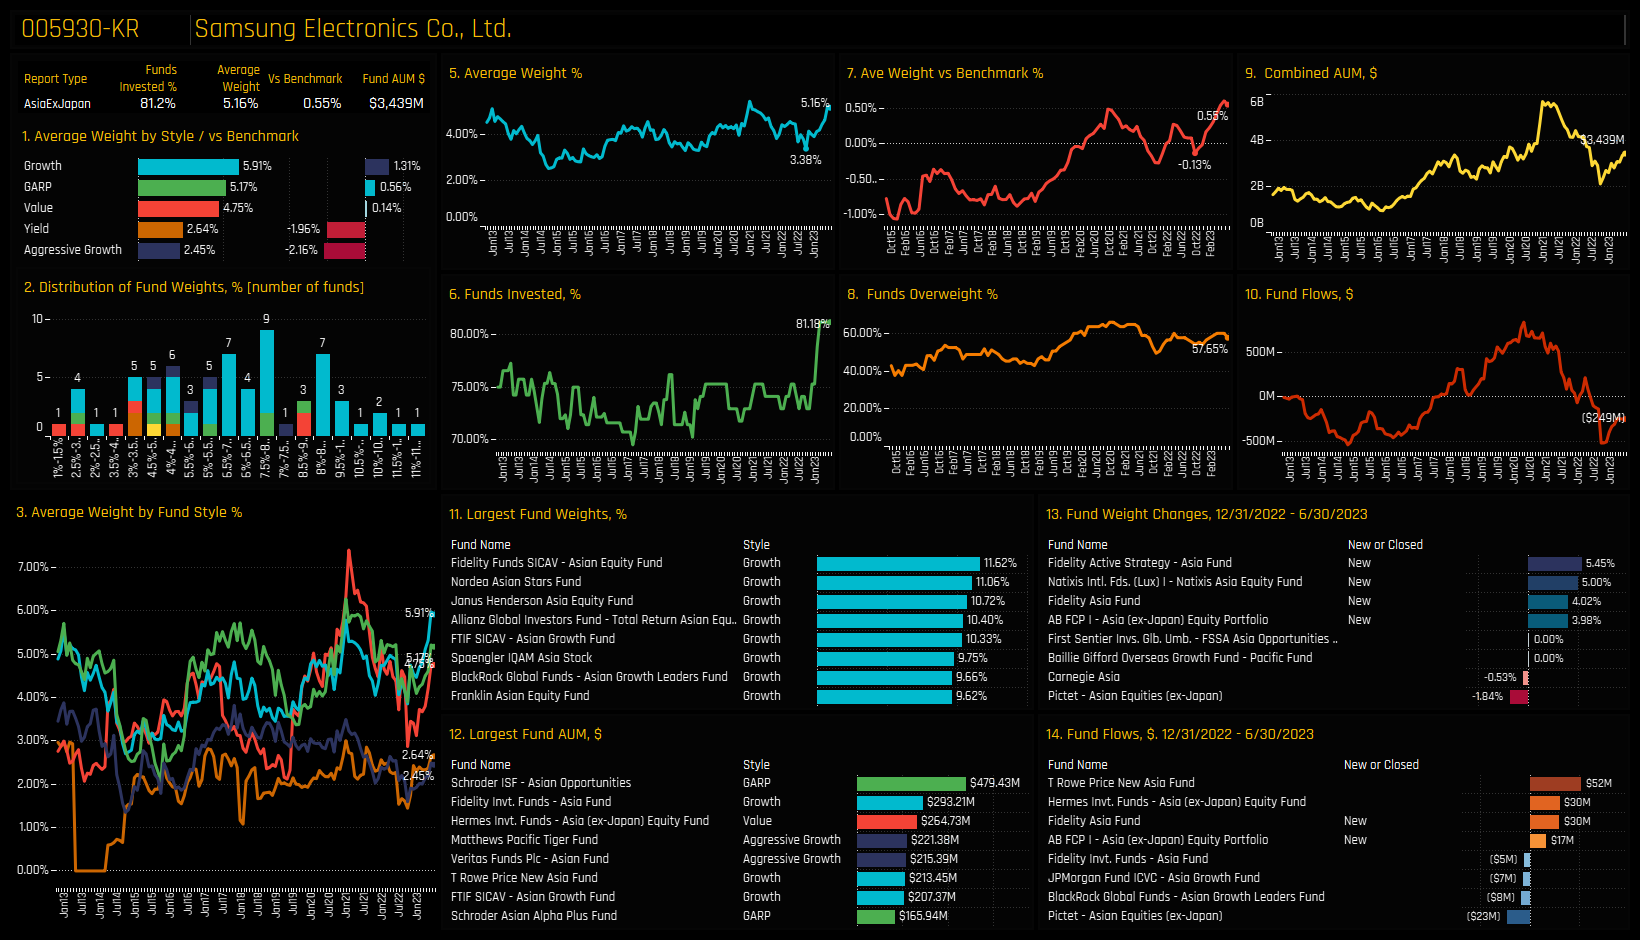
86 ASIA EX-JAPAN EQUITY FUNDS, AUM $54.5BN
Samsung Electronics: Return of the King
Asia Ex-Japan funds have increased ownership in Samsung Electronics to their highest levels on record. Samsung suffered something of a conviction crisis late in to last year, as average holding weights plunged to just 3.38% (chart 5 below), or underweight the iShares MSCI Asia Ex-Japan ETF by -0.13% (ch7). But since then, fund managers have ramped up allocations, with the percentage of funds with exposure to Samsung Electronics spiking to a record 81.2% over the course of the last 6-months (ch6), pushing average weights higher and moving active managers to near record overweights of 0.55%, on average.
New positions from Fidelity Asia (+5.45%) and Natixis Asia Equity (+5%) have unpinned this move (ch13), in addition to high conviction holdings of over 10% from Fidelity Asian Equity, Nordea Asian Stars and Janus Henderson Asia Equity, among others (ch11). So despite being an easy stock for Asian funds to hold on account of its large index weight, active investors are going one step further, ramping up allocations to record levels and with the majority of managers positioned overweight. Samsung Electronics has cemented itself as one of the highest conviction holdings in the Asia Ex-Japan region right now.
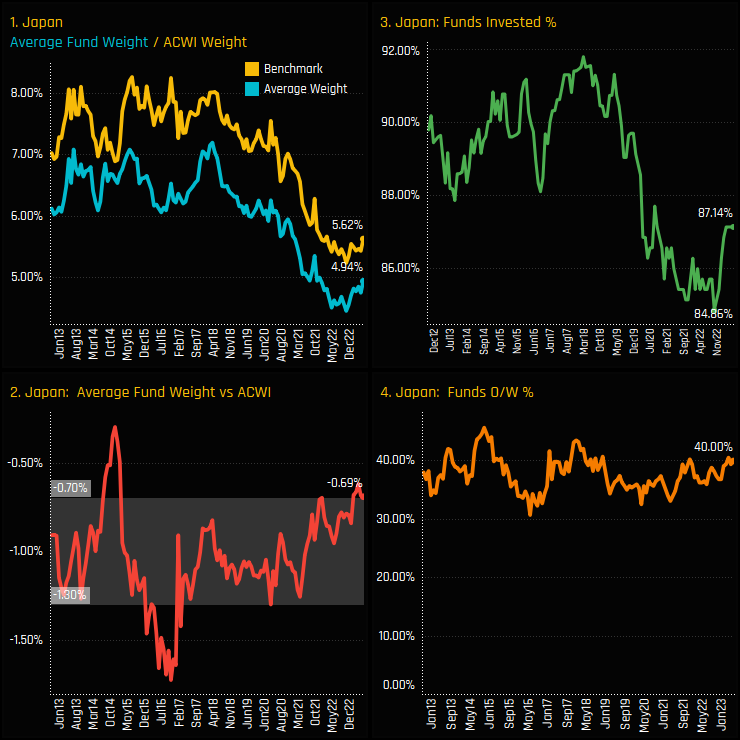
350 Global Equity Funds, AUM $940bn
Japan: Early Signs of a Potential Re-Weight
After a 5 year decline in Japanese exposure, active Global fund managers are beginning to warm to Japan’s investment credentials. Ownership levels in Japanese equities bottomed out in September of last year with 84.9% of funds invested, but moved higher to 87.14% as of the end of last month (ch3 below). Versus the iShares MSCI ACWI ETF, Japan has been a consistent underweight over the last decade, but today’s level of -0.69% below benchmark sits at the top end of the long-term range (ch2).
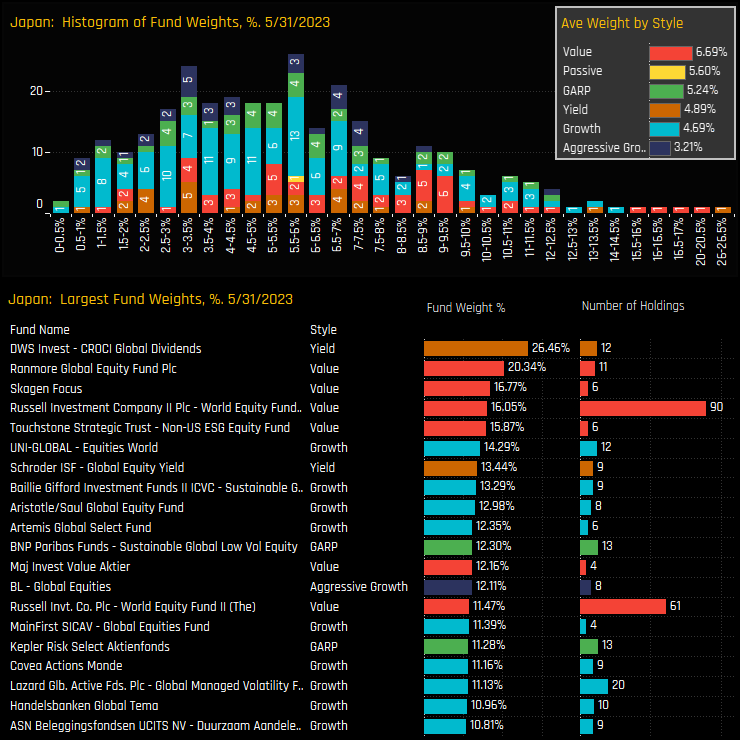
The histogram of individual fund weights in Japan shows the bulk of allocations are between the 2% and 8% level, but with a long tail to the upside. Fund allocations are well correlated to Style, with Value funds more heavily exposed than their Growth peers (inset chart). The Yield strategy of DWS CROCI Global Dividends is the largest holder on 26.46%, followed by a raft of Value strategies from Ranmore, Skagen and Russell, among others. In the full report we analyse the sectors, stocks and funds driving this reallocation.
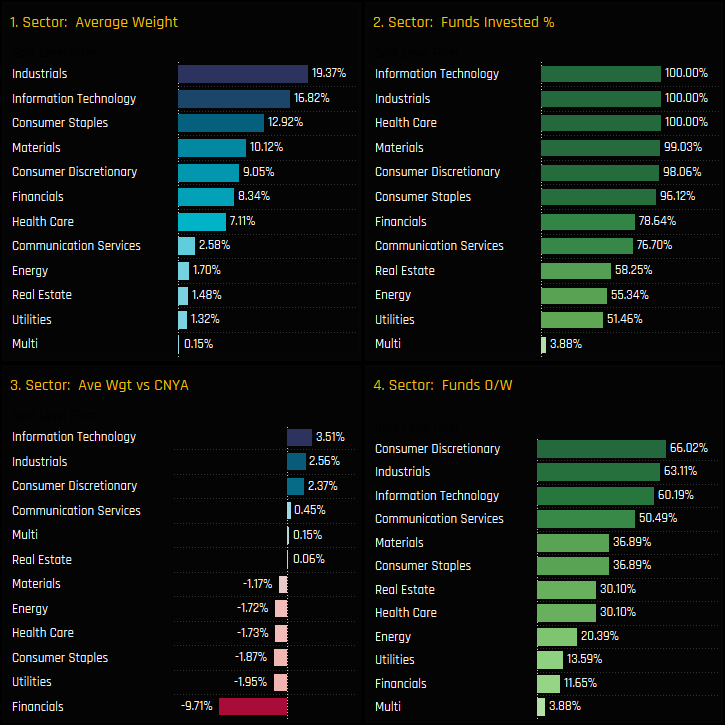
103 China A-Share Funds, AUM $45bn
A-Share Sector & Stock Positioning Update
Among the 103 China A-Share strategies in our analysis, 84% of the total allocation sits in the 7 top sectors, led by Industrials, Technology and Consumer Staples (ch1). There is a significant gap to the less widely owned Communication Services, Energy, Real Estate and Utilities sectors. Active managers differ from the iShares MSCI China A-Shares ETF (CNYA) by running a significant underweight in the Financials sector, with average weights of 8.34% a massive -9.37% below benchmark (ch3) with only 11.7% positioned higher than the index (ch4). Offsetting this key underweight are consensus overweight positions in the Information Technology, Industrials and Consumer Discretionary sectors.
Drilling down to a stock level, 2 companies dominate above all others. Contemporary Amperex Technology and Kweichow Moutai are owned by 80.6% and 77.7% of A-Share managers respectively, well above the chasing pack of LONGi Green Energy and China Merchants Bank (ch2). Despite Kweichow’s average weight of 4.39%, this represents an average underweight of -1.18% versus the CNYA ETF, with active A-Share managers running overweights in Midea Group, Contemporary Amperex Technology and Luxshare Precision, on average. A host of domestic bank stocks underpin the Financials underweight, led by Agricultural Bank of China, ICBC and Bank of Communications.
266 UK Equity Funds, AUM $175bn
UK Active Fund Year to Date Performance
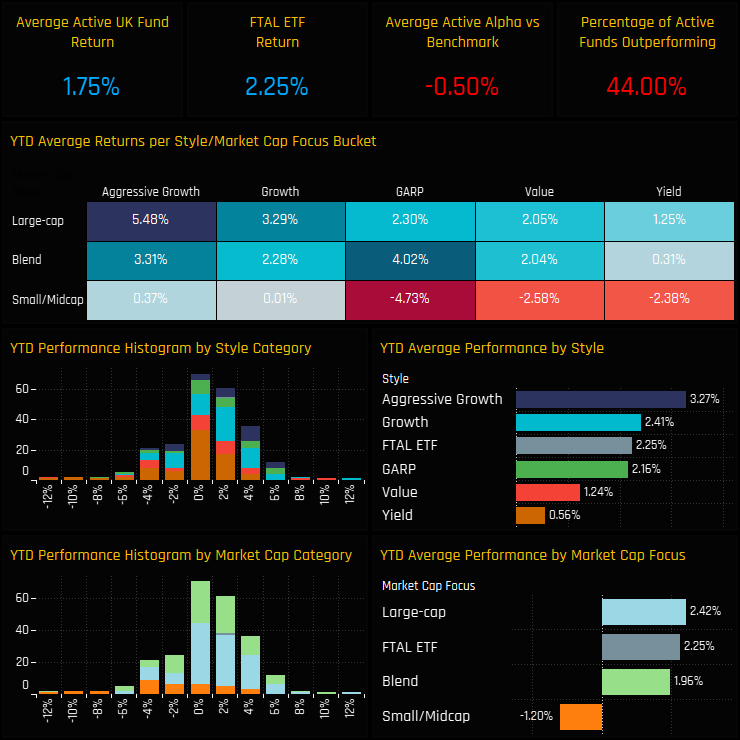
Active UK managers returned an average +1.75% in the first half of 2023, slightly behind the FTSE All Share ETF (FTAL) by -0.5% and with 44% of the 266 funds in our analysis outperforming. Returns were heavily effected by both Style and Market Cap Focus, with Aggressive Growth funds the outperformers on 3.27% against Yield on 0.56%. Small/Midcap strategies posted negative returns of -1.2% on average, with those at the Value end of the spectrum doing even worse.
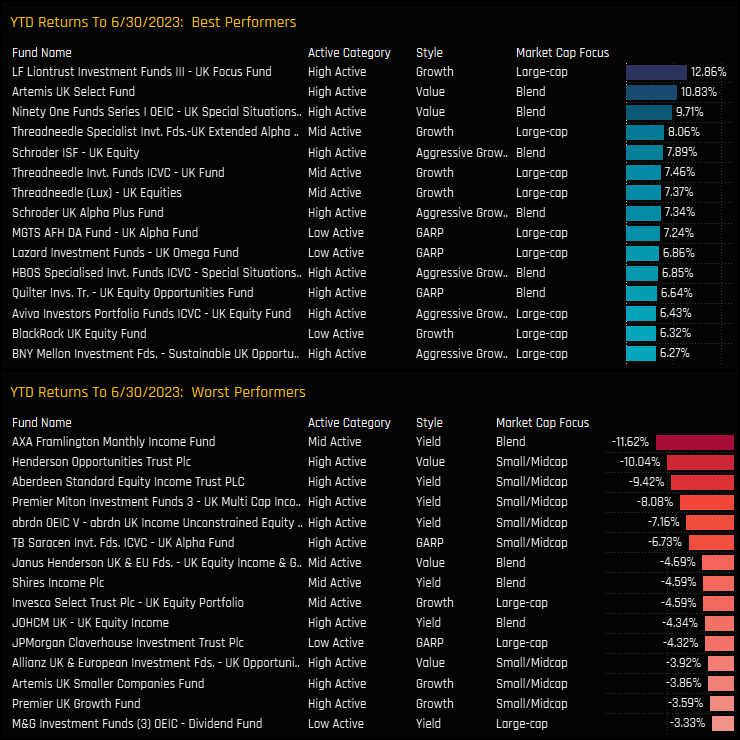
On a single fund level there were exceptions to the Style averages, with the Value strategies of Artemis UK Select (10.83%) and Ninety One UK Special Situations (9.71%) among the top performers, but behind LF Liontrust UK Focus on +12.86%. A host of Small/Midcap strategies fill the lower order, but the Blend/Yield strategy of Axa Framlington Income takes the wooden spoon, losing -11.6% over the first half of the year. If you’re interested in how your fund has performed versus your Style and Market Cap peers, please get in touch.
380 EMERGING MARKET FUNDS, AUM $392BN
Emerging Market Stock Radar
Investment levels among the thousands of stocks in the investible Emerging Markets universe differ greatly. Some stocks are widely owned, others largely avoided with ownership levels changing every month. We combine current and historical positioning against shorter-term manager activity to get a handle on where sentiment lies for every stock in our EM analysis. We highlight 8 stocks at the extreme ends of their own positioning ranges whilst also seeing significant changes in fund ownership.
Stock Sentiment
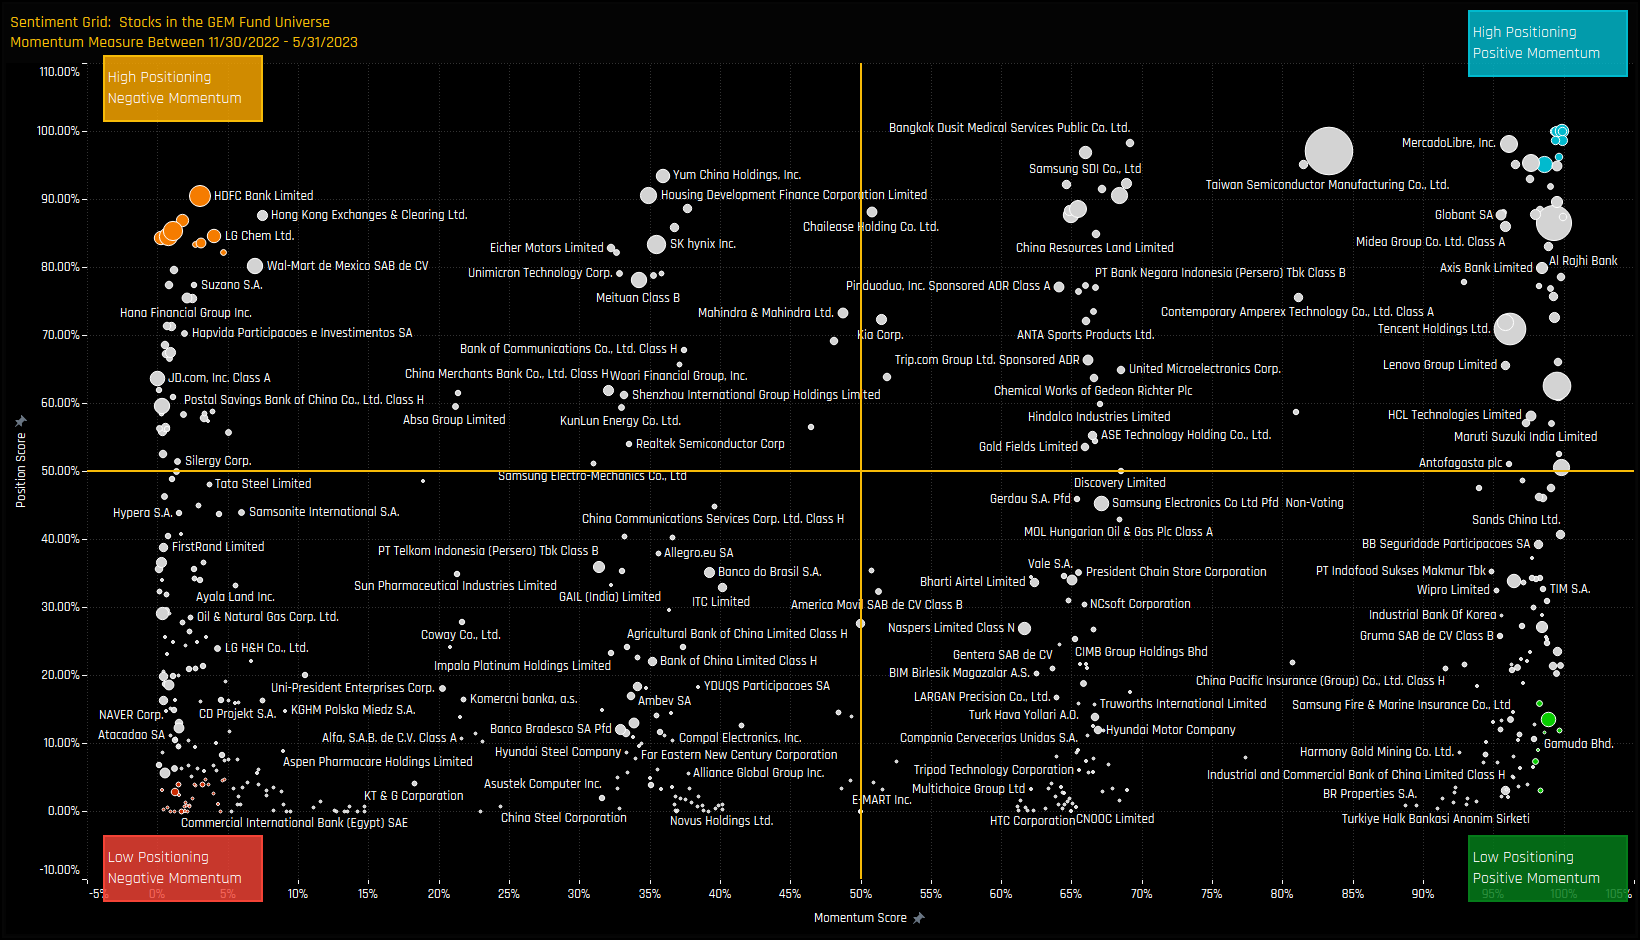
The Sentiment Grid below is designed to visualize the interplay between current fund positioning, long-term fund positioning and shorter-term fund manager activity for all stocks in the GEM fund active universe. The Y-axis shows the ‘Position Score’, a measure of current positioning in each stock compared to its own history going back to 2008 on a scale of 0-100%. It takes in to account the percentage of funds invested in each stock versus history, the average fund weight versus history and the percentage of funds overweight the benchmark versus history. The higher the number, the more heavily a stock is owned by active EM managers compared to its own history.
The X-Axis shows the ‘Momentum Score’, a measure of fund manager activity for each stock between 11/30/2022 and 05/31/2023 on a scale of 0% (maximum negative activity) to 100% (maximum positive activity). The Momentum Score takes in to account the change in the percentage of funds invested in each stock over the period, the change in average weight and the change in the percentage of funds overweight. The chart also highlights the companies at the extreme ends of each quadrant by colour, which will shall explore in more detail below.
Extreme Stocks
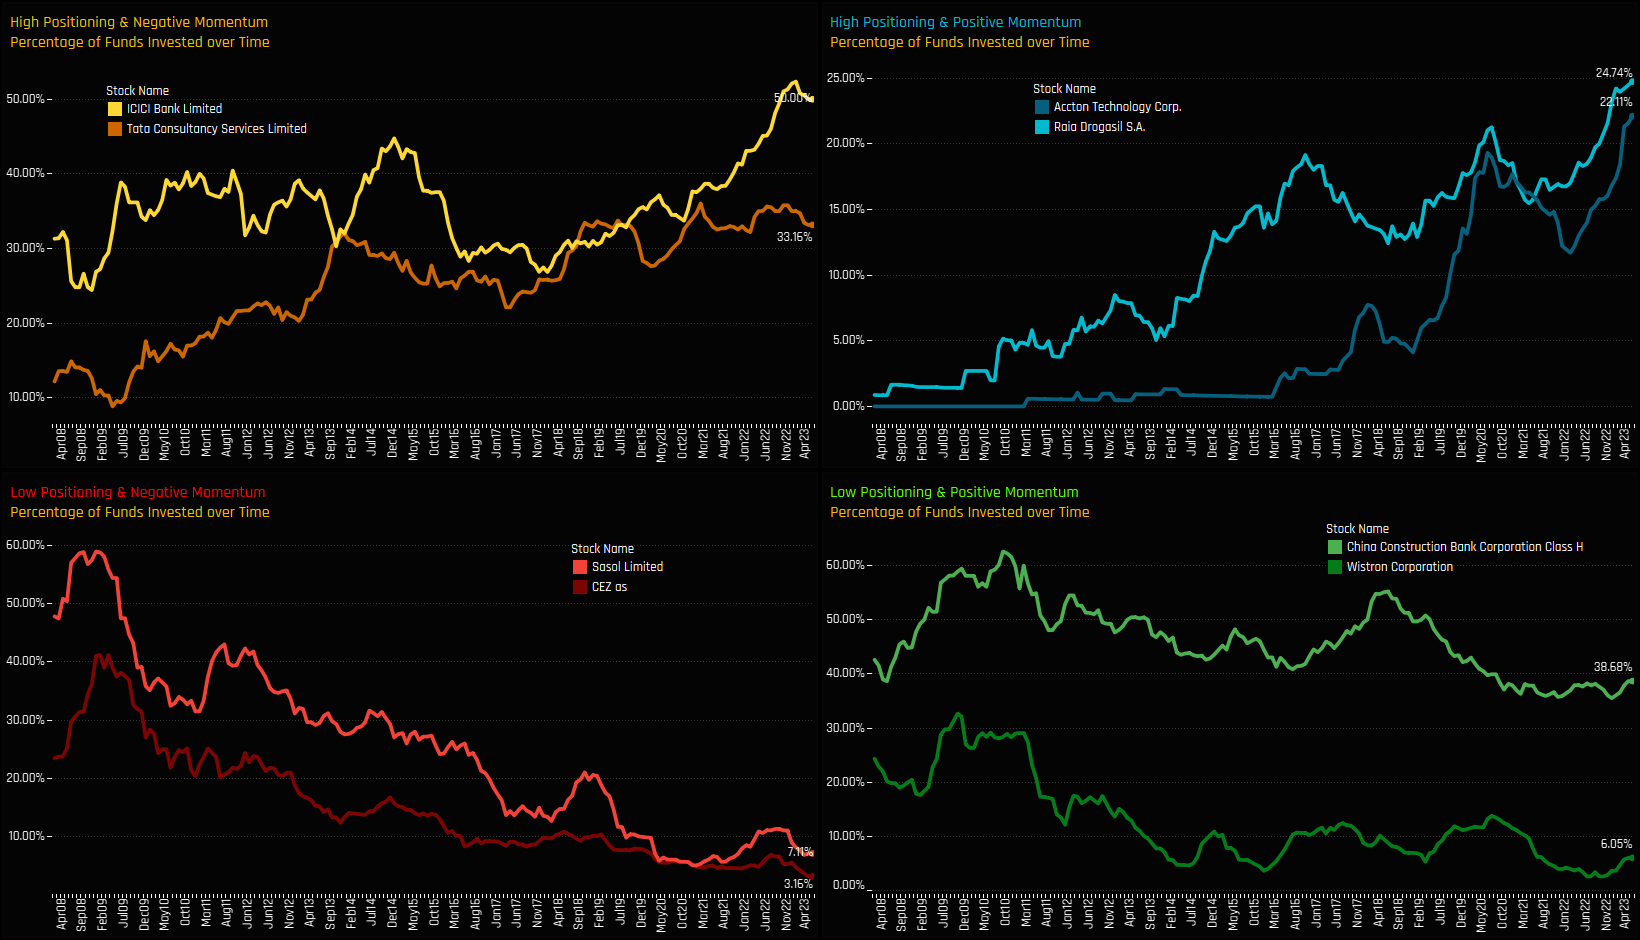
The following charts illustrate the percentage of active EM funds invested in the top 2 stocks at the extreme ends of each corner. This visualization provides an additional perspective how the Sentiment Grid works. For instance, in the top-left chart, ICICI Bank Limited and Tata Consultancy Services are experiencing a reversal from peak levels of ownership after a prolonged period of growth. In the bottom-left, both Sasol Limited and CEZ have suffered a long-term decline in ownership, with additional selling in recent months pushing exposure to its lowest levels in 15 years.
In the bottom right chart, both China Construction Bank and Wistron Corp find themselves at the lower end of their historical ownership ranges. However, both stocks have started to rebound from their lows, with a number of managers opening new positions. Finally, in the top right chart, Accton Technology Corp and Raia Drogasil are currently experiencing peak ownership levels, following consistent increases in fund exposure over the past few months. In our full report we look in detail at the fund holdings and activity that underpin these 8 extreme stocks. Please get in touch for more details.
To request access to the full reports mentioned above or inquire about a subscription to our research, please e-mail me directly on the below:
Investor Positioning Report — Copley Fund Research Ltd · Last updated: July 2026 · Registered in England and Wales
1. Who we are
Copley Fund Research Ltd provides proprietary institutional fund intelligence to listed companies and investor relations professionals. These terms govern every purchase of an Investor Positioning Report. By completing a purchase you confirm you have read, understood, and agreed to these terms in full.
2. What you are purchasing
The Investor Positioning Report is a bespoke PDF report mapping the institutional fund universe around your stock. It covers current investors, past investors, competitor investors, and white space investors. Every report is built from scratch for the specific company ordered and is not a standardised or templated product.
3. Delivery and process
Following payment or invoice issuance, Copley Fund Research will contact you within one working day to agree your competitor set. Production begins once the competitor set is confirmed in writing. The completed report will be released to you within 48 hours of production starting, provided payment has been received in full; where payment is outstanding, the report will be withheld until payment clears. If the requested company falls outside our covered fund universes, or a competitor set cannot be agreed, Copley Fund Research will issue a full refund or cancel the outstanding invoice.
4. Competitor set agreement
The competitor set is agreed with you in writing prior to production, and the report is built to that agreed specification. Requests to amend the competitor set after delivery, based on a change of preference rather than an error, may be treated as a new order.
5. Refund policy
Because each report is produced individually for your company, orders are non-refundable once production has begun, except as set out in clauses 3 and 5a below. By purchasing, you agree not to dispute the charge with your card provider on the basis that the service was not as described, provided the report has been delivered to the agreed specification or corrected under clause 5a.
5a. Quality remedy
If a delivered report contains a material error caused by Copley Fund Research — for example, an incorrect company analysed, a competitor omitted from the agreed set, or content missing from the specification in clause 2 — Copley Fund Research will correct and redeliver the report at no additional charge, within a reasonable timeframe. This is your sole remedy for such errors.
6. Data and accuracy
All fund positioning data in the report reflects holdings as disclosed at the most recently available reporting date at the time of compilation. The timing of fund holdings disclosures is determined by regulatory requirements applicable to each fund and is outside the control of Copley Fund Research Ltd. This data may not reflect current fund positions. Copley Fund Research takes reasonable care to ensure accuracy but makes no warranty, express or implied, as to the completeness or current accuracy of the underlying data — though this does not affect the quality remedy in clause 5a for errors in how that data was analysed or presented. Past fund positioning is not indicative of future fund behaviour or investment decisions.
7. Not investment advice
The Investor Positioning Report is produced for investor relations intelligence purposes only. It does not constitute investment advice, financial advice, or a recommendation to buy, hold, or sell any security. The data reflects historical fund positioning and must not be relied upon as a prediction of future fund behaviour or investment decisions. Copley Fund Research Ltd is not authorised or regulated by the Financial Conduct Authority for the provision of investment advice.
8. Permitted use and confidentiality
The report is licensed for internal use by the purchasing organisation only. You may share it with employees and directors of your organisation. You may not: reproduce, redistribute, publish, or resell the report or any part of it; share it with any third party outside your organisation without prior written consent; use the fund or portfolio manager names contained in the report to approach those individuals on behalf of Copley Fund Research or in a manner that could damage Copley Fund Research's relationships with those funds; or use the data for any purpose other than your own investor relations strategy. The data, analysis, and methodology contained in the report are the intellectual property of Copley


