Global active funds make tentative moves back in to Japanese equities after a 5-year decline.
Time-Series and Country Rotation
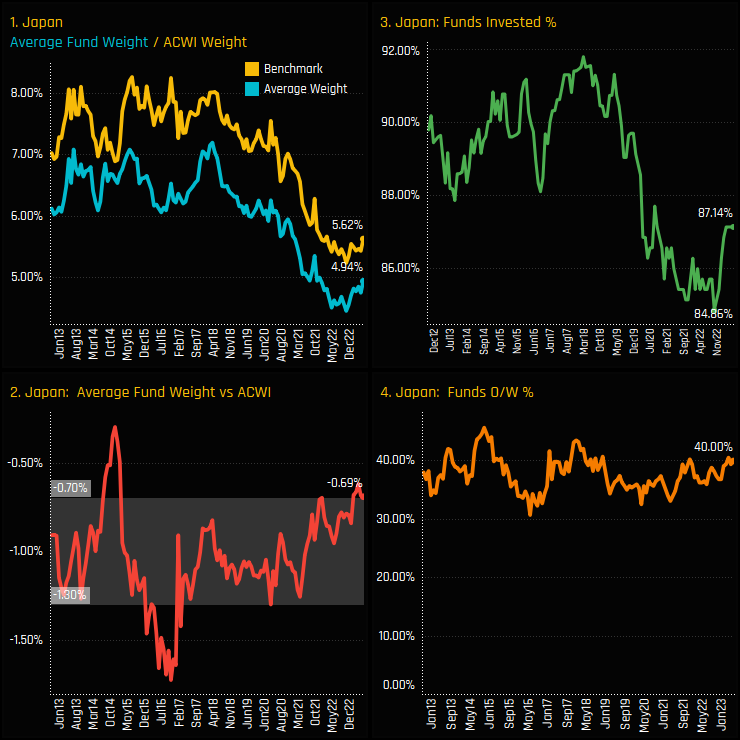
After a 5 year decline in Japanese exposure, active Global fund managers are beginning to warm to Japan’s investment credentials. Ownership levels in Japanese equities bottomed out in September of last year with 84.9% of funds invested, but took a big spike higher to 87.14% as of the end of last month. Versus the iShares MSCI ACWI ETF, Japan has been a consistent underweight over the last decade, but today’s level of -0.69% below benchmark sits at the top end of the long-term range (ch2).
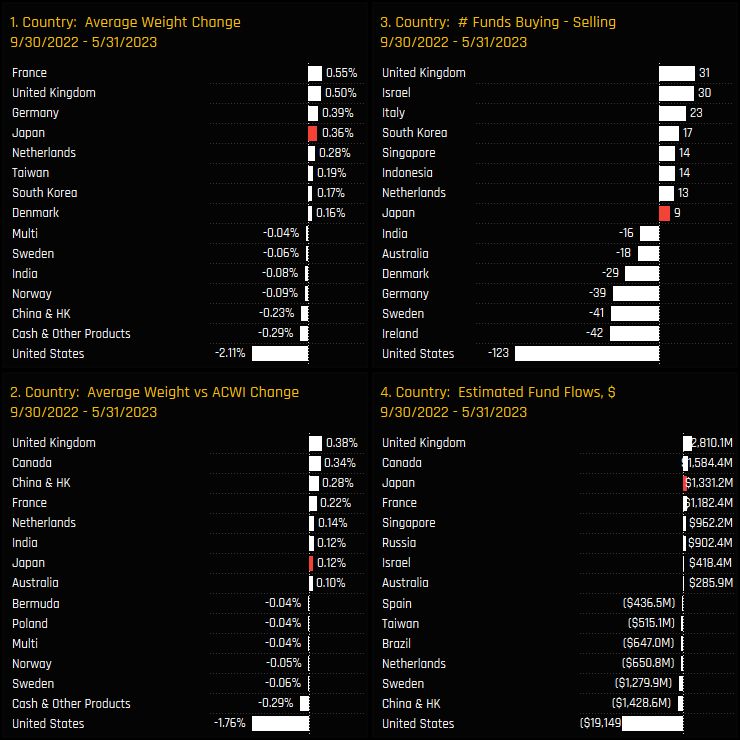
Between the lows of 09/30/2022 and the end of last month, Japan has been among the top beneficiaries of active manager rotation. Alongside some of the major EMEA nations (see USA: Record Underweight as Shift to Europe Accelerates), Japan has seen average weights and relative weights increase, with an excess of buyers over sellers over the period. And of the $24bn in net fund outflows over that period, Japan was one of the few nations to capture inflows, attracting a further $1.3bn of new fund investment.
Country Positioning and Fund Holdings
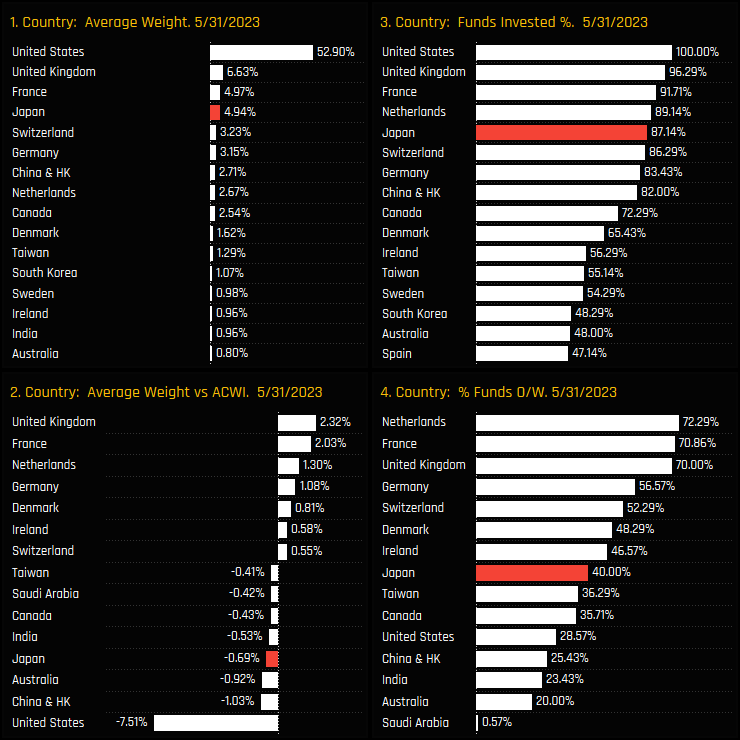
The latest country level ownership statistics are highlights in the chart quadrant below. Japan is the 4th largest average country weight after the USA, UK and France and the 5th most widely held after the Netherlands. Versus the benchmark, Japan is the 4th largest underweight, with managers instead positioned overweight the UK, France and most of the major European nations.
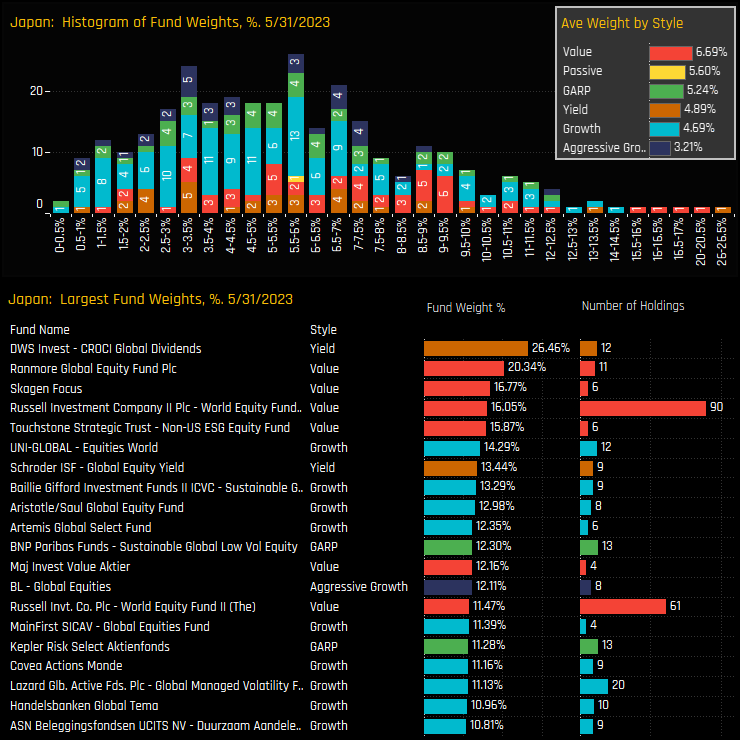
The histogram of individual fund weights in Japan shows the bulk of allocations are between the 2% and 8% level, but with a long tail to the upside. Fund allocations are well correlated to Style, with Value funds more heavily exposed than their Growth peers (inset chart). The Yield strategy of DWS CROCI Global Dividends is the largest holder on 26.46%, followed by a raft of Value strategies from Ranmore, Skagen and Russell, among others.
Fund Activity & Long-Term Style Trends
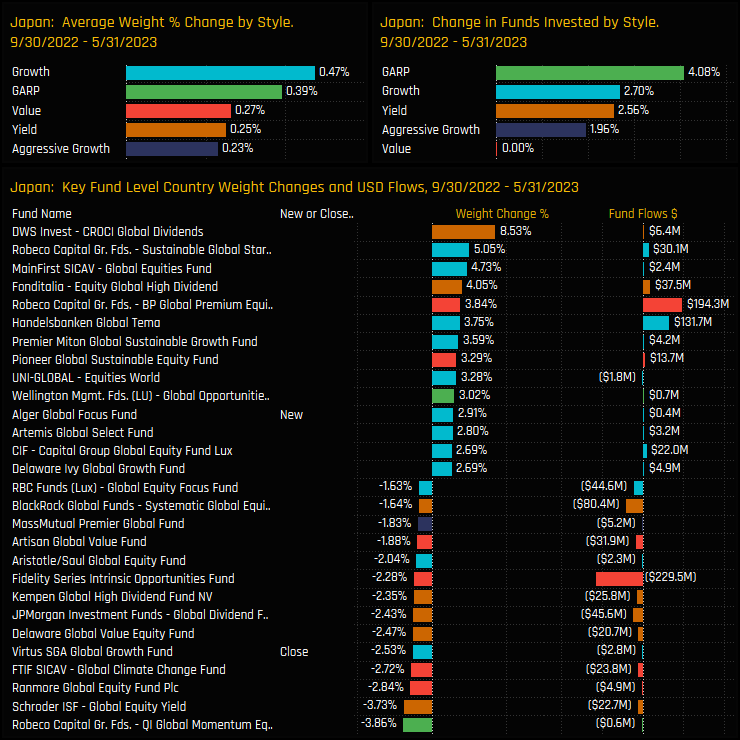
The fund level changes driving this allocation shift are highlighted in the bottom chart. Between 09/30/2022 and 05/31/2023, funds increasing weight outnumbered those decreasing by a factor of 2, with DWS CROCI Global Dividends (+8.5%), Robeco Sustainable Global Stars (+5.05%) and MainFirst Global Equities (+4.7%) top of the list. There were plenty of funds who reduced exposure, but on aggregate all Style groups saw weights increase and the percentage of funds invested rise (top charts).
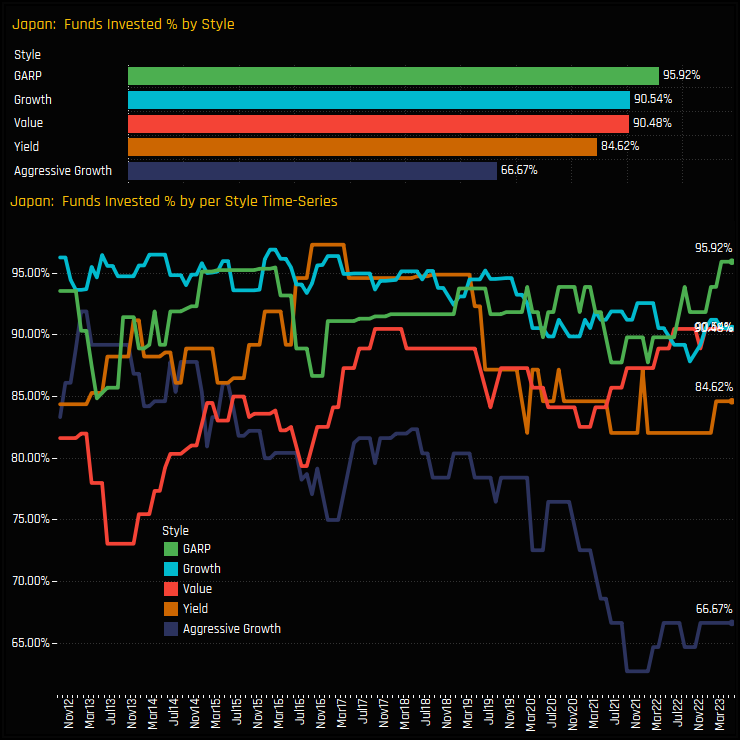
The longer-term trends in Japanese ownership highlights a widening of the spread between Value and Aggressive Growth Funds. The bottom chart below shows the percentage of funds in each Style group with exposure to Japan since 2012. The 90.5% of Value funds invested in Japan is the highest on record, whilst the 66.7% of Aggressive Growth funds is a sharp decline from the highs of 2012 and is close to the lowest on record. Perhaps the moderate increase in Aggressive Growth exposure since September of last year represents a turning point in this downward trend.
Stock Holdings & Activity
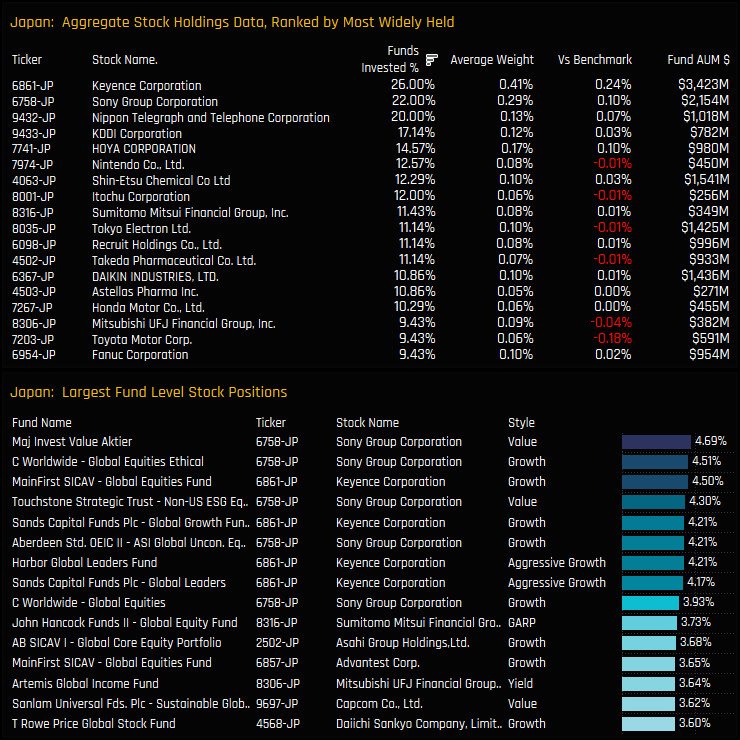
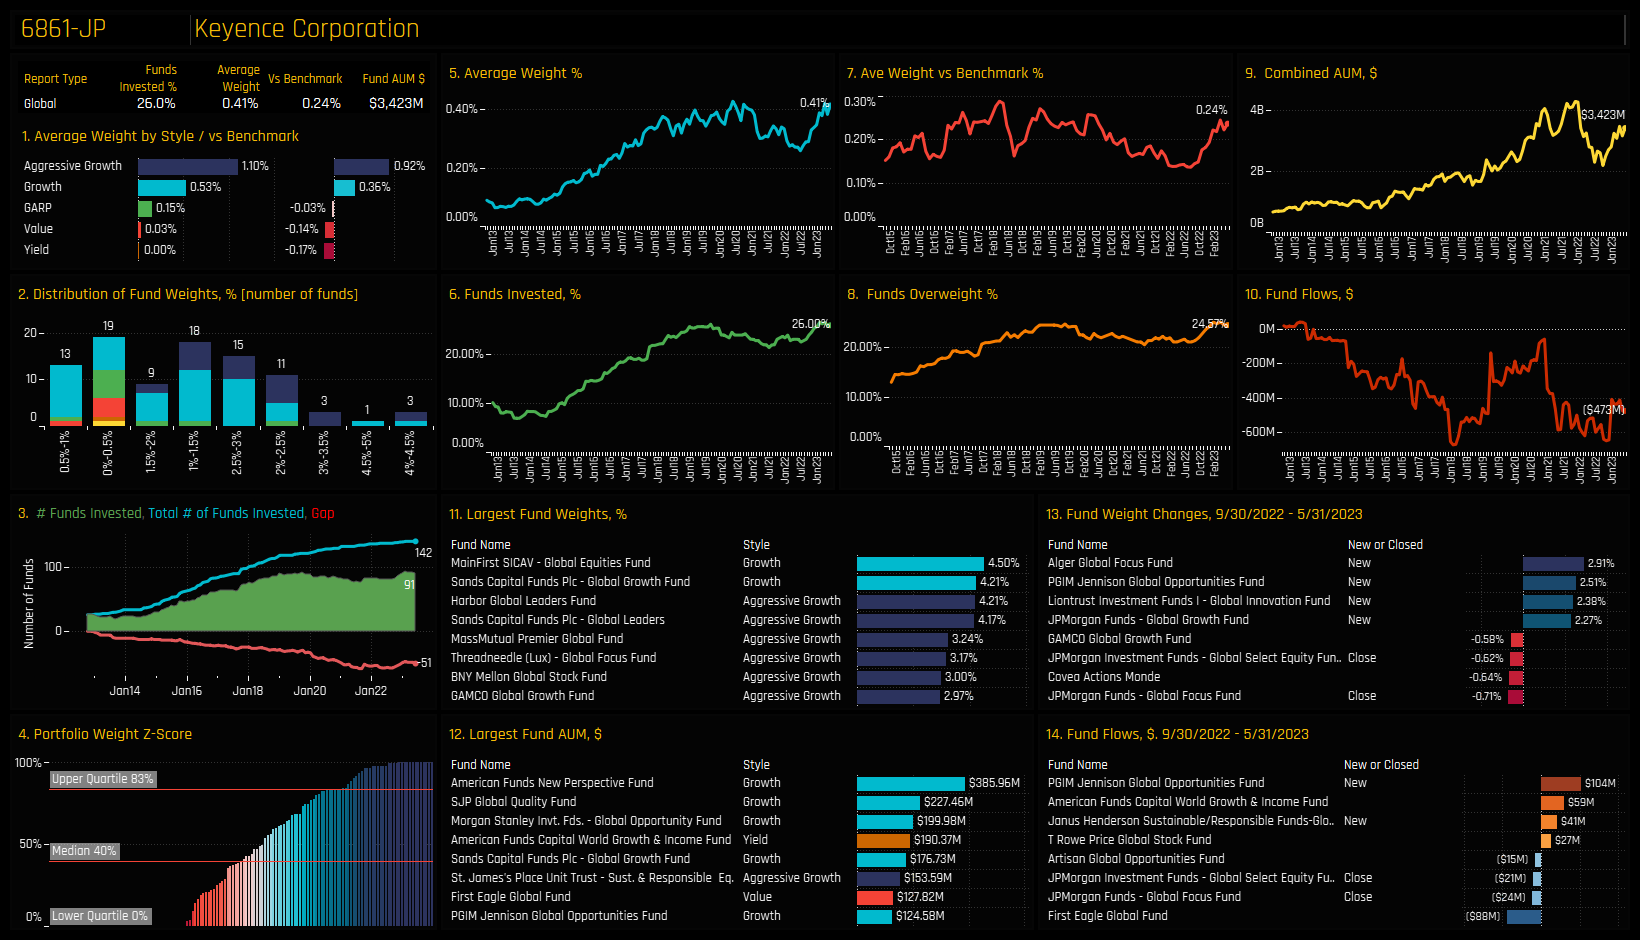
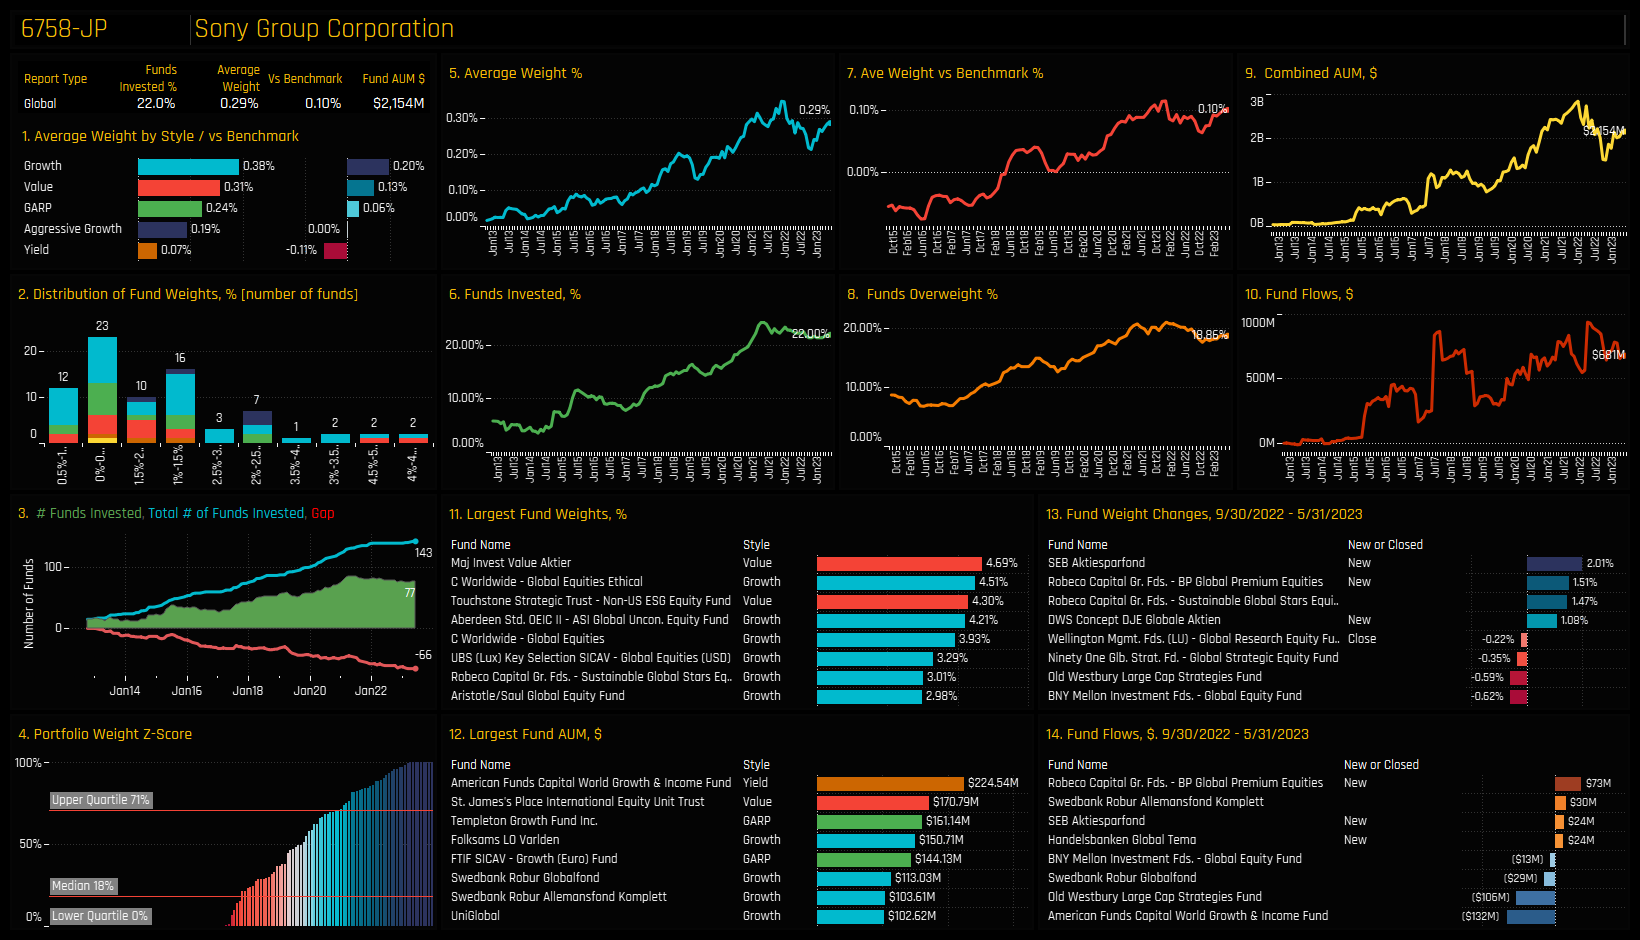
The stock holdings picture in Japan is relatively thin, with just 3 companies held by more than 20% of the funds in our analysis. This compares to 42 companies in the USA, 7 companies in the UK and 5 in France. Top of the list is Keyence Corp, owned by 26% of the Global funds in our analysis at an average weight of 0.41%, or overweight the benchmark by 0.24%. It is also prevalent in the bottom chart, which highlights the largest individual fund level stock positions. The largest positions are in Sony Group Corp by Maj Invest Value (4.69%) and C Worldwide Global Ethical (4.51%).
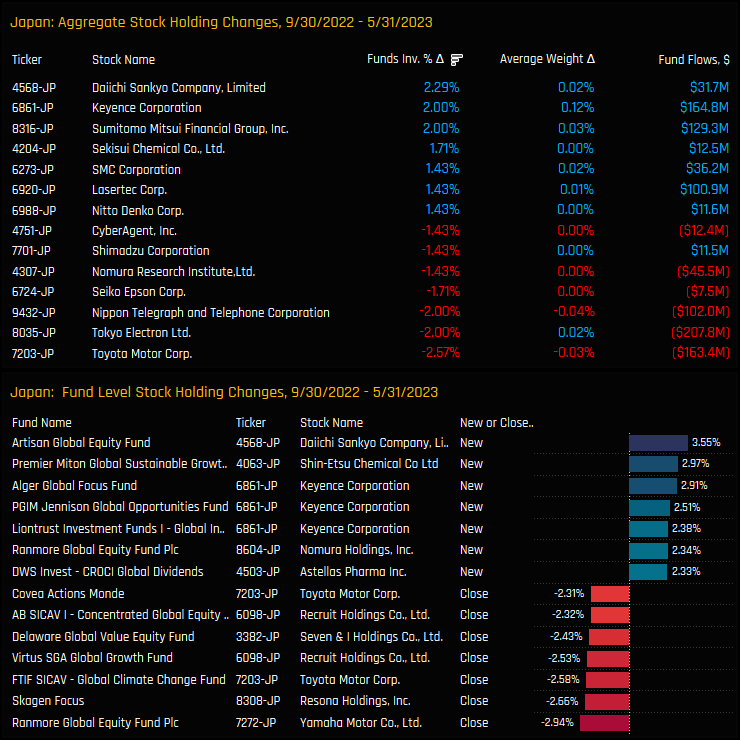
The stocks underpinning the rise in Japan investment are highlighted in the charts below. Ownership increases were led by Daiichi Sankyo Company, Keyence Corp and Sumitomo Mitsui Financial Group, with new positions from Artisan Global Equity, Alger Global and PGIM Jennison Global Opportunities, among others. It wasn’t all positive however, with declines in ownership in Toyota Motor Corp (see Stock Radar below), Tokyo Electron and Nippon Telegraph and Telephone Corporation.
Conclusions and Data Report
Sentiment towards Japan is improving. After a 5-year bear market in Global fund ownership, active managers are turning their attention back towards Japan, increasing allocations across the Style groups and reinstating once closed positions.
As per our analysis above, this hasn’t been a slam dunk ‘buy everything’ move. There were plenty of sellers during our period of change (09/30/2022 – 05/31/2023), with managers selective on the companies they are buying in order to increase exposure. Look towards Keyence Corp, a perennial favourite among Global investors, but also less well owned companies such as Daiichi Sankyo Company and Sumitomo Mitsui Financial Group.
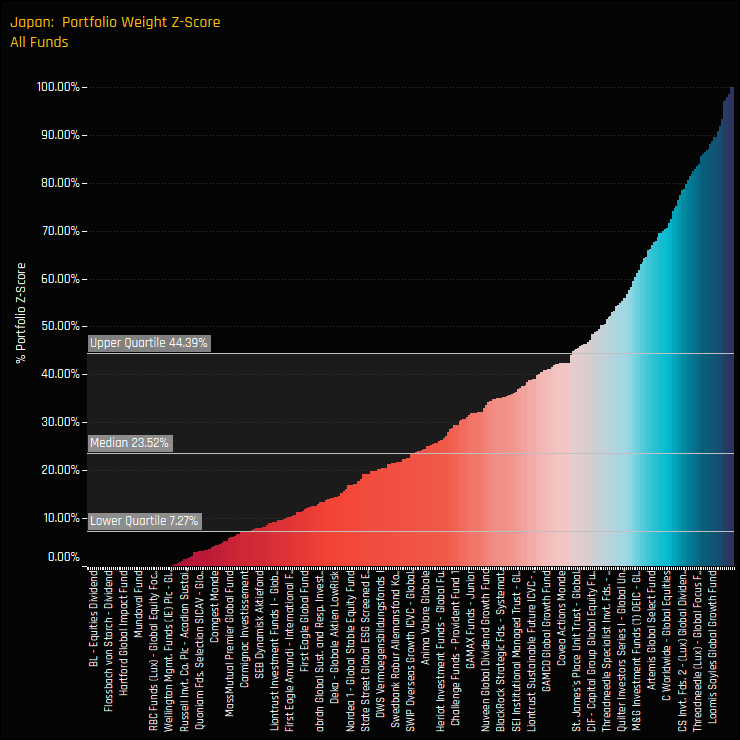
The chart opposite shows the Z-score of fund weights in Japan for all of the 350 Global funds in our analysis. If a fund is at their maximum ever weight in Japan, that score would be 100%, or 0% the lowest. With 75% of managers showing a Z-score of less than 44% and half with a score of less than 23.5%, today’s ownership levels are low in a historical context.
With Global investors buying back in to Japan from a position of low ownership, we could be in the early stages of a significant re-weighting towards Japan.
Please click the link below for an extended data report on Japan. Scroll down for stock profiles on Keyence Corp and Sony Group.
Outperformance from key US Technology stocks pushes average weights to record highs, but benchmarks make larger gains.
Time-Series & Country/Sector Rotation
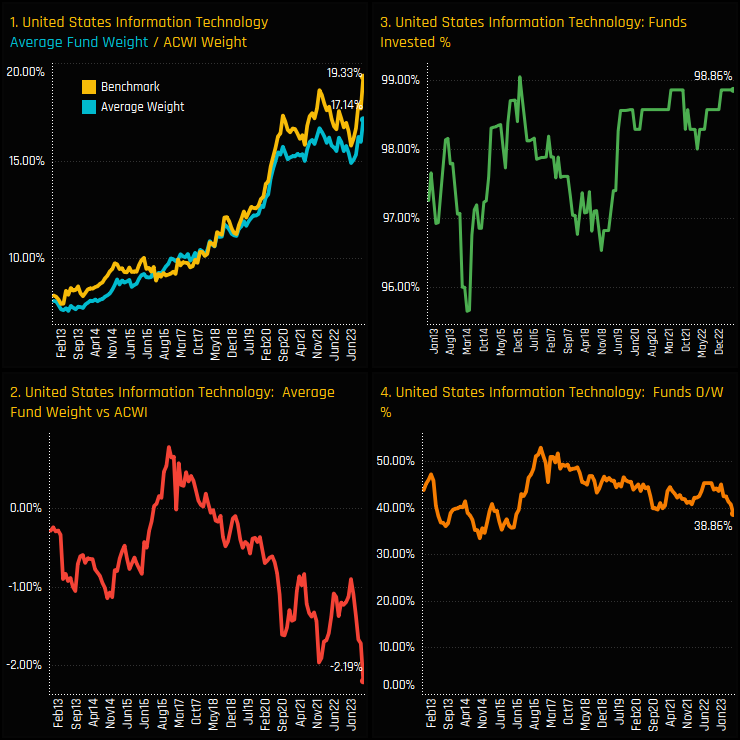
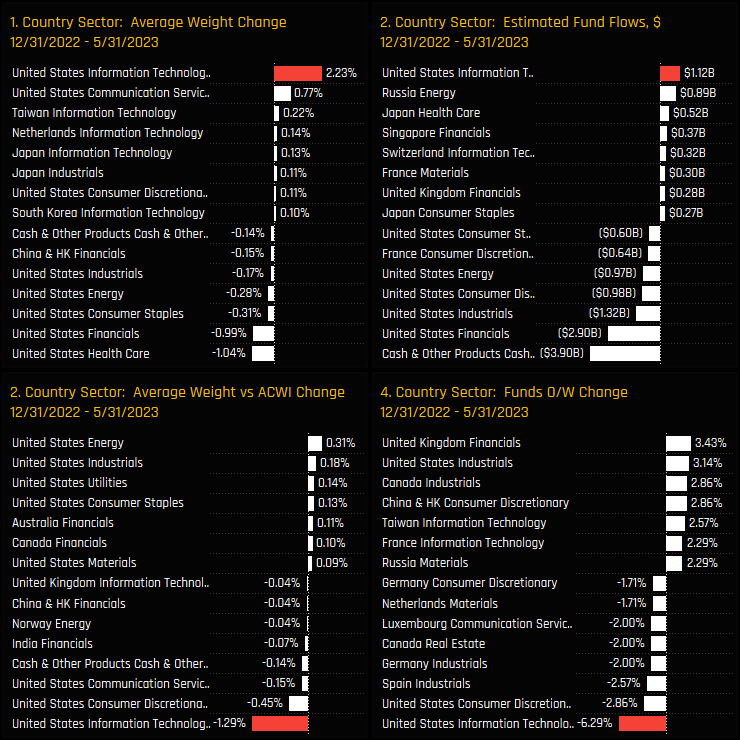
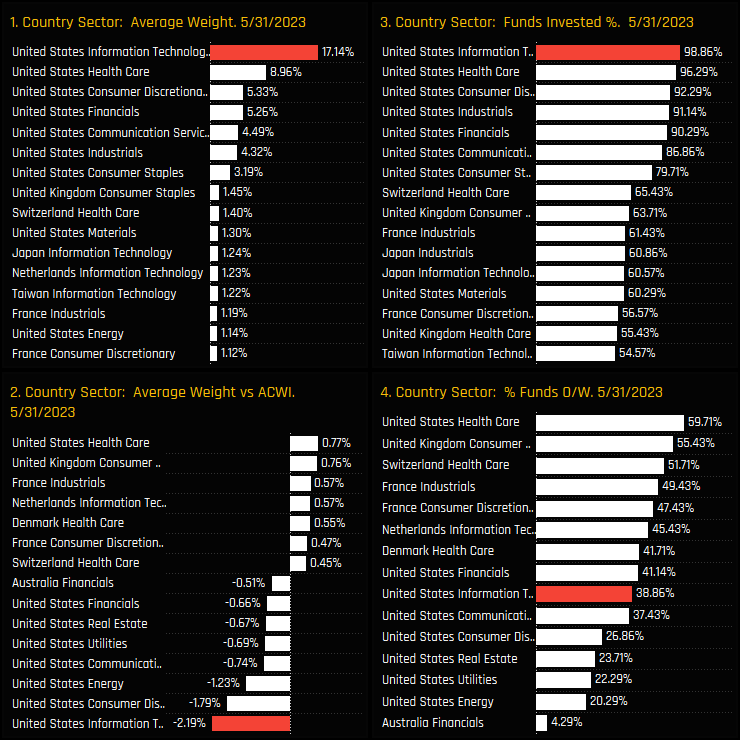
Global equity funds are at their highest ever allocation in the US Information Technology sector. Average fund weights among the Global funds in our analysis stand at a record 17.14%, resuming the upward trend that started during the COVID Pandemic and breaking a 2-year period of consolidation (ch1). At the same time however, benchmark weights are also at record highs, pushing the net underweight to a record -2.19% below the iShares MSCI ACWI ETF (ch2). Despite the record underweight, there are still 38.8% of funds positioned overweight, with the investor base very much split dependent on their Style bias, as we shall see below.
Since the most recent lows back in 12/31/2022, the US Technology sector sit at the extreme ends of our ownership change metrics. On an absolute basis, average weights soared by +2.23%, with US Technology capturing the largest fund inflows despite large outflows in other US sectors, such as US Financials and US Industrials. Versus the benchmark the picture is reversed. Active Global managers saw underweights increase more than any other country/sector (-1.29%) as a further -6.3% of funds moved to underweight. Effectively, active managers are struggling to keep pace with rising prices that are driving up index weights to record levels.
Country/Sector Positioning and Fund Holdings
These moves increase the dominance of US Technology within Global equity portfolios. Average holding weights of 17.14% are more than double the weight of US Health Care and triple the weight of either US Financials and US Consumer Discretionary. The underweight is also dominant, forming the bulk of an ever growing underweight in US equities (see USA: Record Underweight as Shift to Europe Accelerates), alongside US Consumer Discretionary and US Energy.
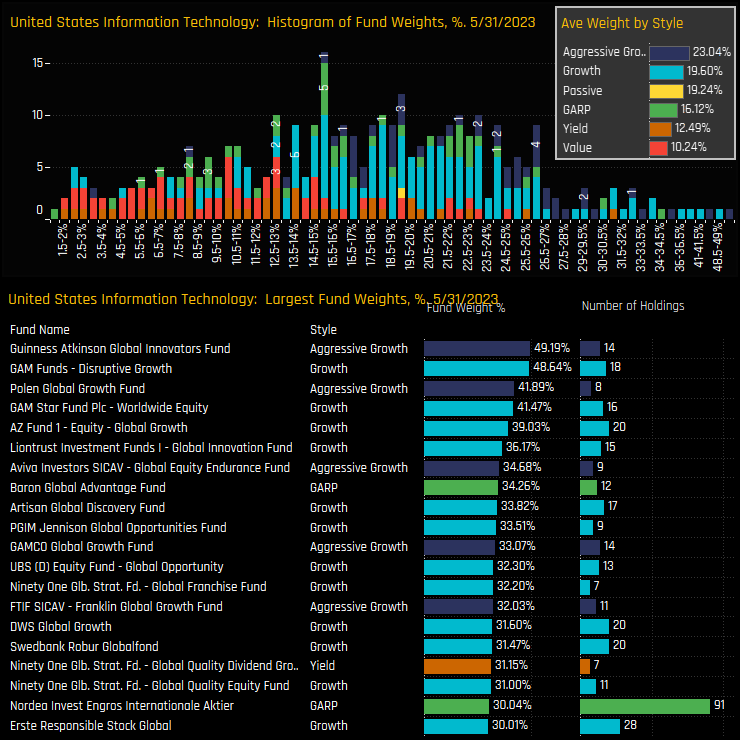
The histogram of Global fund weights in US Technology in shown the top chart below. They cover a large range, with the bulk of positions between 12% and 26% and an upside tail that stretches to 49.2% for Guinness Atkinson Global Innovators and 48.6% for GAM Disruptive Growth. The Style bias is also evident, with the majority of Value funds below 12% and the majority of Growth fund above 14%. The inset chart shows the average Aggressive Growth fund weight more than double the average Value fund weight.
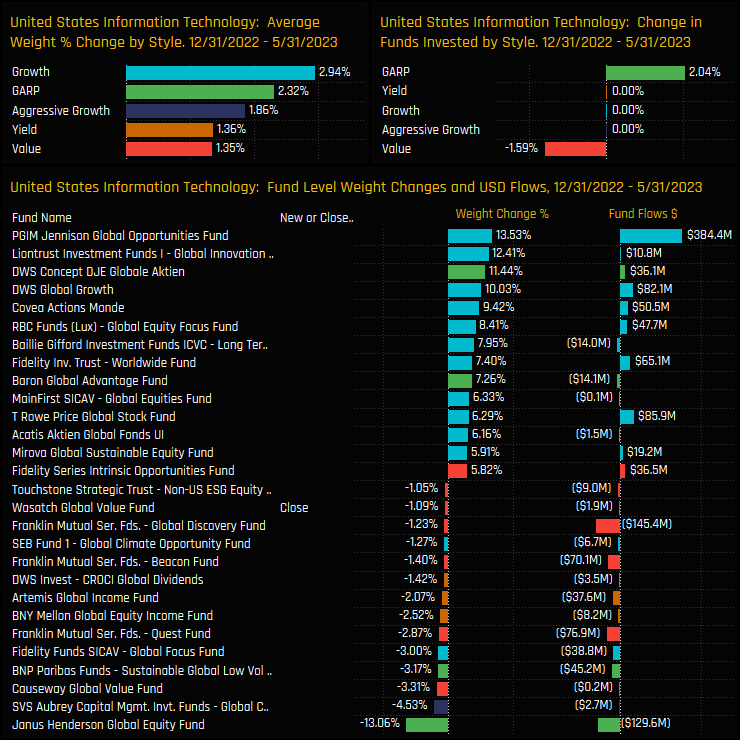
Style Trends and Fund Activity
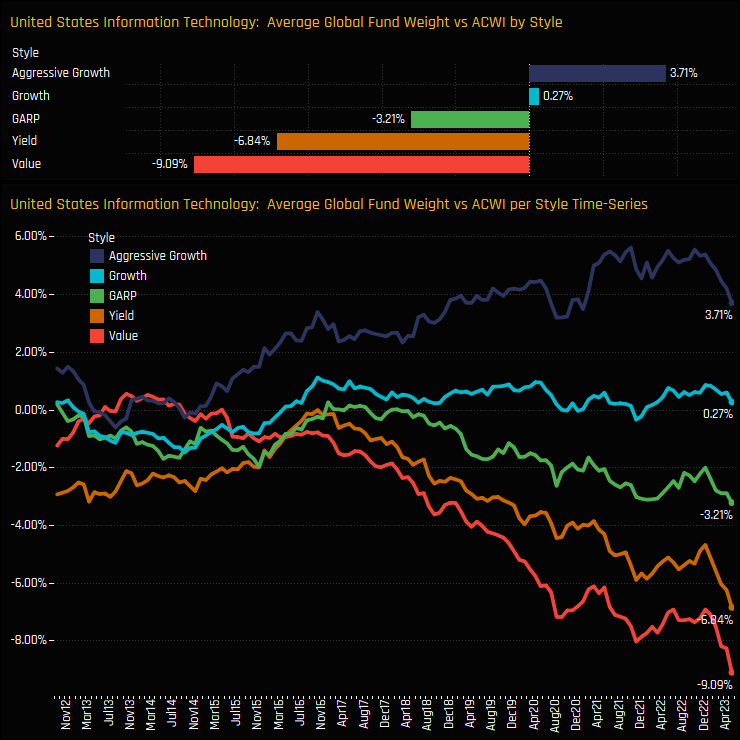
This long-term dislocation between Growth and Value fund exposure in US Technology is highlighted below. The bottom chart shows the average fund weight relative to the benchmark in US Technology split by Style and the top chart the latest snap. Is shows a consistent overweight position in US Technology by Aggressive Growth and Growth funds, versus an increasing underweight by GARP, Yield and Value investors. This is as polarized a sector view as you will find in Global investing.
Over a shorter time horizon (12/31/2022 – 05/31/2023), fund activity was positive but mostly driven by price changes rather than any clear rotation. For example, the number of funds seeing weight increases in US Tech over the period was 309, compared to just 39 seeing decreases. Yet the number of actual buyers in US Tech (121) was fairly equal to the number of sellers (116).
Stock Positioning & Activity
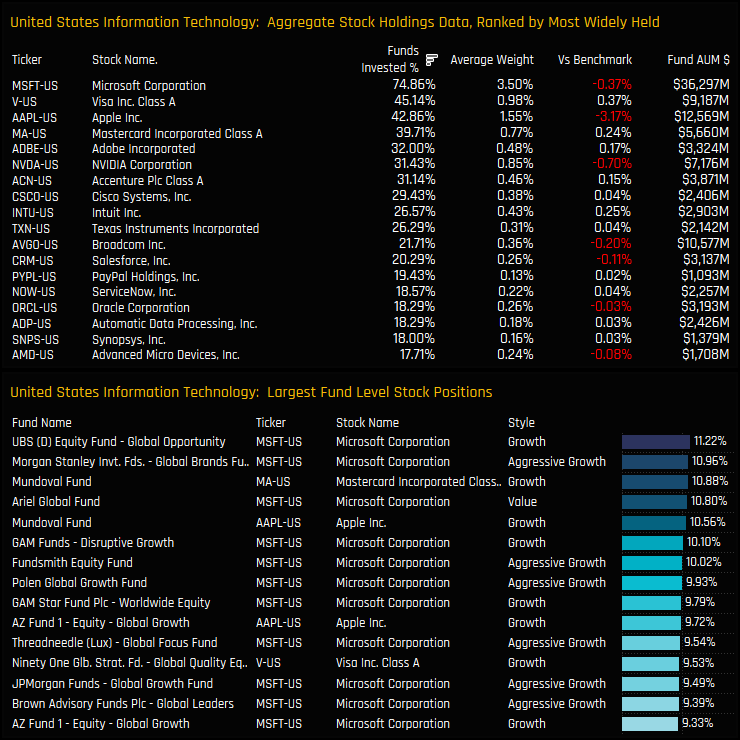
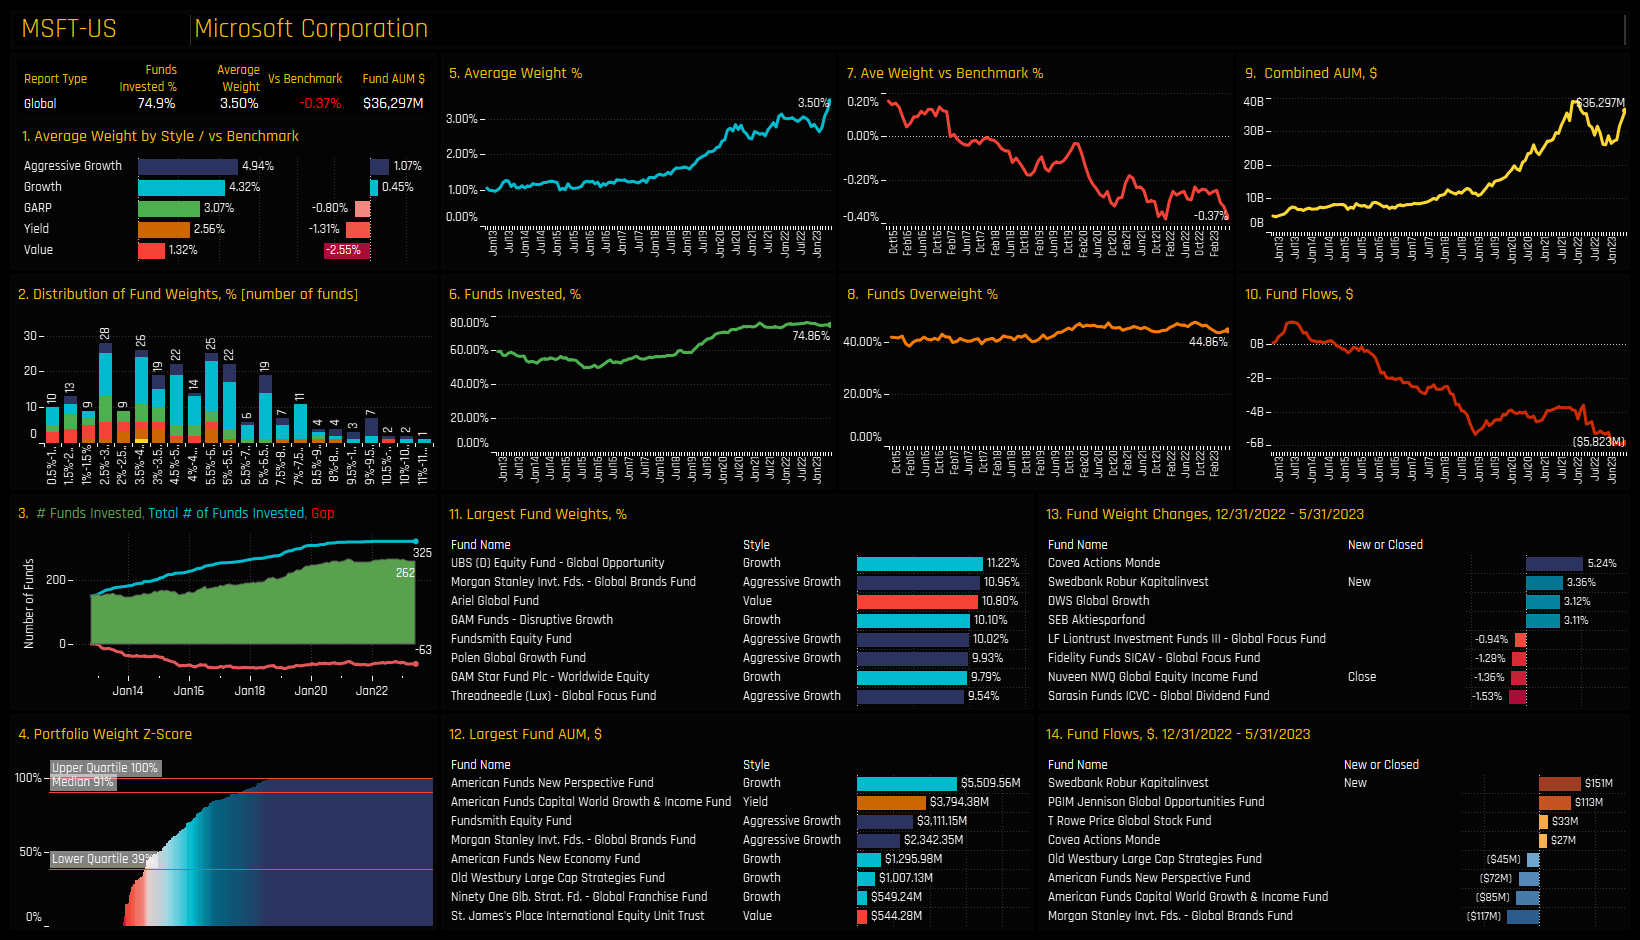
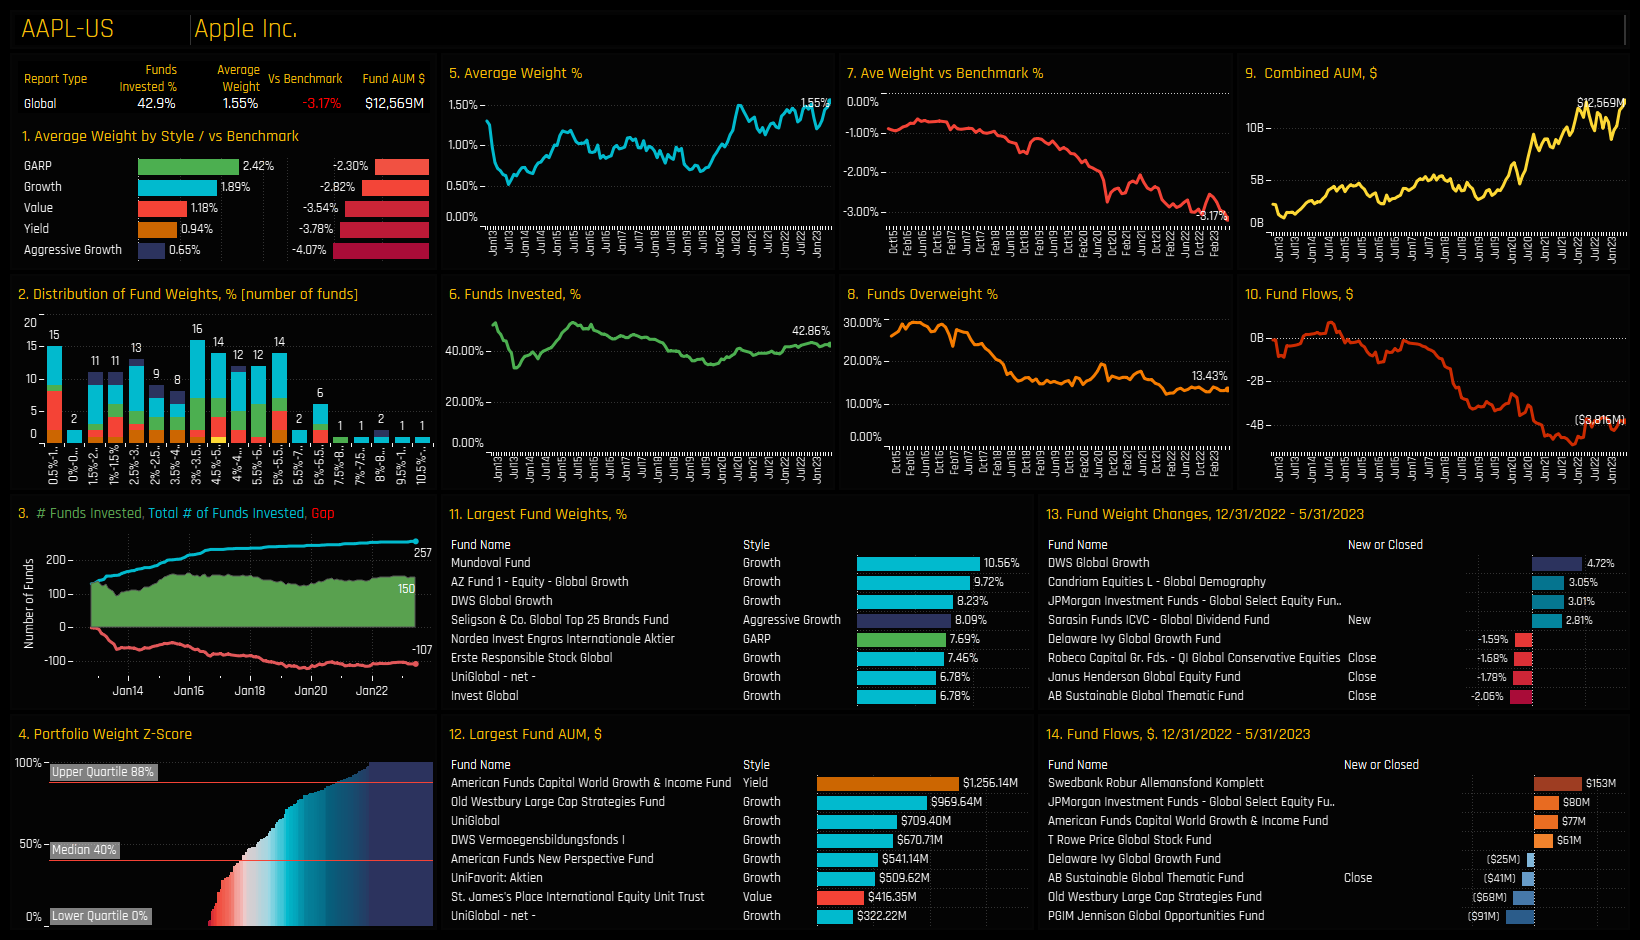
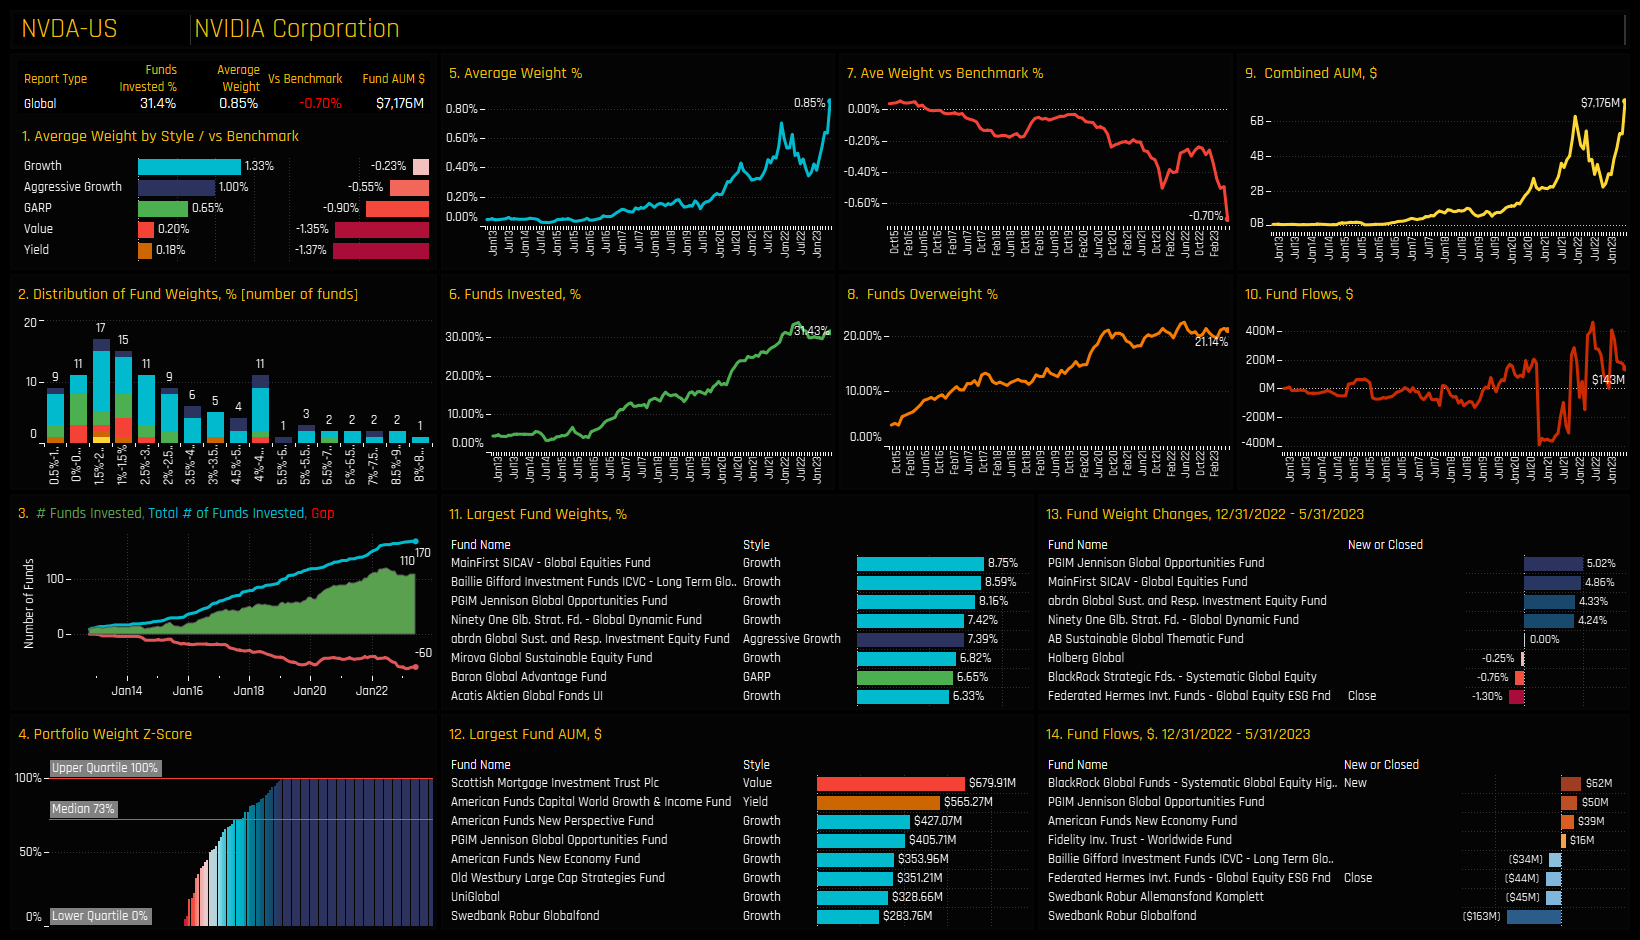
Stock positioning in US Technology is dominated by Microsoft Corp, a company owned by 74.9% of Global funds at an average weight of 3.5%. Visa and Apple Inc are owned by 45.1% and 42.9% of funds respectively, though Apple commands the larger average weight of 1.55% versus 0.98%. At these levels, Apple is a big underweight for Global investors at -3.17% behind the benchmark, alongside NVIDIA at -0.7%. Microsoft dominates the list of large stock level fund positions in the bottom chart.
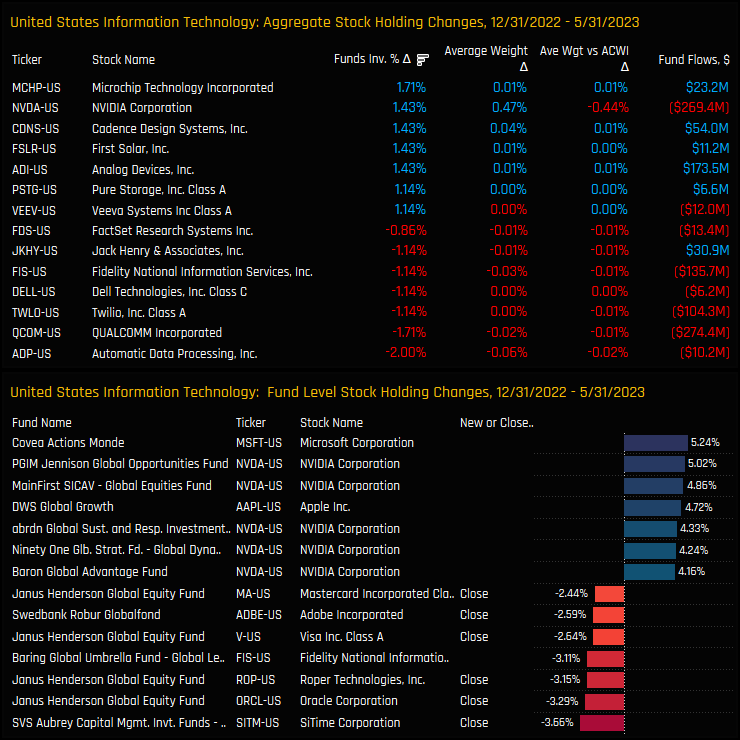
Aggregate stock activity between 12/31/2022 and 05/31/2023 was fairly evenly balanced. Increases in ownership in Microchip Technology Incorporated and NVIDIA Corp were offset by decreases in Automatic Data Processing and QUALCOMM Incorporated. The more interesting stat is the increase in NVIDIA underweight by -0.44%, simply on the back of the 179% price increase this year on an existing net underweight.
Conclusions & Data Report
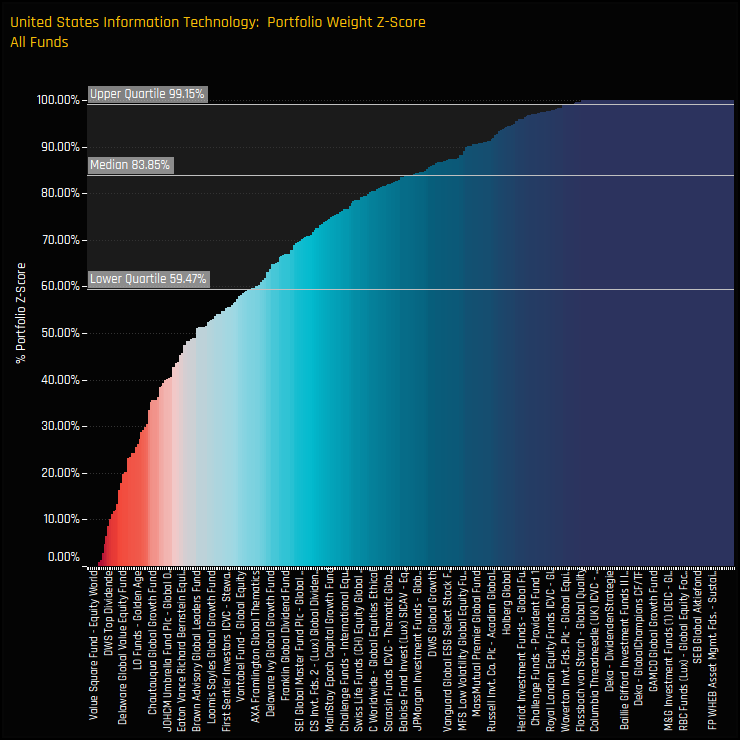
Stellar performance from key stocks in the US Technology sector have simultaneously pushed average weights to all-time highs and underweights to all-time lows. The chart to the right shows the Z-Score of Global fund weights, but this time for the US Technology sector. It is in stark contrast to Japan above, with 25% of funds close to their maximum ever weight in US Tech and 50% with Z-Scores above 84%. This is a well owned sector on every level.
Over the course of 2023, it doesn’t appear that investors are aggressively moving to an underweight stance, it’s more a function of rising prices on existing underweight exposures. The majority of the increased underweight came from Apple Inc (-0.62%) and NVIDIA (-0.44%), both of whom have seen strong outperformance this year. Funds that don’t own these stocks could move from a US Tech overweight to an underweight on the strength of benchmark weight increases alone, without any actual active re-positioning.
This doesn’t avoid the longer term move by funds at the Value end of the spectrum, who are moving further away from benchmark exposure and who stand at record underweights today. But these underweights have been in place for some time, and they are only getting more painful.
Click below for a detailed positioning report on the US Technology Sector. Scroll down for stock profiles of Microsoft, Apple and NVIDIA.
Investment levels among the thousands of stocks in the investible Global universe differ greatly. Some stocks are widely owned, others largely avoided with ownership levels changing every month. We combine current and historical positioning against shorter-term manager activity to get a handle on where sentiment lies for every stock in our Global analysis. We highlight 8 stocks at the extreme ends of their own positioning ranges whilst also seeing significant changes in fund ownership.
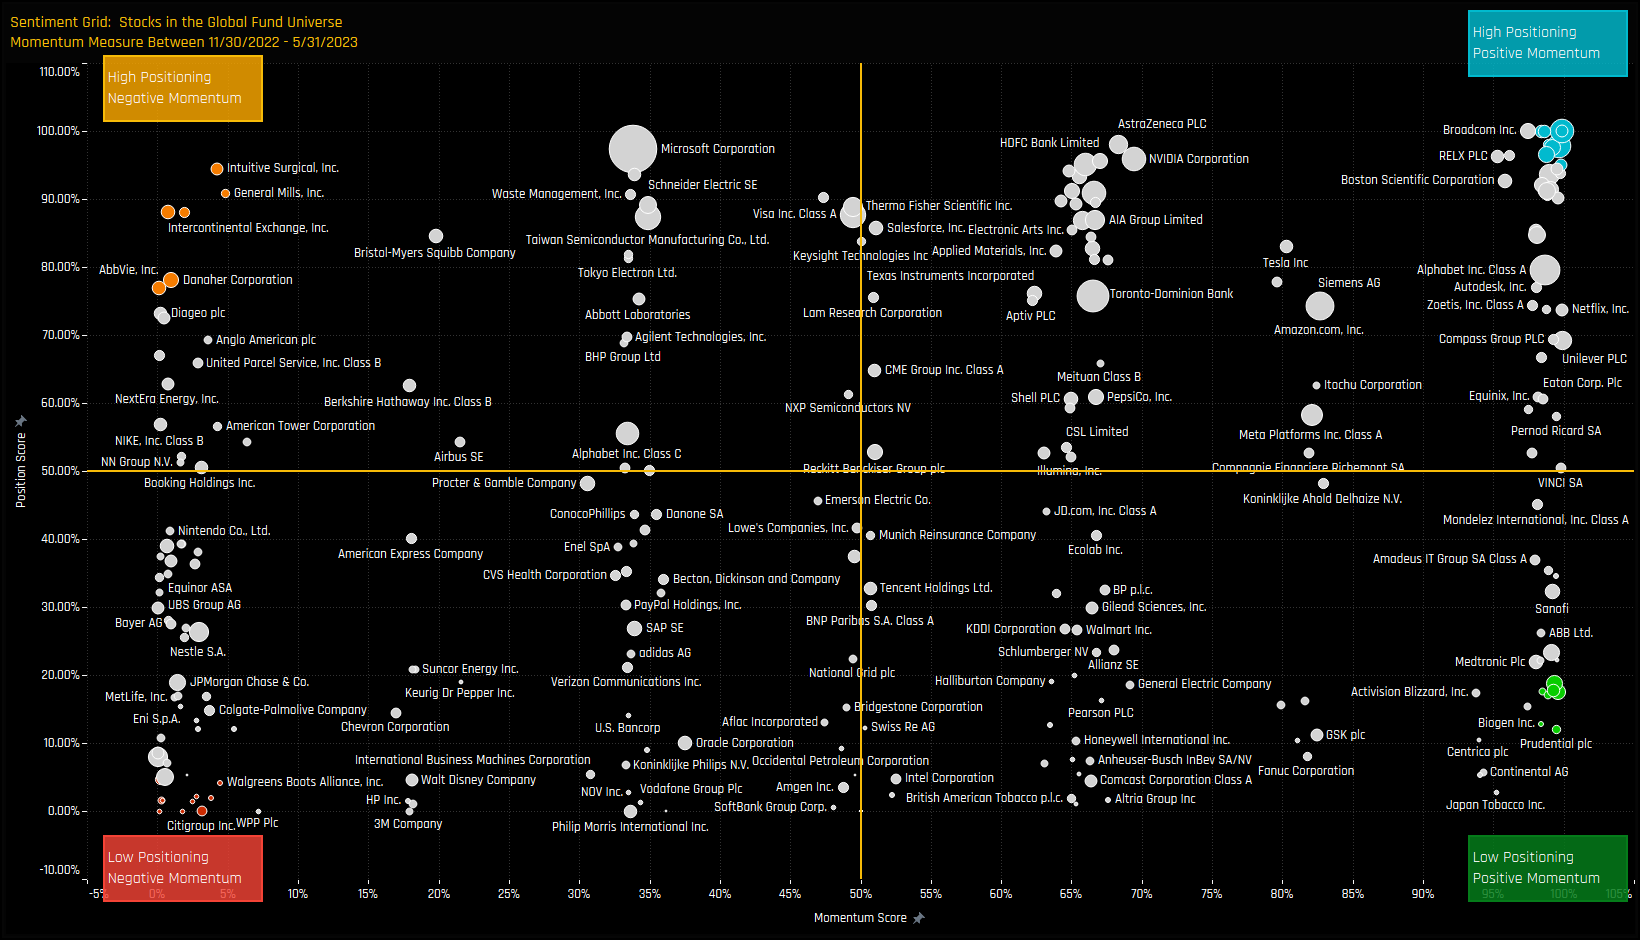
The Sentiment Grid
The Sentiment Grid below is designed to visualize the interplay between current fund positioning, long-term fund positioning and shorter-term fund manager activity for all stocks in the Global active fund universe. The Y-axis shows the ‘Position Score’, a measure of current positioning in each stock compared to its own history going back to 2012 on a scale of 0-100%. It takes in to account the percentage of funds invested in each stock versus history, the average fund weight versus history and the percentage of funds overweight the benchmark versus history. The higher the number, the more heavily a stock is owned by active Global managers compared to its own history.
The X-Axis shows the ‘Momentum Score’, a measure of fund manager activity for each stock between 11/30/2022 and 05/31/2023 on a scale of 0% (maximum negative activity) to 100% (maximum positive activity). The Momentum Score takes in to account the change in the percentage of funds invested in each stock over the period, the change in average weight and the change in the percentage of funds overweight. The chart also highlights the companies at the extreme ends of each quadrant by colour, which will shall explore in more detail below.
Extreme Stocks
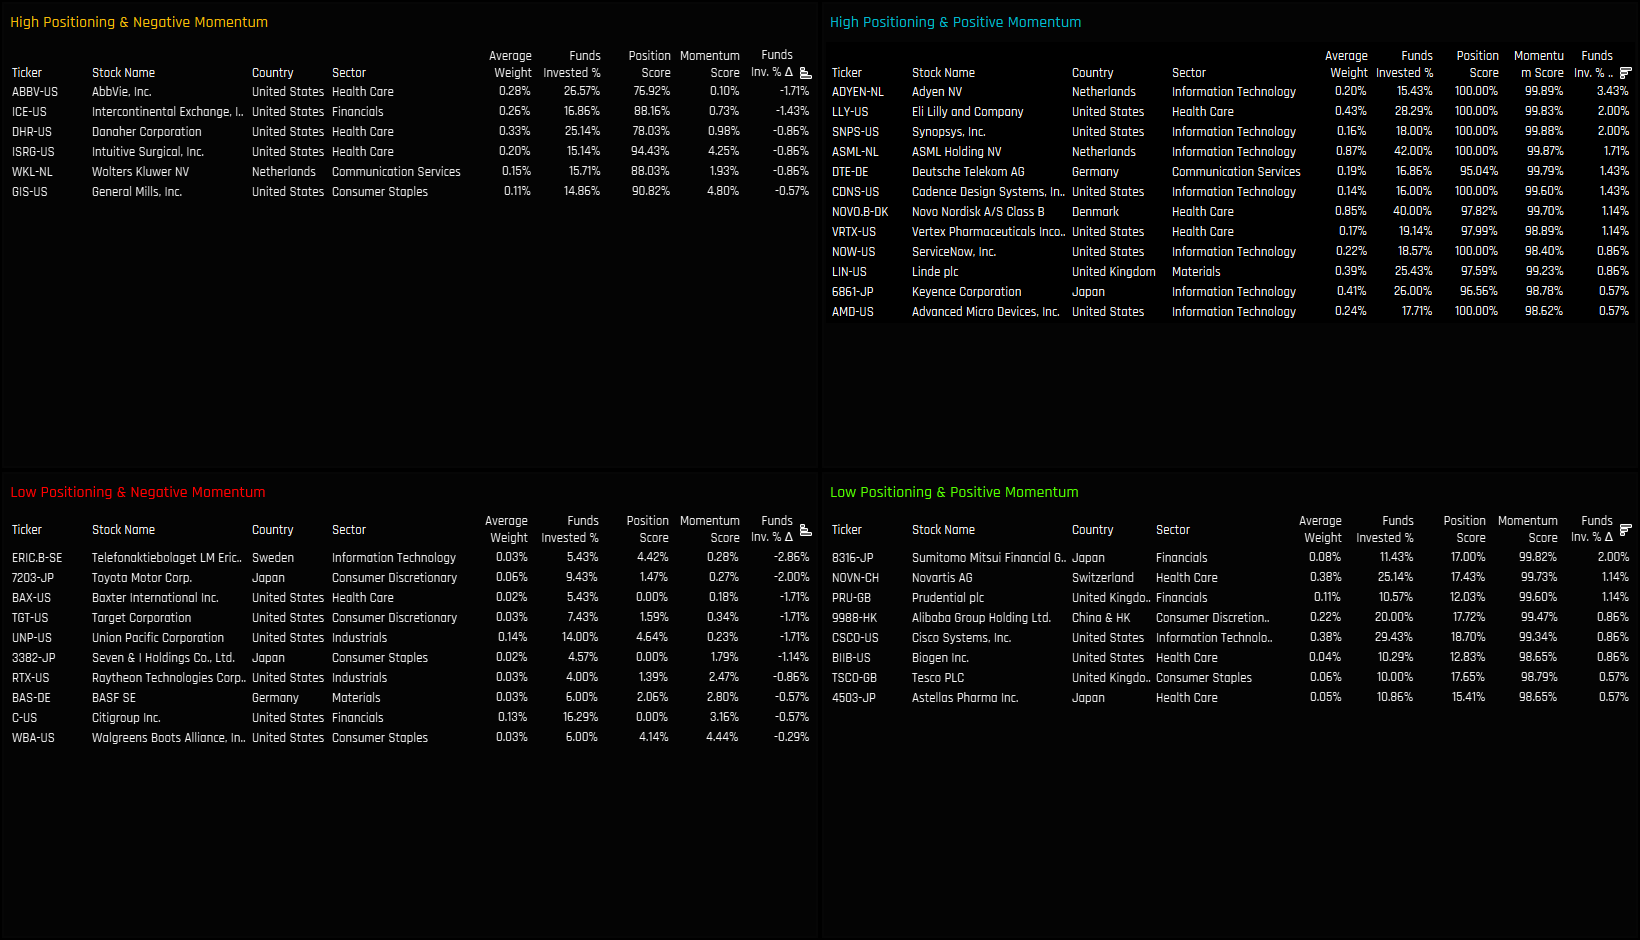
The tables below list the stocks in the extreme corners of each quadrant. The screening methodology is as follows:
High Positioning & Negative Momentum: Position Score > 75%. Momentum Score < 5%
High Positioning & Positive Momentum: Position Score > 95%. Momentum Score > 99%
Extreme Stocks
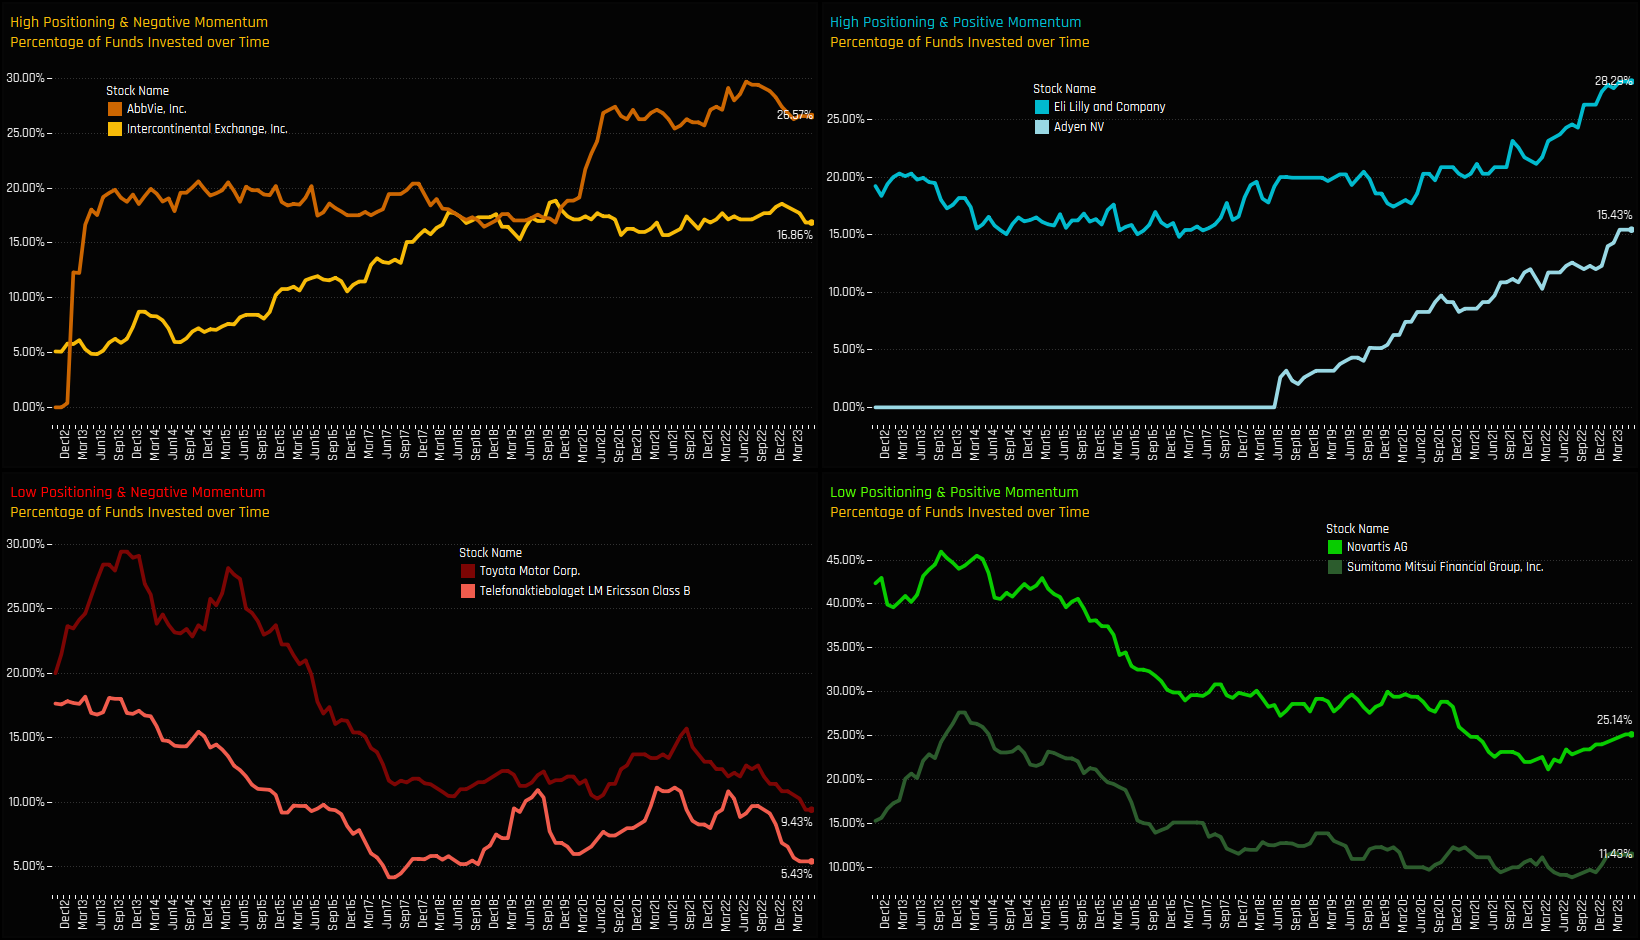
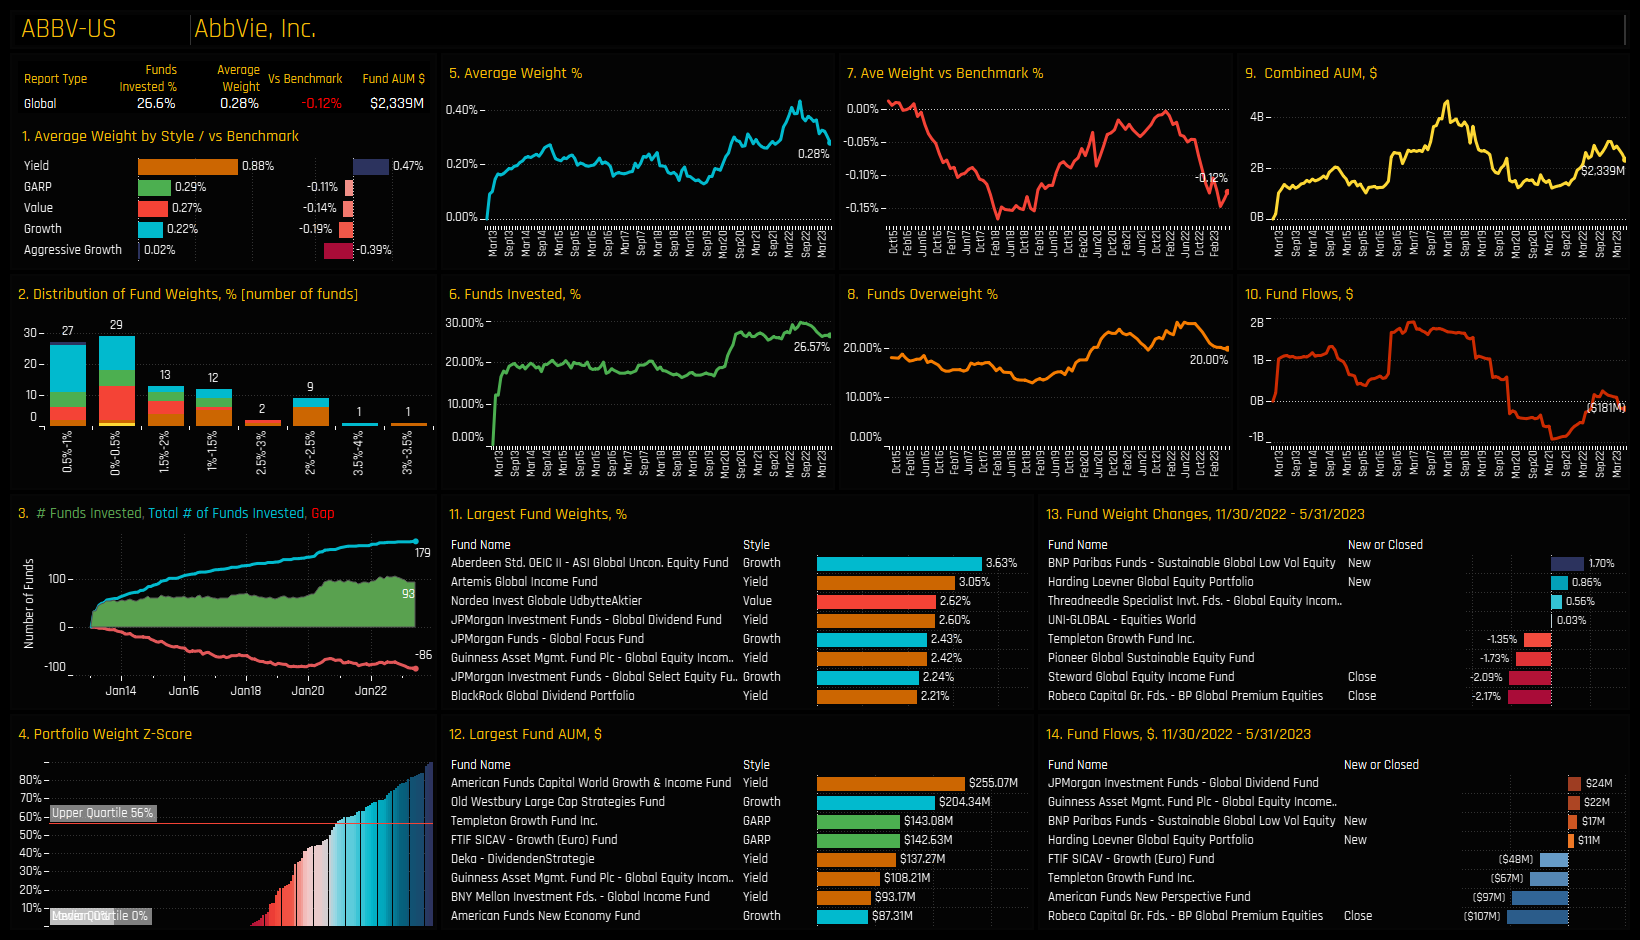
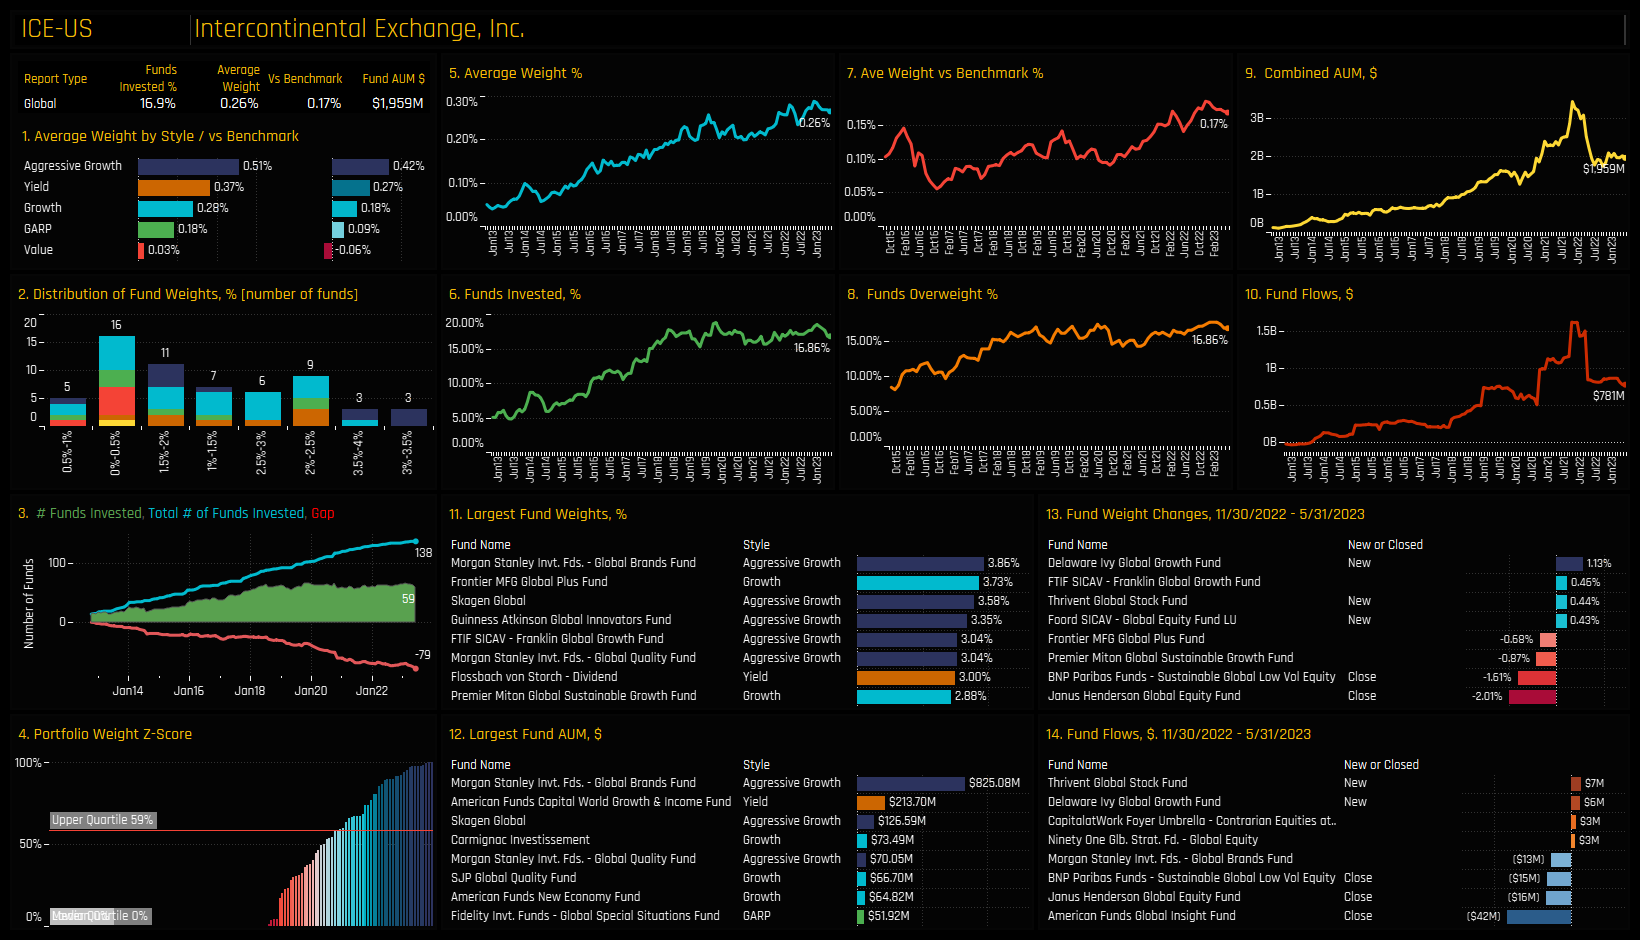
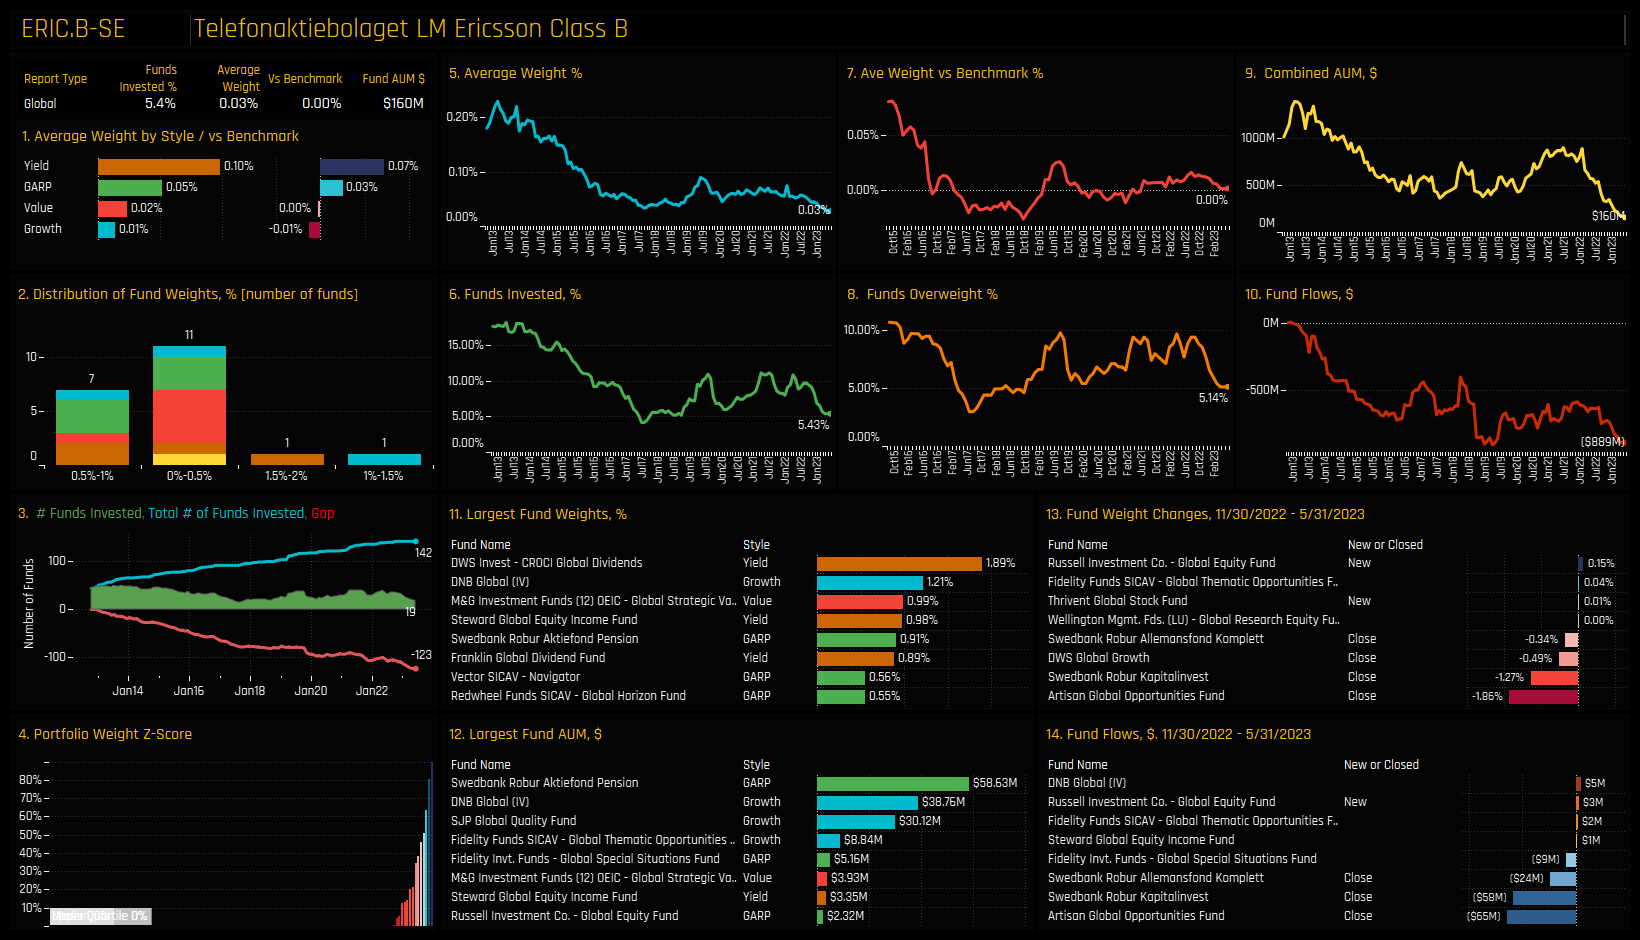
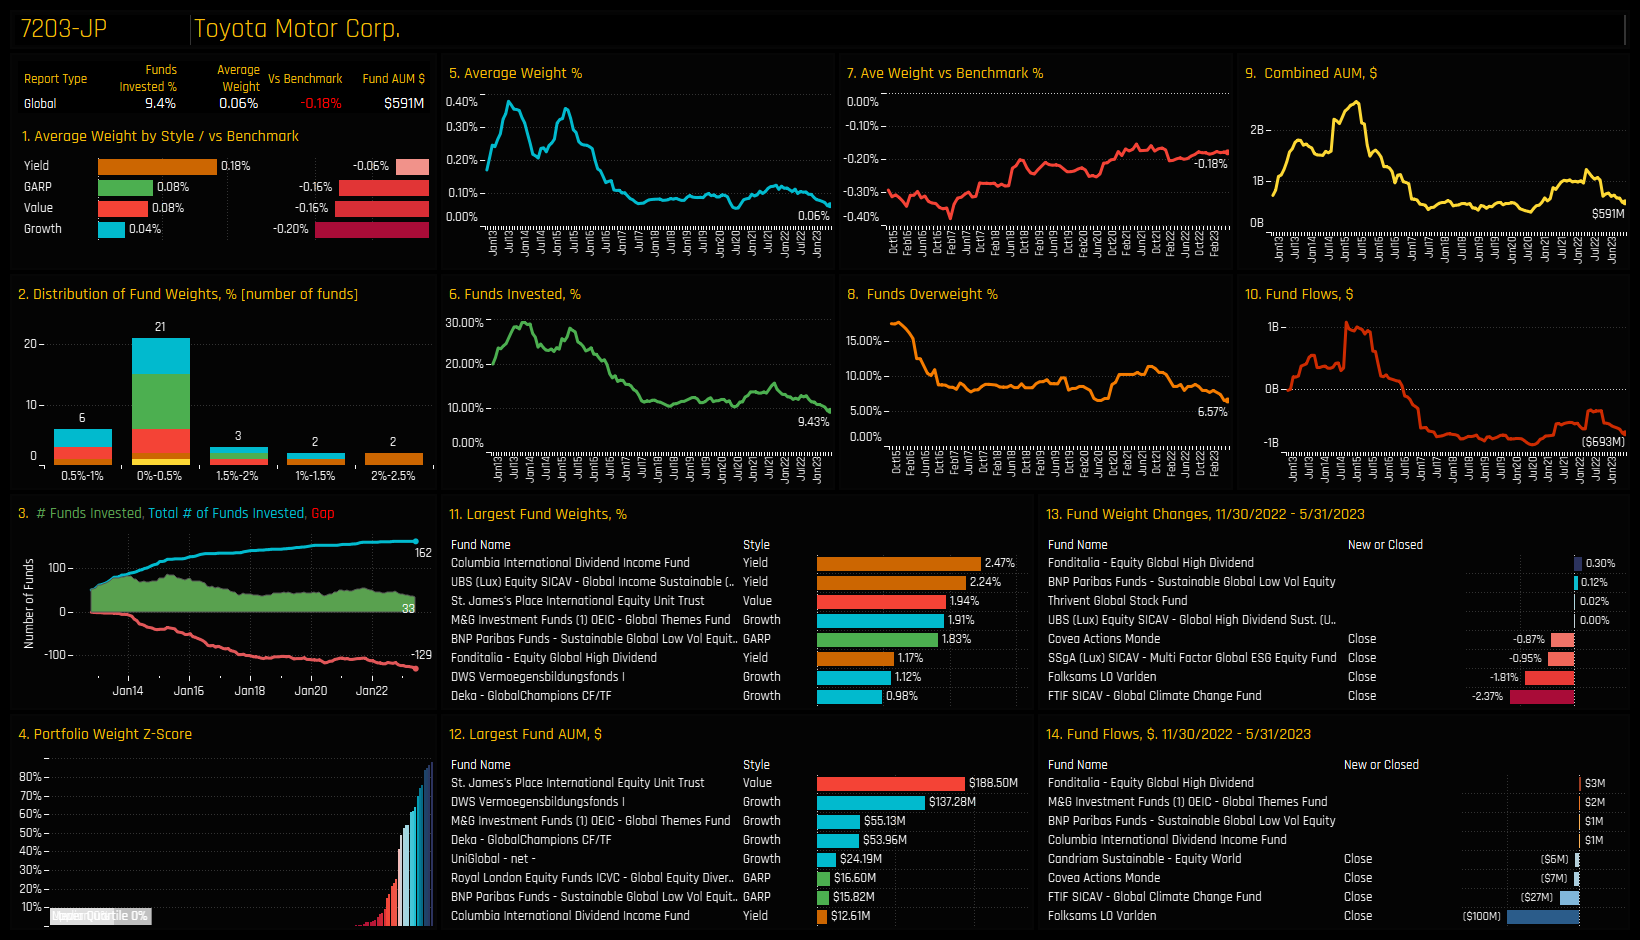
The charts below track the percentage of active funds invested in each of the top 2 stocks across the 4 categories. It’s another way to visualize how the Sentiment Grid works. For example, the top-left chart highlights AbbVie Inc and Intercontinental Exchange seeing fund ownership declining from near record highs. In the bottom-left chart, Toyota Corp and Telefonaktiebolaget Ericsson have witnessed consistent ownership declines over the last decade, with today’s exposure near the lowest on record.
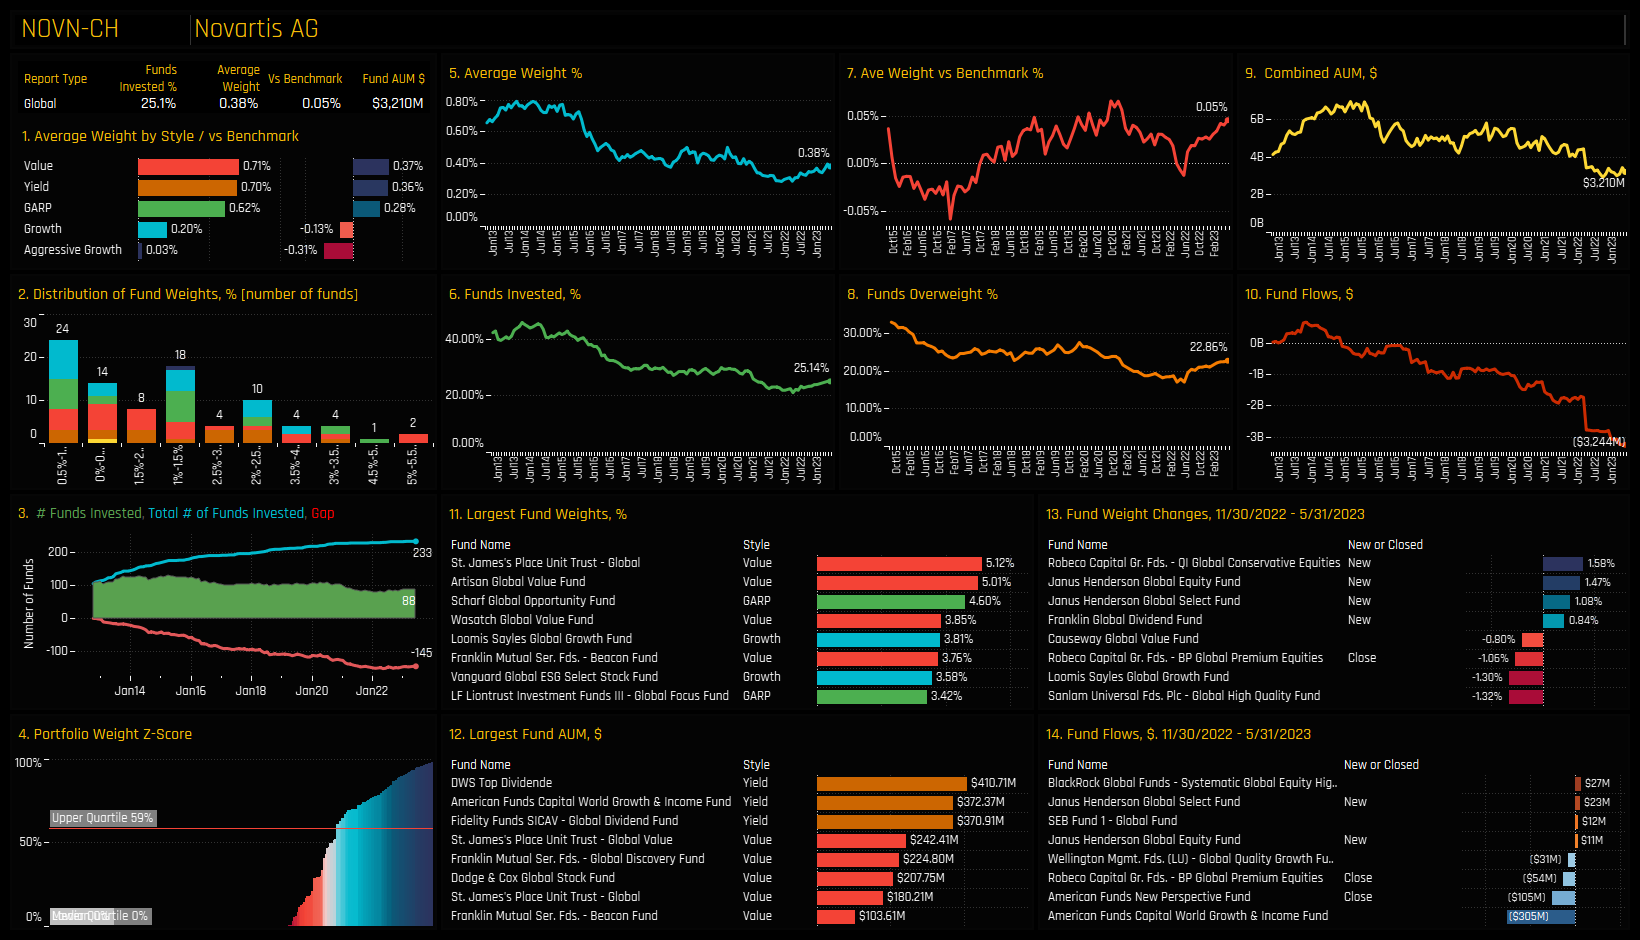
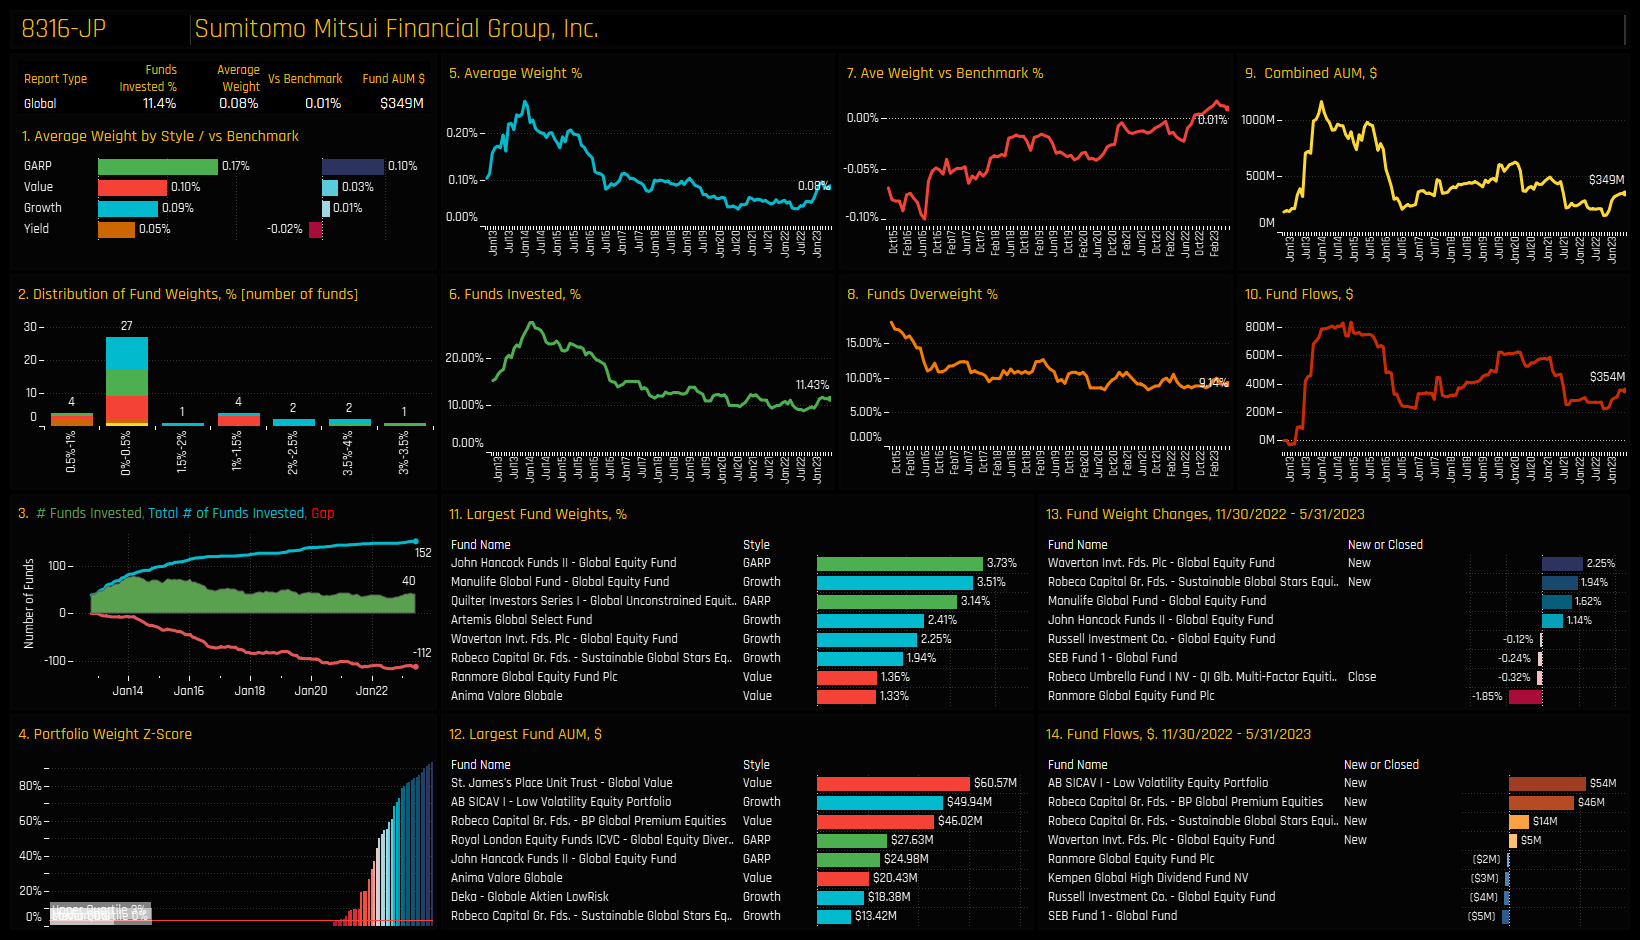
In the opposite case (bottom right), both Novartis AG and Sumitomo Mitsui Financial Group are at the bottom of their historical ownership ranges but both have started to climb from the lows. Top right shows Eli Lilly and Company and Adyen NV capturing sustained increases in fund ownership in recent months to leave Global funds at their highest levels on record. In the charts that follow we provide more detailed profiles of each of the 8 stocks at the extreme corners of our Sentiment Grid.
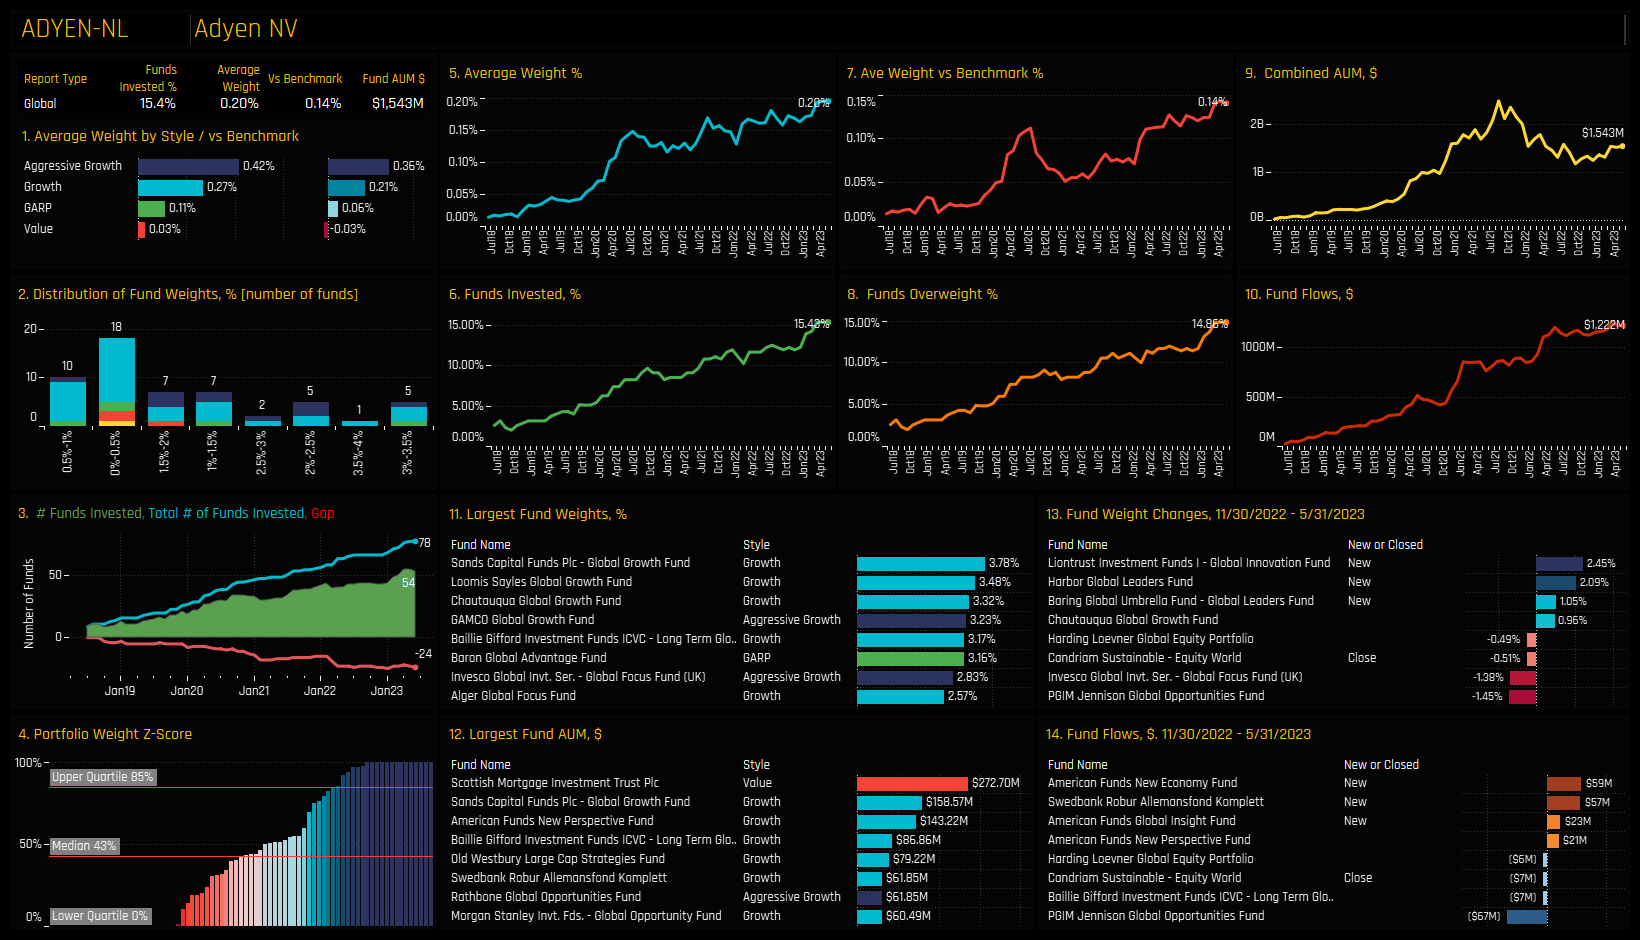
High Positioning & High Momentum: Adyen NV
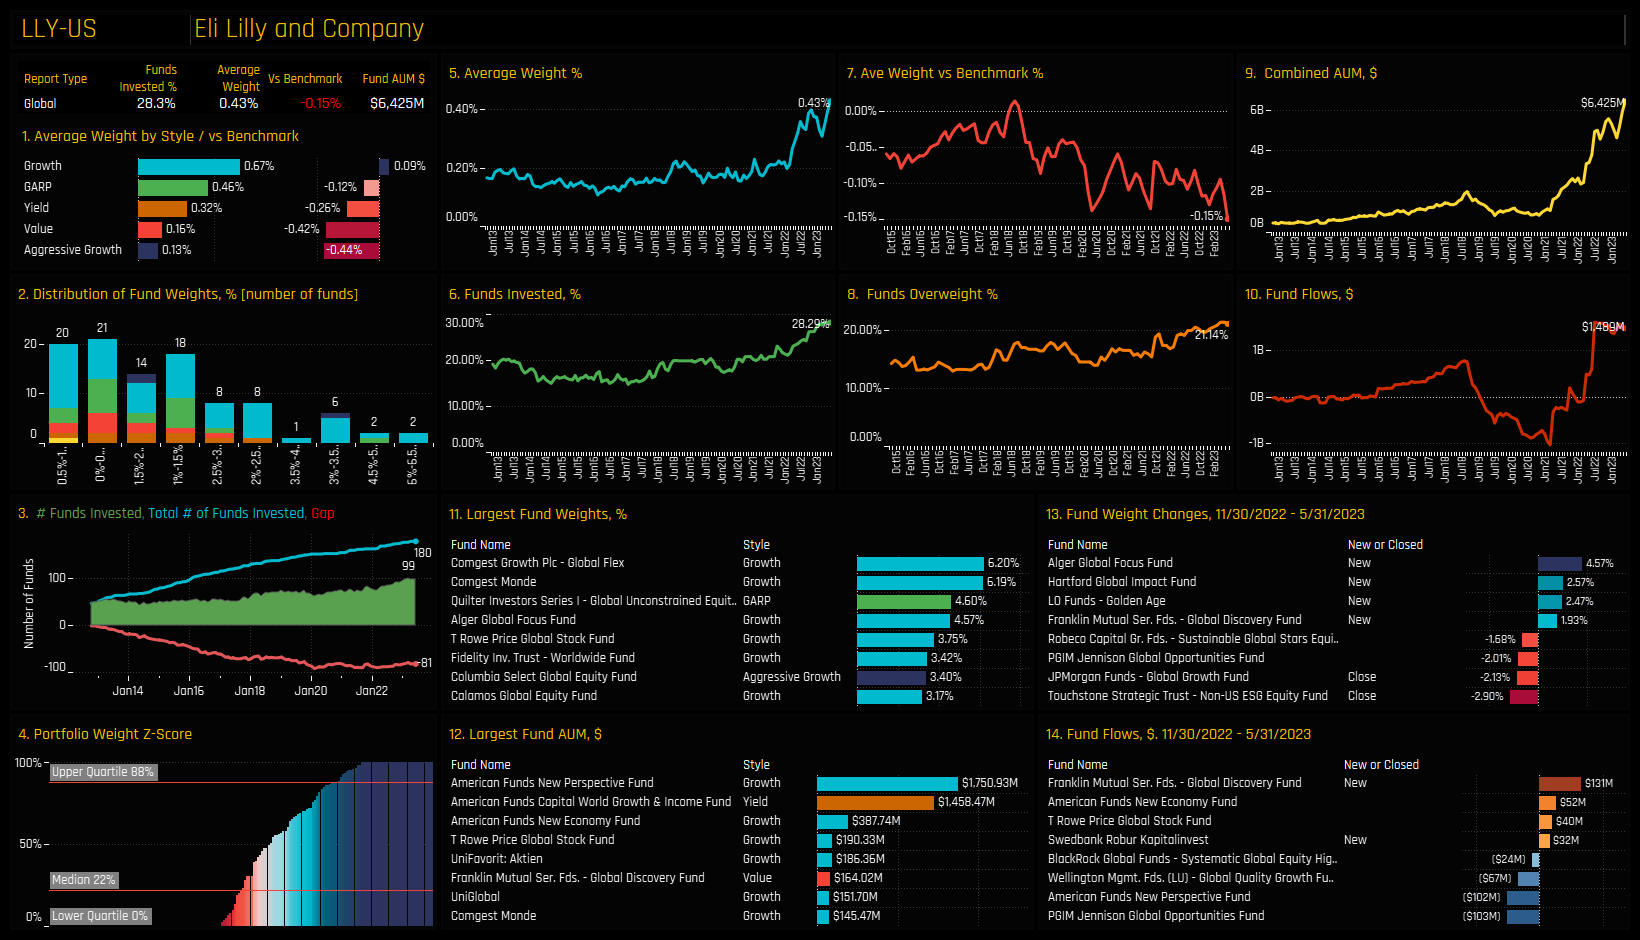
High Positioning & High Momentum: Eli Lilly and Company
High Positioning & Low Momentum: Abbvie Inc
High Positioning & Low Momentum: Intercontinental Exchange, Inc
Low Positioning & Low Momentum: Telefonaktiebolaget LM Ericsson Class B
Low Positioning & Low Momentum: Toyota Motor Corp
Low Positioning & High Momentum: Novartis AG
Low Positioning & High Momentum: Sumitomo Mitsui Financial Group, Inc
350 Global Equity Funds, AUM $940bn
Global Active Funds Ownership Report
To round off this month's Global research, please click on the link below for the full data report on Global active fund positioning
For more analysis, data or information on active investor positioning in your market, please get in touch with me on steven.holden@copleyfundresearch.com
Investor Positioning Report — Copley Fund Research Ltd · Last updated: July 2026 · Registered in England and Wales
1. Who we are
Copley Fund Research Ltd provides proprietary institutional fund intelligence to listed companies and investor relations professionals. These terms govern every purchase of an Investor Positioning Report. By completing a purchase you confirm you have read, understood, and agreed to these terms in full.
2. What you are purchasing
The Investor Positioning Report is a bespoke PDF report mapping the institutional fund universe around your stock. It covers current investors, past investors, competitor investors, and white space investors. Every report is built from scratch for the specific company ordered and is not a standardised or templated product.
3. Delivery and process
Following payment or invoice issuance, Copley Fund Research will contact you within one working day to agree your competitor set. Production begins once the competitor set is confirmed in writing. The completed report will be released to you within 48 hours of production starting, provided payment has been received in full; where payment is outstanding, the report will be withheld until payment clears. If the requested company falls outside our covered fund universes, or a competitor set cannot be agreed, Copley Fund Research will issue a full refund or cancel the outstanding invoice.
4. Competitor set agreement
The competitor set is agreed with you in writing prior to production, and the report is built to that agreed specification. Requests to amend the competitor set after delivery, based on a change of preference rather than an error, may be treated as a new order.
5. Refund policy
Because each report is produced individually for your company, orders are non-refundable once production has begun, except as set out in clauses 3 and 5a below. By purchasing, you agree not to dispute the charge with your card provider on the basis that the service was not as described, provided the report has been delivered to the agreed specification or corrected under clause 5a.
5a. Quality remedy
If a delivered report contains a material error caused by Copley Fund Research — for example, an incorrect company analysed, a competitor omitted from the agreed set, or content missing from the specification in clause 2 — Copley Fund Research will correct and redeliver the report at no additional charge, within a reasonable timeframe. This is your sole remedy for such errors.
6. Data and accuracy
All fund positioning data in the report reflects holdings as disclosed at the most recently available reporting date at the time of compilation. The timing of fund holdings disclosures is determined by regulatory requirements applicable to each fund and is outside the control of Copley Fund Research Ltd. This data may not reflect current fund positions. Copley Fund Research takes reasonable care to ensure accuracy but makes no warranty, express or implied, as to the completeness or current accuracy of the underlying data — though this does not affect the quality remedy in clause 5a for errors in how that data was analysed or presented. Past fund positioning is not indicative of future fund behaviour or investment decisions.
7. Not investment advice
The Investor Positioning Report is produced for investor relations intelligence purposes only. It does not constitute investment advice, financial advice, or a recommendation to buy, hold, or sell any security. The data reflects historical fund positioning and must not be relied upon as a prediction of future fund behaviour or investment decisions. Copley Fund Research Ltd is not authorised or regulated by the Financial Conduct Authority for the provision of investment advice.
8. Permitted use and confidentiality
The report is licensed for internal use by the purchasing organisation only. You may share it with employees and directors of your organisation. You may not: reproduce, redistribute, publish, or resell the report or any part of it; share it with any third party outside your organisation without prior written consent; use the fund or portfolio manager names contained in the report to approach those individuals on behalf of Copley Fund Research or in a manner that could damage Copley Fund Research's relationships with those funds; or use the data for any purpose other than your own investor relations strategy. The data, analysis, and methodology contained in the report are the intellectual property of Copley


