Active Global investors are at record allocations in North American stocks. Driven higher by rising Health Care, Industrials and Energy exposure, North America continues to take market share from the key regions in Europe and Asia. Yet with Global investors still underweight North America, does this rotation have further to run?
Time-Series Ownership Analysis
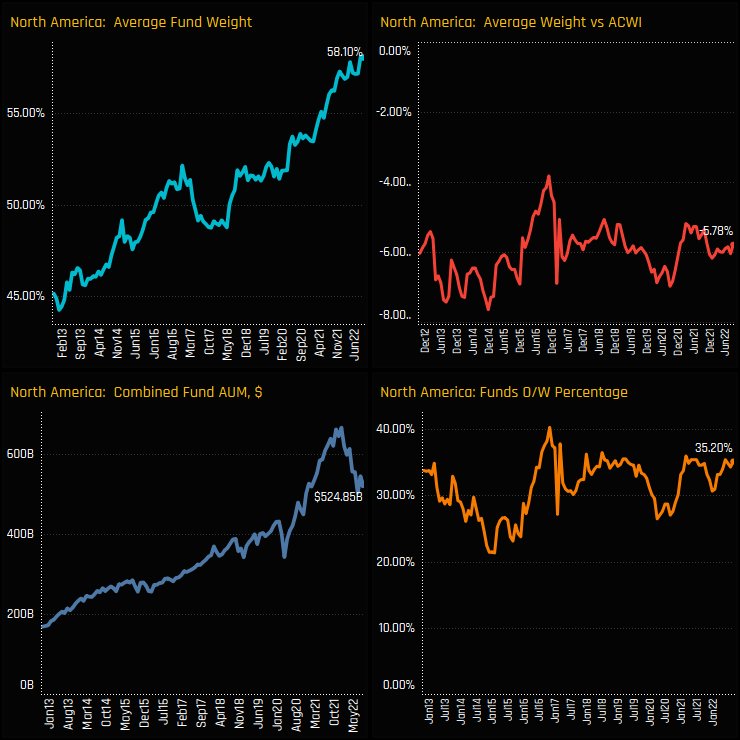
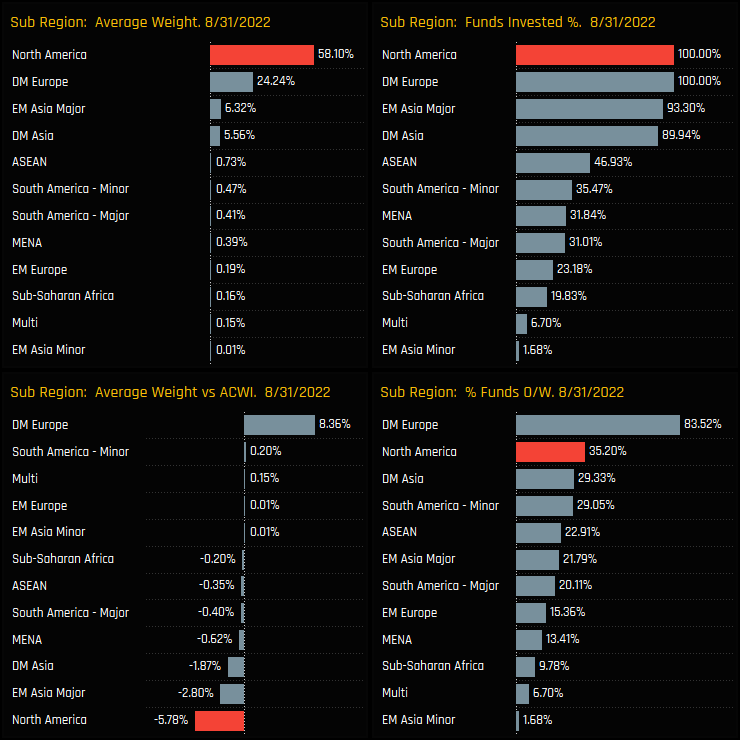
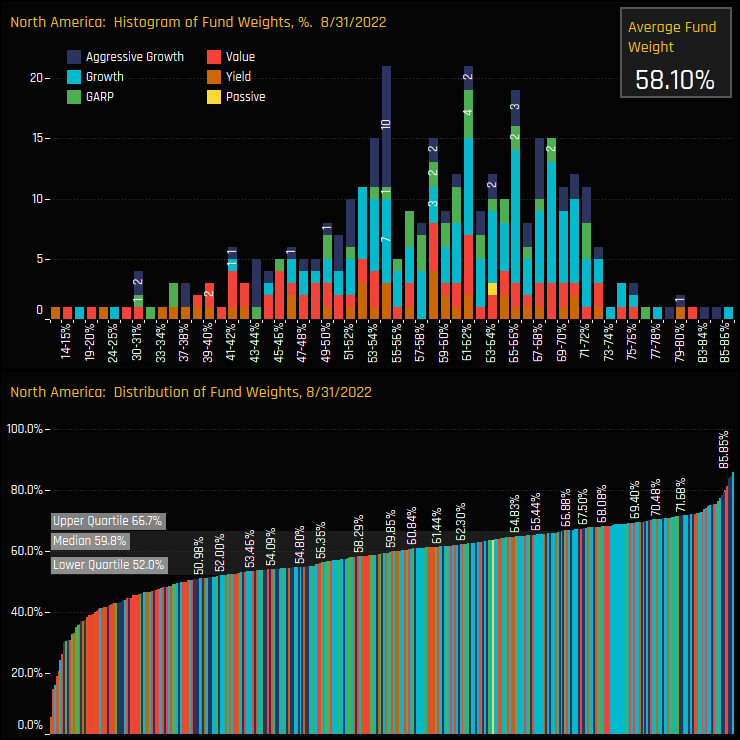
North American allocations continue to trend higher, hitting a record average weight of 58.1% across the 358 global funds in our analysis last month. In tandem, an increasing number of funds are positioning themselves overweight North America versus the MSCI ACWI index, but they remain in the minority. Just 35.2% of funds are overweight the benchmark with an average deficit of -5.78%.
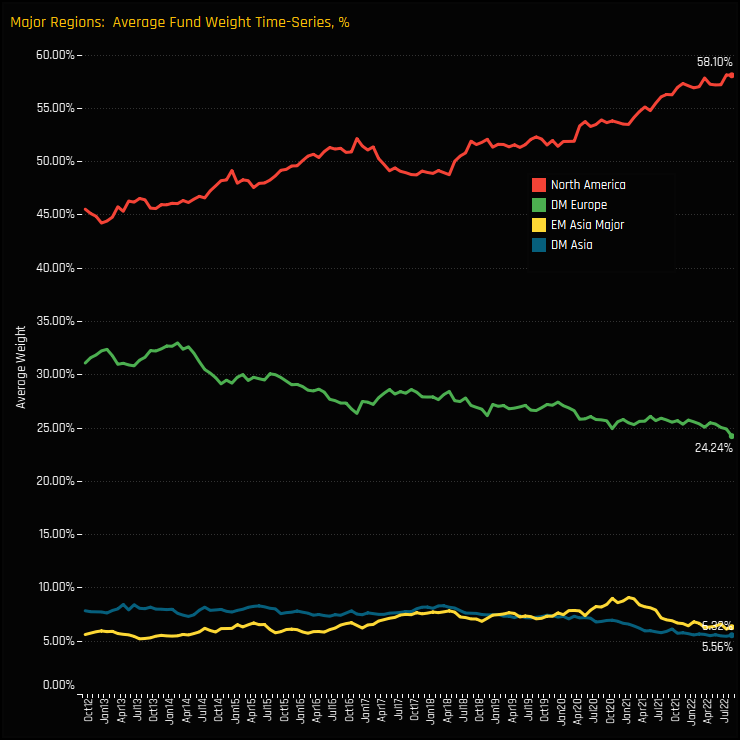
North America has consistently stolen market share from other key global regions, most notably Developed Market Europe, where average fund weights have hit all-time lows of 24.24%. Both EM and DM Asia have also seen average holding weights drift towards their lowest levels in over 5-years.
Regional Peer Group Analysis
Versus regional peers, North America dominates the picture. It commands more than twice the exposure of DM Europe and 10x the weight of the EM Asia Majors (China, SK, TW, India). The North American underweight is the largest among peers, with active Global managers instead running a sizeable overweight in Developed European stocks.
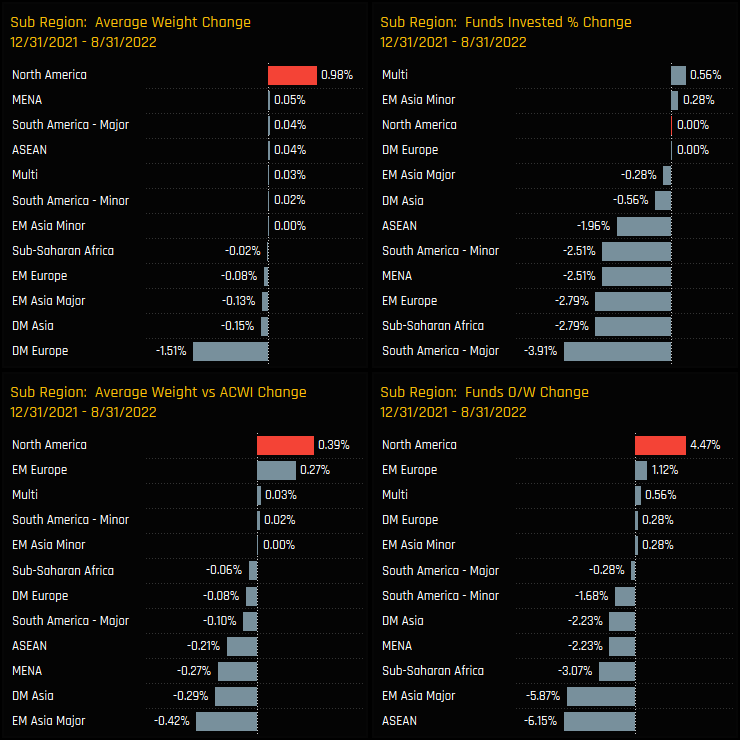
Allocation changes over the course of 2022 highlight the continued pivot towards North America. On both an absolute and relative-to-benchmark basis, active Global managers have increased exposure to the North American region. This has been an active rotation.
Regional Sentiment
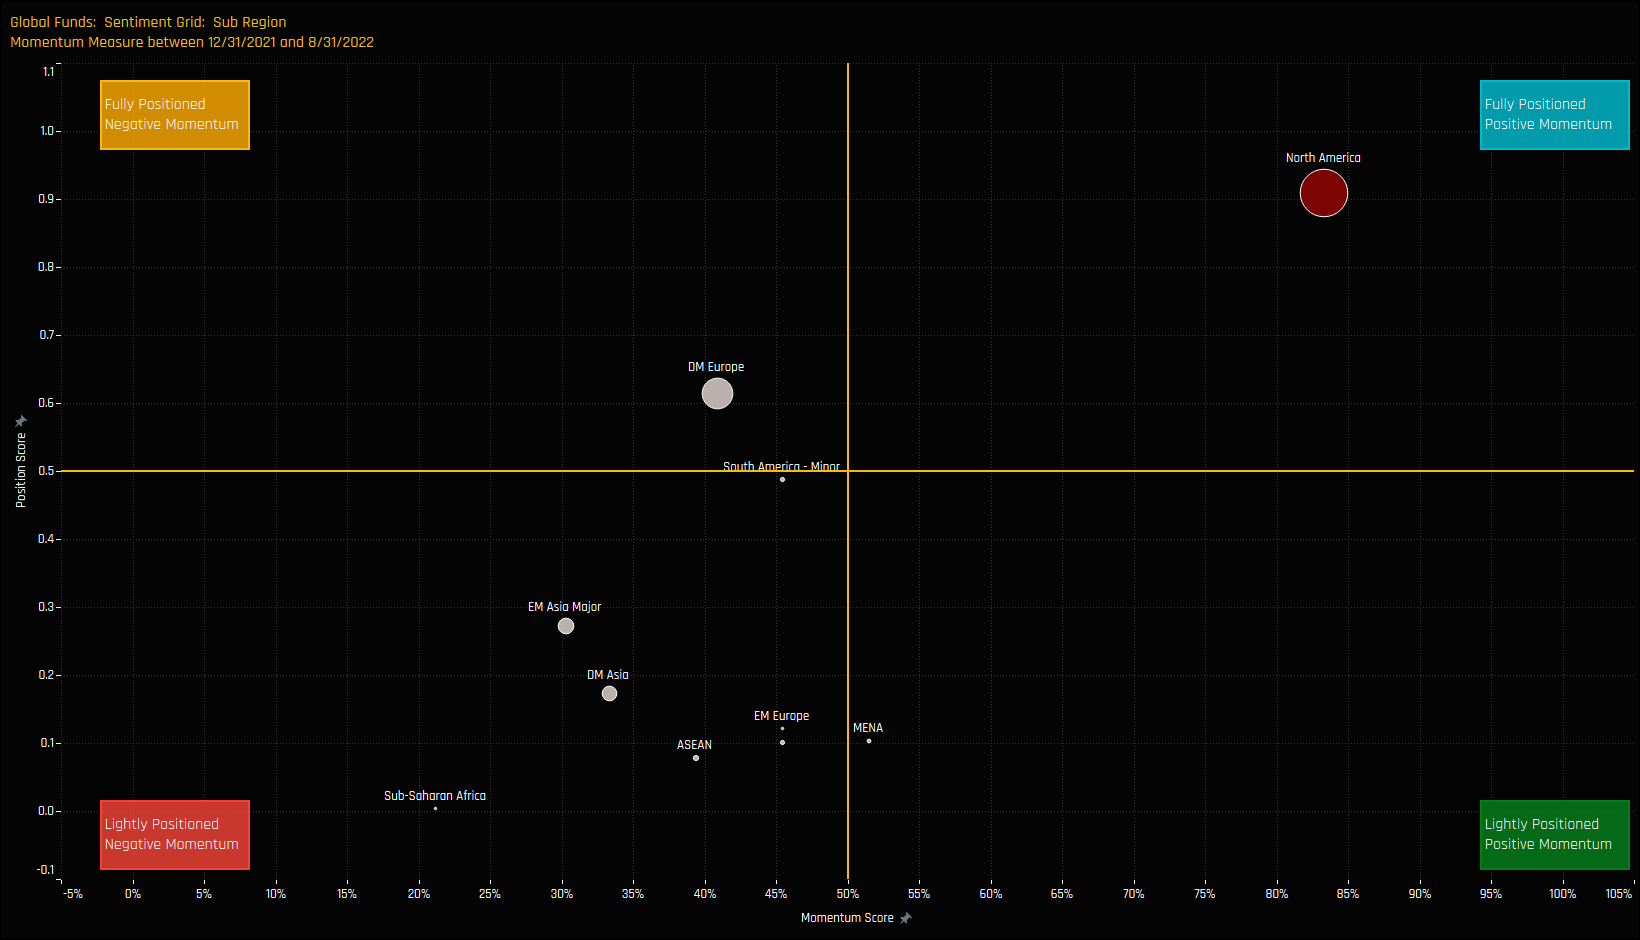
The chart below shows where current positioning in each Region sits versus history going back to 2011 on a scale of 0-100% (y-axis), against a measure of fund activity for each sector between 12/31/2022 and 08/31/2022 (x-axis). North America is a clear standout and the only Region to sit in the top-right quadrant of the Grid. It has become a Regional behemoth, sucking exposure from the other key regions.
Sector Positioning & Activity
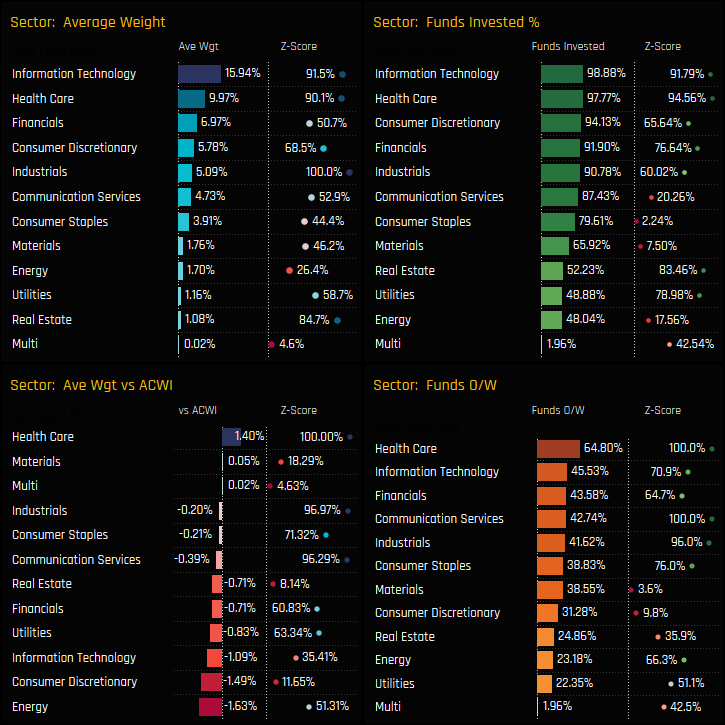
On a sector level, Information Technology is the largest allocation in North America, followed by Health Care and Financials, whilst Industrials are at record allocations of 5.09%. Versus the benchmark, the Health Care sector is the only significant sector overweight, held +1.4% above benchmark on average, the highest level on record. Underweights are led by Energy, Consumer Discretionary and Technology.
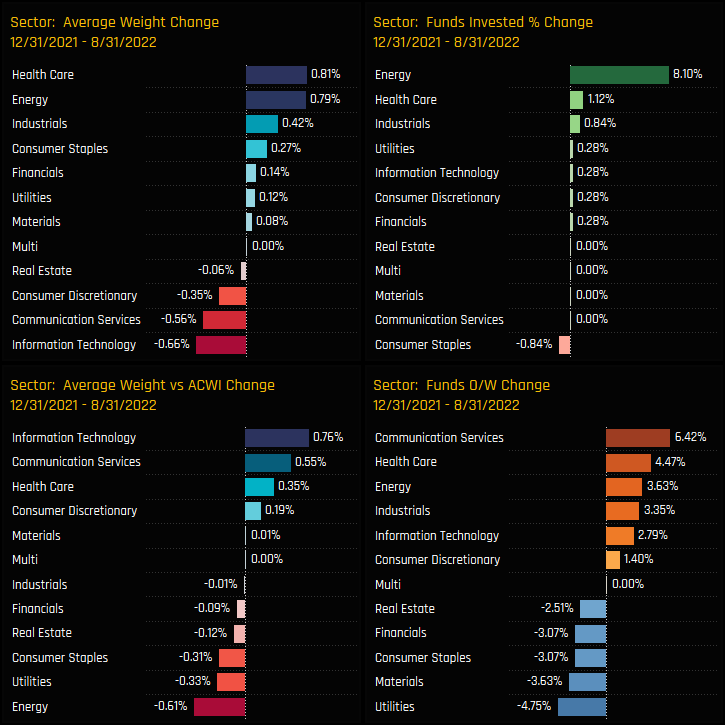
The sectors driving allocations higher were Energy, Health Care and Industrials, with average weights rising in conjunction with an increase in funds invested for all 3. This outpaced declines in Technology, Communication Services and Consumer Staples, with the latter moving from an overweight to an underweight over the course of 2022.
Sector Evolution
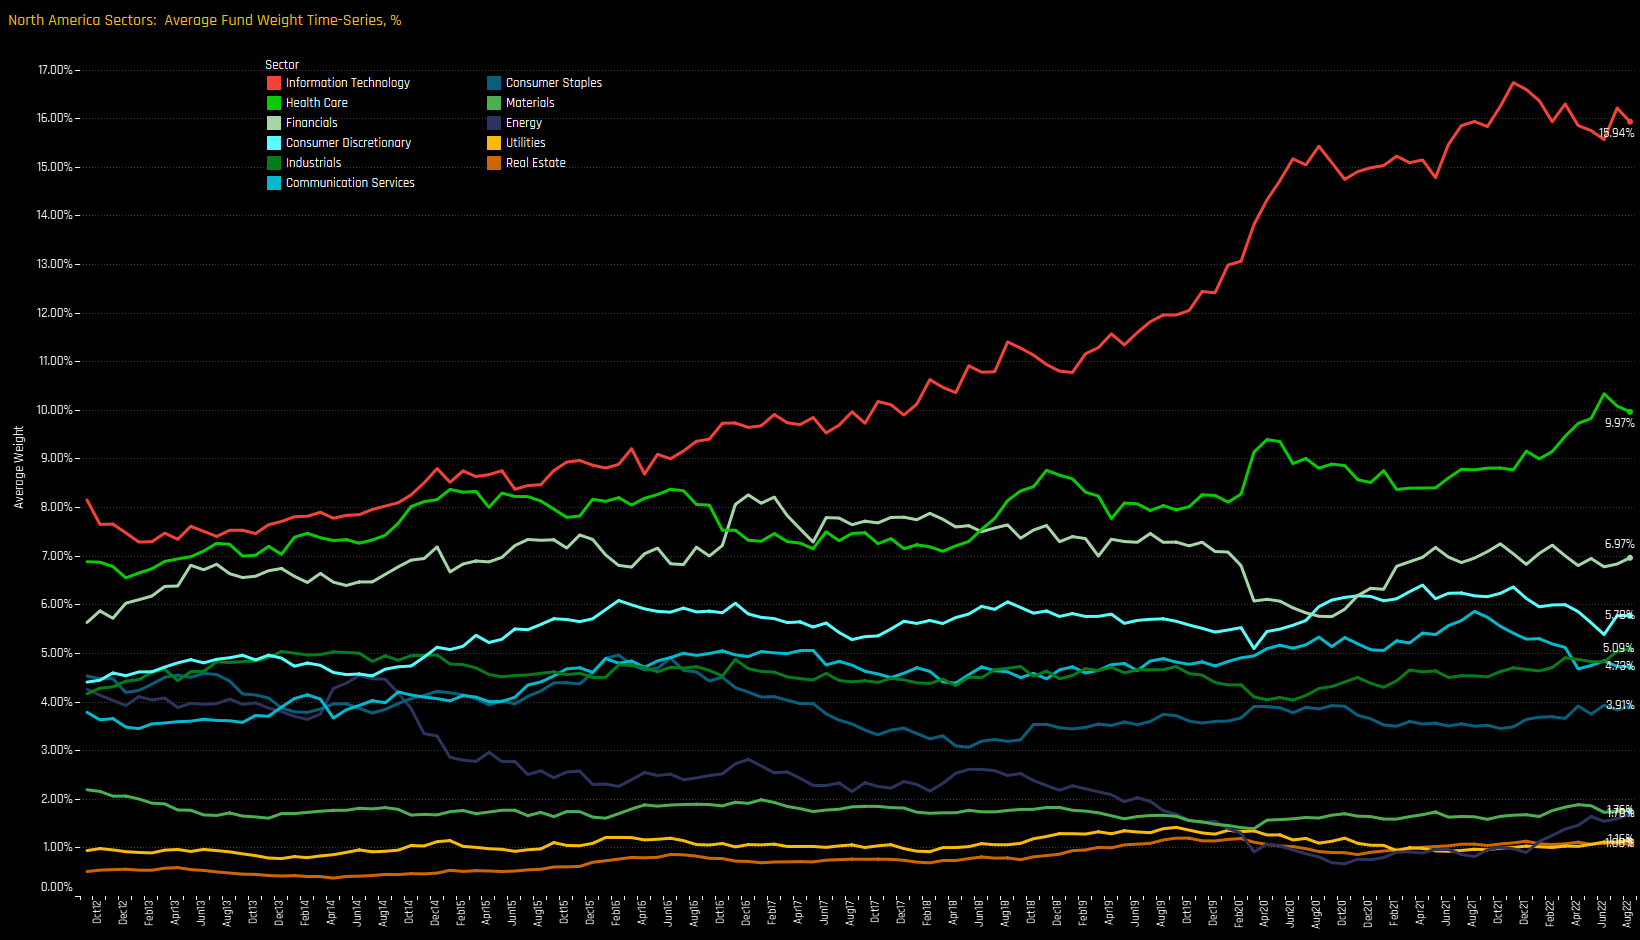
The evolution of North American sector weights can be seen in the charts below. Whilst Information Technology has been the largest sector weight since our records began in 2011, only over the last 3-years has it created a significant gap versus both Health Care and Financials. The Energy sector’s fall from grace is clear to see, dropping from over 4% in 2011 to sub 1% through 2020 and recent increases in exposure doing little to change the overall sector picture.
Fund Holding & Style Analysis
On a fund level, the spread of allocations is surprisingly narrow considering the high absolute weight. 50% of managers sit between the lower quartile of 52% and upper quartile of 66.7%, with only 24 managers allocating less than 40% to the North American region.
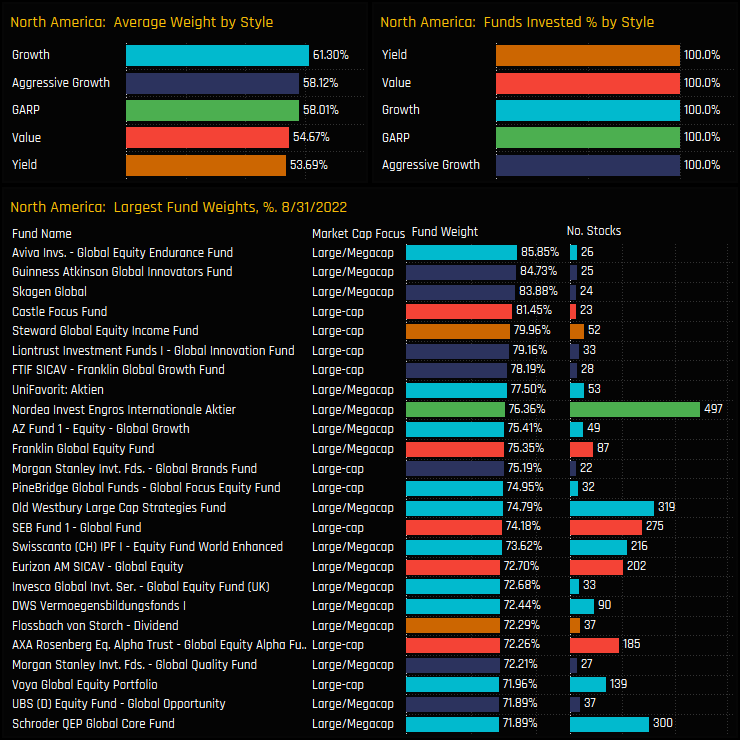
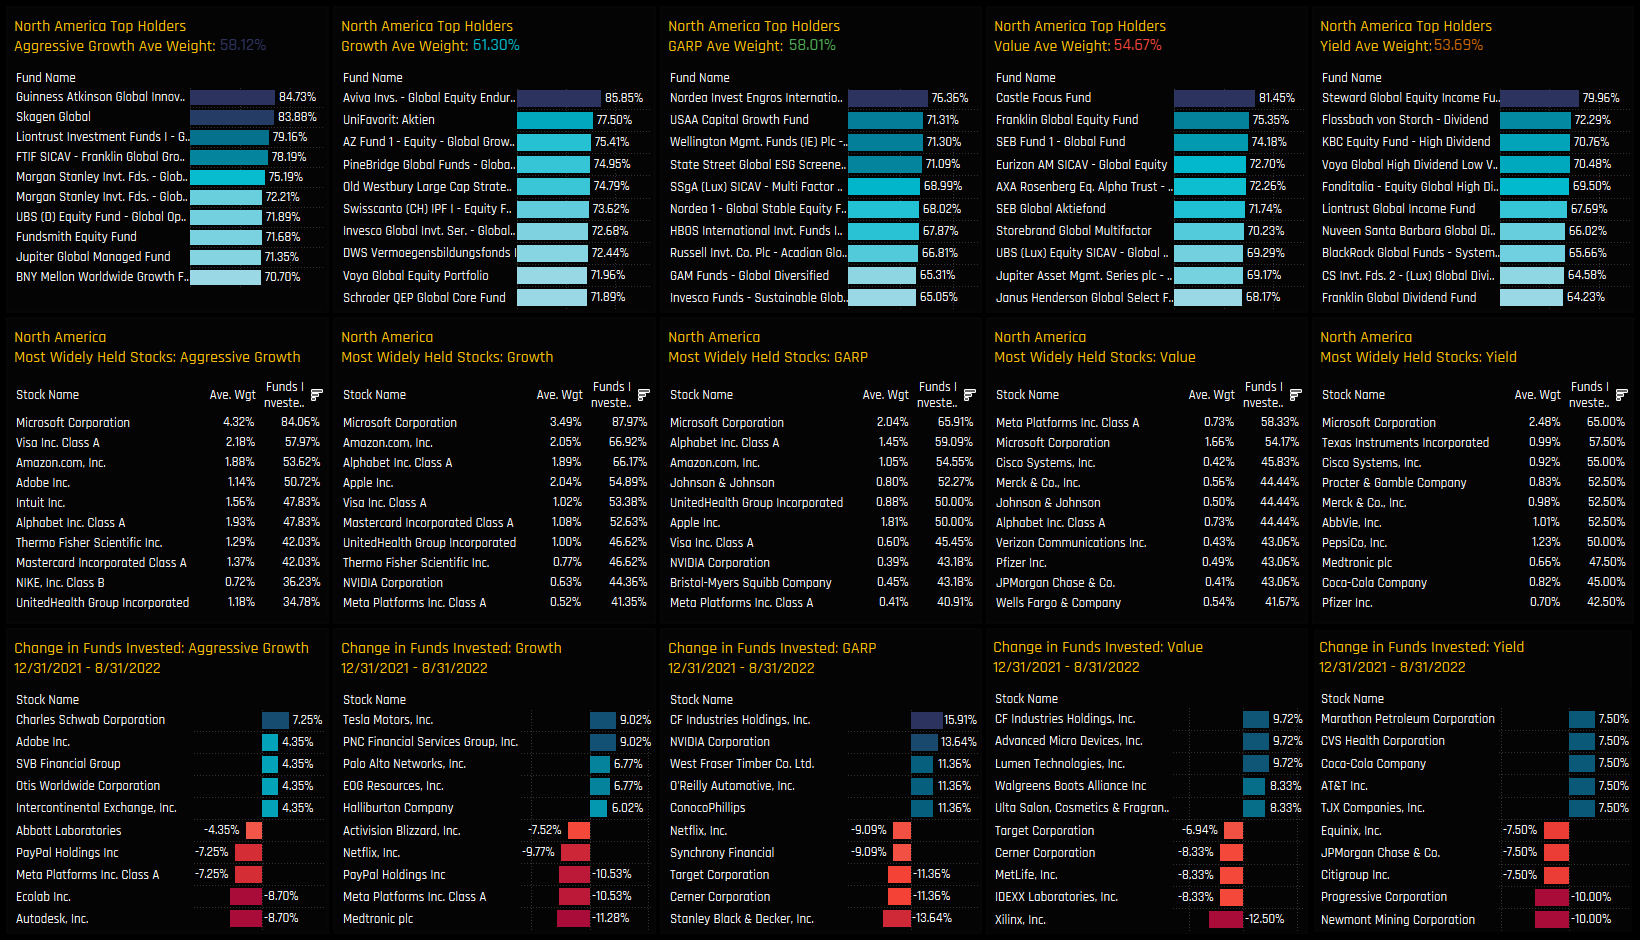
The top holders are spread across the Style spectrum, led by Aviva Global Equity Endurance (85.85%) and Guinness Atkinson Global Innovators (84.73%). On average though, allocations are largely correlated to Style, with Growth and Aggressive Growth funds more exposed to North America than Value/Yield.
Fund Activity & Long-Term Style Trends
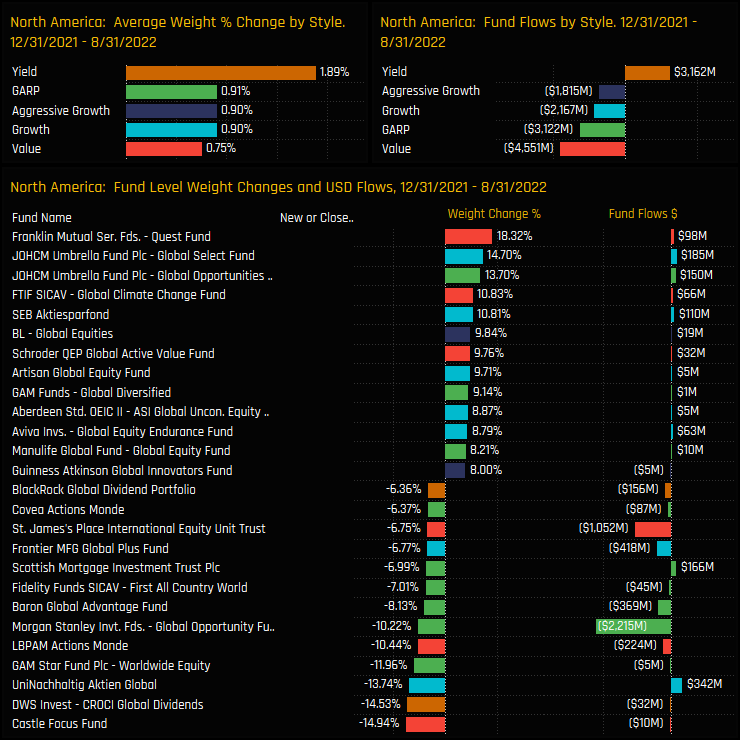
Fund activity between 12/31/2021 and 08/31/2022 hasn’t been entirely positive, but on balance skewed to the buy side. All Style groups saw average weights increase, led by Yield funds who saw weights rise by +1.89% on average over the period. The negative fund flow figures are reflective of total 2022 outflows of -$3.5bn, with twice the number of funds seeing outflows than inflows.
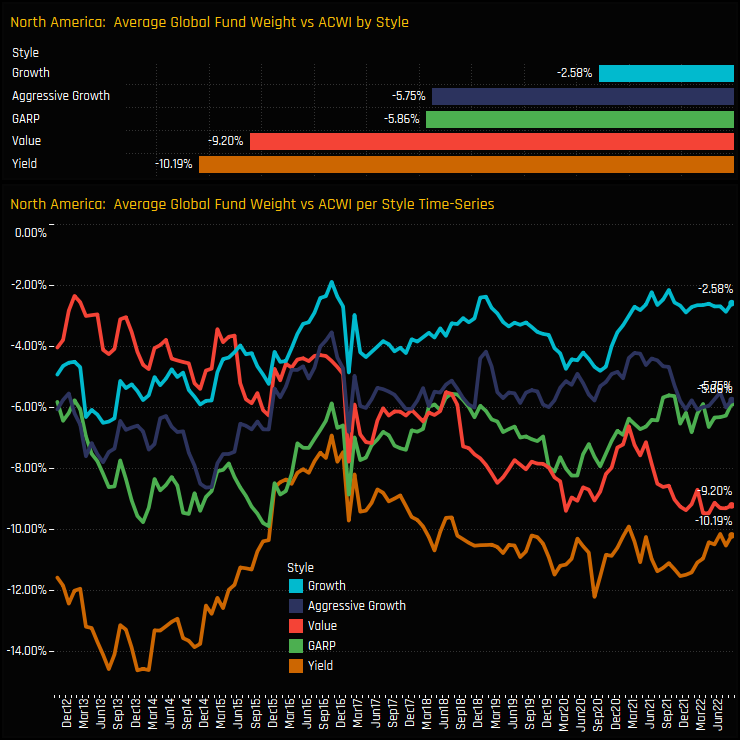
Over the longer-term, all Style groups have moved largely in tandem, though there is a growing dispersion between Growth managers, who are close to their maximum weight versus the ACWI benchmark of -2.58%, and Value managers who are near record underweights of -9.20%.
Stock Holdings & Activity Analysis
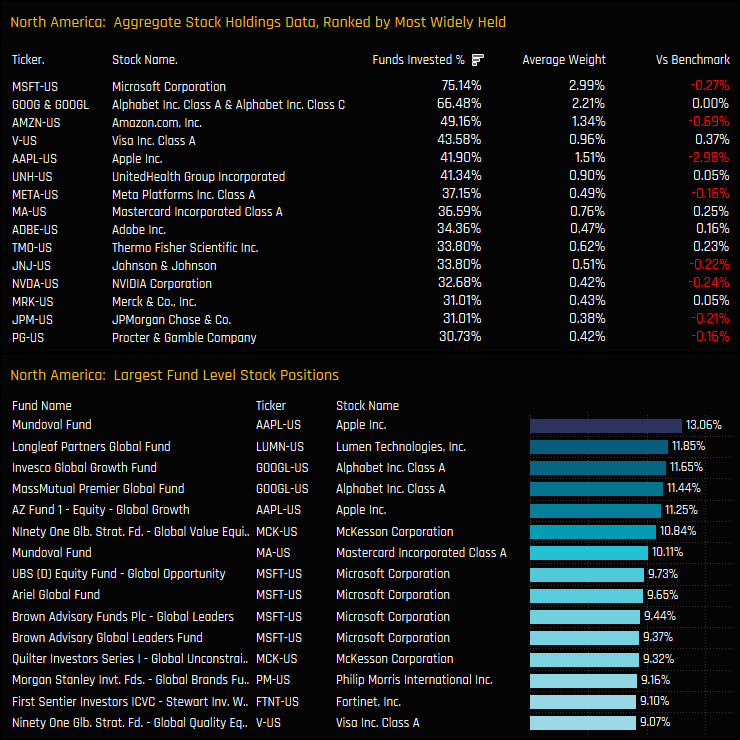
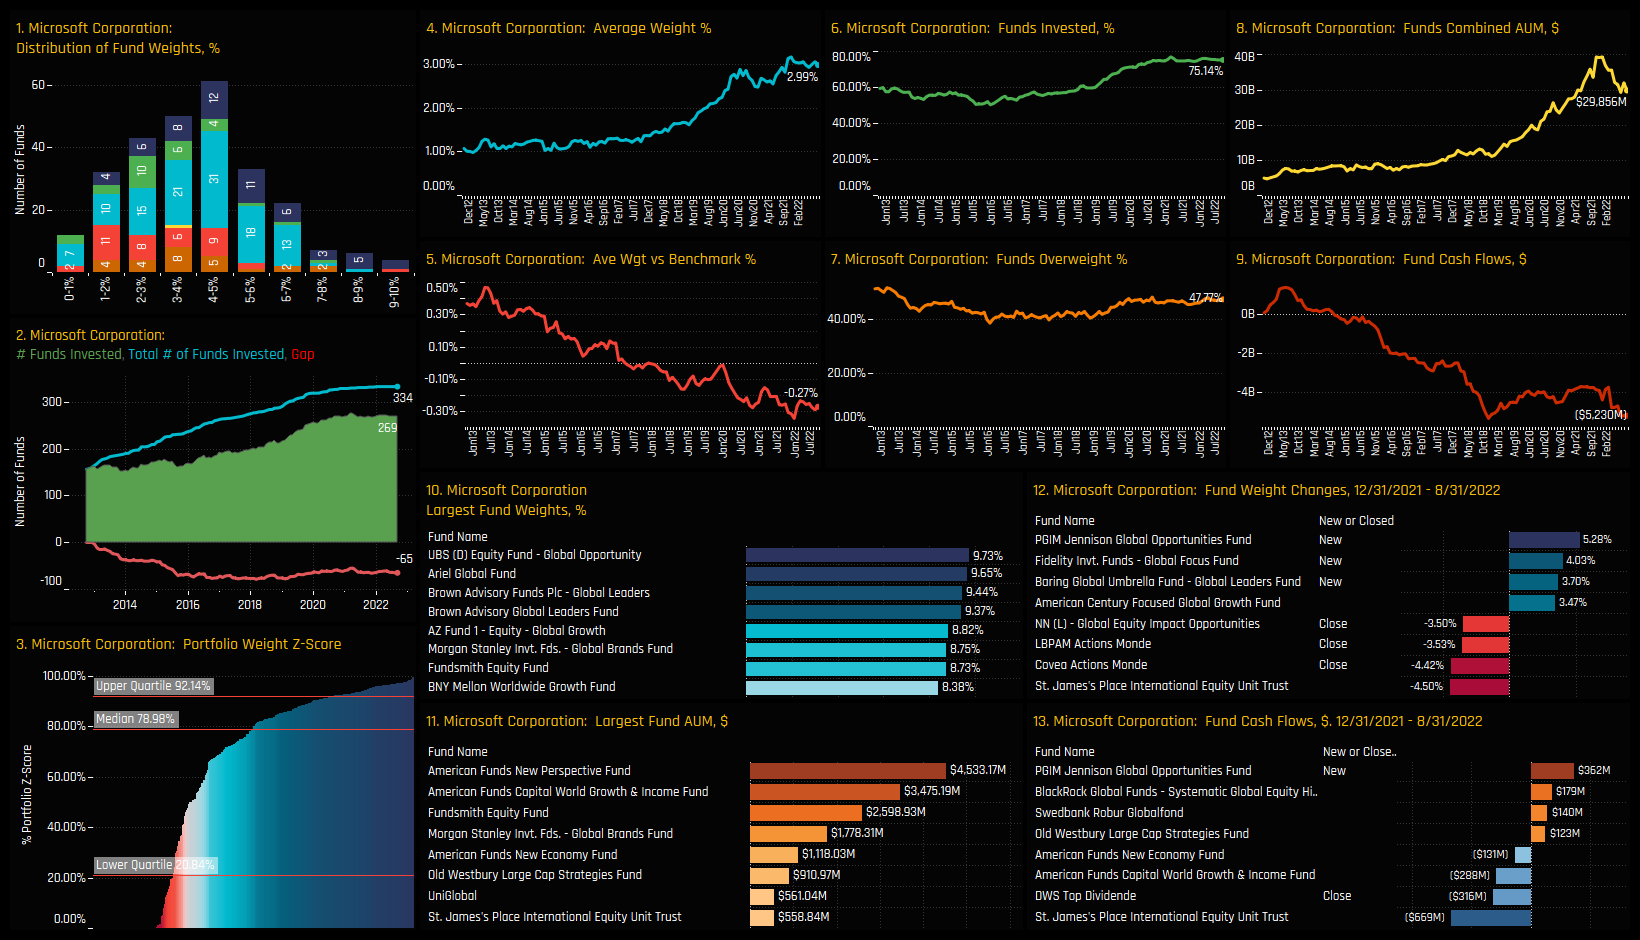
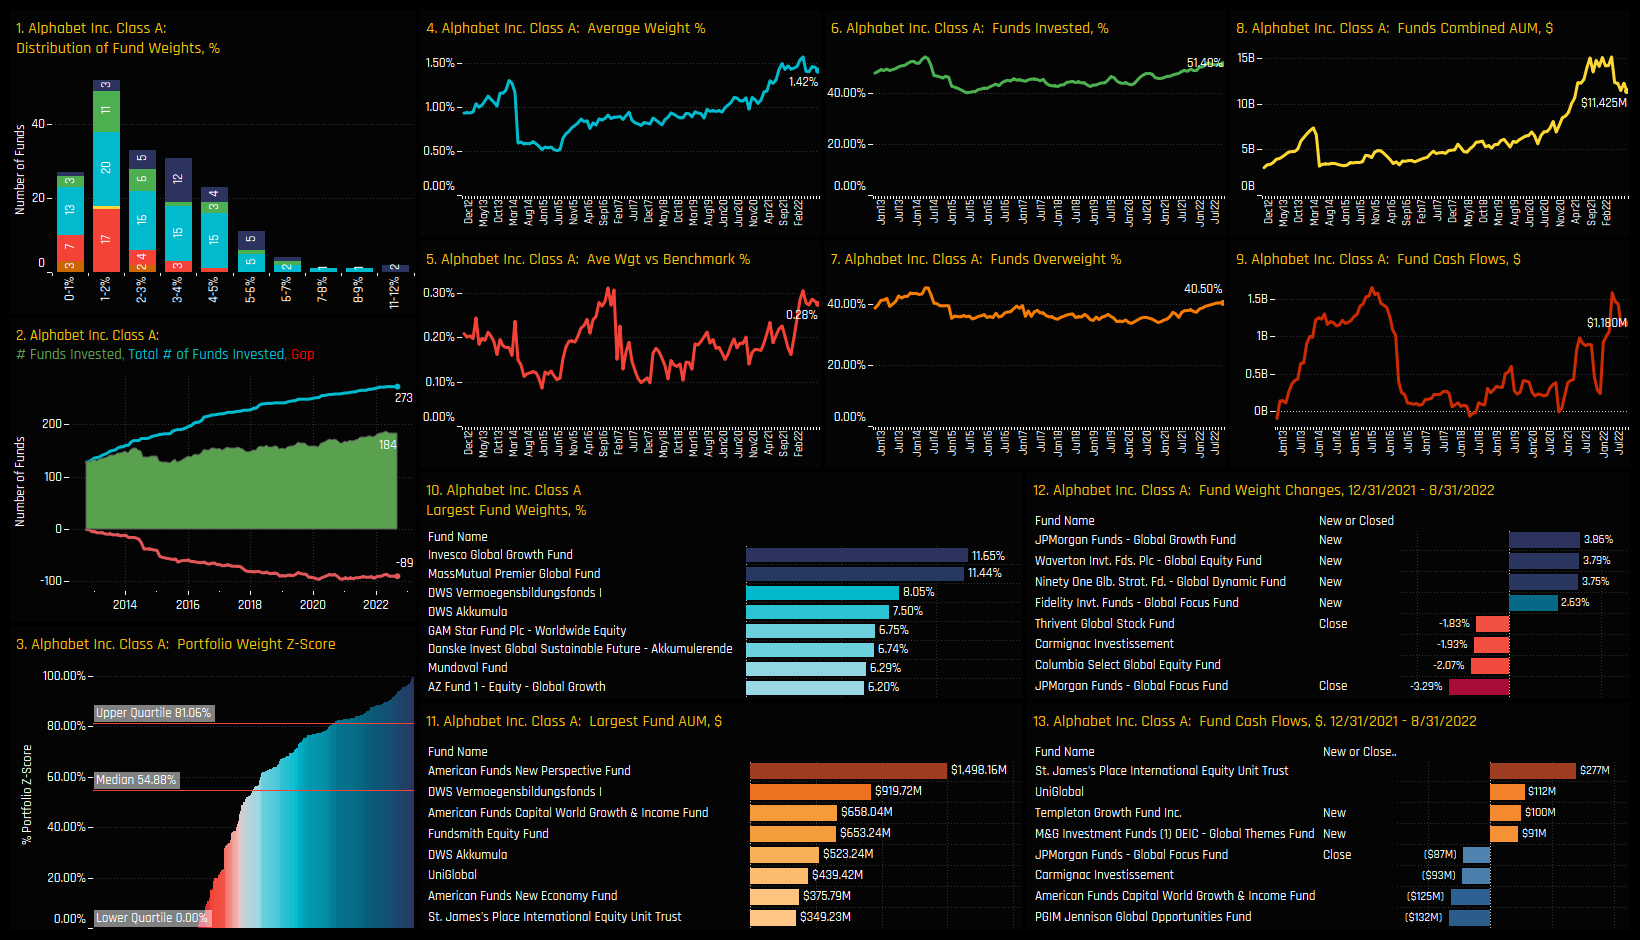
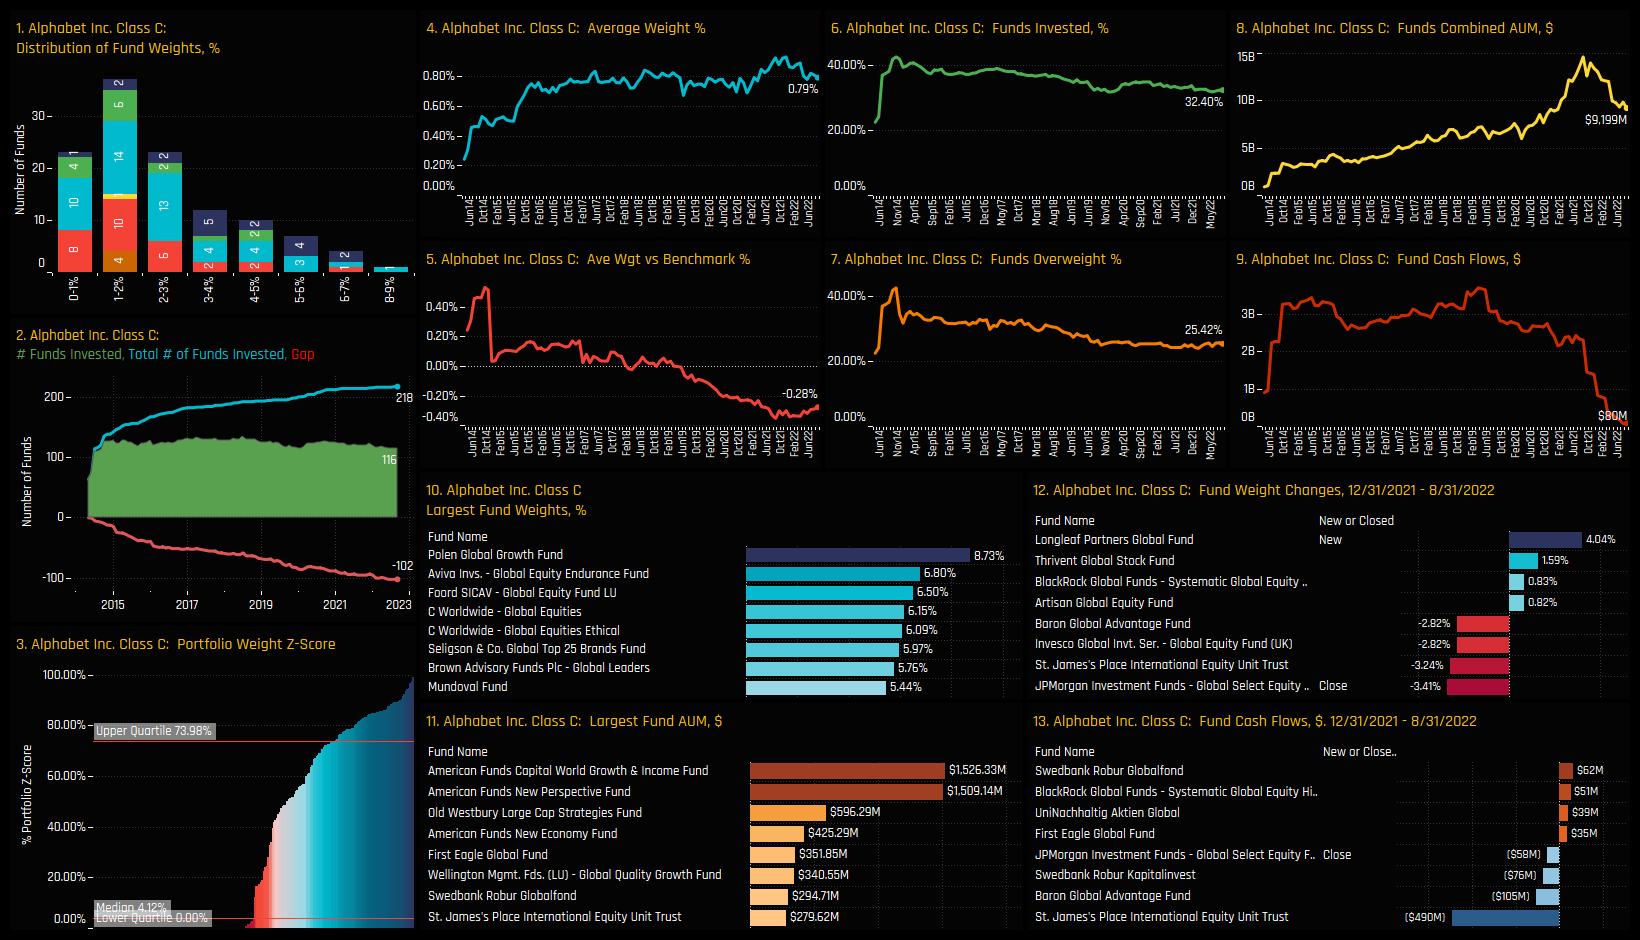
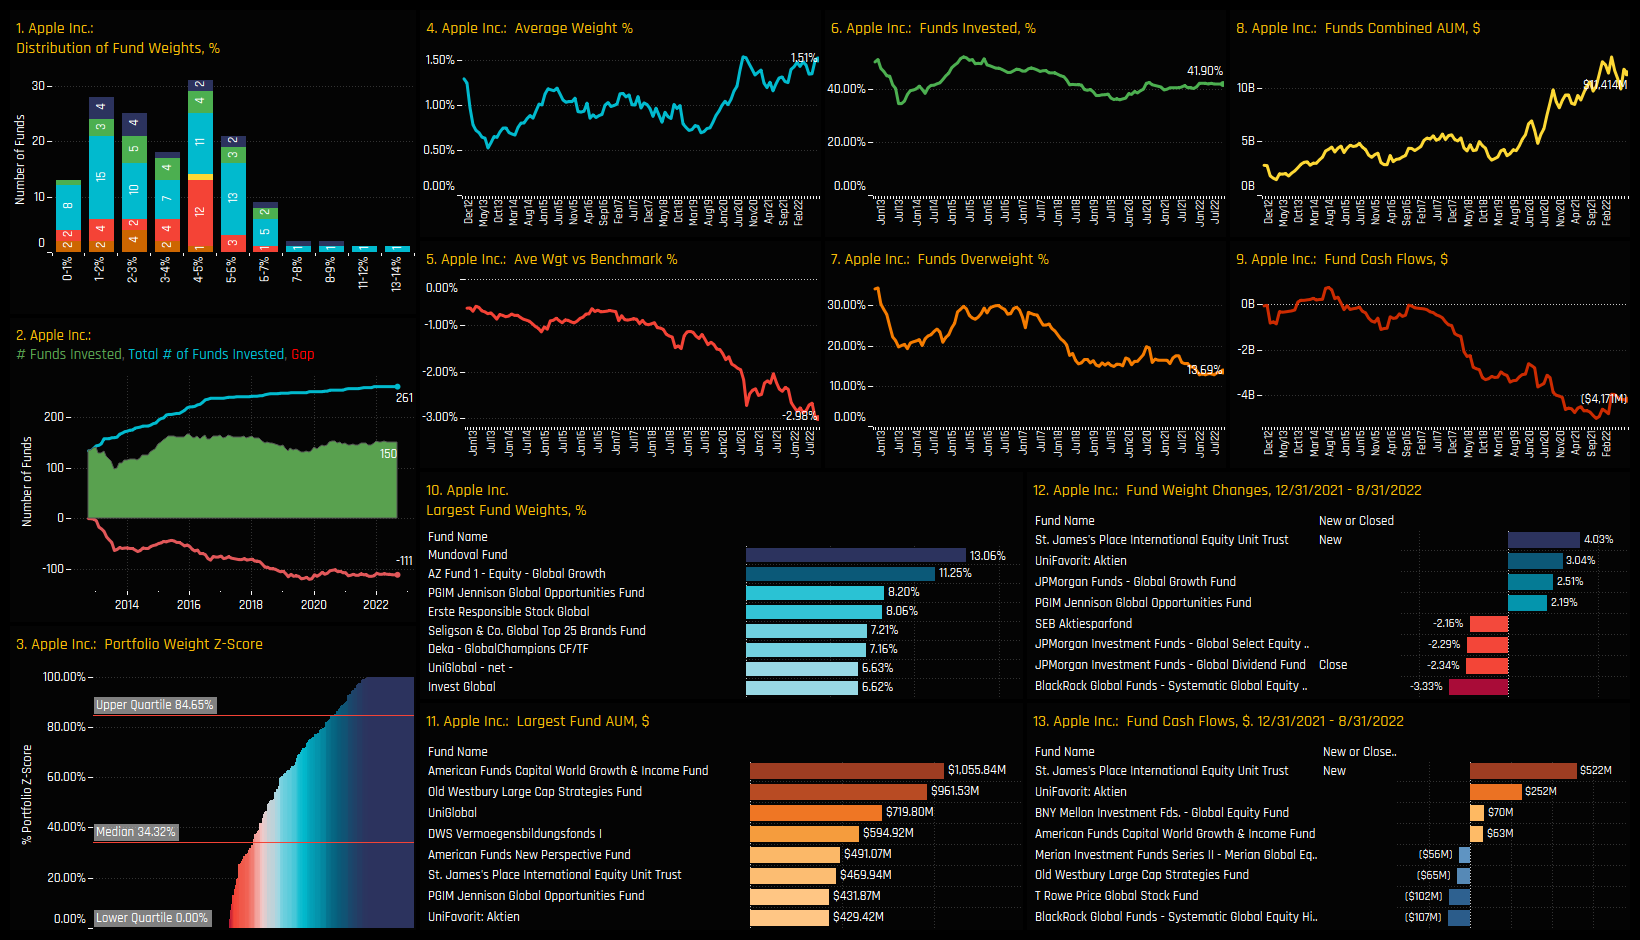
The most widely held stocks are Microsoft Corporation and the combined Alphabet Class A & C listings, held by 75.1% and 66.5% of funds respectively. Apple remains a sizeable underweight compared to benchmark, with average weights of 1.51% nearly 3% shy of the ACWI benchmark weight. High conviction positions are led by Mundoval Fund in Apple (13.06%) and Longleaf Partners in Lumen Technologies (11.85%).
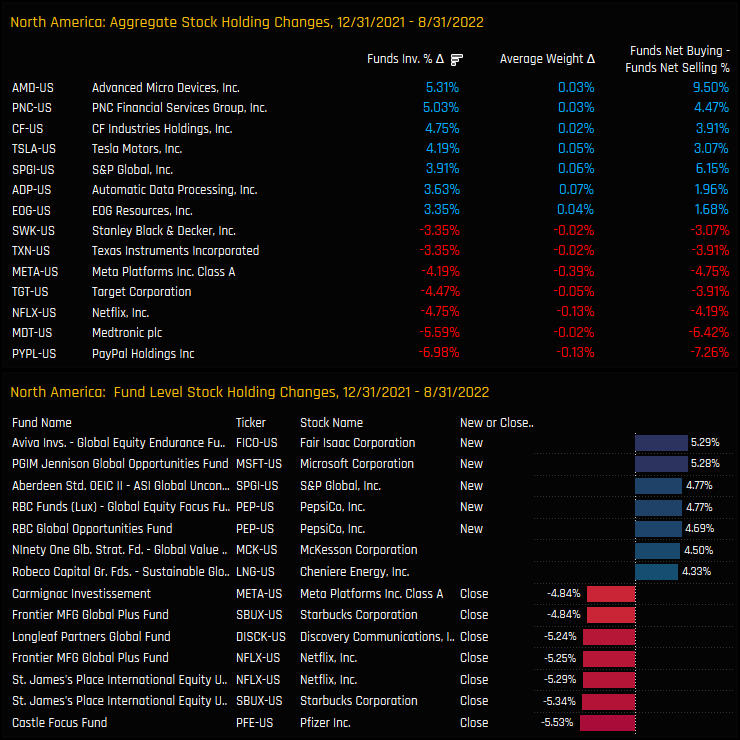
Activity over the course of the year has favoured Advanced Micro Devices, with a further +5.31% of funds buying in to the stock, PNC Financials Services Group (+5.03%) and CF Industries Holdings (+4.75%). Leading the way on the sell side were PayPal Holdings, Medtronic and Netflix, with an excess of funds closing positions, more sellers than buyers and average weight falling across all 3 stocks.
Stock Holdings by Style
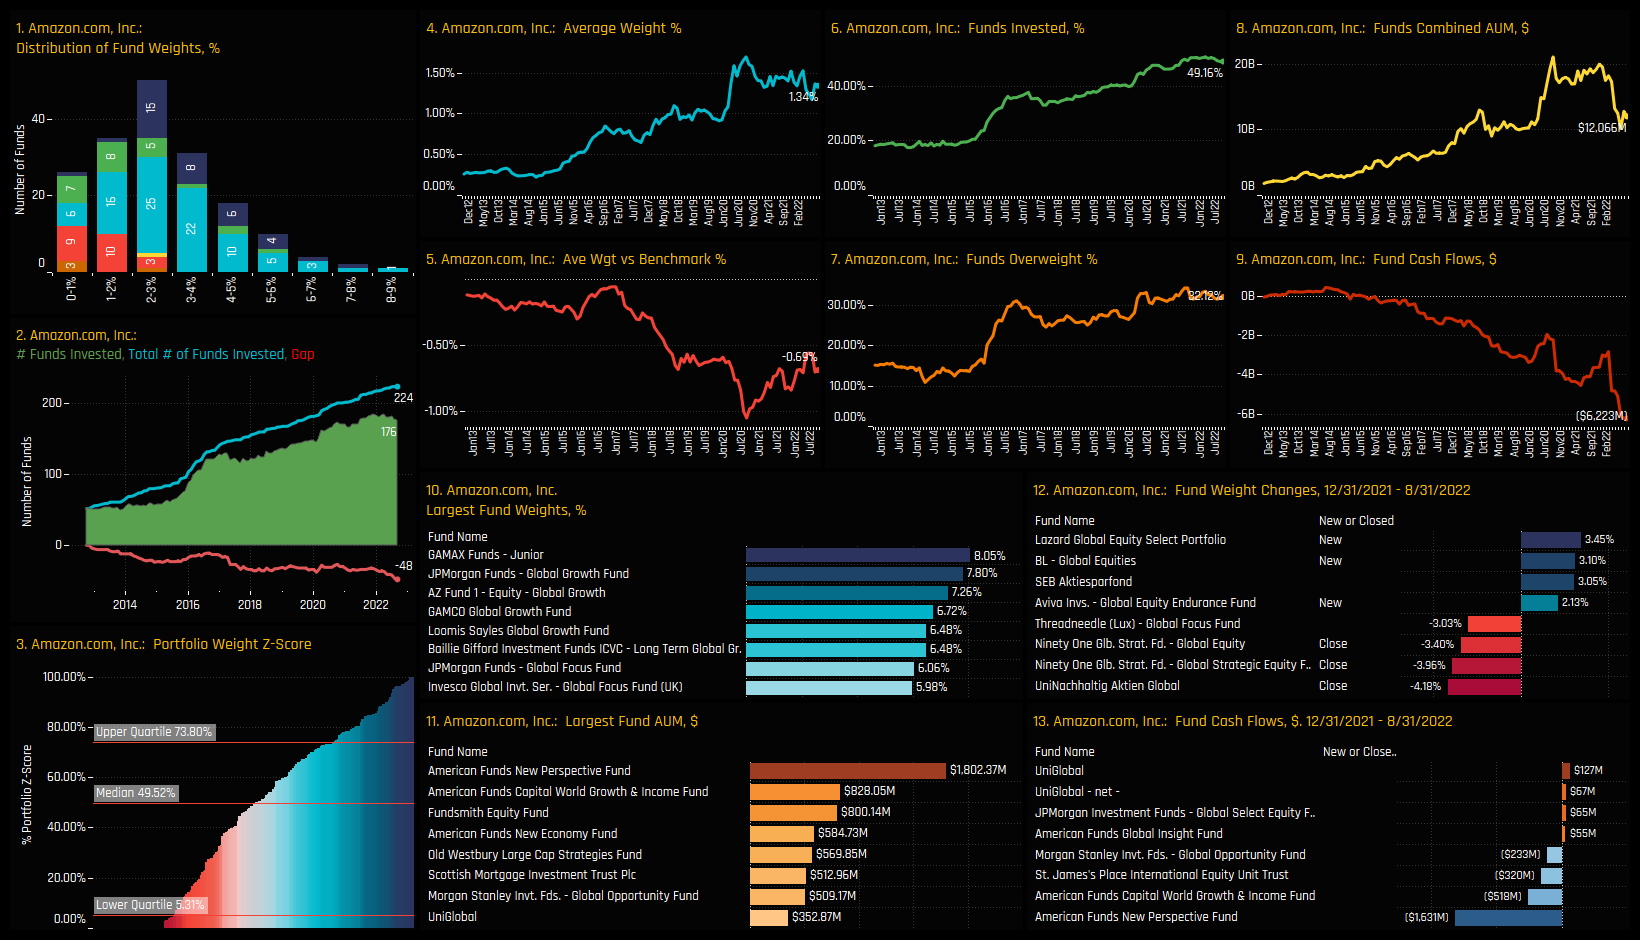
Split by Style, Microsoft Corporation is a top 2 most widely held stock for all 5 Style groups, whilst Amazon.com is noticeably absent among Global Yield and Value investors. Between 12/31/2021 and 08/31/2022, Growth and Aggressive Growth investors scaled back exposure to Meta Platforms and Paypal Holdings, whilst Value and GARP funds bought in to CF Industries Holdings.
Conclusions
North American allocations among active Global investors have surged to new highs. Across all of our ownership metrics, allocations have moved higher in 2022 as part of a concerted effort by managers to increase exposure to the region.
Sectors driving allocations higher are led by Energy, Health Care and Industrials with active rotation in to all 3, whilst Consumer Staples have seen signs of investor fatigue.
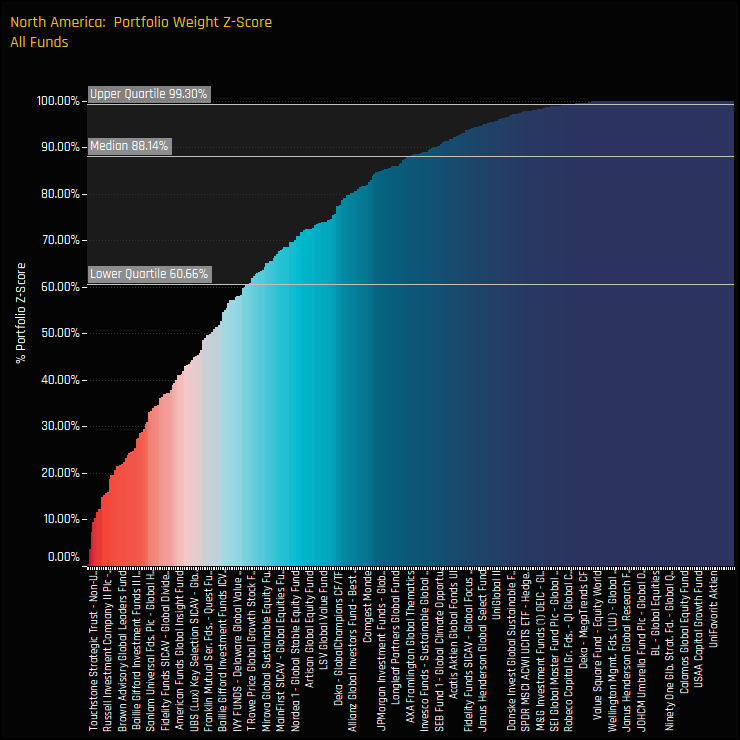
The chart to the right shows the Z-Score of North American portfolio weights for every fund in our Global analysis. A score of 100% would indicate today’s weight is the highest on record and 0% the lowest, for each fund. A median Z-score of 88.14% is a telling statistic, and highlights how well positioned active Global investors are to the region compared to most points in history.
Yet in combination with these near record levels of positioning, active managers remain underweight North American stocks by a significant margin of-5.78%, on average. If the actions of global managers this year tell of a concern over mainland Europe and a pivot toward the safehaven of North America, then versus the benchmark the majority of funds are still on the wrong side of this trade. Perhaps this rotation has further to run.
To round off the analysis, below we have included stock profiles for the major stock holdings in the North American region.


