Asia Ex-Japan: Country Positioning Update

92 Active Asia Ex-Japan Funds, AUM $62bn

Country Positioning Update

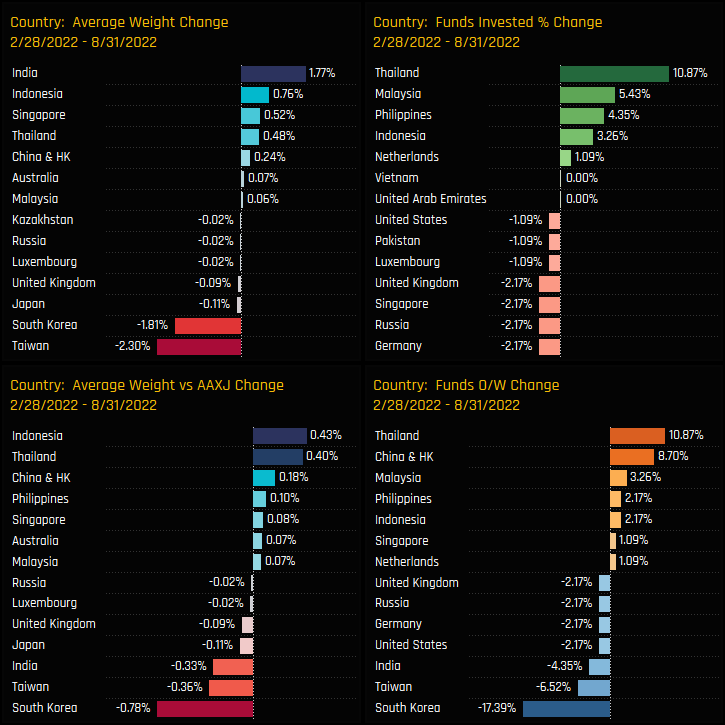
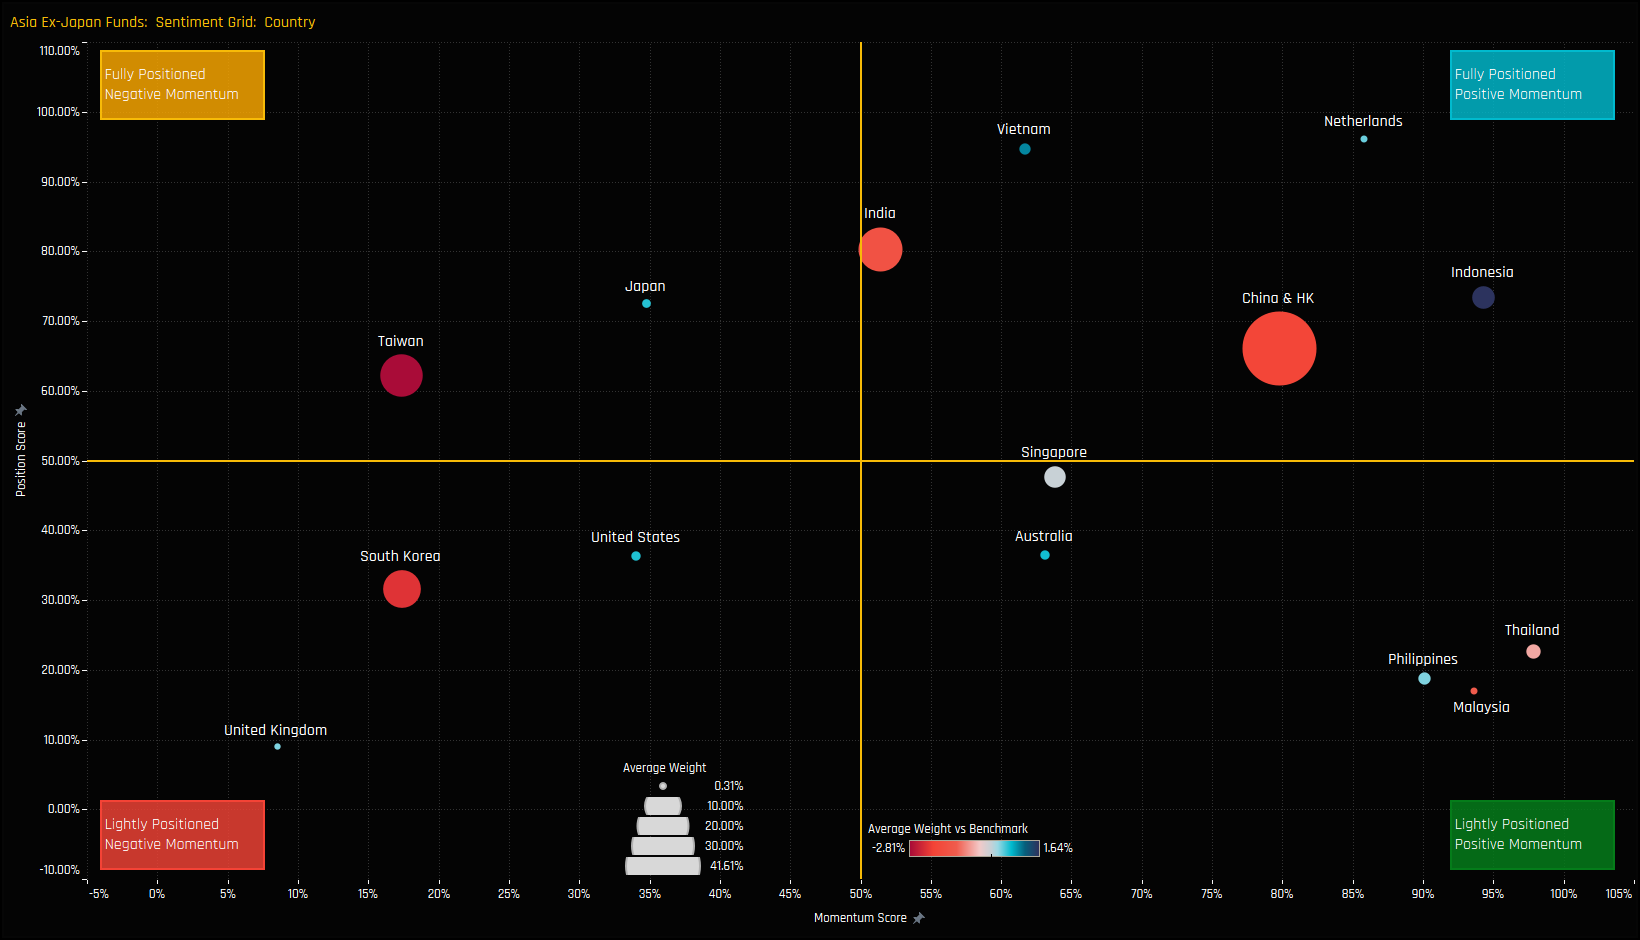
In this piece we provide a comprehensive analysis of country positioning among Asia Ex-Japan equity funds. We look at the current ownership dynamics and tie that in to the long-term trends in country positioning and more recent manager activity. We find that Taiwan and South Korea have born the brunt of recent investor rotation, with Asia Ex-Japan investors moving towards the relatively underowned Malaysia, Thailand and The Philippines. Indonesia is the current darling of the region, with investors also re-engaging with China & HK after a period of consolidation.

Country Ownership Picture
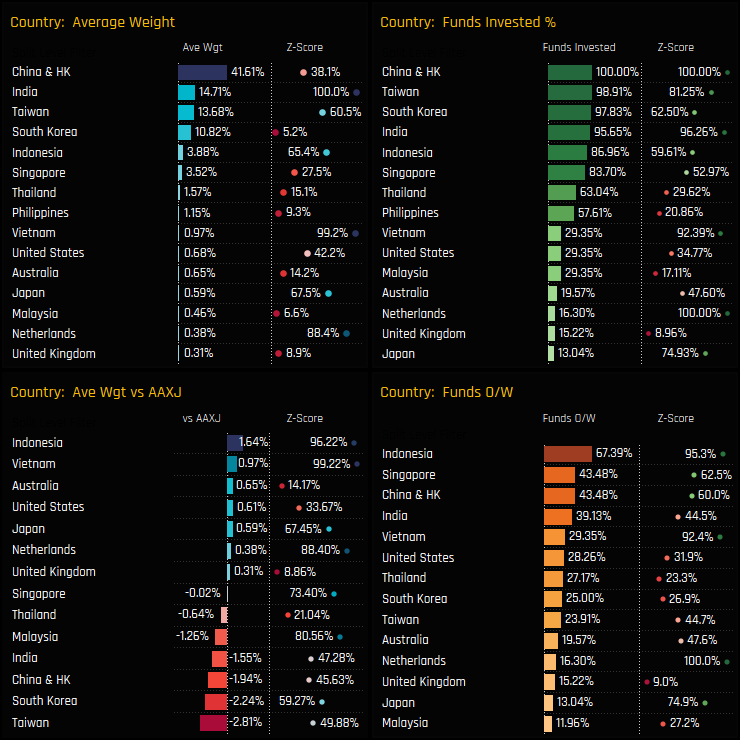
The latest snapshot of country ownership among active Asia Ex-Japan funds is shown in the 4 charts below. On an absolute basis, China & HK tops the list, South Korea has dropped to the bottom of the ‘big 4’’ and Indian weights of 14.71% are the highest on record.. Relative to benchmark, Indonesia and Vietnam are the key overweights, followed by a number of out-of-benchmark holdings in Australia, the US and Japan. Taiwan and South Korea are the standout underweights, with just 23.9% and 25% of funds positioned higher than the benchmark iShares AAXJ ETF.
Changes over the last 6-months have been quite significant on a country level. On an average weight basis, Asia Ex-Japan portfolios have seen weights drop heavily in Taiwan (-2.3%) and South Korea (-1.81%), with India, Indonesia, Singapore and Thailand taking up the slack. Of course, changes in average weight can be caused by either price movements or active rebalancing. India appears a beneficiary of the former, with managers actually increasing underweights as weights moved higher, whilst the ASEAN nations of Thailand, Malaysia, Philippines and Indonesia saw all measures of ownership move higher over the period – a definite active rotation.

Country Sentiment

The chart below shows where current positioning in each country sits versus its own history going back to 2011 on a scale of 0-100% (y-axis), against a measure of fund activity for each country between 02/28/2022 and 08/31/2022 (x-axis). It is effectively a different way of visualizing the 2 charts above. The size of the bubble represents the average fund weight in that country and the colour its weight versus the iShares Asia Ex-Japan AAXJ ETF. We can split the countries in to 4 groups. Firstly Taiwan and South Korea who have both suffered a degree of outward rotation this year, pushing ownership levels off their all-time highs. Secondly India, Vietnam and Singapore where momentum has stalled, though Vietnam and India are better positioned compared to Singapore compared to their own history. Thirdly come China & HK and Indonesia who are both well positioned and have benefitted from country rotation this year. Finally come the ASEAN trio of Malaysia, Thailand and The Philippines, all benefitting from inflows this year whilst positioning remains at historically low levels. We now look at each country in more detail.

China & HK

The 14 charts in the dashboard below capture various ownership metrics for China & HK investment within Asia Ex-Japan portfolios. Charts 1-3 show the distribution of China & HK portfolio weights and the average weight split by style. It shows the bulk of the distribution between 35%-50% with a longer tail to the downside. The Style split is quite narrow, with little to separate Growth and Value funds. The GARP average weight of 57.2% is pushed higher by outsized allocations from Allianz Asia Innovation (96.3%), DJE Asien (55.3%) and AMC Seapac (52.88%). The time-series of average weight (ch4) shows China & HK allocations falling from the highs of 51.65% in October 2020, but stabilizing from the lows of March this year. In addition, the average underweight has tightened to -1.94% (ch5) as an increasing number of funds position themselves overweight China & HK (ch7).
The most widely held stock by some margin is Tencent Holdings Ltd, owned by 89.1% of managers at an average weight of 4.08%, followed by Alibaba Group Holdings and AIA Group both owned by 77.2% of funds. Key underweights are in China Construction Bank, Alibaba Group Holding and Tencent Holdings, with Xiaomi Corp and Nio Inc lightly held by active Asia Ex-Japan investors. Stock rebalancing over the last 6-months has been fairly evenly split, with +6.5% of funds opening positions in Baidu Inc and +5.4% in Hong Kong Exchanges, Li Auto and Tsingtao Brewery. On the negative side, -7.4% of managers closed JD.Com holdings and -5.43% closed Shenzhou International Group and Sino Biopharmaceutical Group. Overall, the flight from China that occurred through 2021 has subsided, with managers more willing to build overweight positions at these levels.

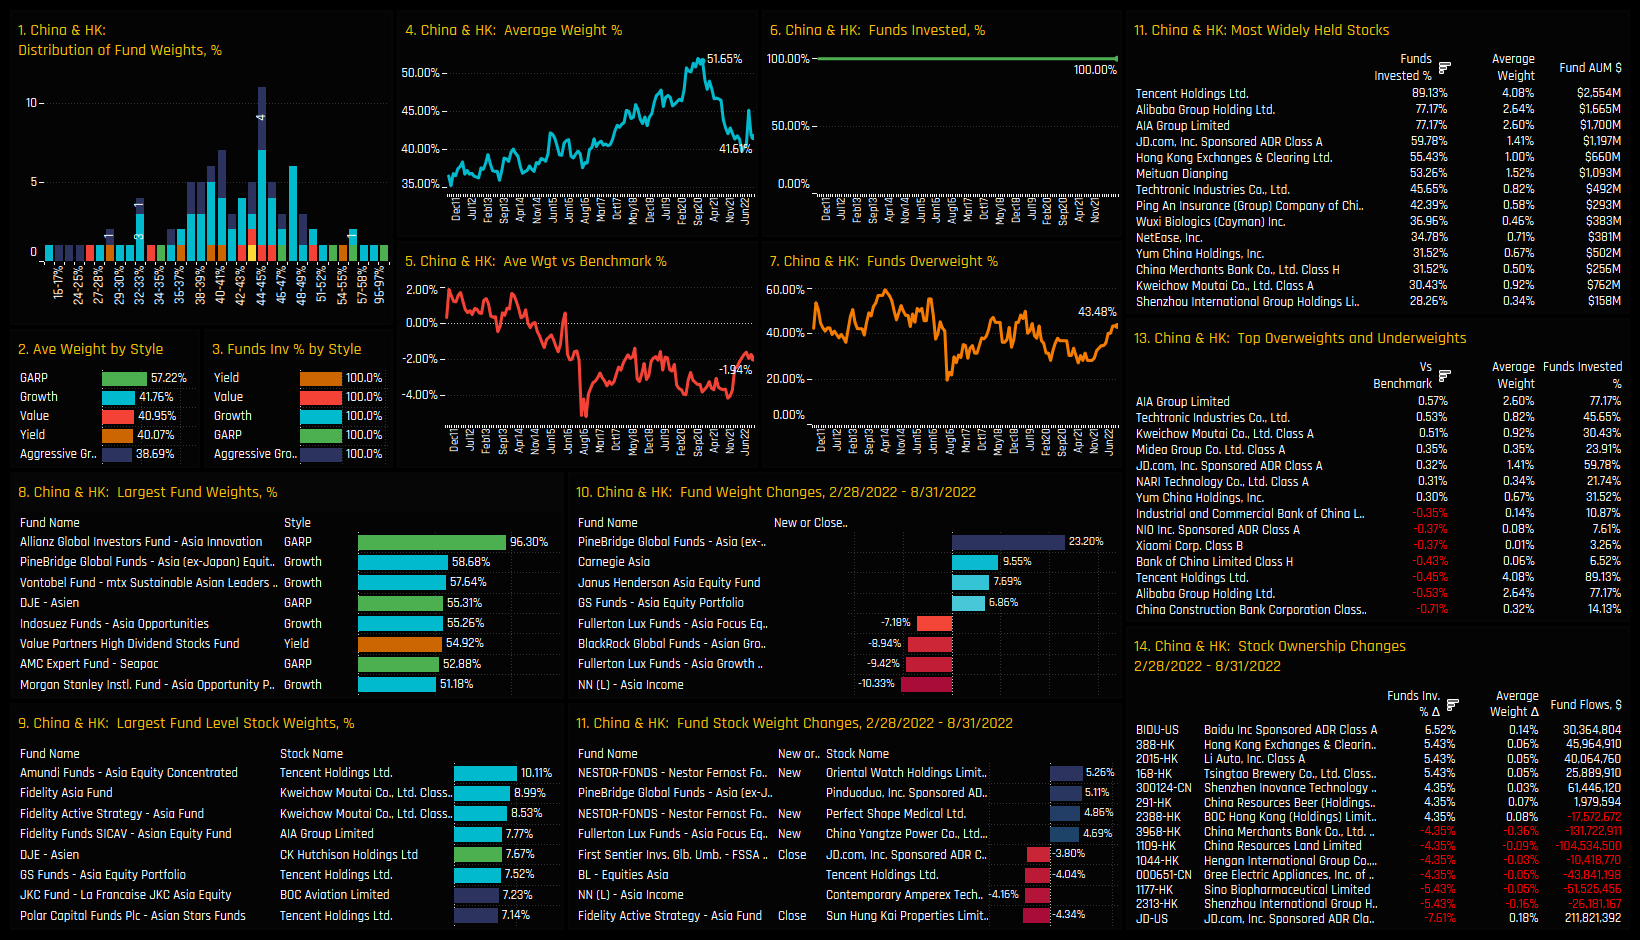
Click on the link below for the latest data report on China & HK positioning among active Asia Ex-Japan funds.

Indonesia

Despite it’s small average holding weight of just 3.88%, Indonesia somehow feels like the darling of Asia Ex-Japan investment at the moment. The average overweight of +1.64% versus the iShares AAXJ ETF is an undeniable sign of positive sentiment, and so too the rising measures of fund ownership that have occurred over the course of this year. On a fund level, there are those willing to allocate substantially more than the benchmark 2.24% weight in Indonesia, but most cannot stretch beyond 10%, save for Nestor Fernost Funds on 23.4%.
The most widely held stocks are PT Bank Central Asia and PT Bank Rakyat, yet holding weights are smaller than China & HK peers, likely due to a tendency to allocate stock weights based on market capitalization rather than levels of conviction. Activity between 02/28/22 and 08/31/22 is heavily skewed to the buy side, with 4.35% of funds buying in to PT Bank Negara and PT Bank Rakyat, whilst Nestor Fernost, Fullerton Asia Focus and NN Asia Income increased weights the most over the period. Overall, sentiment has rarely been this strong.

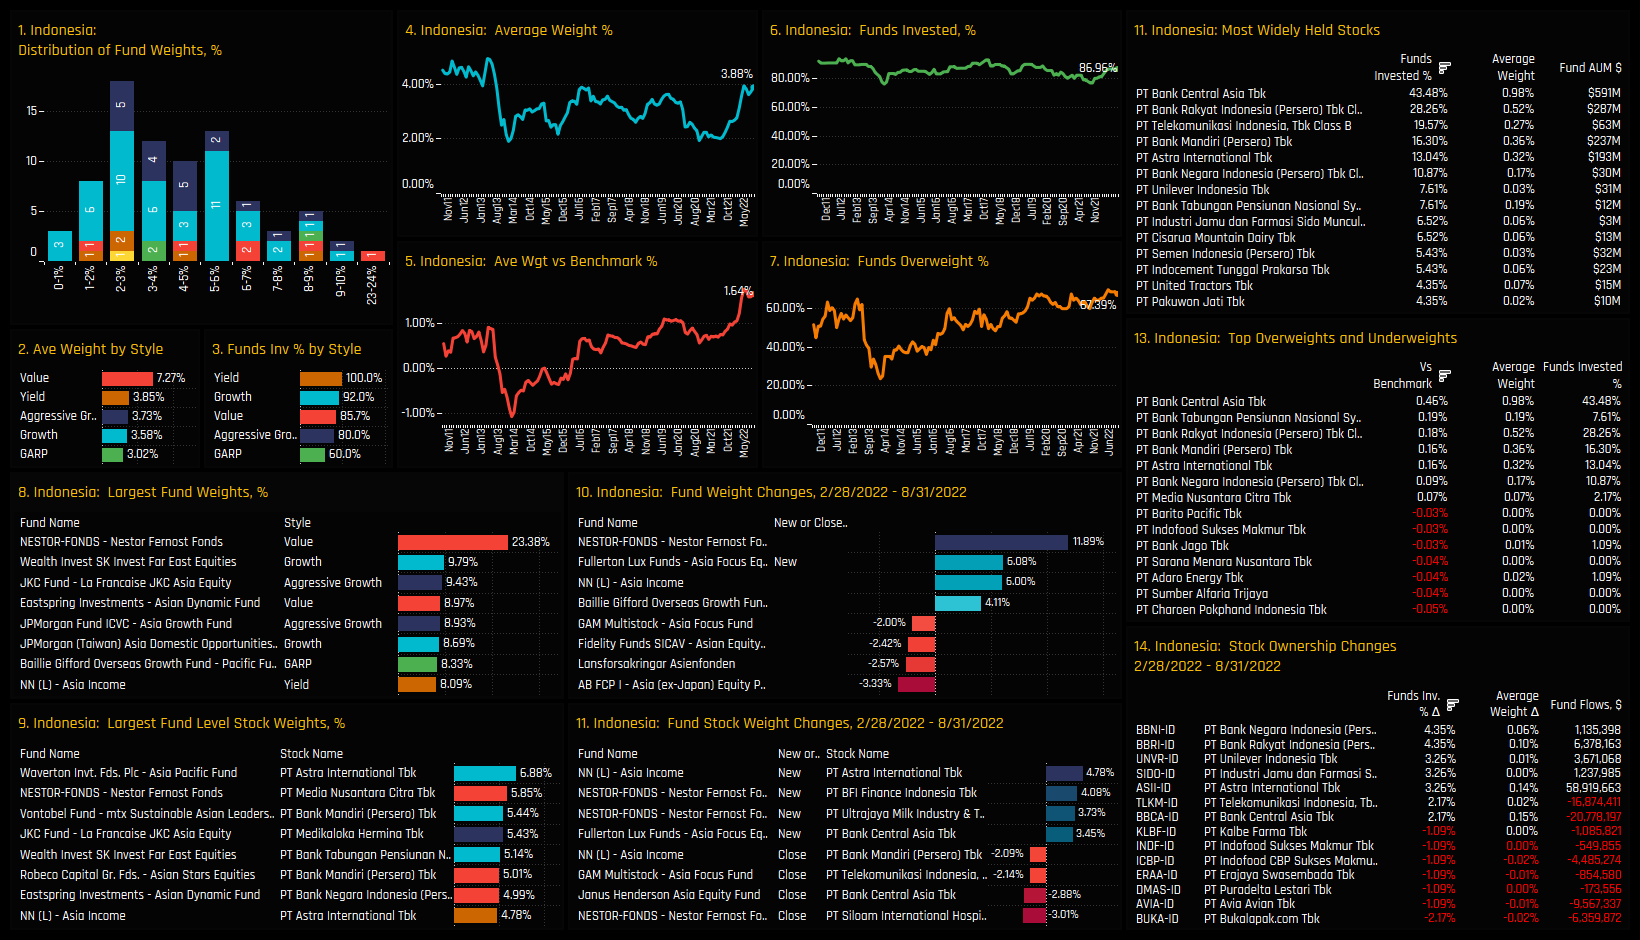
Click on the link below for the latest data report on Indonesia positioning among active Asia Ex-Japan funds.

Vietnam

The trajectory of ownership in Vietnam always makes for an interest visual, yet in truth ownership levels are still light among active Asia Ex-Japan investors. Average holding weights of 0.97% are the highest on record, yet still only 29.35% of managers have exposure to the largest non-benchmark country allocation in the region. Most of the current investor base hold less than a 5% weight in Vietnam, save for 6 funds led by Matthews Asia Ex-Japan Dividend (9.68%) and Baillie Gifford Asia Pacific (8.17%).
Stock investment is light, with the most popular holding of Vietnam Dairy held by just 10.87% of managers. Whilst current investment levels leave a lot of room for future ownership growth, Vietnam has struggled to attract a substantial investor base to rival even the smaller ASEAN nations. Perhaps this is down to it’s non-benchmark status or even a lack of investment options, either way, new investors need to come in to push Vietnam in to the upper leagues.

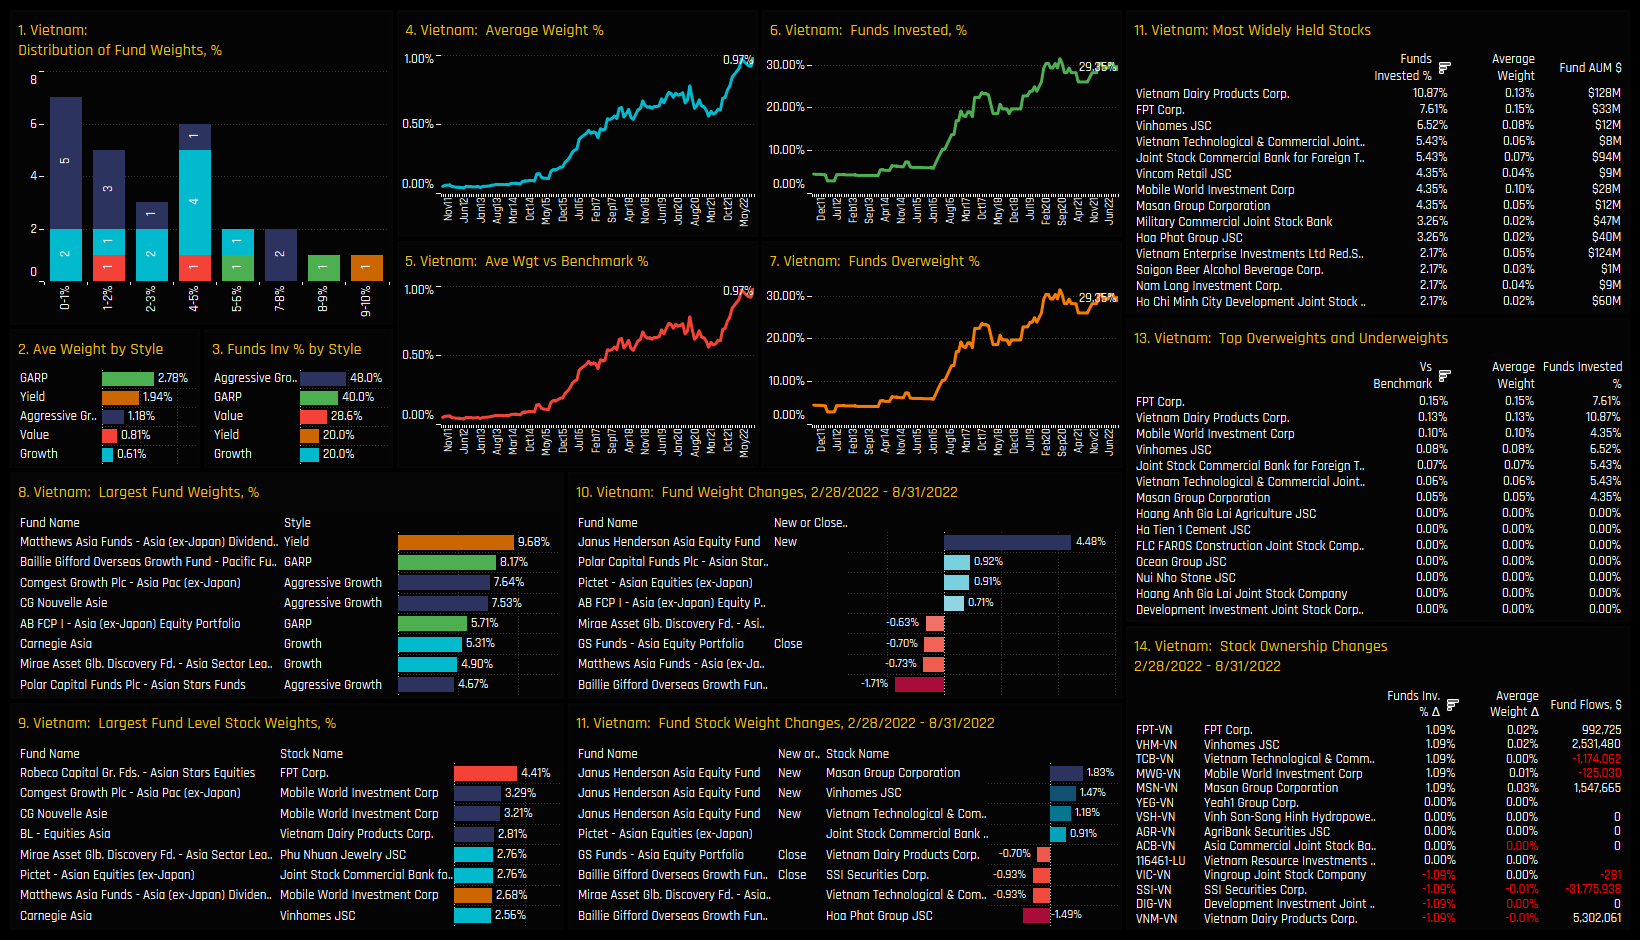
Click on the link below for the latest data report on Vietnam positioning among active Asia Ex-Japan funds.

India

Indian allocations among Asia Ex-Japan funds are at their highest levels on record. Average weights of 14.71% make it the 2nd largest allocation and a viable alternative to China & HK as the largest country allocation for a number of funds (see ch8). However, at the same time, active managers have moved from a +2% overweight to a -1.55% underweight in little over 3-years, indicating that managers are trimming allocations as Indian outperfomance pushes portfolio weights higher. Exposure levels in India are heavily influenced by Style, with Aggressive Growth and Growth managers allocating at least twice the weight of Value, GARP and Yield managers.
On a stock level, HDFC Bank is the most widely held, owned by 60.9% of managers at an average weight of 1.92%. Over the last 6-months managers have been fairly active in Indian stock rotation. On the positive side, ICICI Bank attracted investment from a further 8.7% of the managers in our analysis, led by new positions from Janus Henderson Asian Equity (+3.89%) and increases from Fullerton Asia Focus (3.7%). Opposing this were net closures in Bharat Forge, Housing Development Finance and Asian Paints.

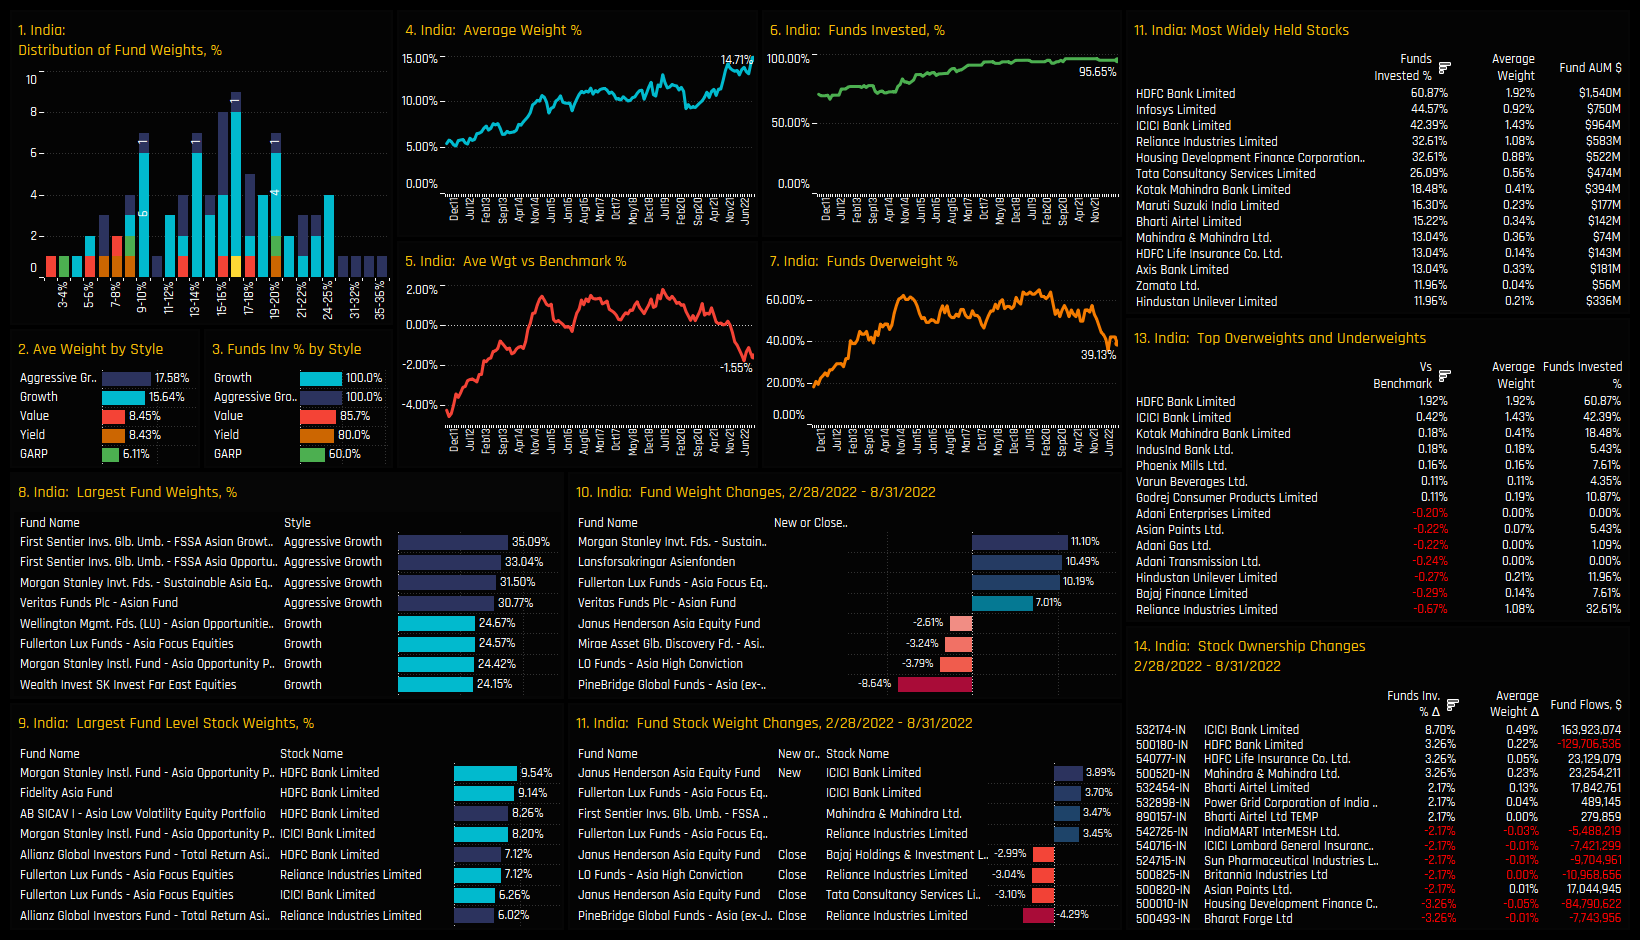
Click on the link below for the latest data report on Indian positioning among active Asia Ex-Japan funds.
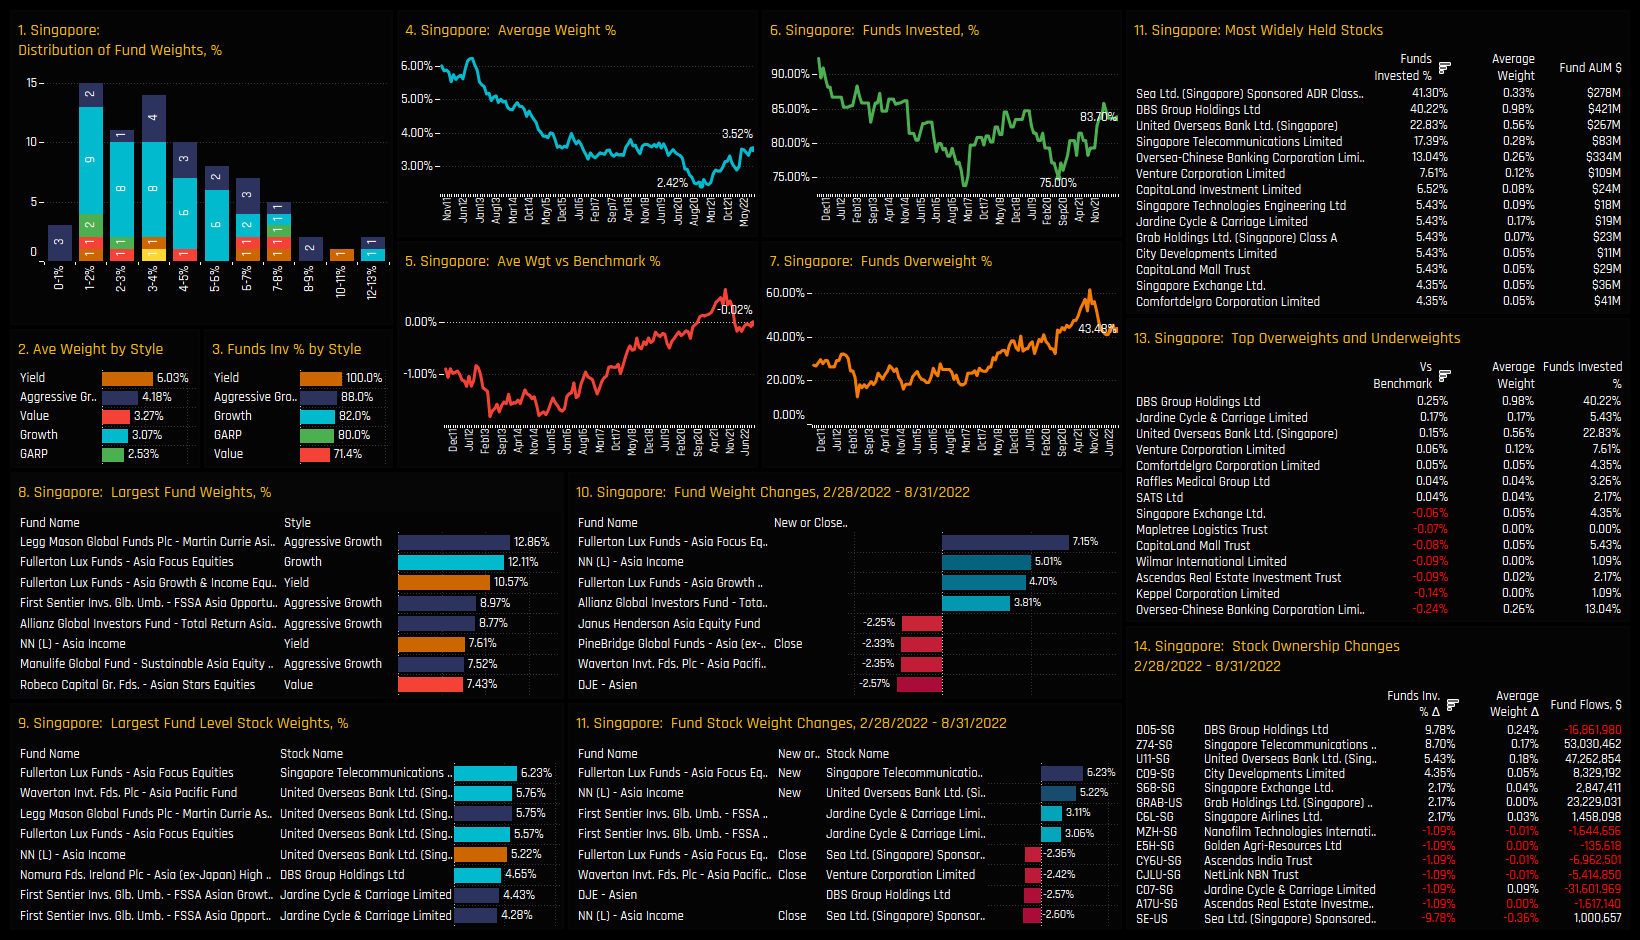
Singapore

Singapore allocations are on a upward trajectory, but momentum has stalled a little of late. Average holding weights of 3.52% are up from the lows of mid 2020 when sentiment began to reverse after a decade long ownership bear market. Singapore is a good sized allocation for a number of managers, with a wide holdings distribution topping out with Martin Currie Asia Ex-Japan on 12.86%. Over the last 6-months, closures by Pinebridge Asia Ex-Japan were offset by weight increases by Fullerton Asia Focus and NN Asia Income.
Sea Ltd and DBS Group are the dominant stock holdings by some distance, owned by 41.3% and 40.2% of funds respectively, though DBS Group is the larger weight on average and the key stock overweight. Activity over the last 6-months was defined by a switch from Sea Ltd and in to DBS Group, with further ownership increases in Singapore Telecommunications and United Overseas Bank. Overall, it’s a constructive picture and one that suggests a good degree of conviction among active Asia Ex-Japan managers.

Taiwan

Taiwan allocations have taken a nose-dive. From a peak of 16.51% in December of last year, average fund weights have fallen to 13.68%, closer to levels last seen pre-pandemic. In truth, active managers started to take money off the table well before that, with the net underweight peaking at -0.88% in August of 2020 and aggressively falling since then. The majority of fund allocations in Taiwan sit between 13%-19% with only 4 strategies, led by Garraway Oriental Focus, allocating over 20%. Fund activity over the last 6-months has been heavily skewed to the sell-side, led by Pinebridge Asia Ex-Japan reducing weights by -7.22%, Nestor Fernost (-6.21%) and Carnegie Asia (-6.19%). This leaves today’s allocations more closely aligned to the long-term range on most metrics.
TSMC is the conviction holding, owned by 92.4% of managers at a weight of 7.17% on average, more than half the total Taiwan allocation. The net Taiwan underweight is comprised of a number of stocks that are simply not palatable to active Asian investors. Companies such as Chungwa Telecom that not a single fund owns, together with 23 other ‘avoided stocks’ account for -1.73% of the -2.81% total underweight. A host of names dragged the overall Taiwan allocations lower over the last 6-months, but non more so than MediaTek Inc, which saw a -4.23% drop in funds invested and a -0.75% fall in average weight. Sentiment is still pretty fragile.

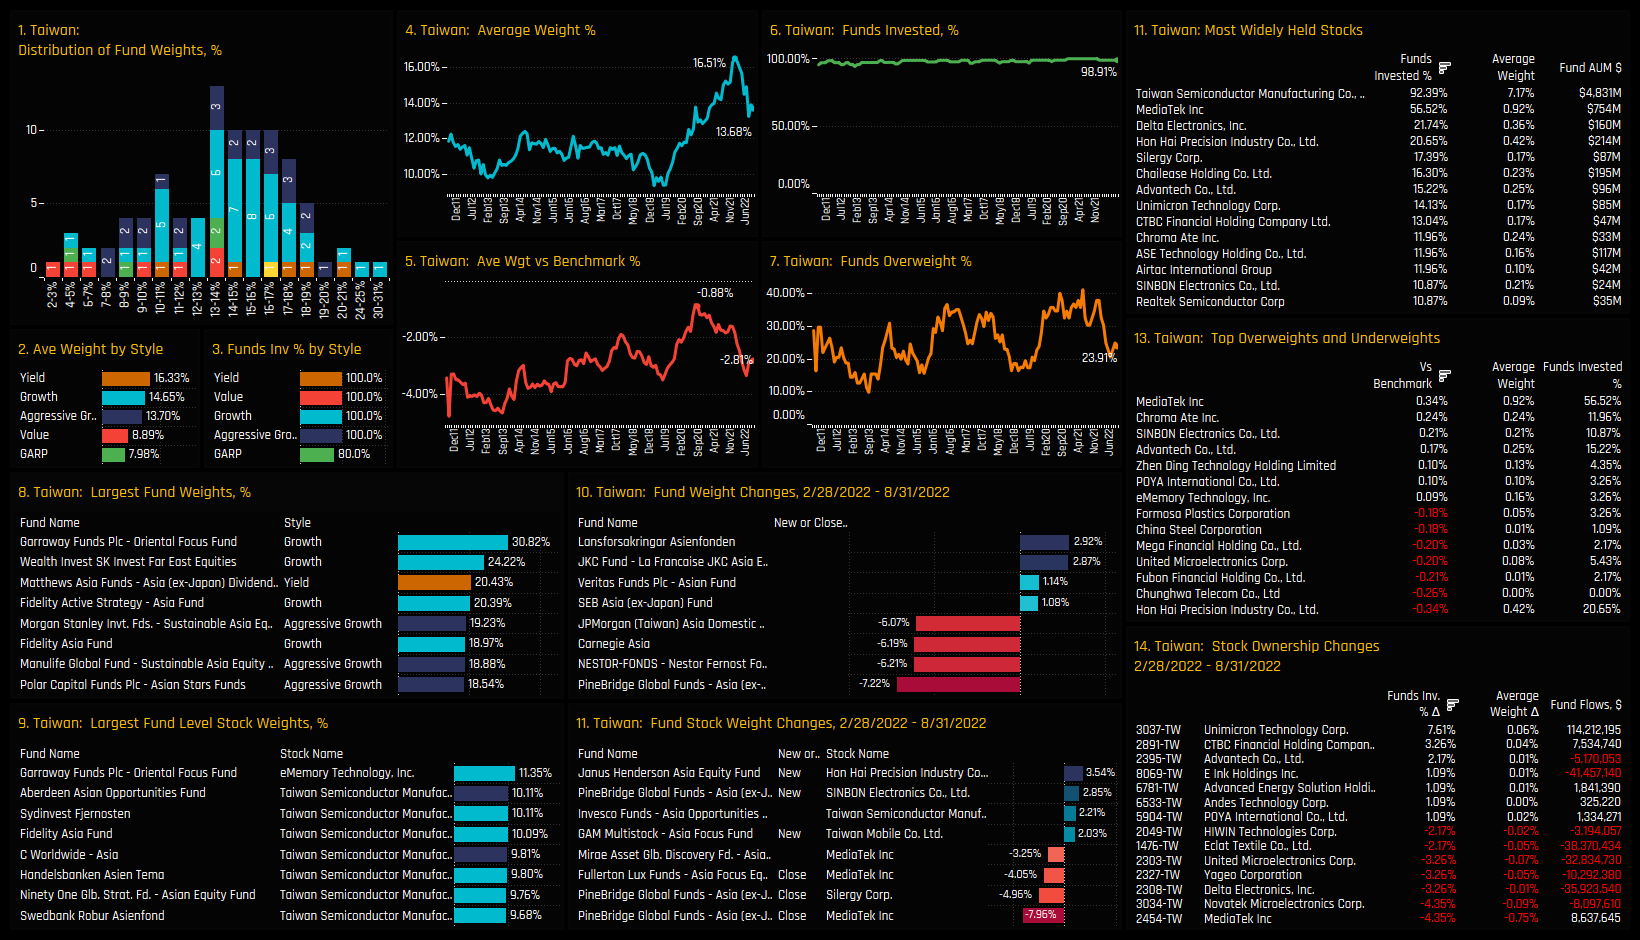
Click on the link below for the latest data report on Taiwan positioning among active Asia Ex-Japan funds.

South Korea

Ownership trends in South Korea don’t look a whole lot better. Despite seeing some cyclicality along the way, the long-term trend of average fund weights in chart 4 is generally on a downward path. Today’s average weight of 10.82% is the lowest on record, with managers increasing net underweights around the same time as Taiwan in late 2020, leaving just 25% of active Asia Ex-Japan managers overweight South Korea. The majority of funds allocate between 8% and 15% in South Korea with just 7 strategies ahead of that, led by Hermes Asia Ex-Japan (20.55%) and Wealth Invest Far East Equities (19.24%). There have been some significant allocation drops over the last 6-months, with Fullerton Asia Focus reducing exposure by -9.85%, Janus Henderson Asia Equity by -8.02% and HSBC Asia Ex-Japan by -7.56%. This has been a sizeable and deliberate adjustment for many.
The most widely held stock remains Samsung Electronics by quite a distance, owned by 75% of managers at an average weight of 3.89%. A 4 further stocks have attracted investment from more than 20% of the funds in our analysis. Similar to Taiwan, the underweight is comprised of many companies that are largely avoided by active investors, led by Celltrion, Samsung C&T and SK Holdings. Stock activity over the last 6-months has been brutal, with -9.8% of managers closing out Kakao Bank exposure, -6.5% closing out Samsung SDI and -4.35% closing both Kakao Corp and Samsung Electronics holdings. In the eyes of active managers, there are clearly better opportunities in the Asia Ex-Japan region away from South Korea.

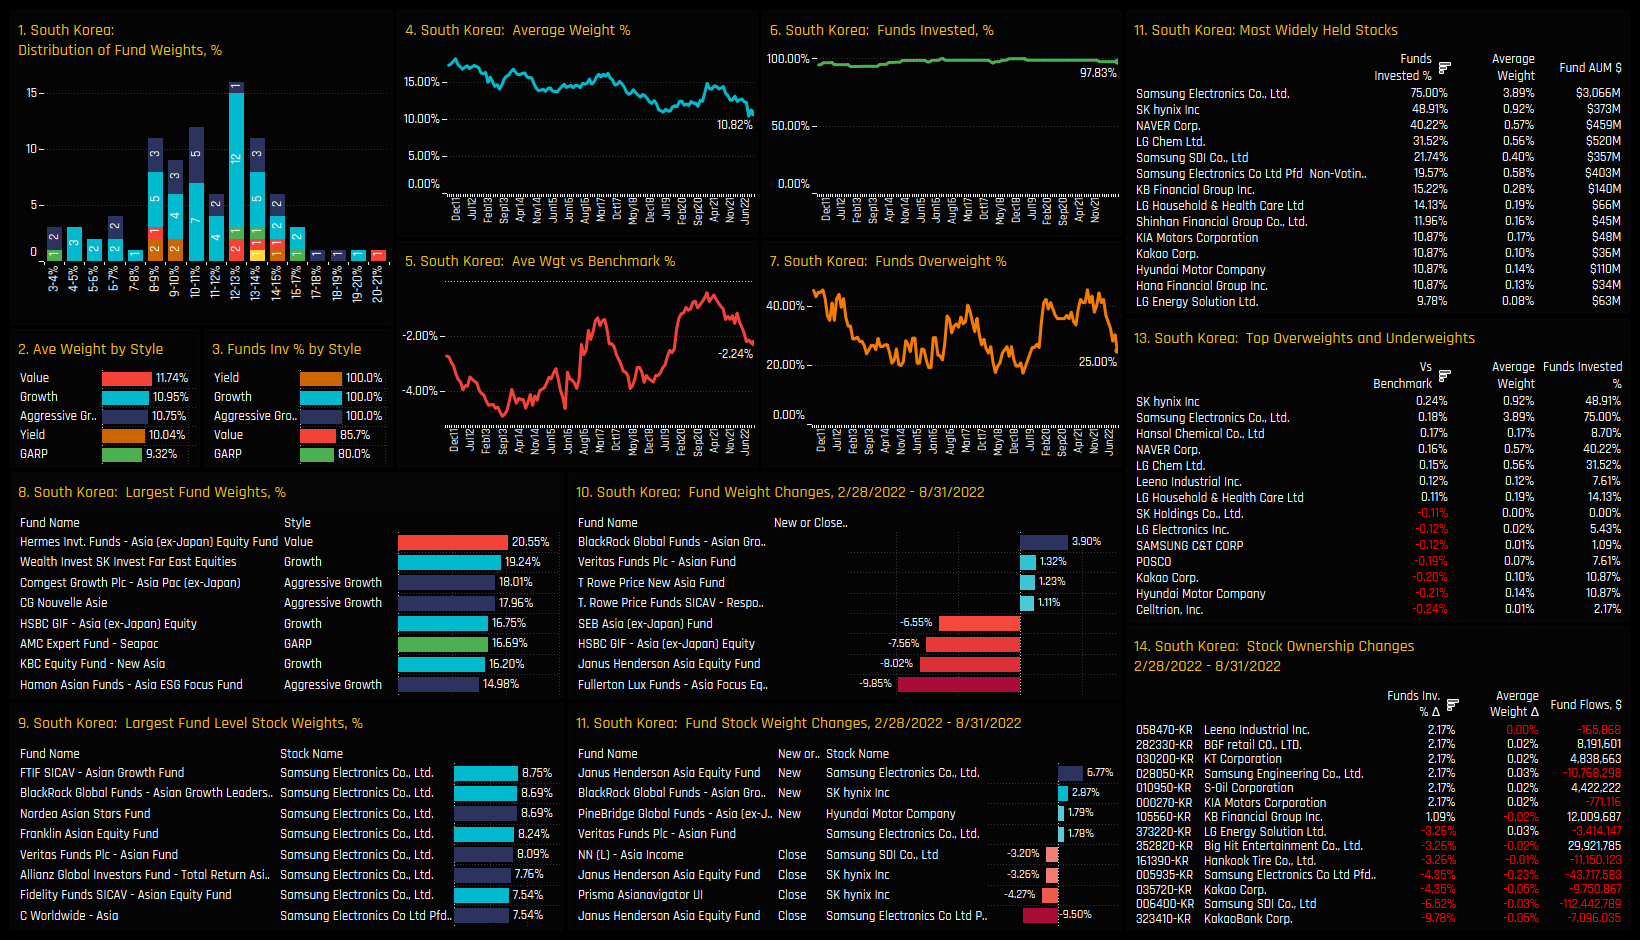
Click on the link below for the latest data report on South Korean positioning among active Asia Ex-Japan funds.

Malaysia

Malaysia, alongside Thailand and The Philippines sit in a group of countries that are starting to see some interest from managers after a long period of decline. Malaysia has seen the most significant long-term decline of the trio, highlighted best in chart 6, with over 80% of managers with exposure in 2011 falling to just 29.35% today. The long-term downward trend is showing tentative signs of turning around, both in terms of funds invested, average holding weights and the percentage of funds positioned overweight the benchmark. This isn’t a snap reversal of sentiment, but a sign that managers are amenable to raising allocations to the region’s most unloved country. New positions from NN Asia Income, Lansforsakringer AsienFonden and Skandia Asia are testament to this, but still allocations remain small, topping out at 3.5% for Garraway Oriental Focus.
Stock holdings are extremely light, with no single company dominating the picture, rather a bunch of stocks owned by between 3% and 5% of active managers. Underweights are led by Public Bank BHD, CIMB Group Holdings and Malayan Banking Group. Activity over the last 6-months reflects the tentative change in sentiment, with 4.35% of active investors buying in to Petronas Chemicals Group and 3.26% in to Malayan Banking Group. Whether this change in sentiment will spread to the wider Asia Ex-Japan fund universe remains to be seen, but with over 70% of managers not invested in Malaysia, there is clearly scope for more buying in the future.

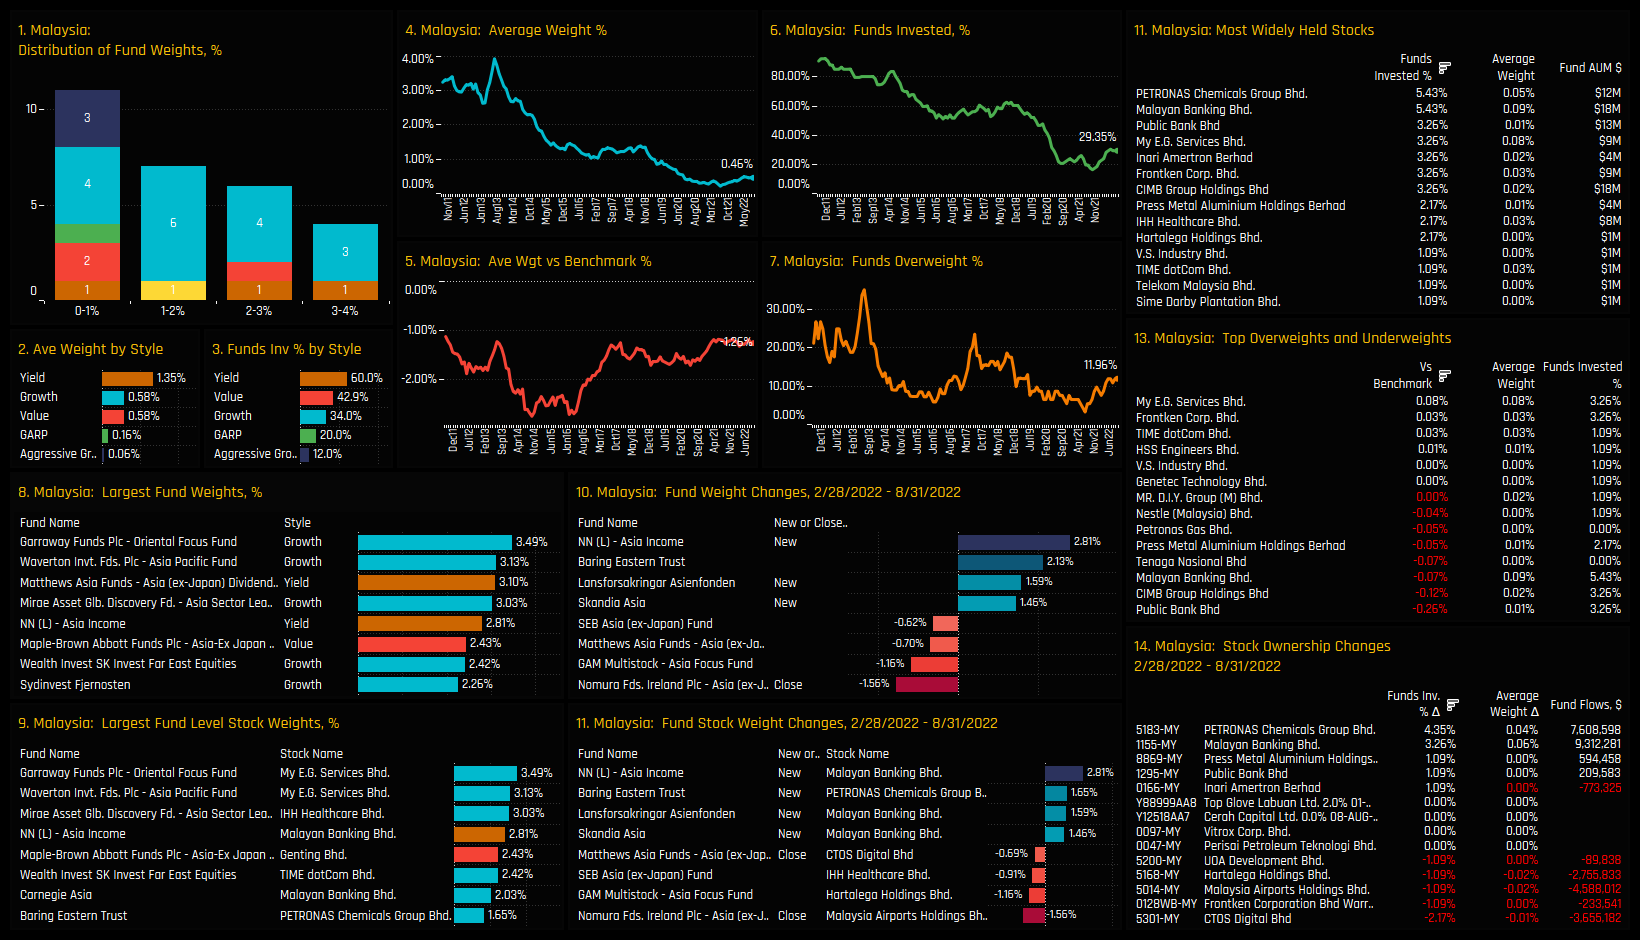
Click on the link below for the latest data report on Malaysia positioning among active Asia Ex-Japan funds.

The Philippines

Similar to Malaysia, though not quite of the same magnitude, The Philippines have slowly become a less than essential holding for active Asia Ex-Japan managers. The percentage of funds invested in Philippines stocks stands at 57.6%, well off the highs of 80.5% in 2016 but off the lows of 52.2% in November of last year. Individual fund allocations are larger than for Malaysia, but only marginally so, with the majority of Asia Ex-Japan investors choosing a sub 3% weight in The Philippines. Value managers have a particular bias, with Nestor Fernost and Jupiter Asian Fund the top holders and average Value fund weights of 3.35%. Over the last 6-months, Baring Easter Trust and Nomura Asia Ex-Japan had added exposure.
On a stock level, Ayala Land and Universal Robina Corp are the most widely held stocks, owned by 12% and 9.8% of investors respectively, with the latter a key overweight for active investors. The largest individual fund level stock positions are in Shakey’s Pizza Asia Ventures (Nestor) and GT Capital Holdings (Jupiter). Stock activity is skewed to the buyside, with ownership growth seen in Jollibee Foods Corp and International Container Services, whilst investors scaled back exposure in Ayala Land Inc. Of the ASEAN trio, The Philippines is seeing the slowest growth in ownership – this is a slow burn rather than a full scale reversal.

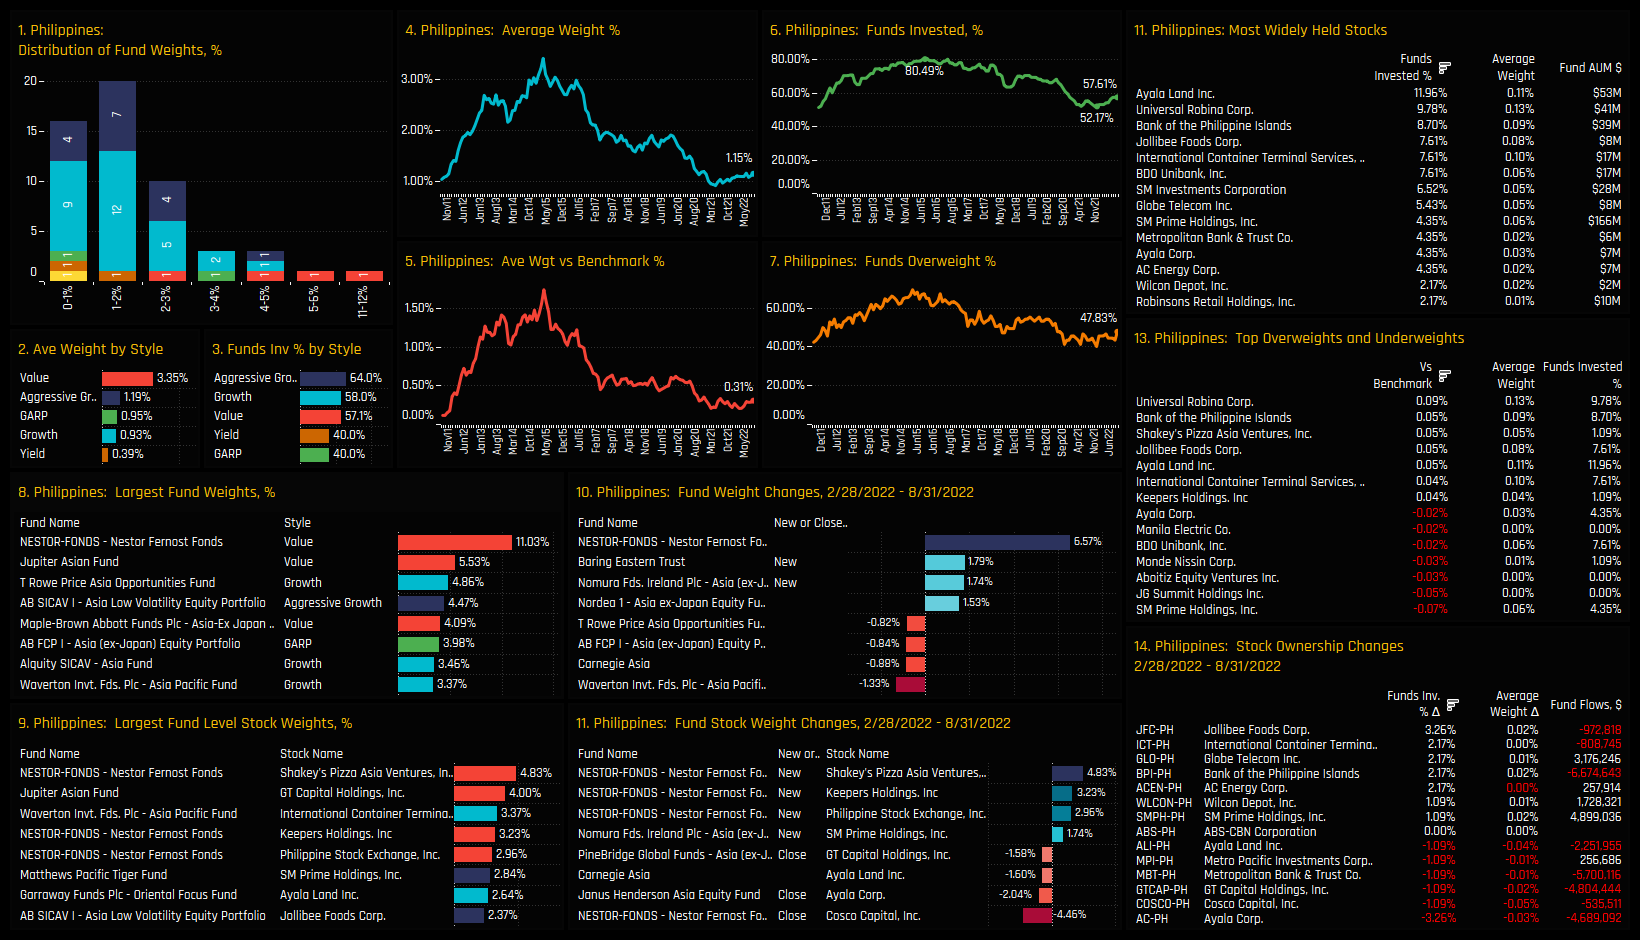
Click on the link below for the latest data report on Philippines positioning among active Asia Ex-Japan funds.

Thailand

Thailand is seeing a stronger return to form, with all of our measures of fund ownership moving significantly higher over the last 6-months. New positions from Matthews Pacific Tiger (+3.59%) and JP Morgan Asia (+2.65%) helped push the overall funds invested percentage to 63.04%, up from low of 50% at the start of the year. Thailand remains a fringe holding, with the majority of fund weights between 1%-2% and all but BL Equities Asia below a 5% allocation. Thailand is still a net underweight holding by -0.64% on average, mainly down to the 37% of funds who hold a zero allocation, but that underweight is narrowing as more managers return.
Stock ownership has more depth than both Malaysia and The Philippines, with Kasikornbank, Airports of Thailand and CP All Public held by more than 10% of Asia Ex-Japan investors. Activity on a stock level reflects the positive change in sentiment, with significant increases in ownership captured across a number of stocks, led by Airports of Thailand and Central Pattana Public. With manager activity in Thailand the most positive across all countries over the last 6-months, one wanders how long the 37% of funds who do not hold a position can hold out before they consider reinstating Thailand back in to their portfolios.

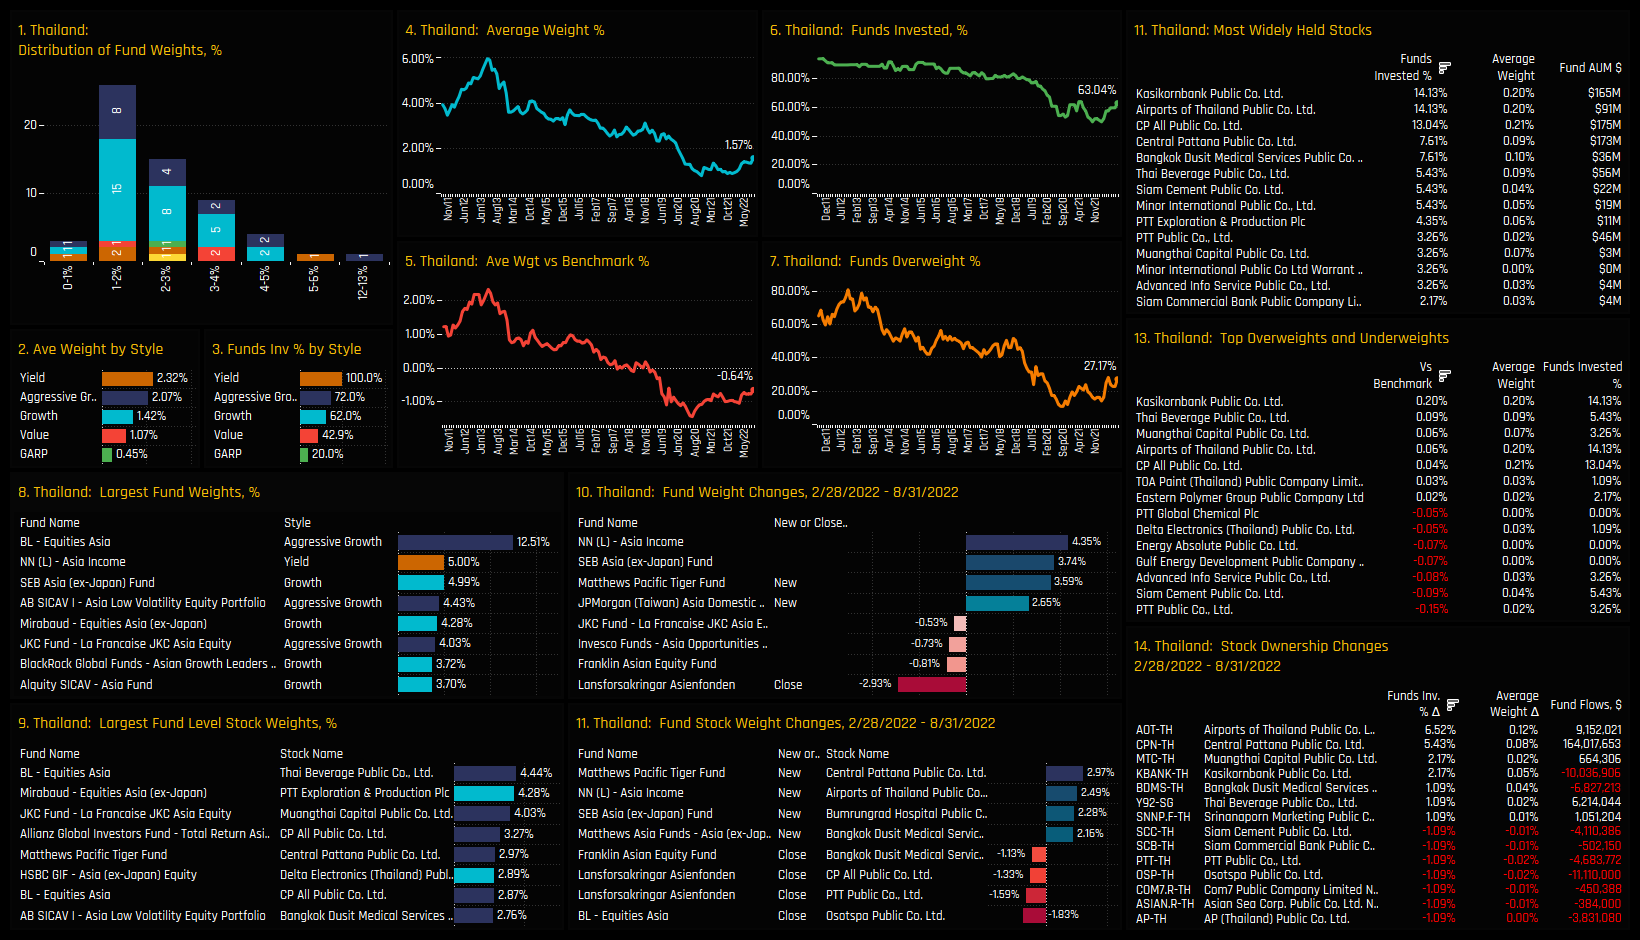
Click on the link below for the latest data report on Thailand positioning among active Asia Ex-Japan funds.

For more analysis, data or information on active investor positioning in your market, please get in touch with me on steven.holden@copleyfundresearch.com