Asia Ex-Japan Fund Positioning Analysis, February 2023
In this issue:
Adani Group of Companies: Actively Uninvestable
Vietnam: Time to Invest?
Indonesian Financials: Consensus Overweight
Asia Ex-Japan's Rising Stars
89 Active Asia Ex-Japan Funds, AUM $55bn
Adani Group of Companies: Actively Uninvestable
Active Asia Ex-Japan investors never warmed to the Adani group of companies.
Active vs Passive Holdings
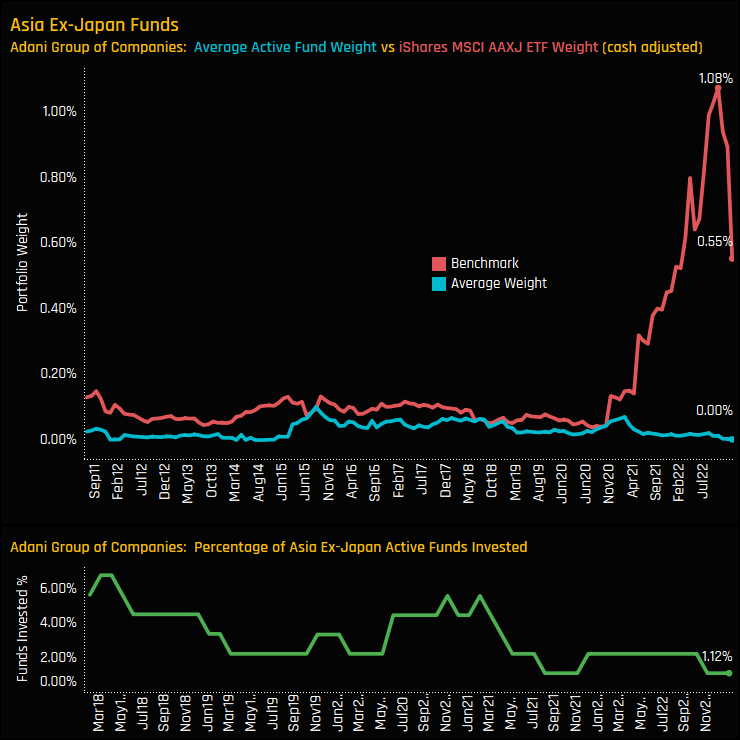
The overwhelming majority of actively managed Asia Ex-Japan equity funds have stayed away from any of the Adani Group of companies, despite their growing prominence in regional benchmarks. The top chart below shows the average weight in the 6 Adani companies among actively managed Asia Ex-Japan equity strategies (blue line) and the weight in the iShares MSCI Asia Ex-Japan AAXJ ETF (red line). The massive price and market cap increases propelled the Adani companies to over a 1% weight in the AAXJ benchmark at the end of 2022. Meanwhile, among the active Asia Ex-Japan funds in our analysis, average holding weights remained negligible. In fact, less than 2% of funds have been invested in any of the Adani companies since 2021 (bottom chart).
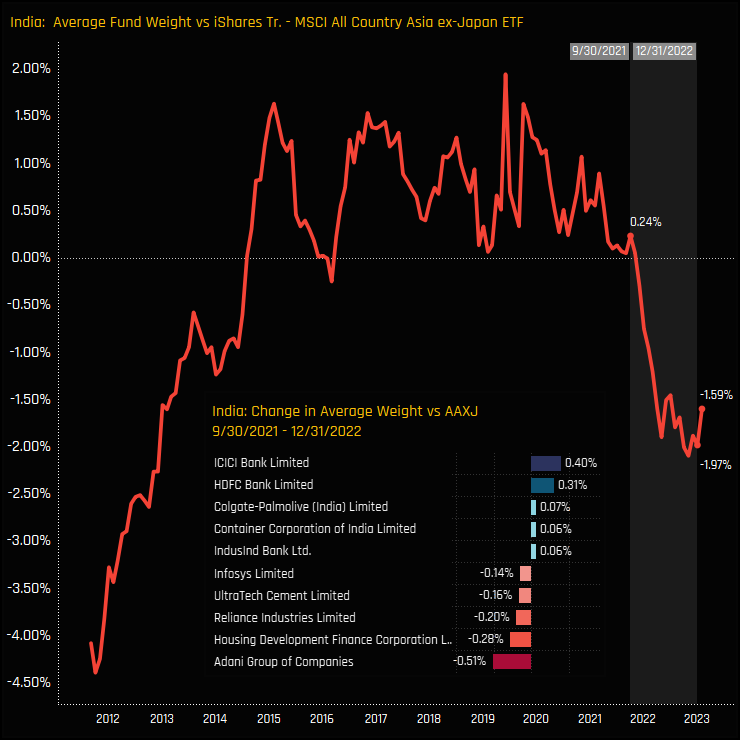
The impact of Adani on the Asia Ex-Japan holdings picture has been significant. Active Asia Ex-Japan investors switched from a net overweight in India to a net underweight from 09/30/2021 onwards. The move from 0.24% overweight to -1.97% underweight at the end of 2022 was driven in part by the increases in benchmark weight among the Adani group of companies. The inset chart below shows the largest changes in average relative stock weights over the period, with the 6 Adani companies accounting for 0.51% of the 2.21% increase in net India underweight.
Adani Attribution and Indian Stocks to Scrutinize
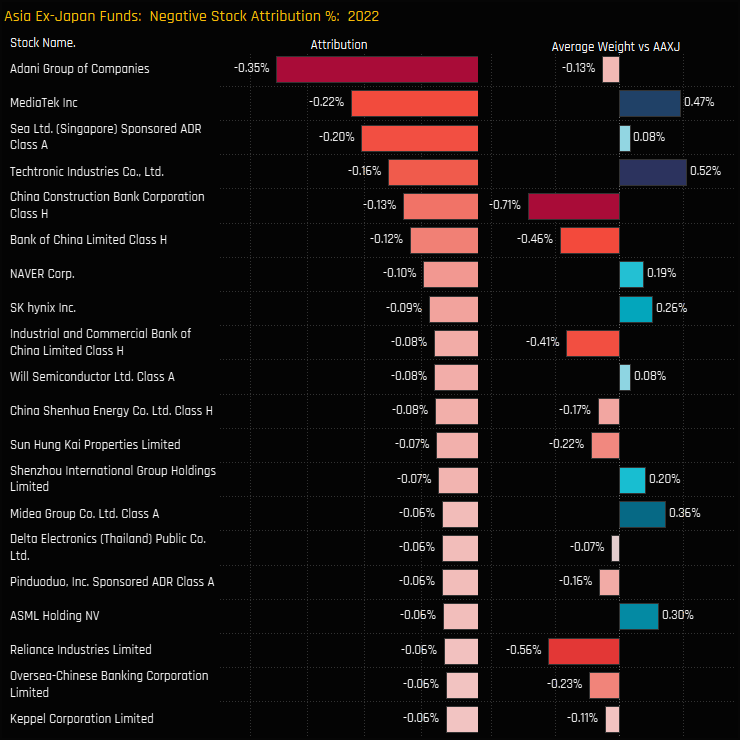
Such was the performance of the Adani companies in 2022, these underweights were the most costly positions relative to benchmark in the Asia Ex-Japan universe. On average, the Adani underweights cost managers -0.35% of underperformance in 2022. For so many fund managers to avoid Adani under these conditions highlights the heavy skepticism towards the investment case.
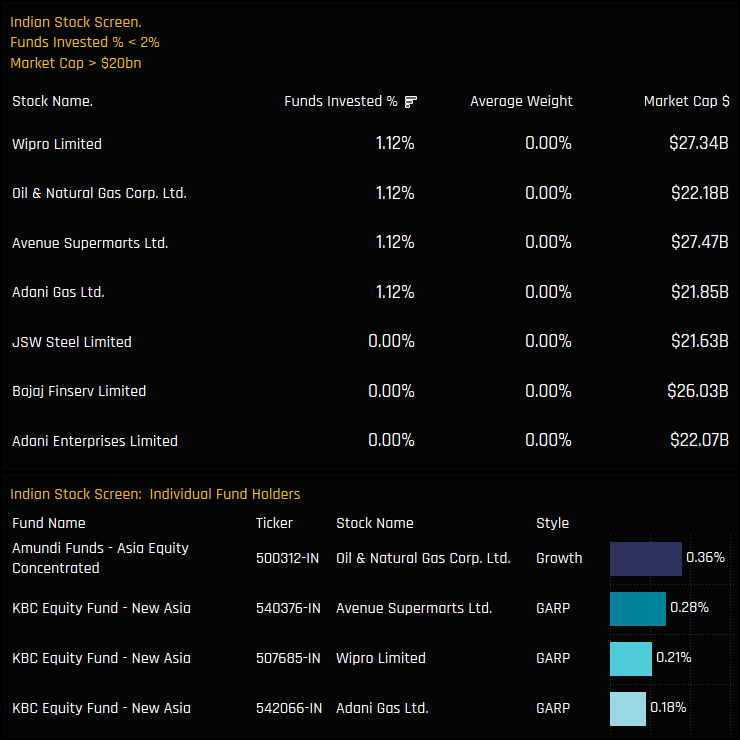
When large divergences occur between active managers and their benchmarks, it usually highlights an issue with that asset in terms of its investability, or, in Adani’s case, something of a red flag. The below stock screen shows Indian companies with market capitalizations above $20bn and held by less than 2% of the funds in our analysis. The list of 7 stocks, 2 of which are in the Adani stable and 3 of which have captured no investment at all, should require additional scrutiny before investing.
89 Active Asia Ex-Japan Funds, AUM $55bn
Vietnam: Time to Invest?
Vietnam is attracting growing interest from Asia Ex-Japan active managers, yet still over two-thirds of funds remain uninvested.
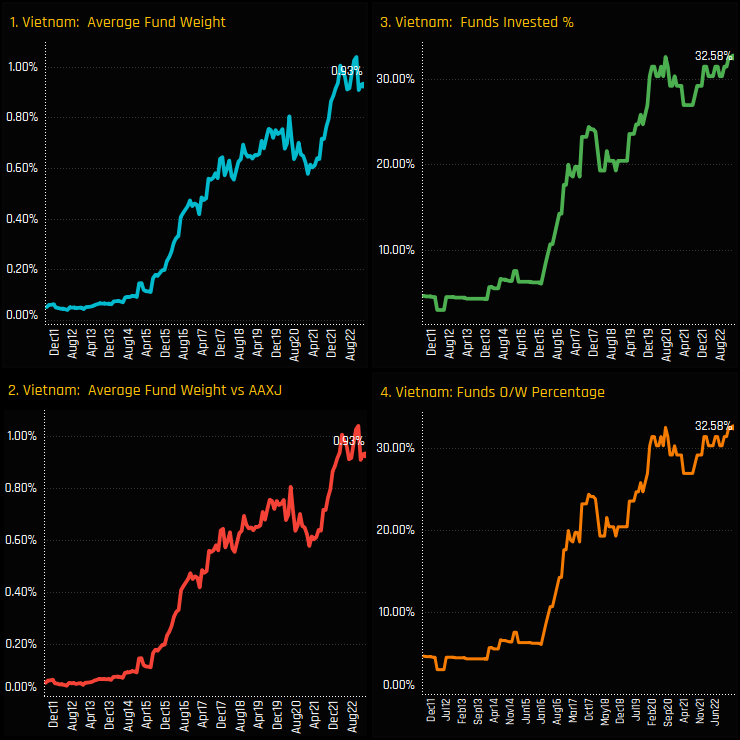
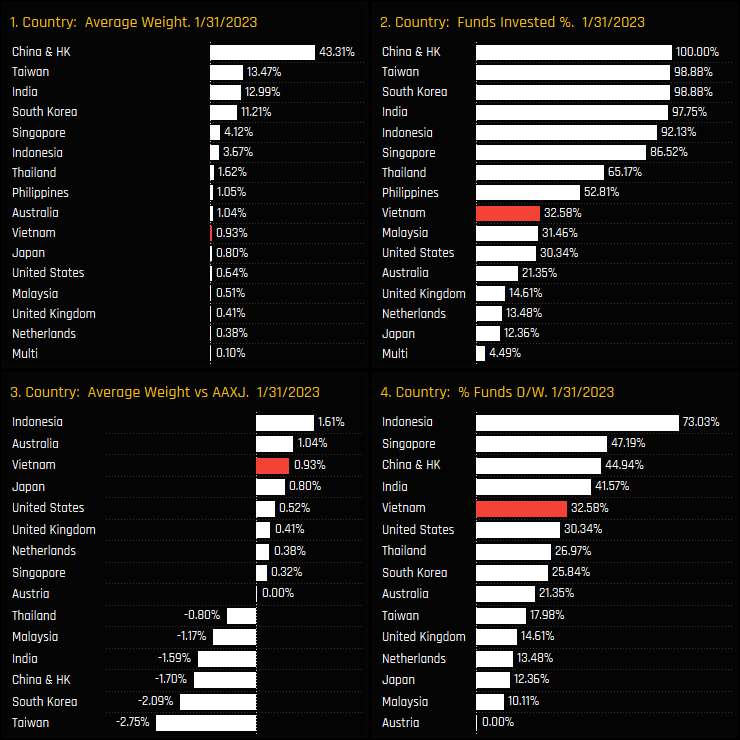
Fund ownership in Vietnam has resumed its upward trajectory after a brief consolidation between mid 2020-2021. The 32.6% of funds invested (ch3) is the highest on record, whilst average weights remain at the higher end of the decade long range (ch1). Being a non benchmark country, relative weights and the percentage of funds overweight mirror the top 2 charts.
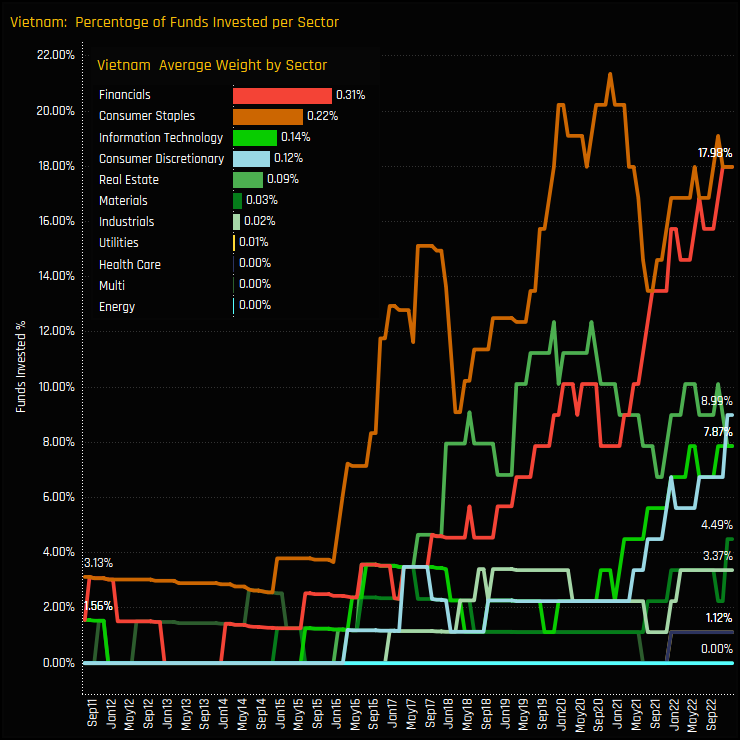
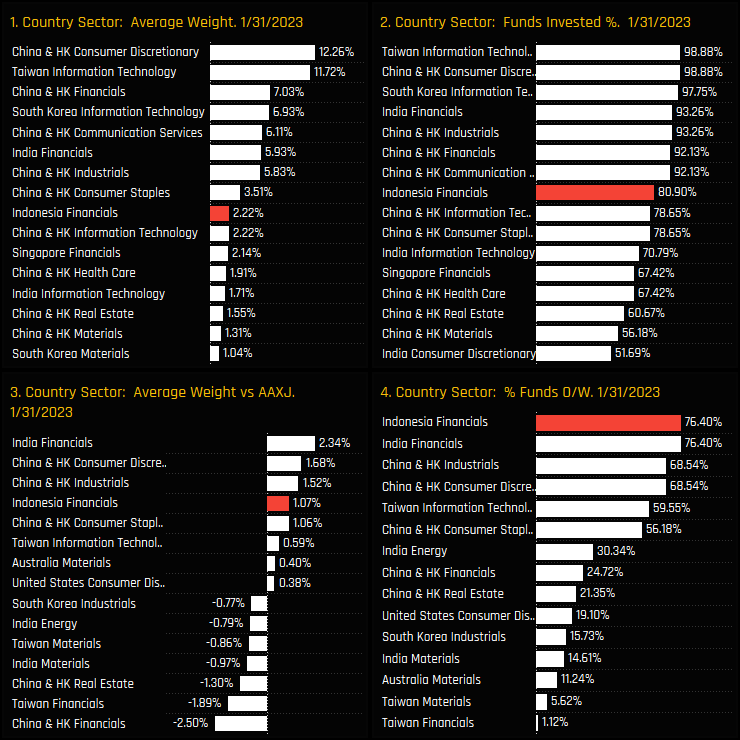
Vietnamese ownership growth has been driven by the Financials sector, which has caught up to the Consumer Staples sector on a percentage of funds invested basis (main chart) and overtaken it on an average weight basis (inset chart). The Technology and Consumer Discretionary sectors are also at peak levels of ownership.
Fund Holdings and Stock Ownership
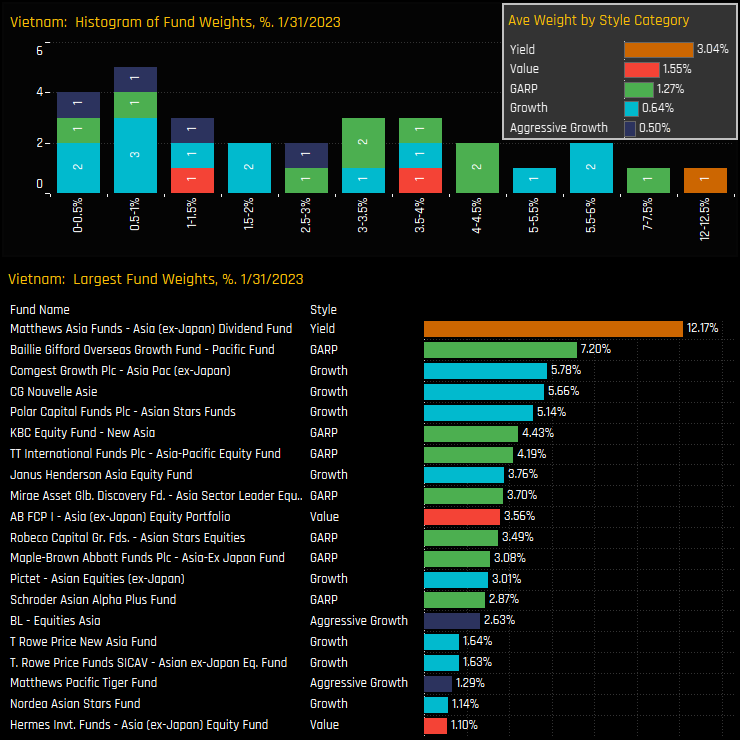
Fund weights in Vietnam are spread over a fairly wide range, led by Matthews Asia Ex-Japan Dividend (12.2%) and Baillie Gifford Pacific (7.2%). GARP investors are the most prevalent among the top holders, accounting for 7 of the largest 15 fund positions.
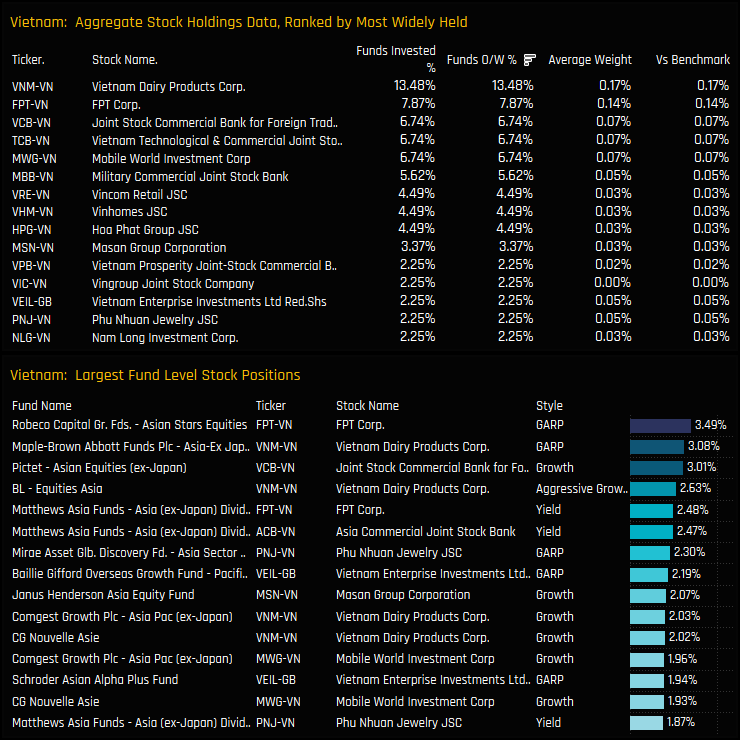
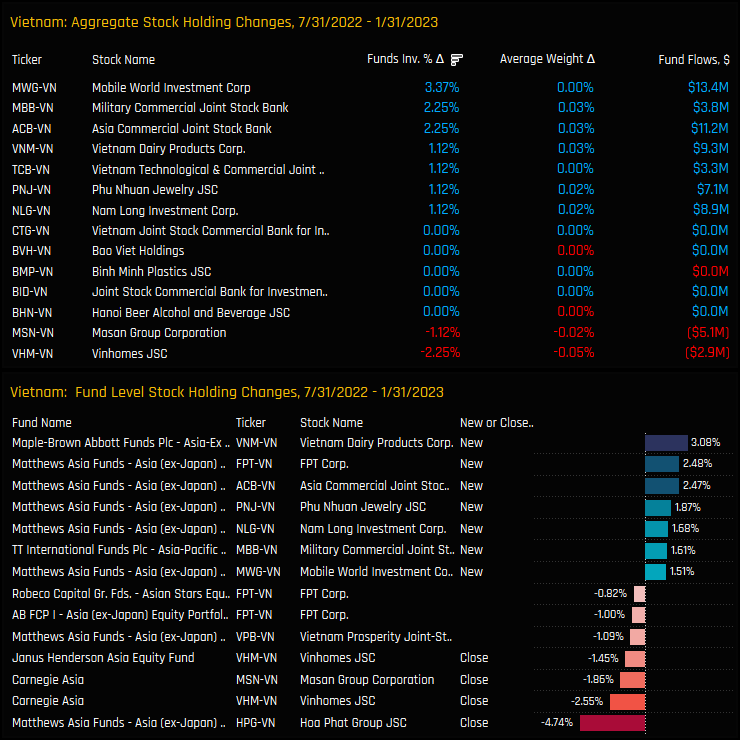
The most widely held stock is Vietnam Dairy Products group, owned by 13.5% of funds at an average weight of 0.17%. FPT Corp leads the 2nd tier, held by fewer funds but capturing good sized individual fund holdings from Robeco Asian Stars (3.49%) and Matthews Asia Asia Ex-Japan (2.48%). In general though, stocks in Vietnam are not widely held.
Stock Activity & Country Positioning
Over the last 6-months, Vietnam stock ownership has started to broaden out. The 3 key beneficiaries of rotation were Mobile World Investment Corp, Military Commercial Joint Stock Bank and Asia Commercial Joint Stock Bank. Only 2 stocks saw ownership levels fall, with 2.25% of managers closing exposure to Vinhomes and -1.12% to Mason Group Corporation.
Vietnam remains a relative minnow on an absolute basis, but stands out relative to benchmark as the 3rd largest net overweight behind Australia and Indonesia (ch3). With such high conviction among a number of highly regarded funds in the region, it’s perhaps surprising that over two-thirds of Asia Ex-Japan funds remain un-invested. There is a lot of room for ownership to grow from here.
Conclusion and Links
For more data and analysis on positioning in Vietnam among active Asia Ex-Japan investors, please click on the link opposite for the latest positioning report.
Over three-quarters of Asia Ex-Japan managers are overweight Indonesian Financials stocks.
Stock Activity & Country Positioning
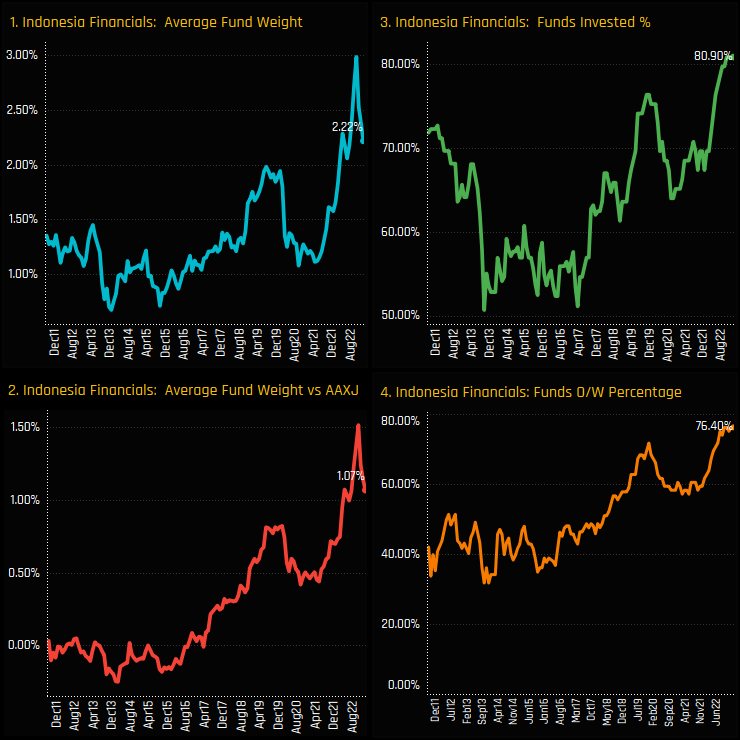
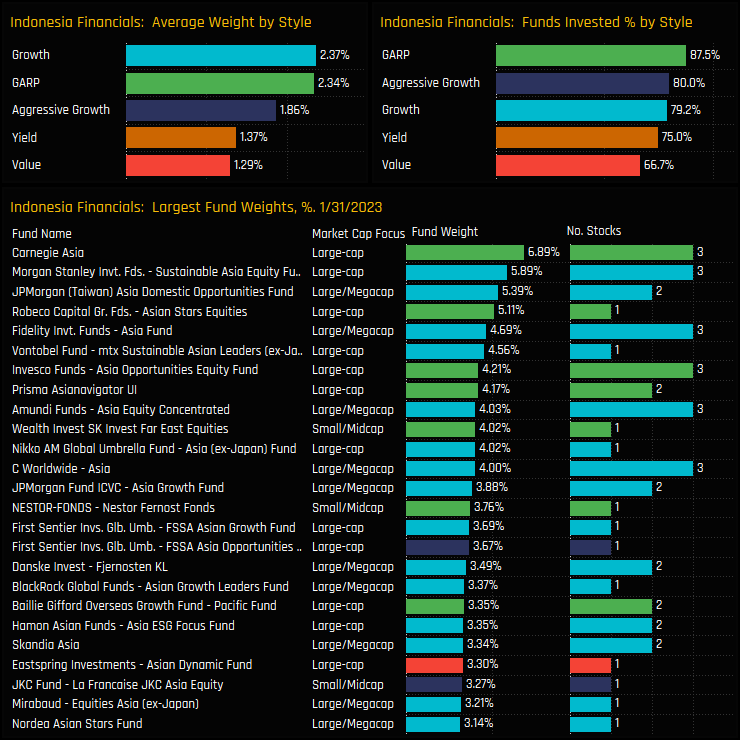
Fund ownership in Indonesian Financials has soared to new highs. A record 80.9% of the Asia Ex-Japan funds in our analysis have exposure, with an all-time high 76.4% overweight the iShares AAXJ ETF. Average weights have dropped from a peak of 3% in late 2022 due to a combination of relative underperformance and a number of funds trimming holdings in to strength.
Compared to Country/Sector peers, Indonesian Financials stand as the 9th largest exposure on an average weight basis and the 8th most widely held. Versus the benchmark, they are the 4th largest overweight, sharing a heavily consensus overweight stance with Indian Financials.
Fund Holdings & Activity
Indonesian Financials are favoured by the Growth and GARP investors in our analysis, though the small number of Aggressive Growth funds are also well allocated. Fund allocations are centered around the 2.5%-3.5% level, with higher conviction holdings led by Carnegie Asia (6.9%) and Morgan Stanley Sustainable Asia (5.9%).
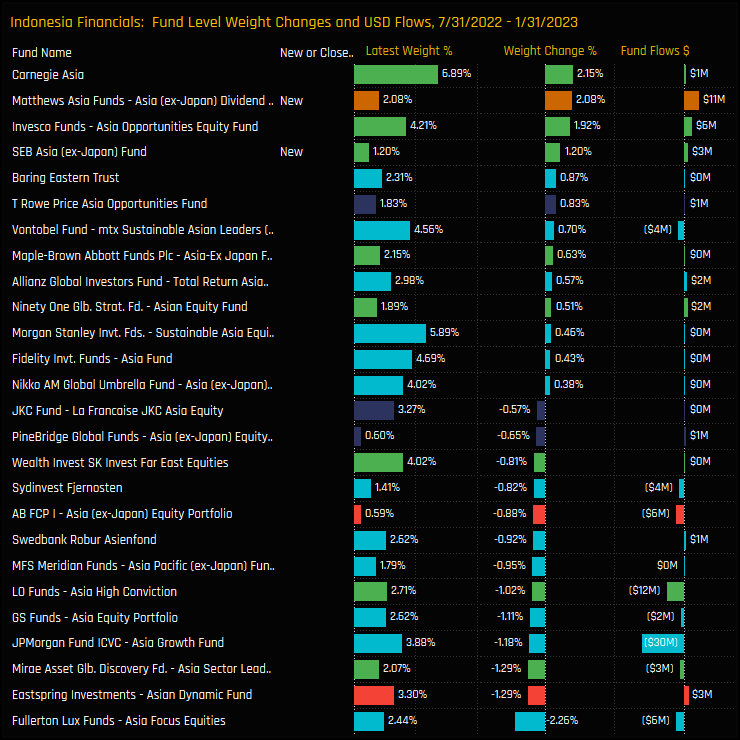
Changes in fund ownership over the last 6-months reflect both a growing ownership base but also a trimming of positions from selected managers. Matthews Asia Dividend and SEB Asia added new exposure, whilst Fullerton and JP Morgan were among those scaling back allocations. The majority of funds that reduced weights remain overweight the benchmark.
Stock Holdings & Activity
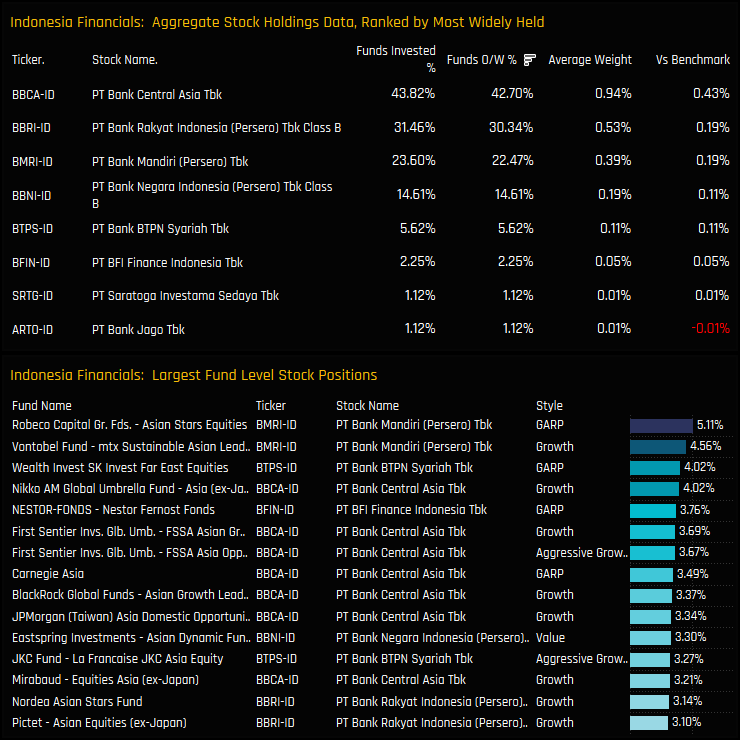
Of the 8 stock holdings in the sector, Bank Central Asia is by far the most widely held, though Bank Rakyat and Bank Mandiri are well represented. All 3 are held net overweight versus the benchmark, with high conviction positions led by Robeco Asian Stars and Vontobel mtx Sustainable in Bank Mandiri.
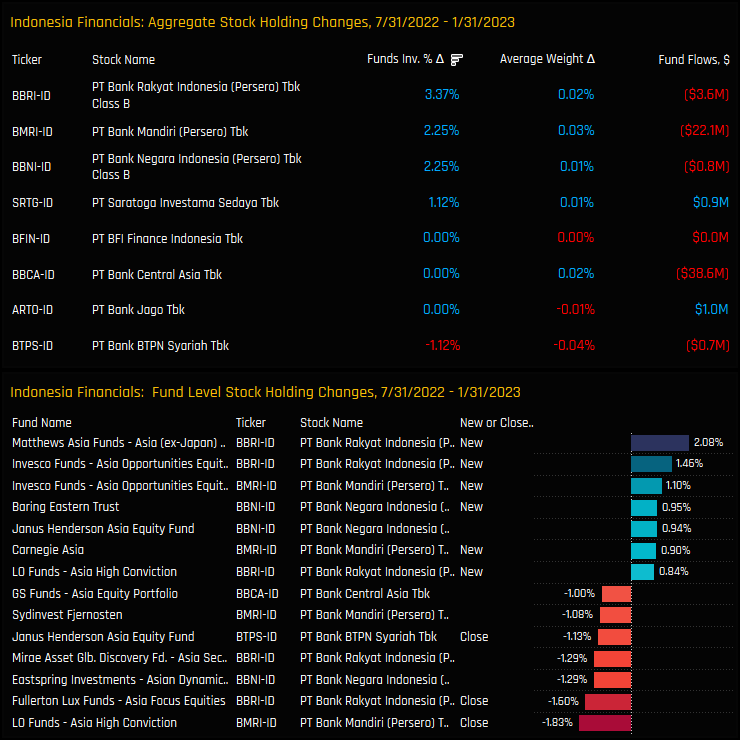
Stock rotation has favoured the 2nd tier names over the last 6-months, with rising ownership seen in Bank Rakyat, Bank Mandiri and Bank Negera. All three stocks dominate the list of new positions too, with Matthews, Invesco and Barings adding to positions over the period.
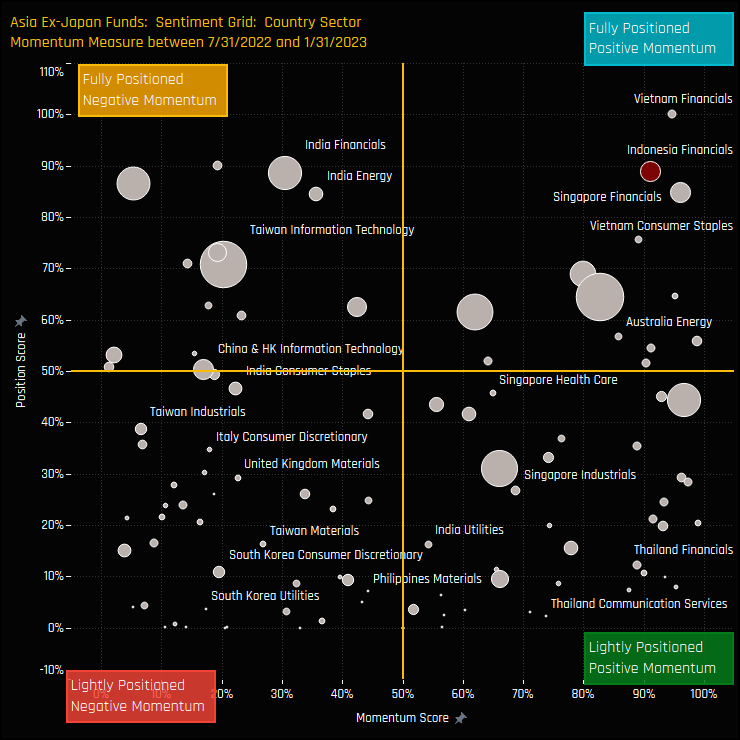
Sentiment & Conclusions
Indonesian Financials join Vietnam Financials and Singapore Financials in the far top-right quadrant of our Sentiment Grid. This position is indicative of record positioning versus its own history and also strong rotation from managers compared to other country/sectors in the region.
The fact that so many funds are overweight Indonesian Financials does indicate a degree of ‘Crowdedness’ among managers, with all banking on outperformance in the months/years ahead. But given the small average weight in Asia Ex-Japan active portfolios of just 2.22%, the risks on an absolute basis are relatively minimal compared to the mega sectors of China Consumer Discretionary and Taiwan Technology. Perhaps the consensus overweight is a case of benchmark weights being too small for the opportunity that lies ahead.
For more data and analysis on positioning in Vietnam among active Asia Ex-Japan investors, please click on the link opposite for the latest positioning report.
We screen for companies in the Asia Ex-Japan region that are not widely held but are at record levels of ownership among actively managed funds.
Sentiment Analysis
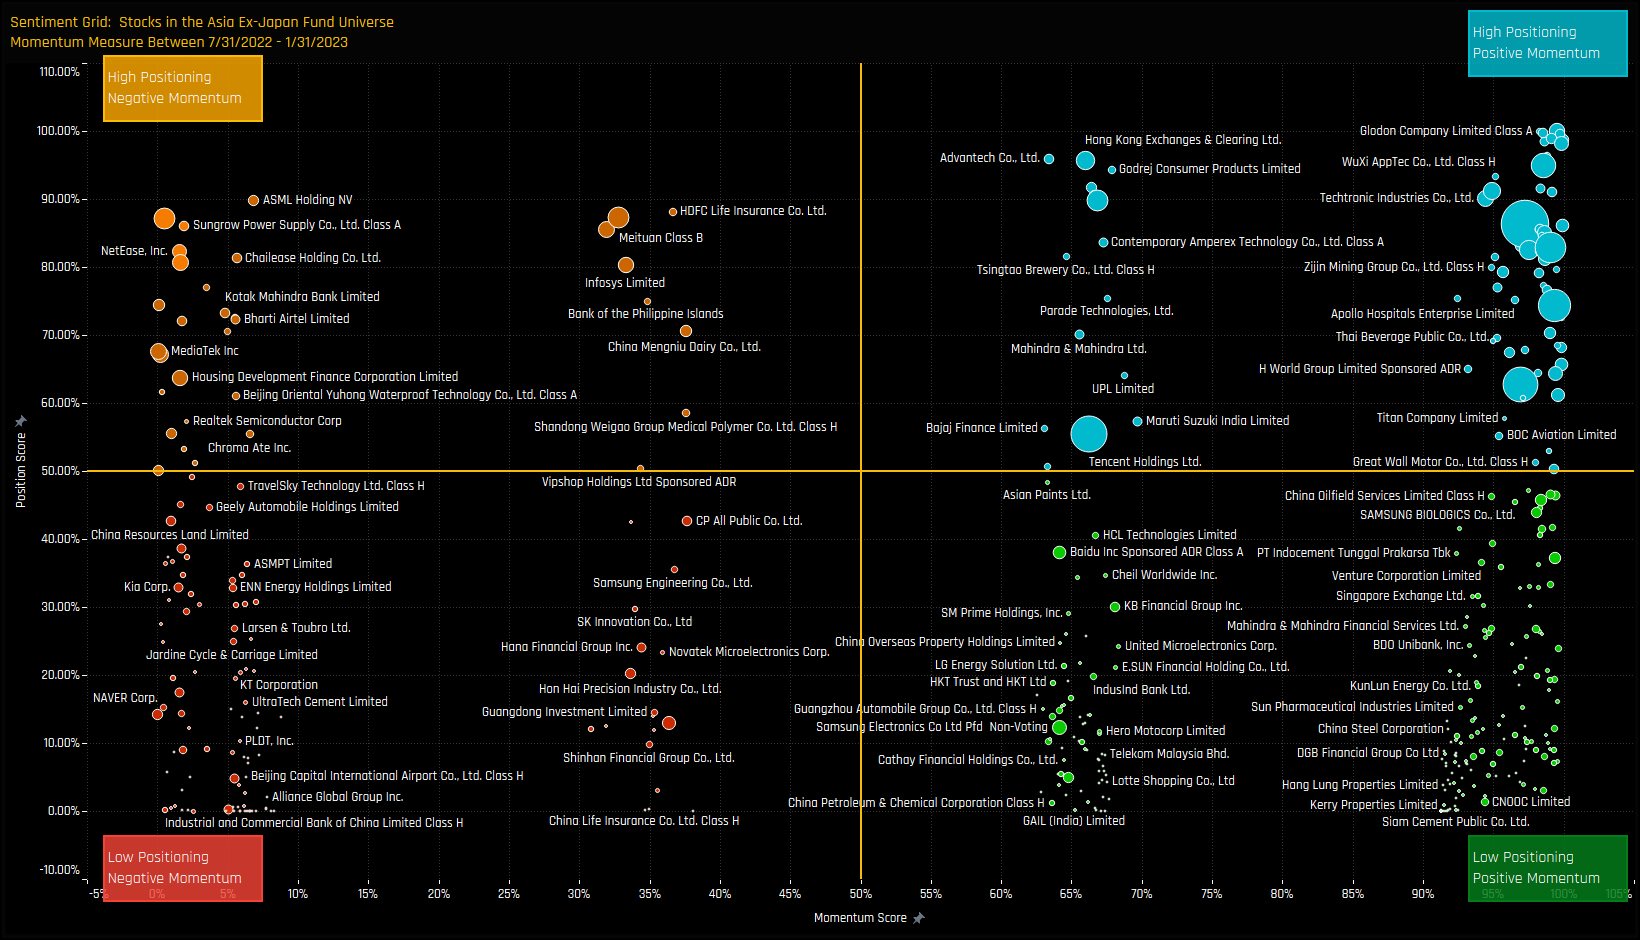
The sentiment grid below shows where current positioning in each stock sits versus its own history going back to 2011 on a scale of 0-100% (y-axis), against a measure of fund activity for each stock between 07/31/2022 and 01/31/2023 (x-axis). The positioning score is based on a stock’s average weight, the percentage of funds who hold that stock and the percentage who are overweight. The momentum score is based on the change in those metrics over the last 6-months.
There is a broad spectrum of positioning and momentum levels among companies. For this analysis, we are interested in the extreme top-right of the grid. Stocks with record levels of positioning after capturing some of the largest increases in ownership over the last 6-months.
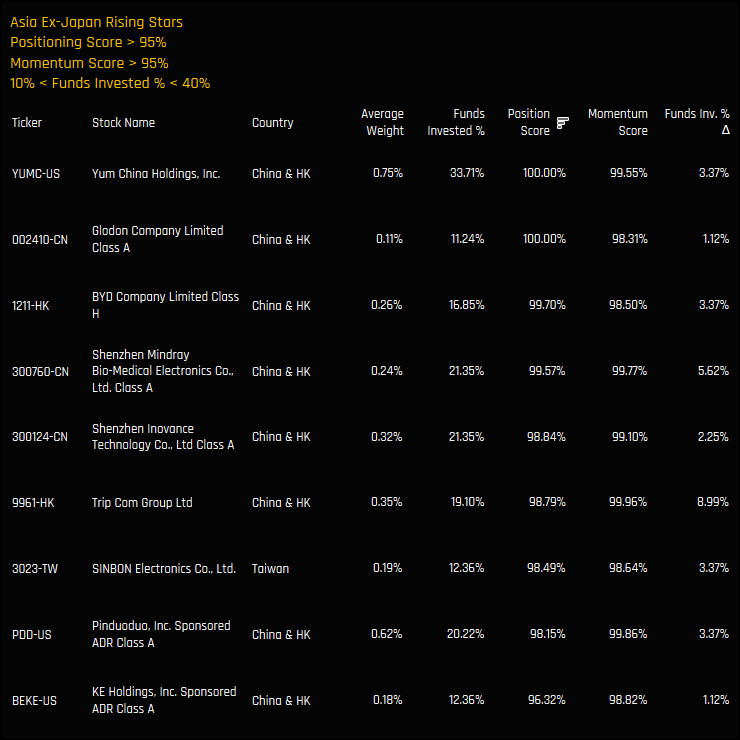
Rising Stars Stocks Screen
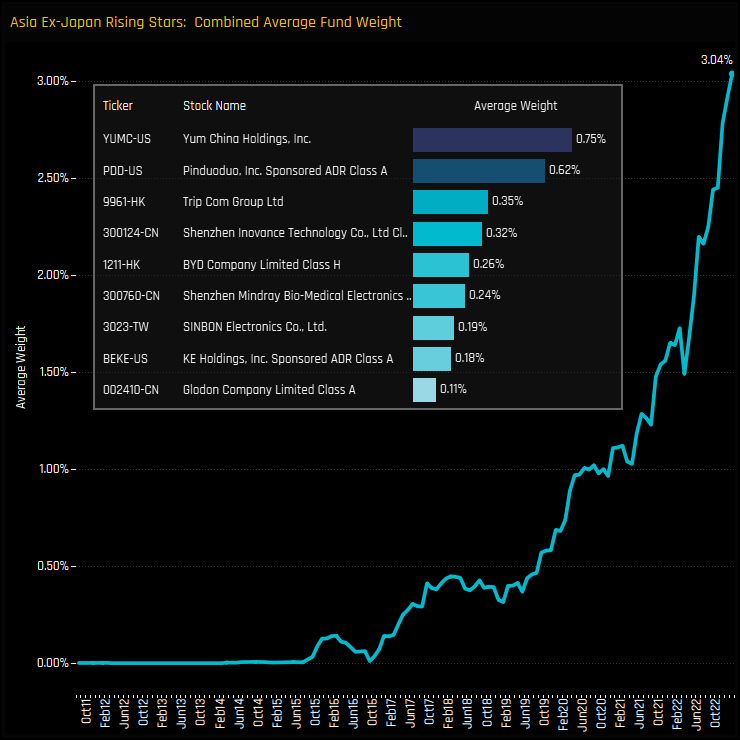
The below table shows stocks with both positioning and momentum scores of above 95%. We also remove stocks that are owned by less than 10% of funds and more than 40% – we want companies that have established an ownership base but are not universally held. 9 companies make the list, headed by Yum China holdings, a stock owned by a record 33.7% of managers and capturing strong ownership growth over the last 6-months.
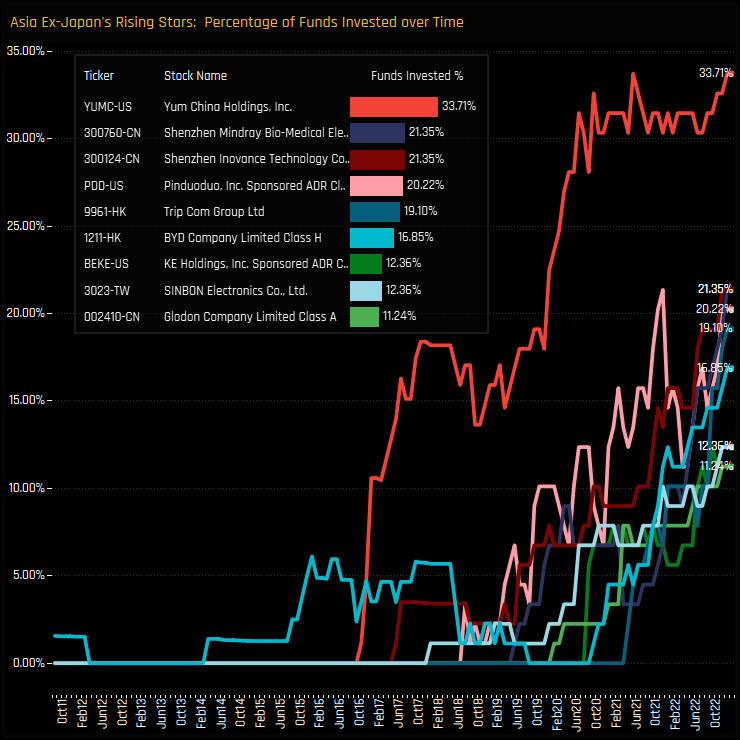
The below chart displays the path of investment growth for each stock over the past decade, with all 9 stocks reaching their highest levels ever at the end of January. Fund ownership in these stocks is still in its infancy, with all companies, excluding Yum China, initiating their growth phase post-2019. In addition, most are still not widely held, with less than 25% of funds invested in 8 of the 9 companies.
Record Weights & Fund Reports
On an average fund weight basis, these 9 stocks have accelerated to a combined record weight of 3.04% as at the end of last month. The rate of increase has been remarkable, with average weights doubling since the end of March 2022. And whilst its not unreasonable to expect a pull-back after such a meteoric rise, remember that a) these stocks are still not widely owned and b) the combined weight of the largest 9 companies in the Asia Ex-Japan universe currently stands at 28.1%. Maybe there is room for further rotation. Click below for fund reports on all 9 stocks.
For more analysis, data or information on active investor positioning in your market, please get in touch with me on steven.holden@copleyfundresearch.com


