15 January
Asia
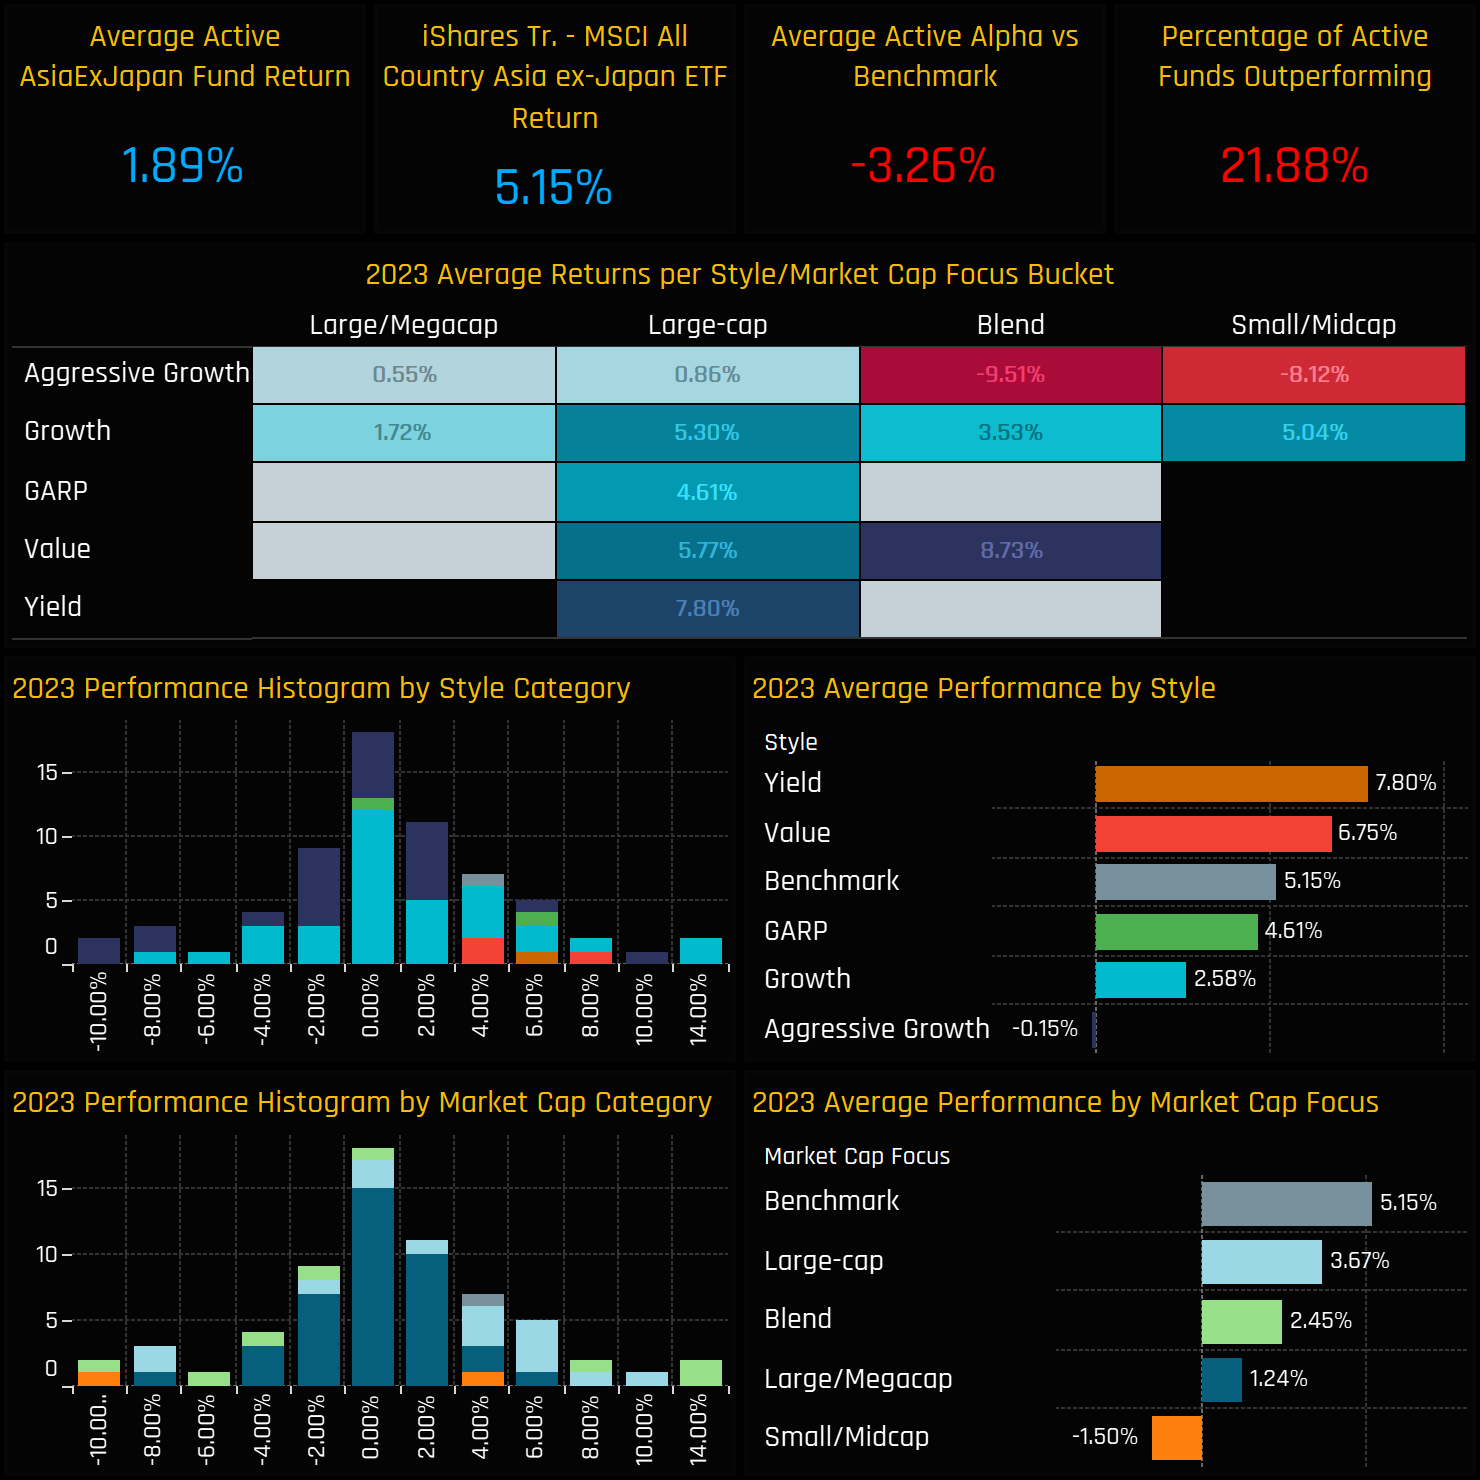
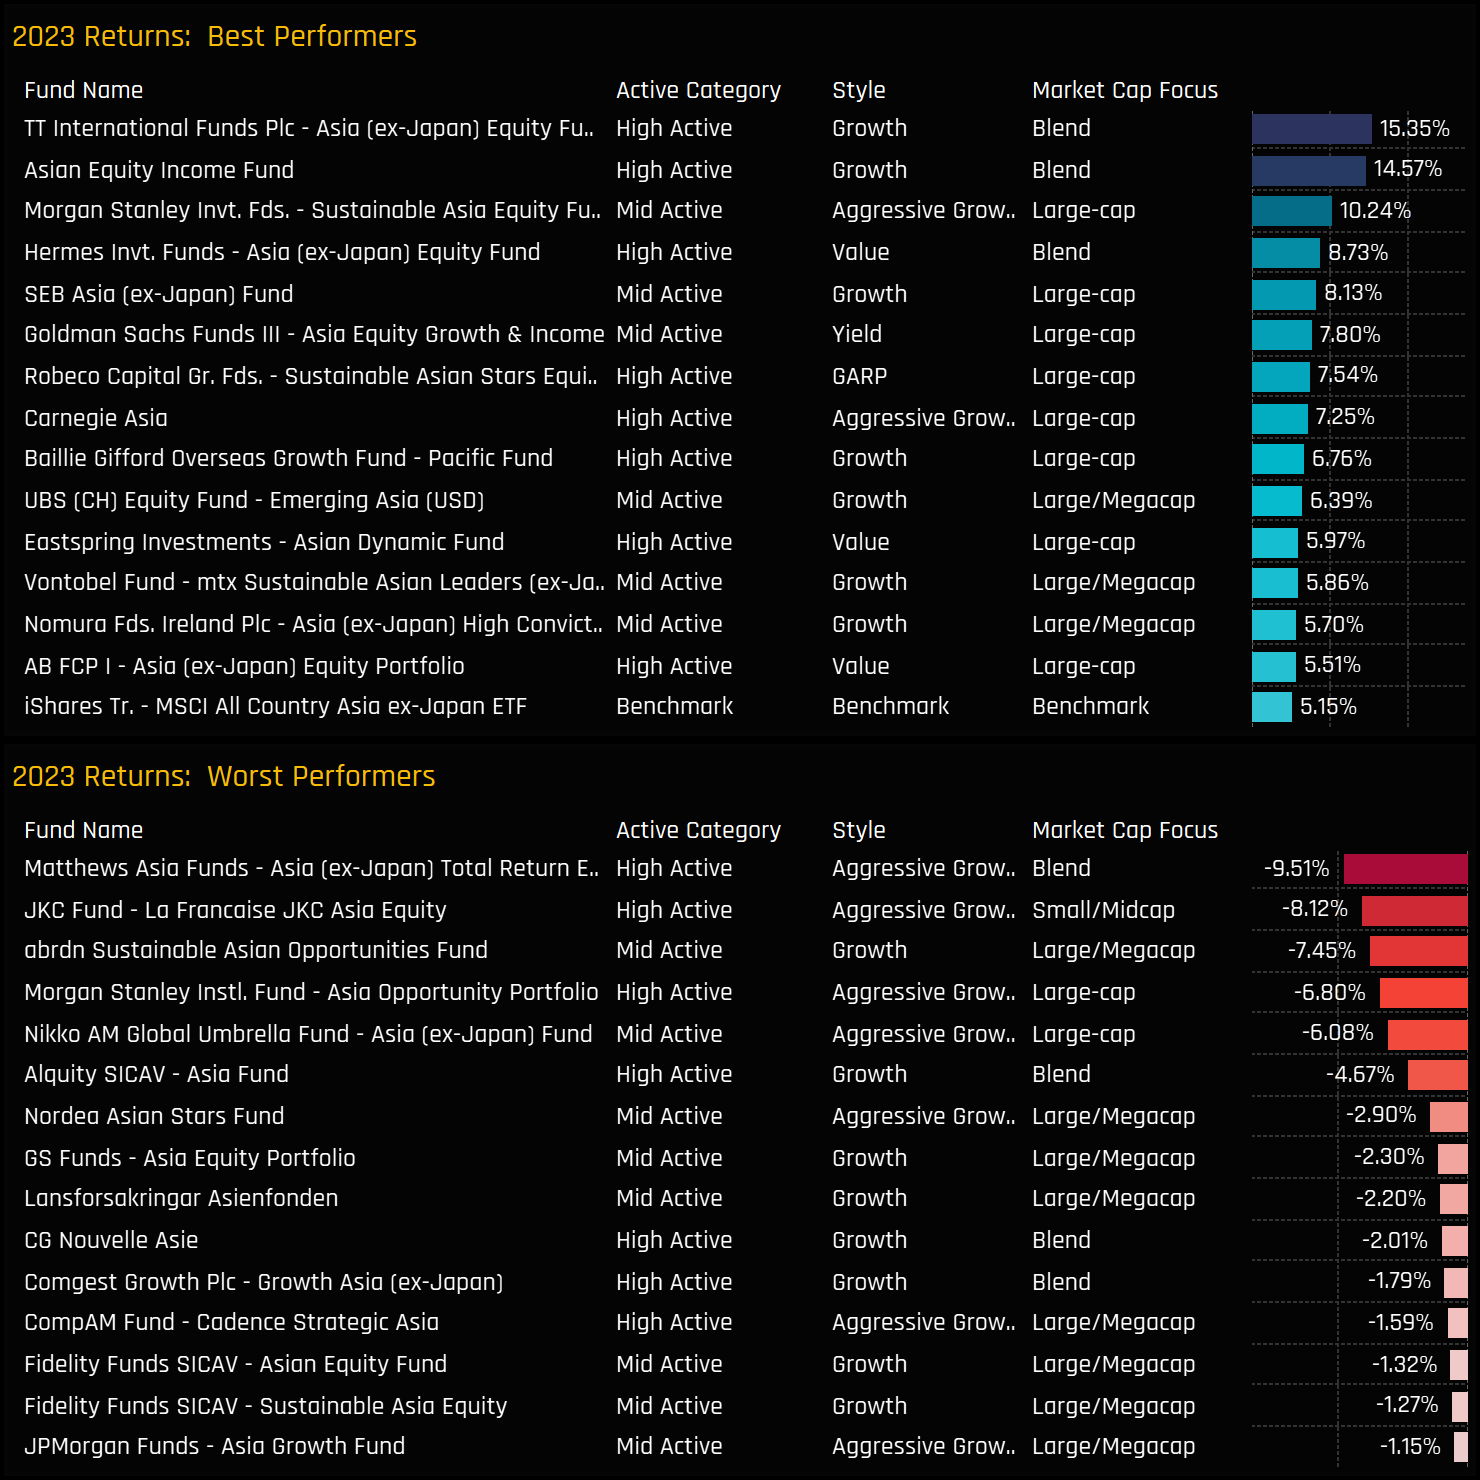
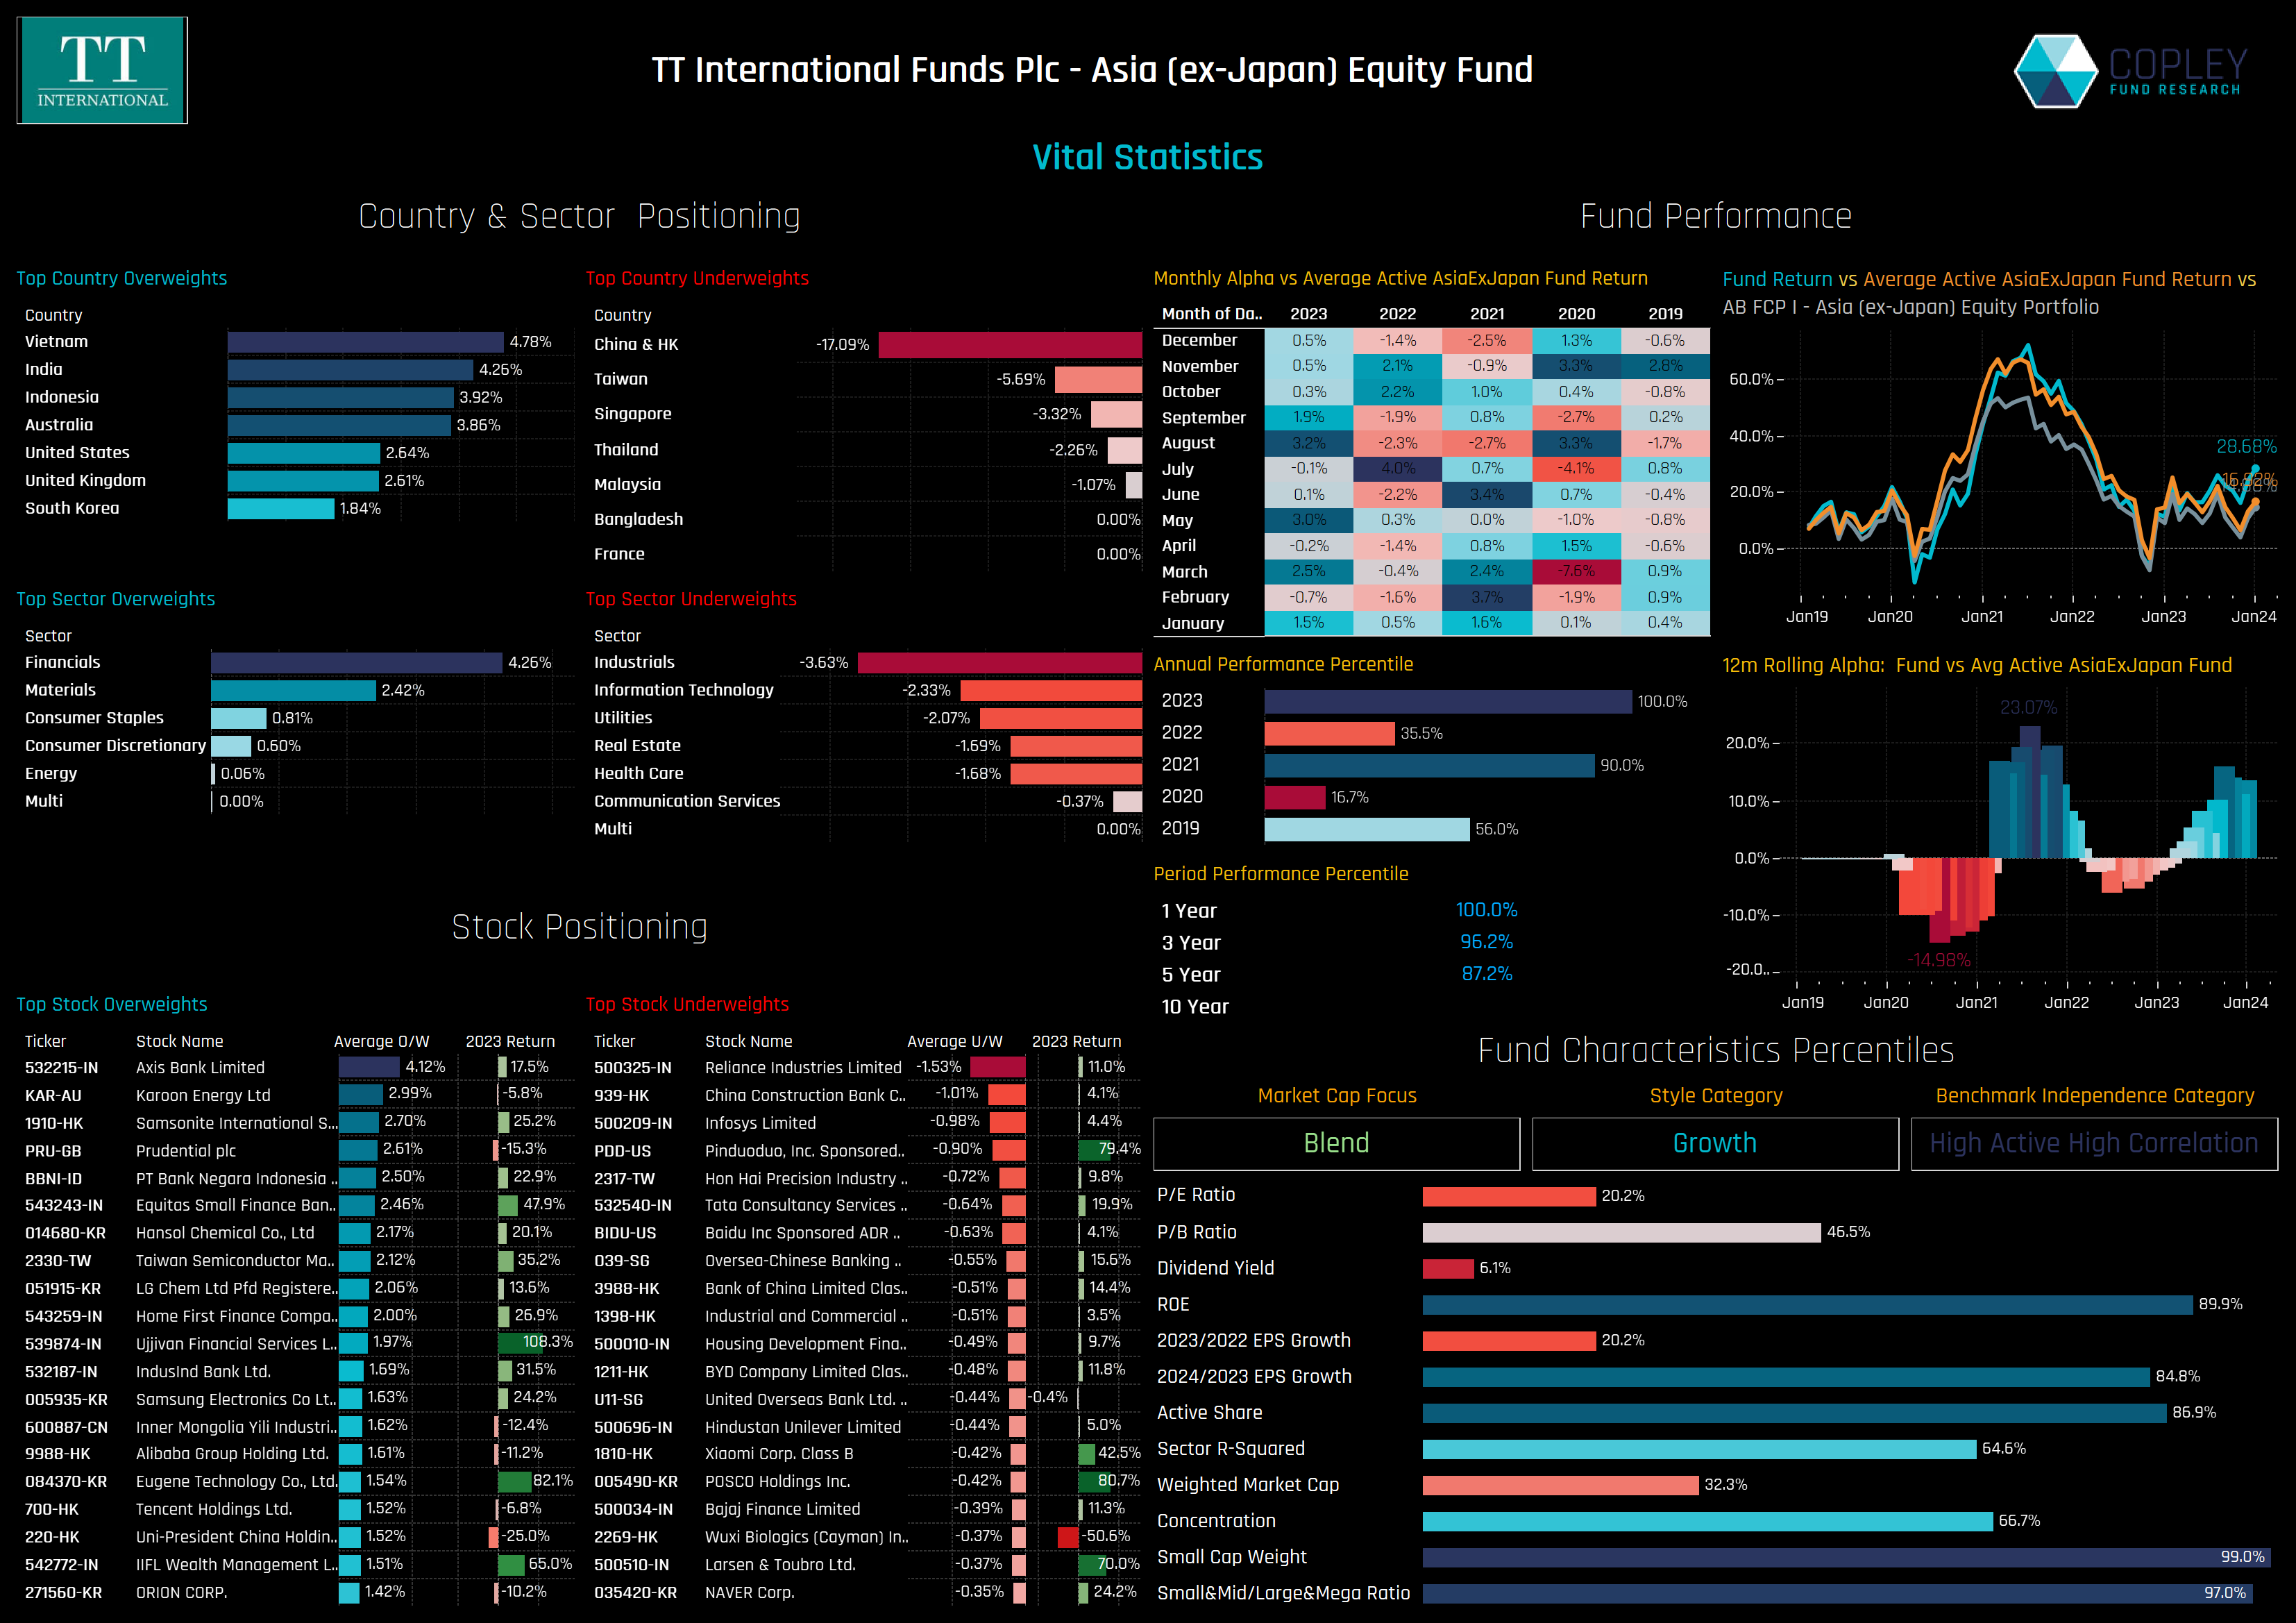
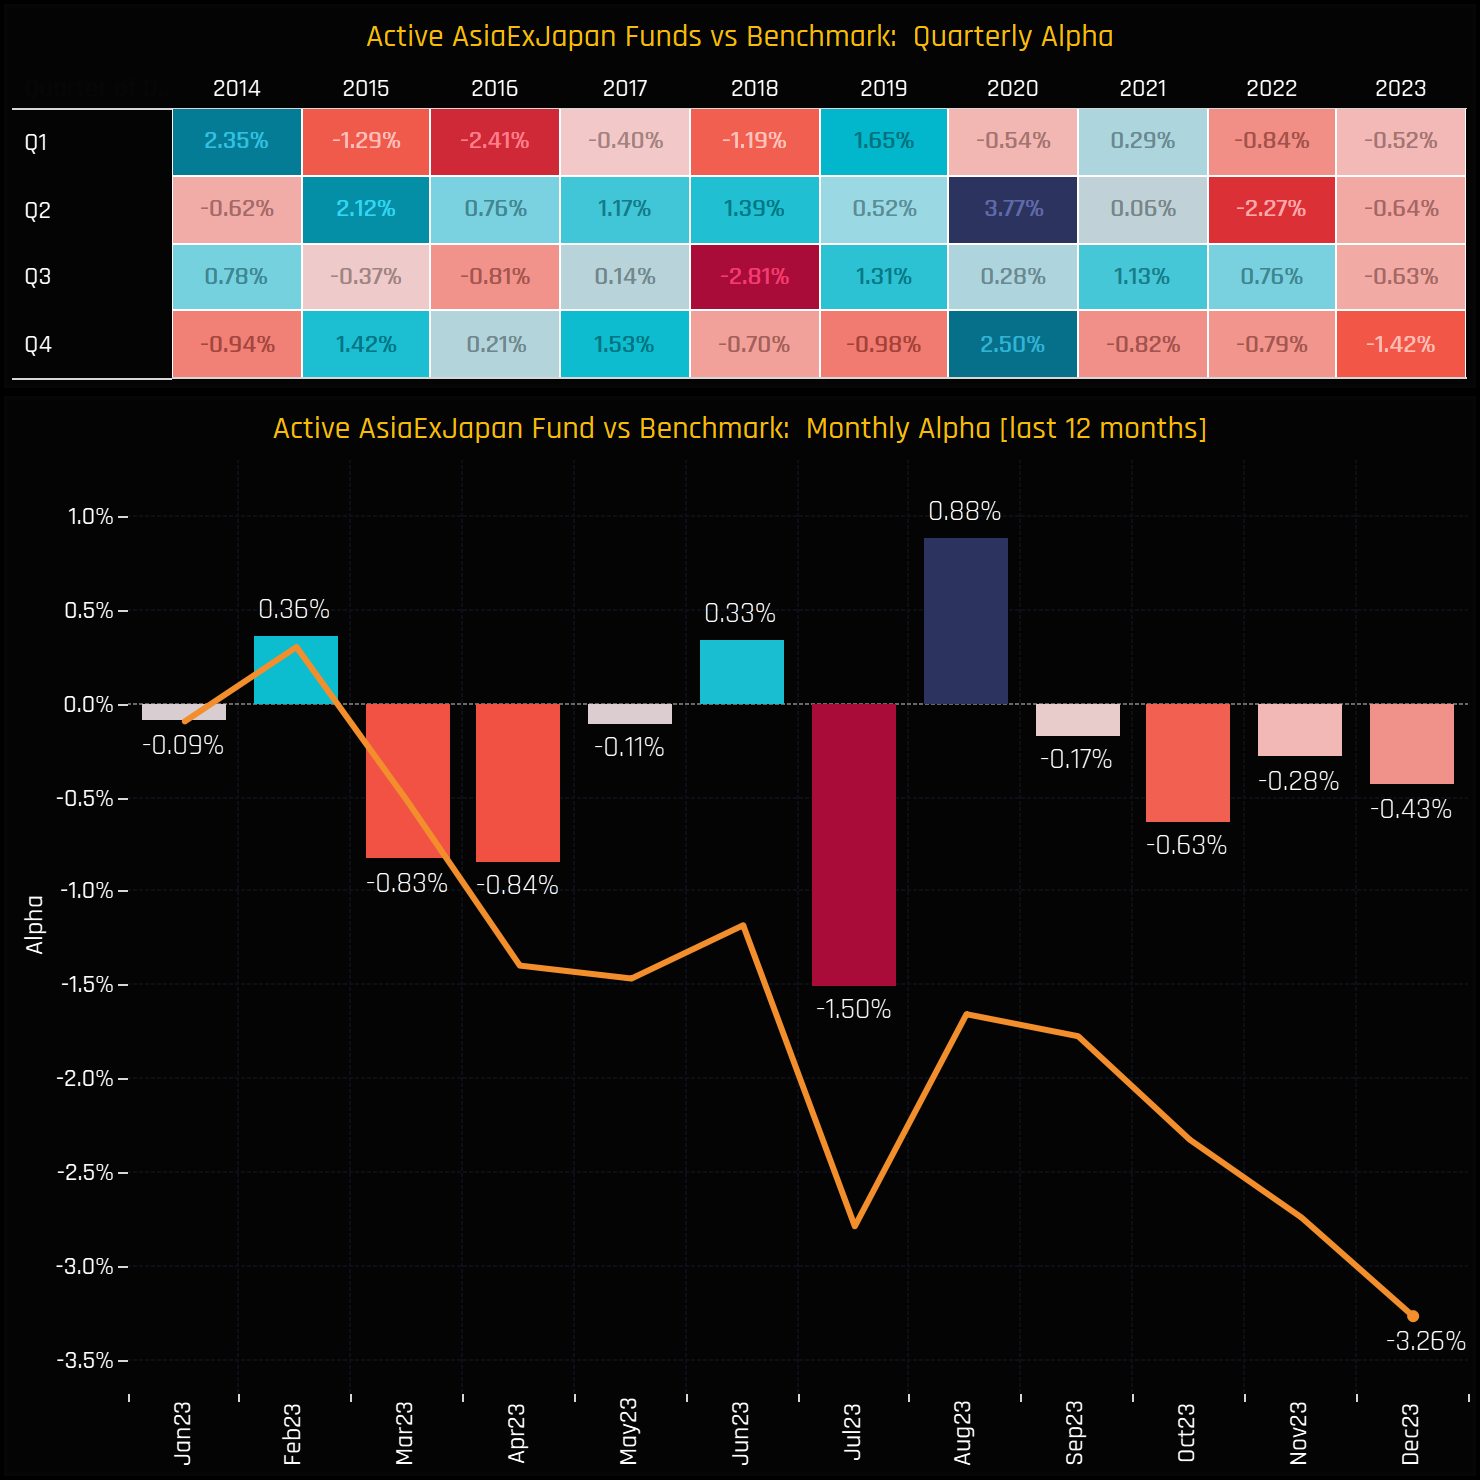
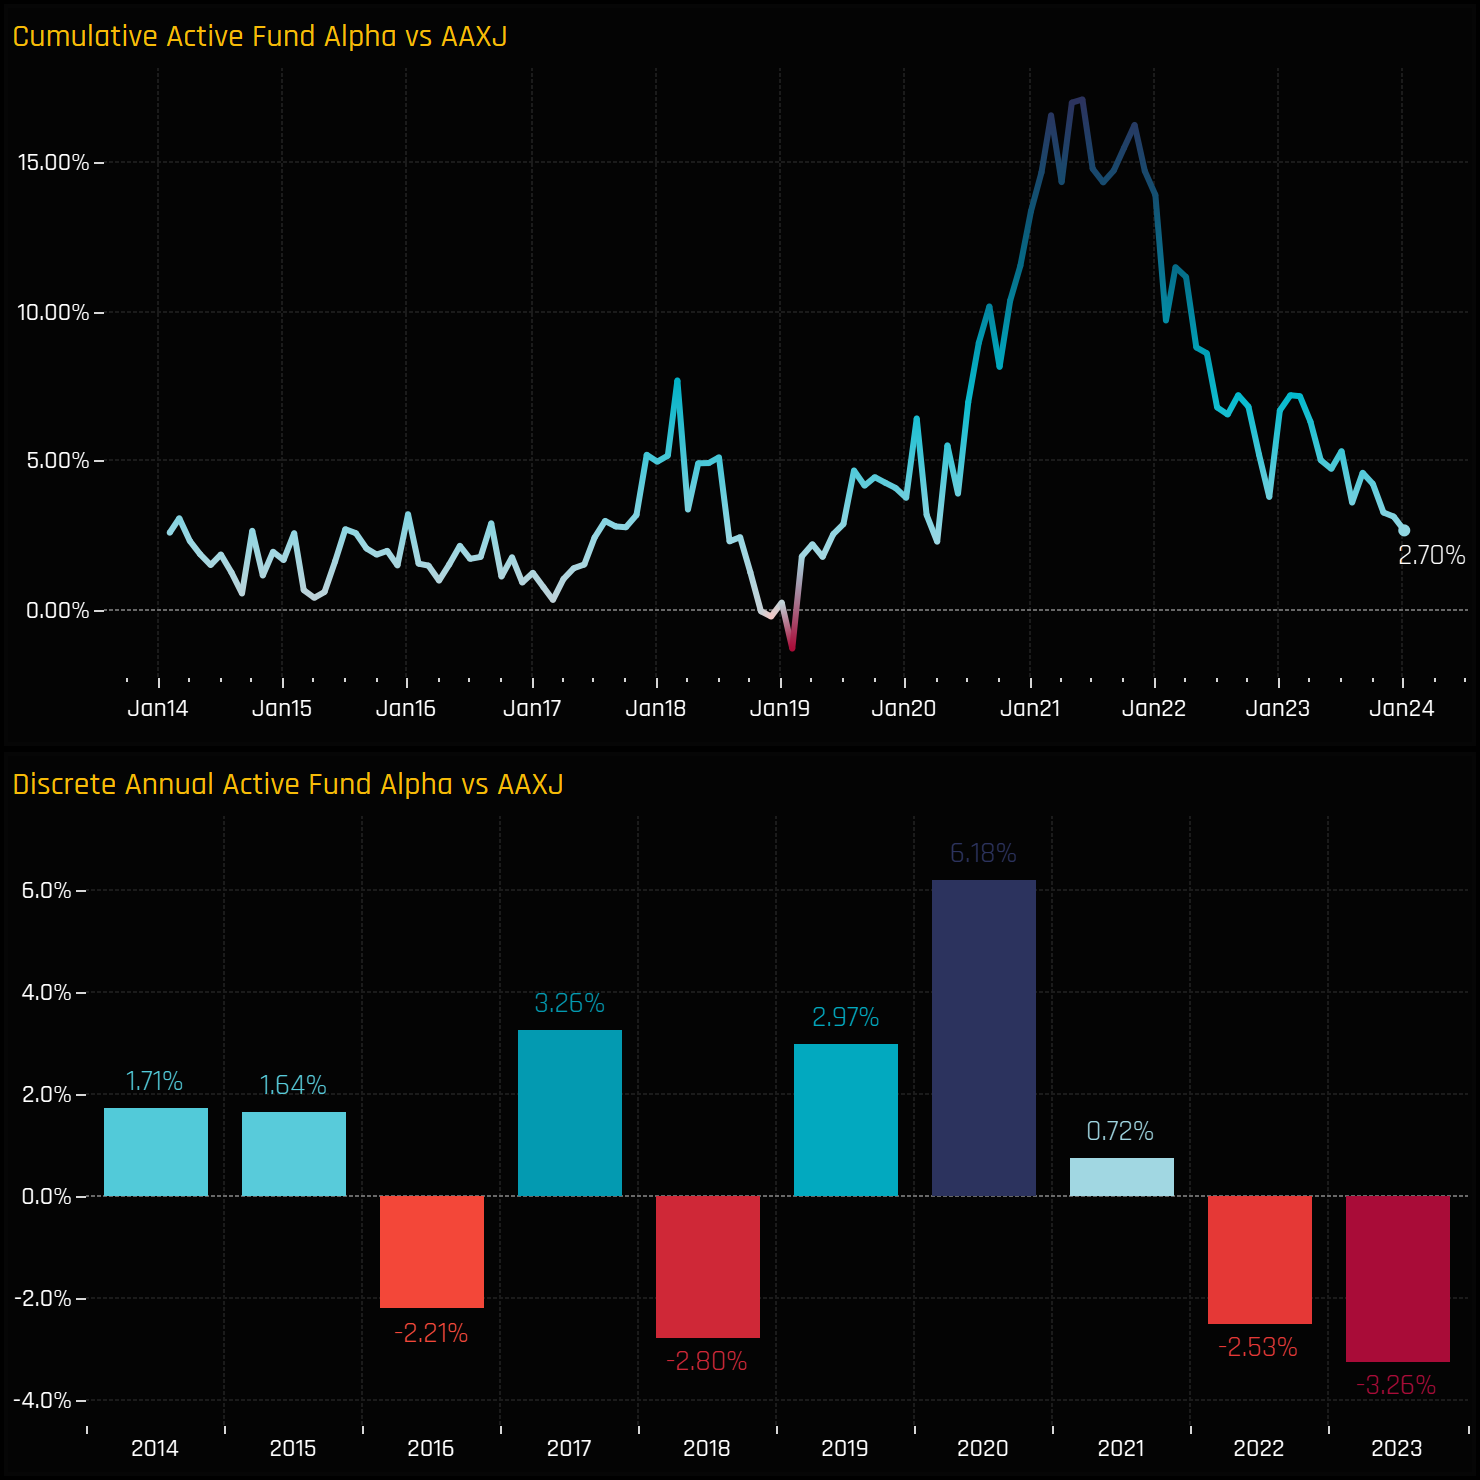
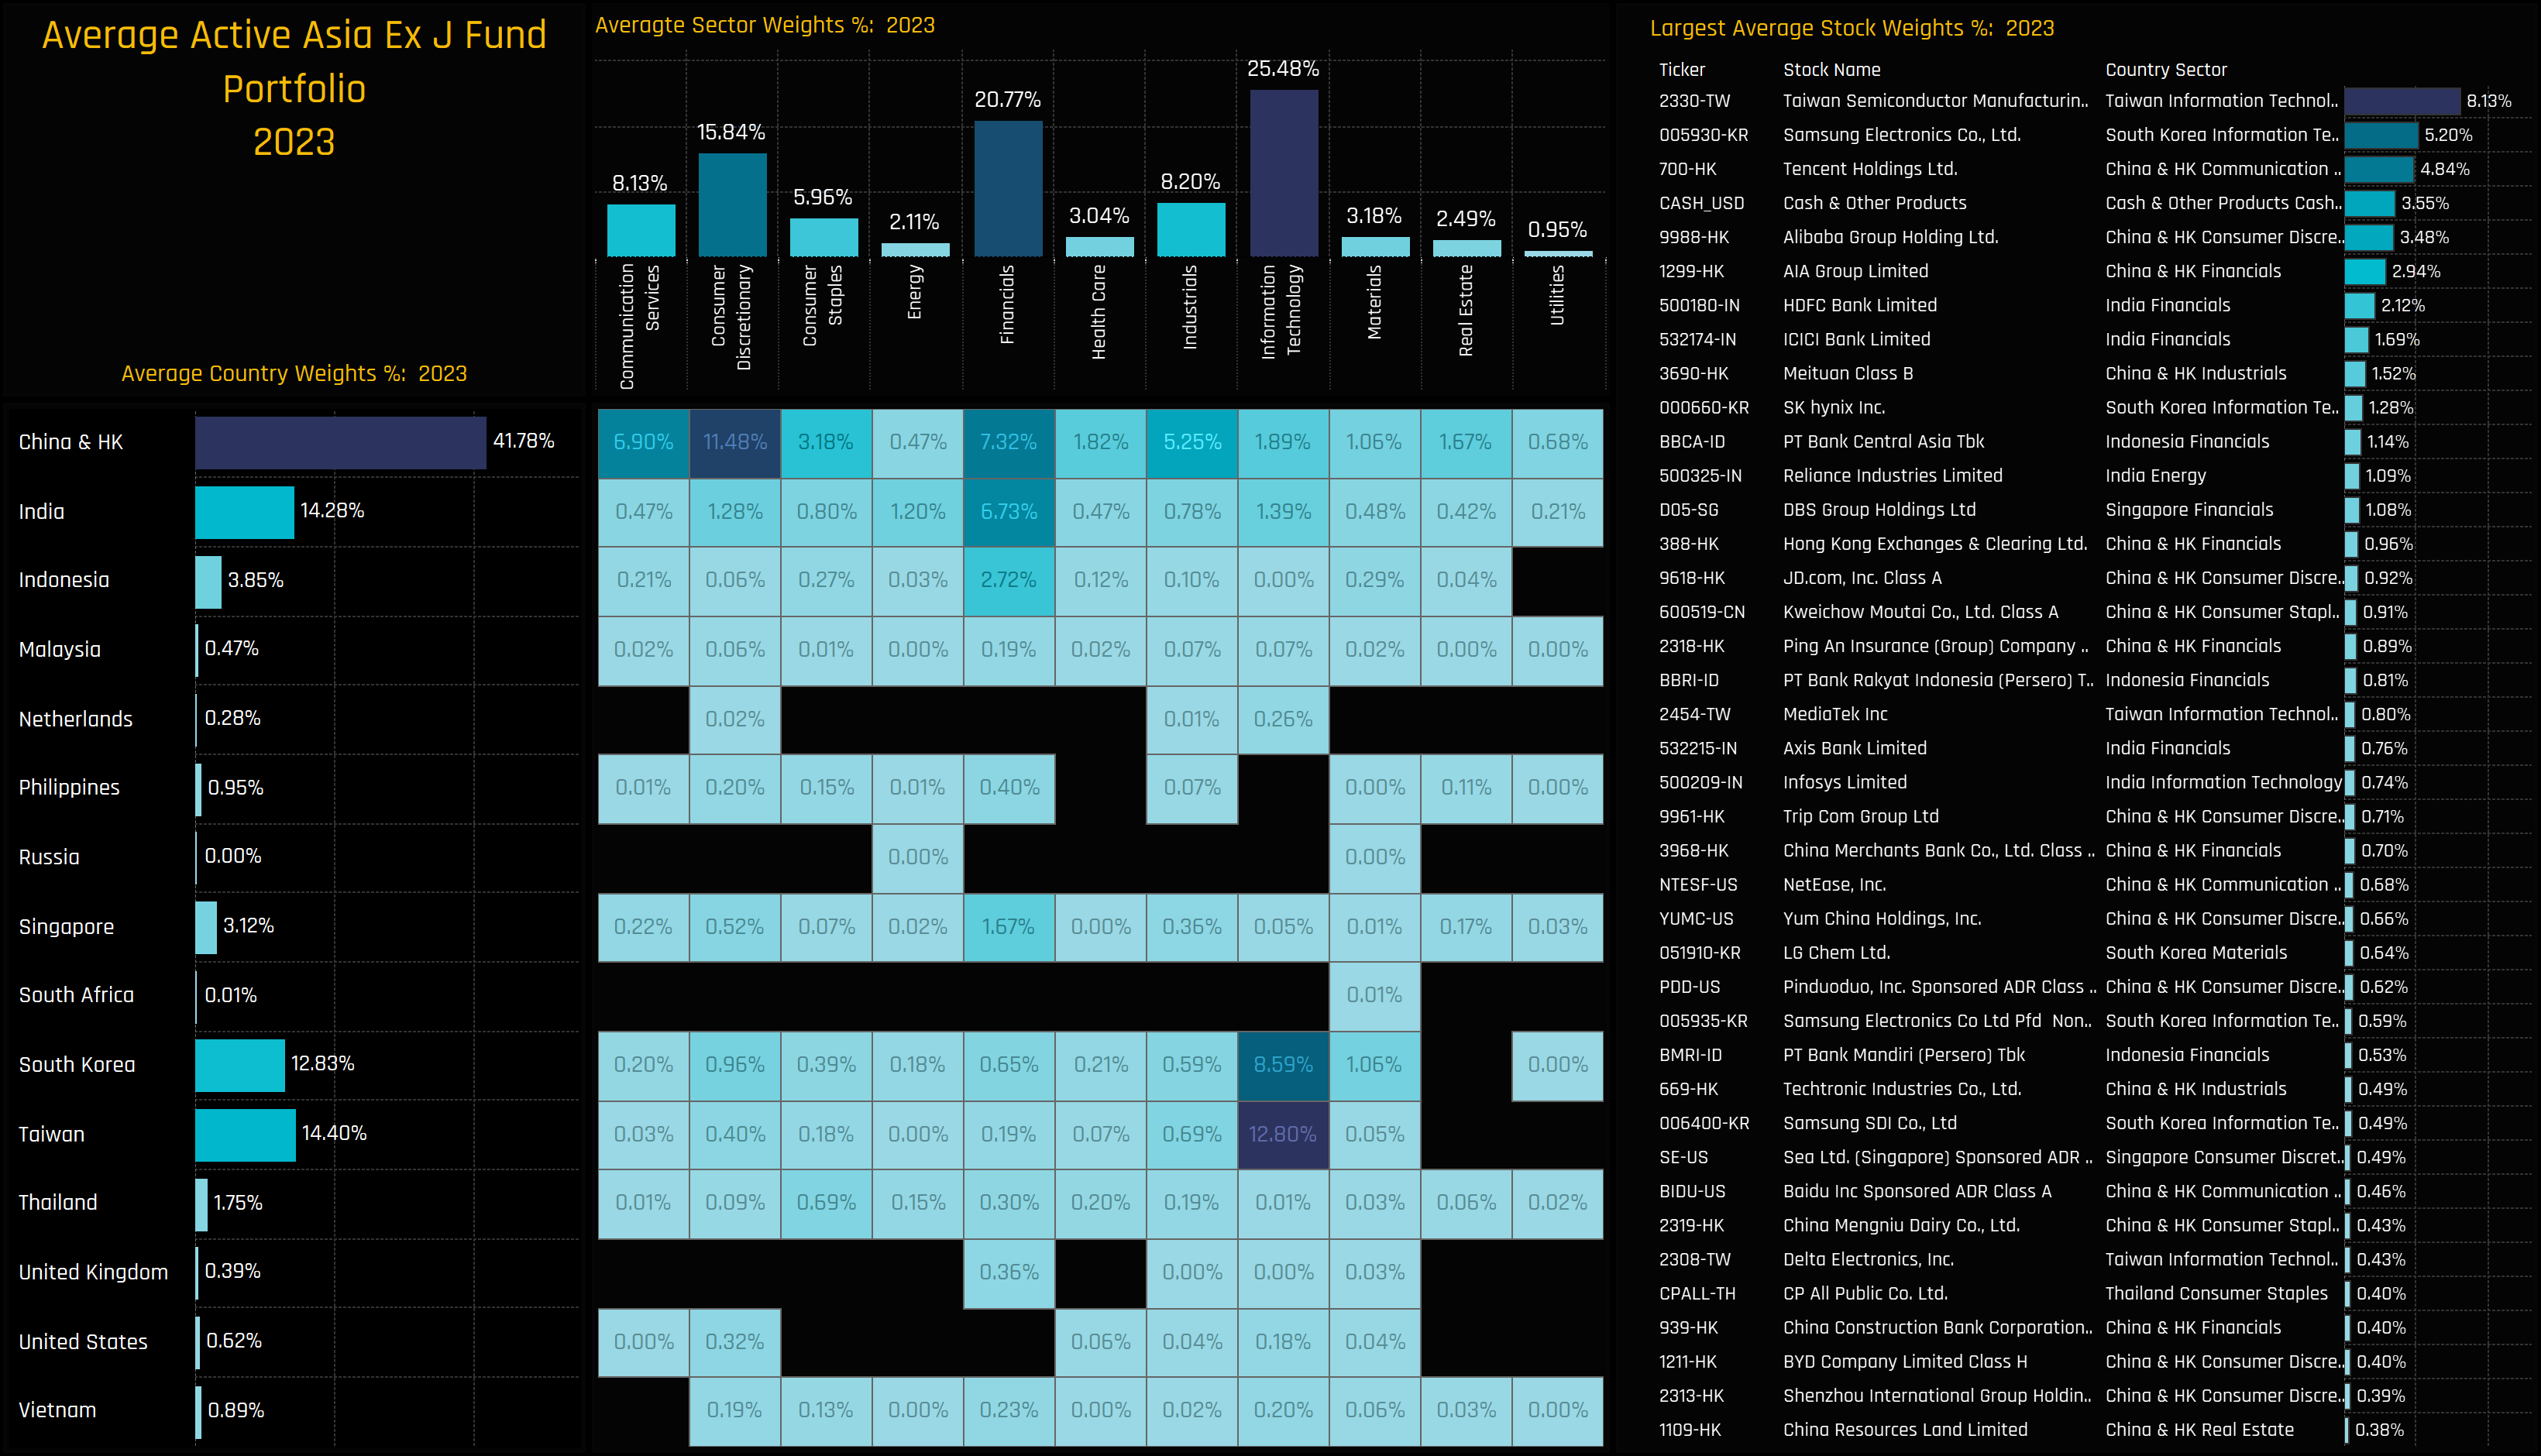
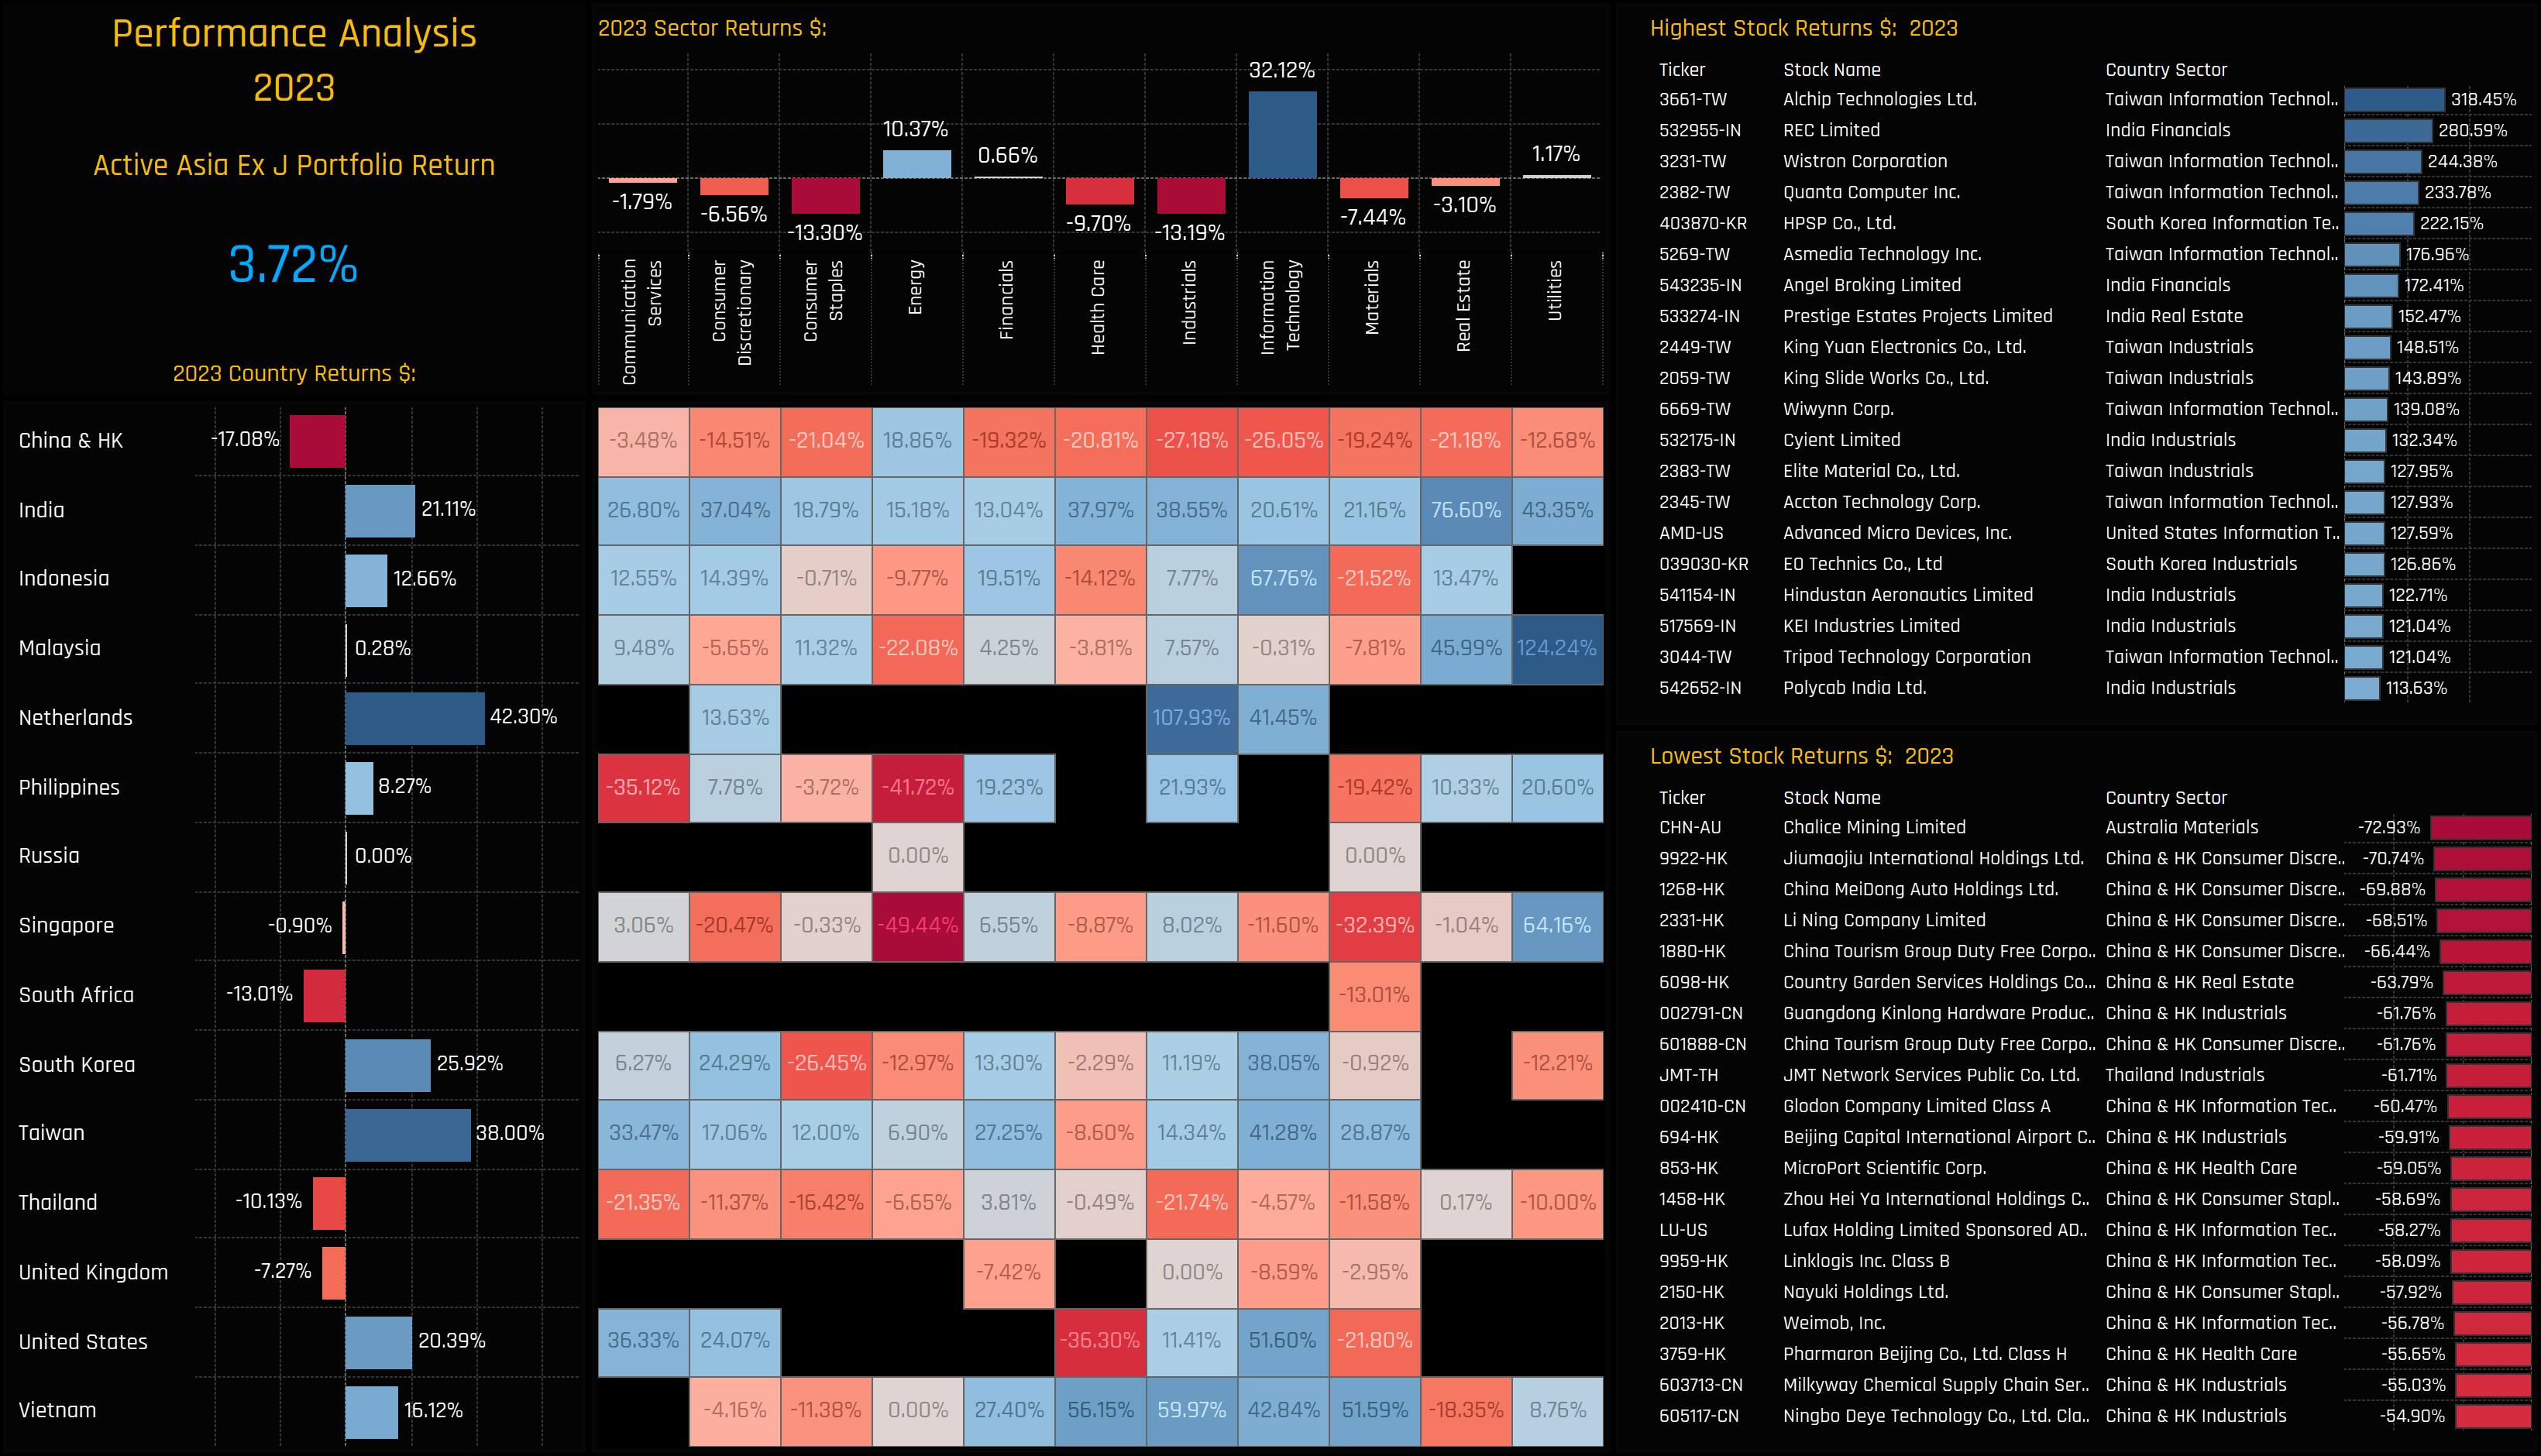
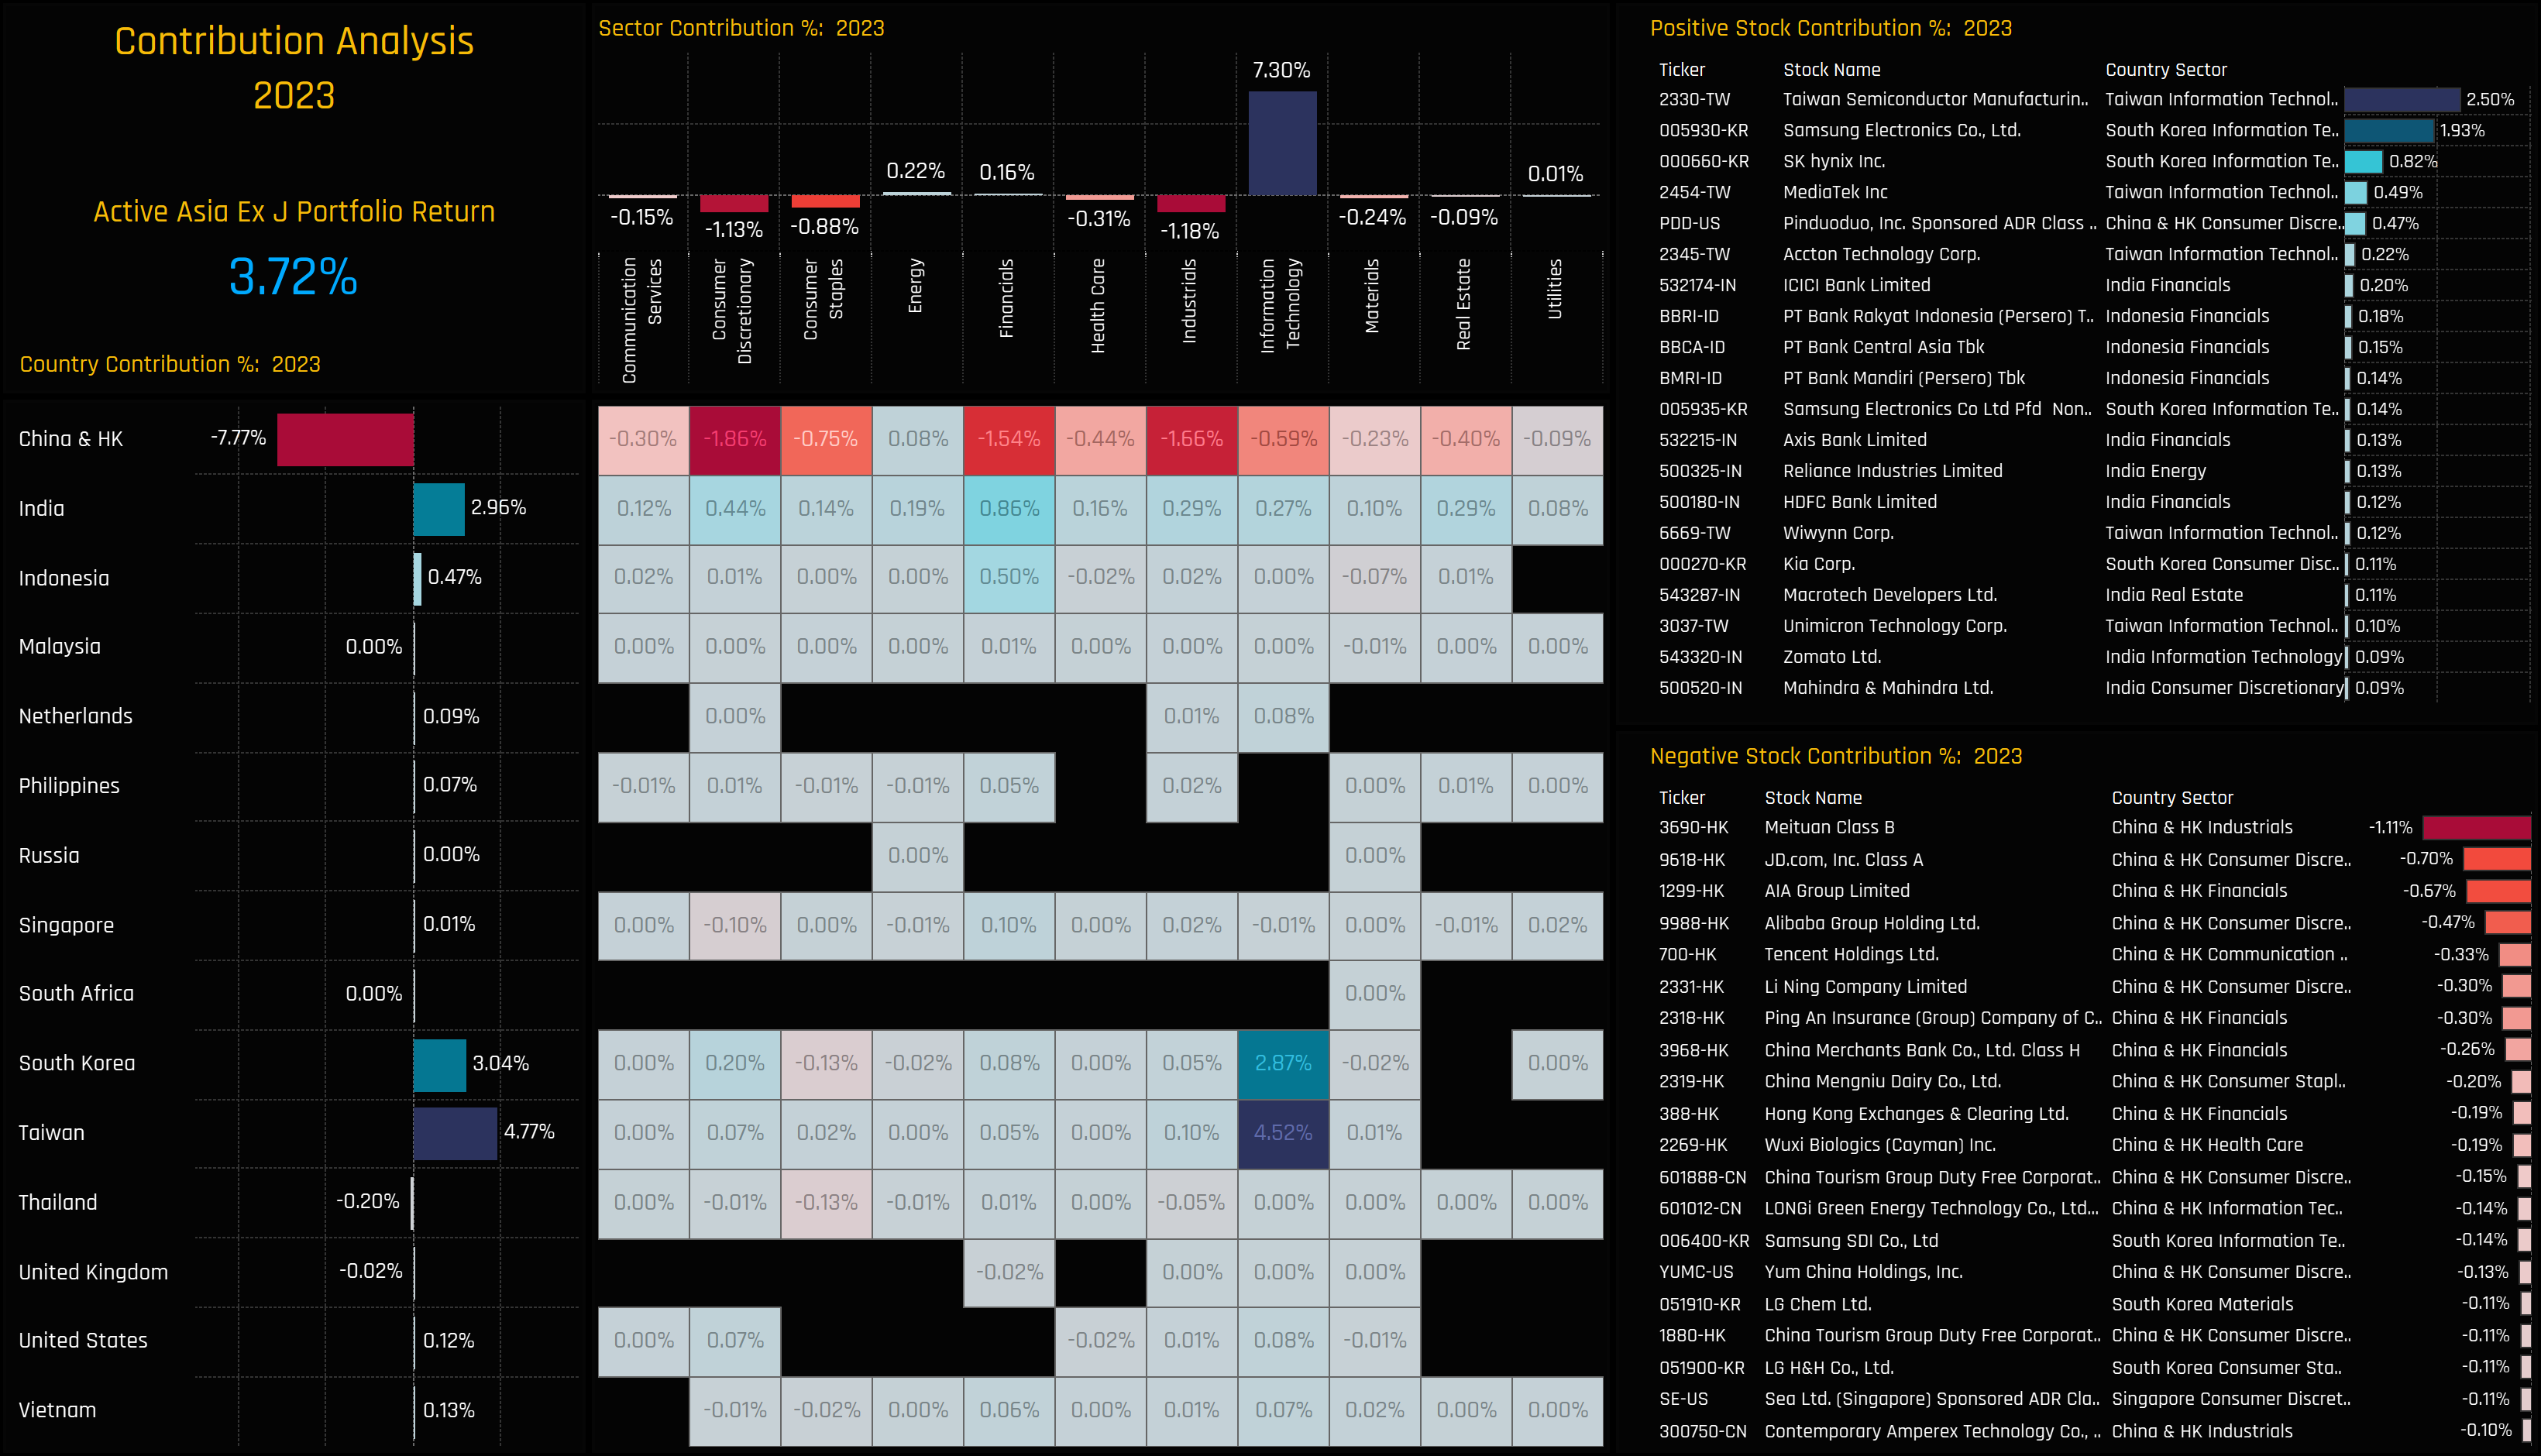
Asia Ex-Japan Active Fund Performance & Attribution Review, 2023
- Steve Holden
- 0 Comments
Related Posts


