Asia Ex-Japan Fund Positioning Analysis, October 2023
In this issue:
Betting on Recovery: Asia Ex-Japan Funds Return to Casino Stocks
JD.Com. Losing its Appeal?
Asia Ex-Japan Stock Positioning & Activity Update
100 Active Asia Ex-Japan Funds, AUM $54bn
Betting on Recovery: Asia Ex-Japan Funds Return to Casino Stocks
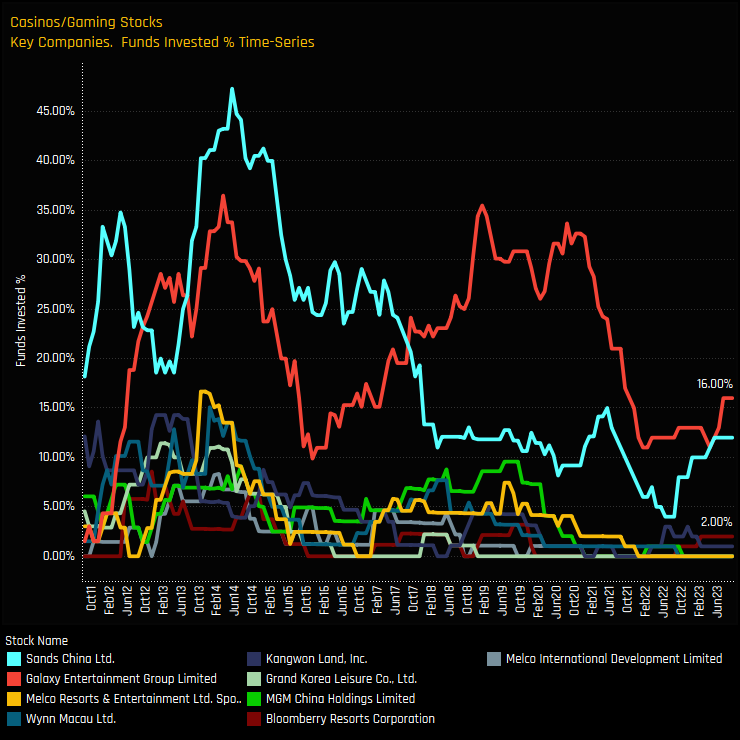
• Ownership levels in Casino stocks bounce back after prolonged period of decline
• BlackRock, JP Morgan and Barings among Asia Ex-Japan funds to buy back in.
• Ownership levels remain low but sentiment has clearly switched, with Galaxy Entertainment and Sands China at the heart of the moves.
Time Series & Industry Activity
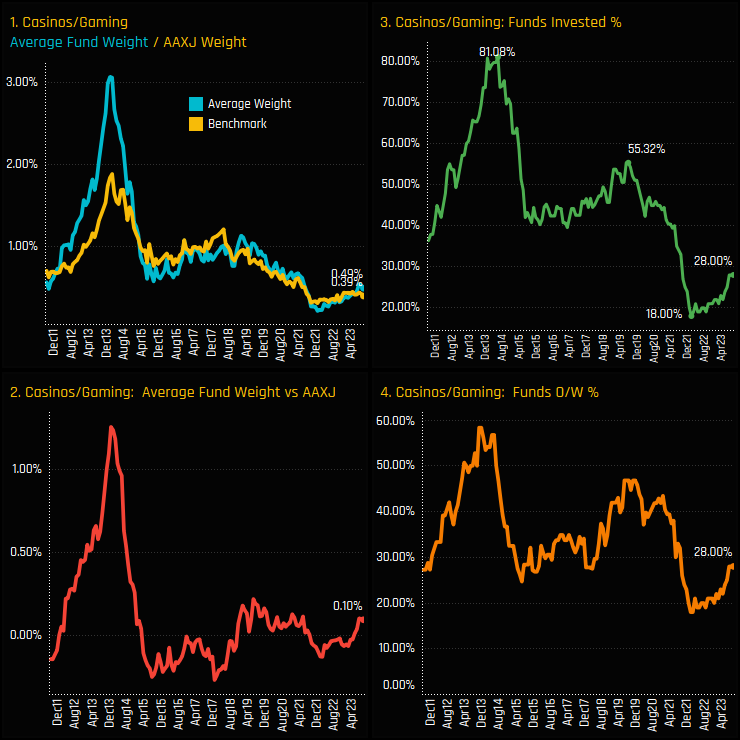
Ownership levels in the Casino/Gaming industry group are back on the up. An industry group once owned by over 80% of funds back in 2012 fell to a low of just 18% of funds towards the end of 2021 (ch3). Since then, a growing number of funds are buying back in, pushing average weights higher (ch1) and moving Casinos/Gaming to a net overweight among active Asia Ex-Japan managers (ch2). As it stands, all funds who hold Casino/Gaming exposure do so at higher levels than the benchmark iShares MSCI Asia Ex-Japan ETF (ch4).
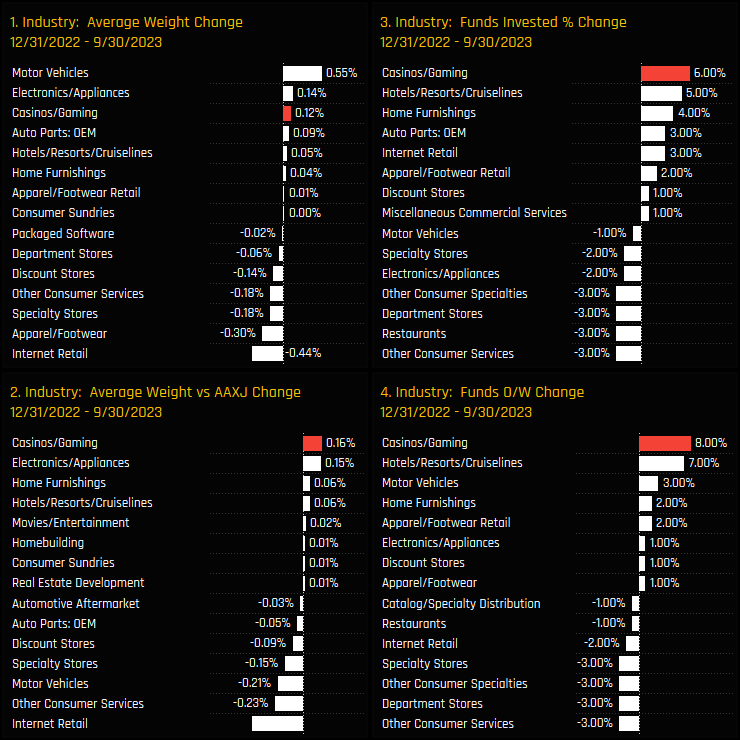
Through the course of 2023 Asia Ex-Japan funds have maintained this momentum. The charts below show the change in our fund ownership metrics between 12/31/2022 and 09/30/2023 for all Industry groups in the Consumer Discretionary sector. They highlight Casinos/Gaming as one of the key beneficiaries of manager rotation over the period, with the percentage of funds invested rising by +6% and funds overweight by +8%, the most of any other industry peer.
Industry Positioning & Sentiment
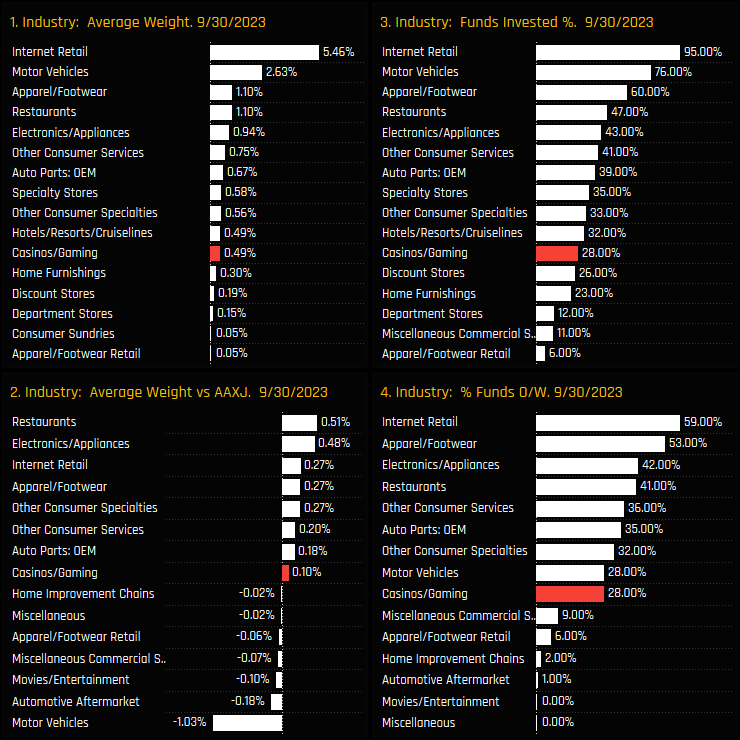
But despite this active rotation, Casinos & Gaming stocks are still a minor holding for the majority of managers in our analysis. They stand as the 11th largest average weight and the 11th most widely held Industry within the Consumer Discretionary sector, as charts 1 and 3 show below. Versus the benchmark, Casinos/Gaming are a very moderate overweight within the sector, with managers more bullishly positioned in Restaurants, Apparel/Footwear, Internet Retail and Electronics/Appliances.
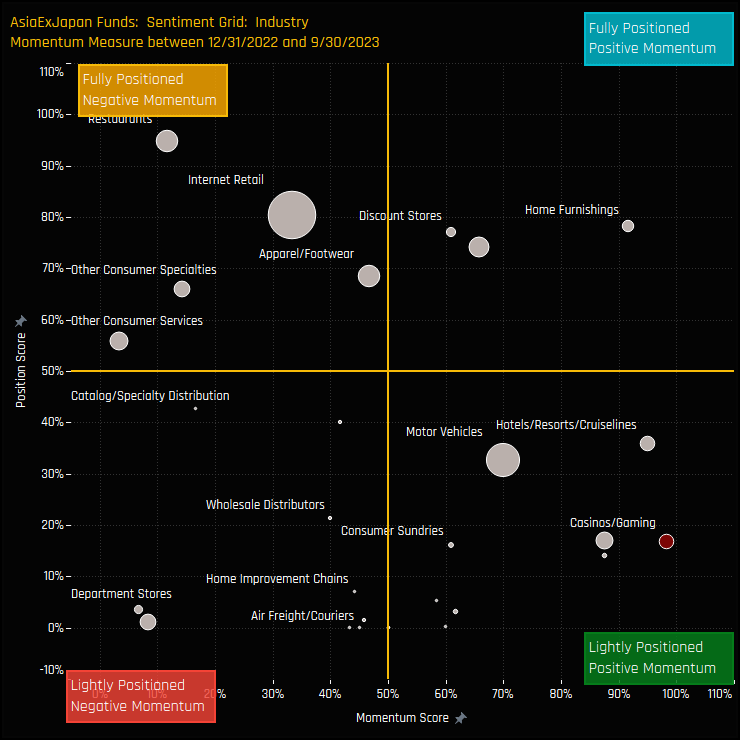
The Sentiment Grid below brings long-term positioning and short term manager activity together in a single chart. The Y-axis shows the ‘Position Score’, a measure of current positioning in each Industry compared to its own history going back to 2011 on a scale of 0-100%. The X-Axis shows the ‘Momentum Score’, a measure of fund manager activity for each Industry between 12/31/2022 and 09/30/2023 on a scale of 0% (maximum negative activity) to 100% (maximum positive activity). It highlights the Casino/Gaming Industry group as poorly positioned compared to its own history, but with the momentum measure the most positive among Consumer Discretionary peers.
Fund Holdings & Activity
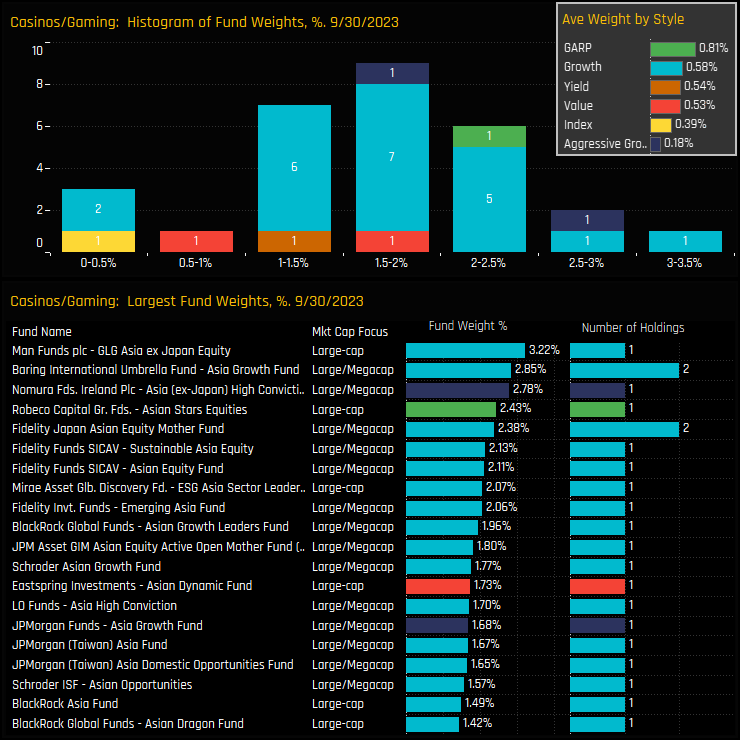
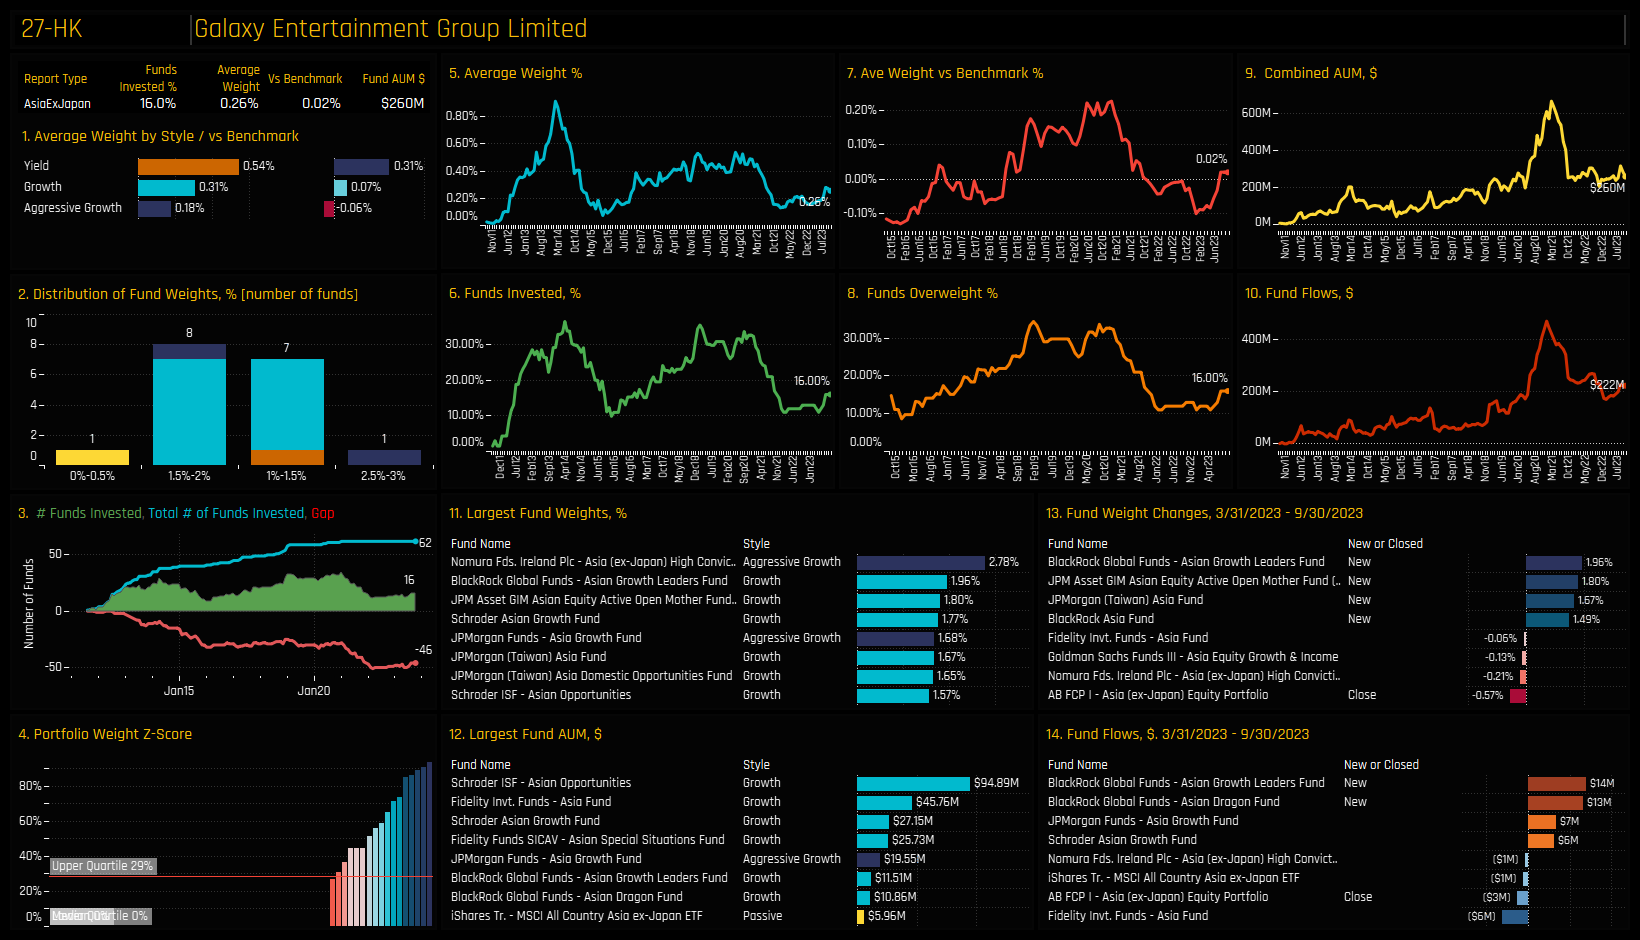
The top chart below shows the histogram of fund holdings in the Casino/Gaming industry group and the inset chart the average weight by fund Style. Allocations are concentrated in a fairly tight range, with the majority holding between 1% and 2.5% and the top holders only extending up to 3.2%. Fund allocations top out at 3.22% for Man GLG Asia Ex-Japan, with the majority of funds holding a single stock to express their view.
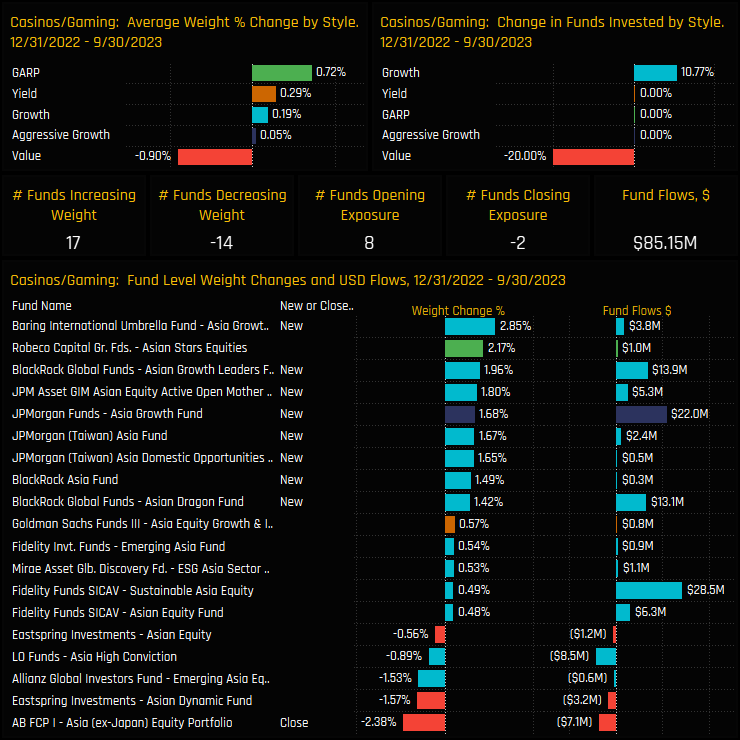
The charts below highlight the funds that are underpinning the recent allocation shift this year. Barings, BlackRock and JP Morgan make up the 8 funds that added new exposure over the period, with just 2 closing out. On a Style basis, a small number of Asia Ex-Japan Value strategies in our analysis took the opposite view, with AB Asia Ex-Japan closing out and Eastspring Asia Dynamic scaling back allocations.
Stock Holdings & Activity
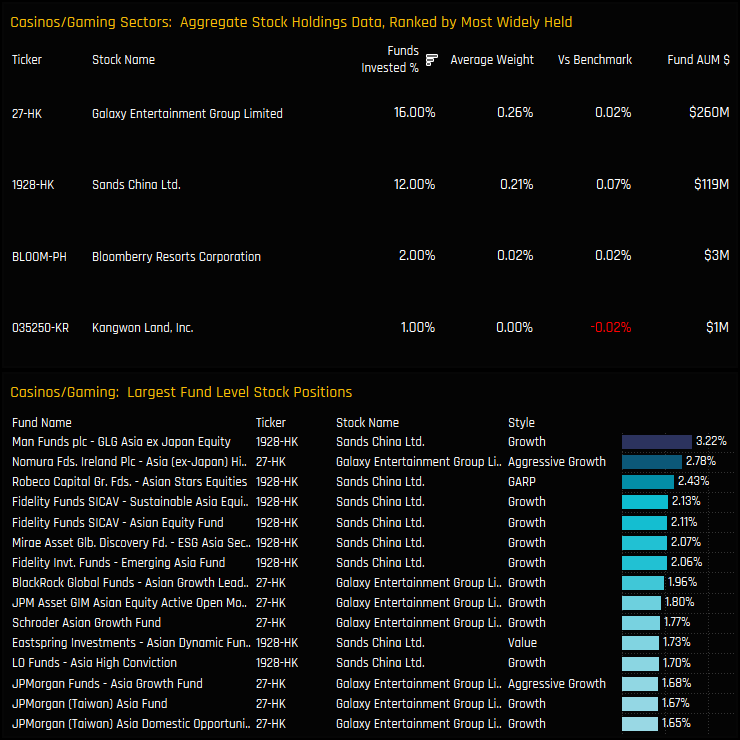
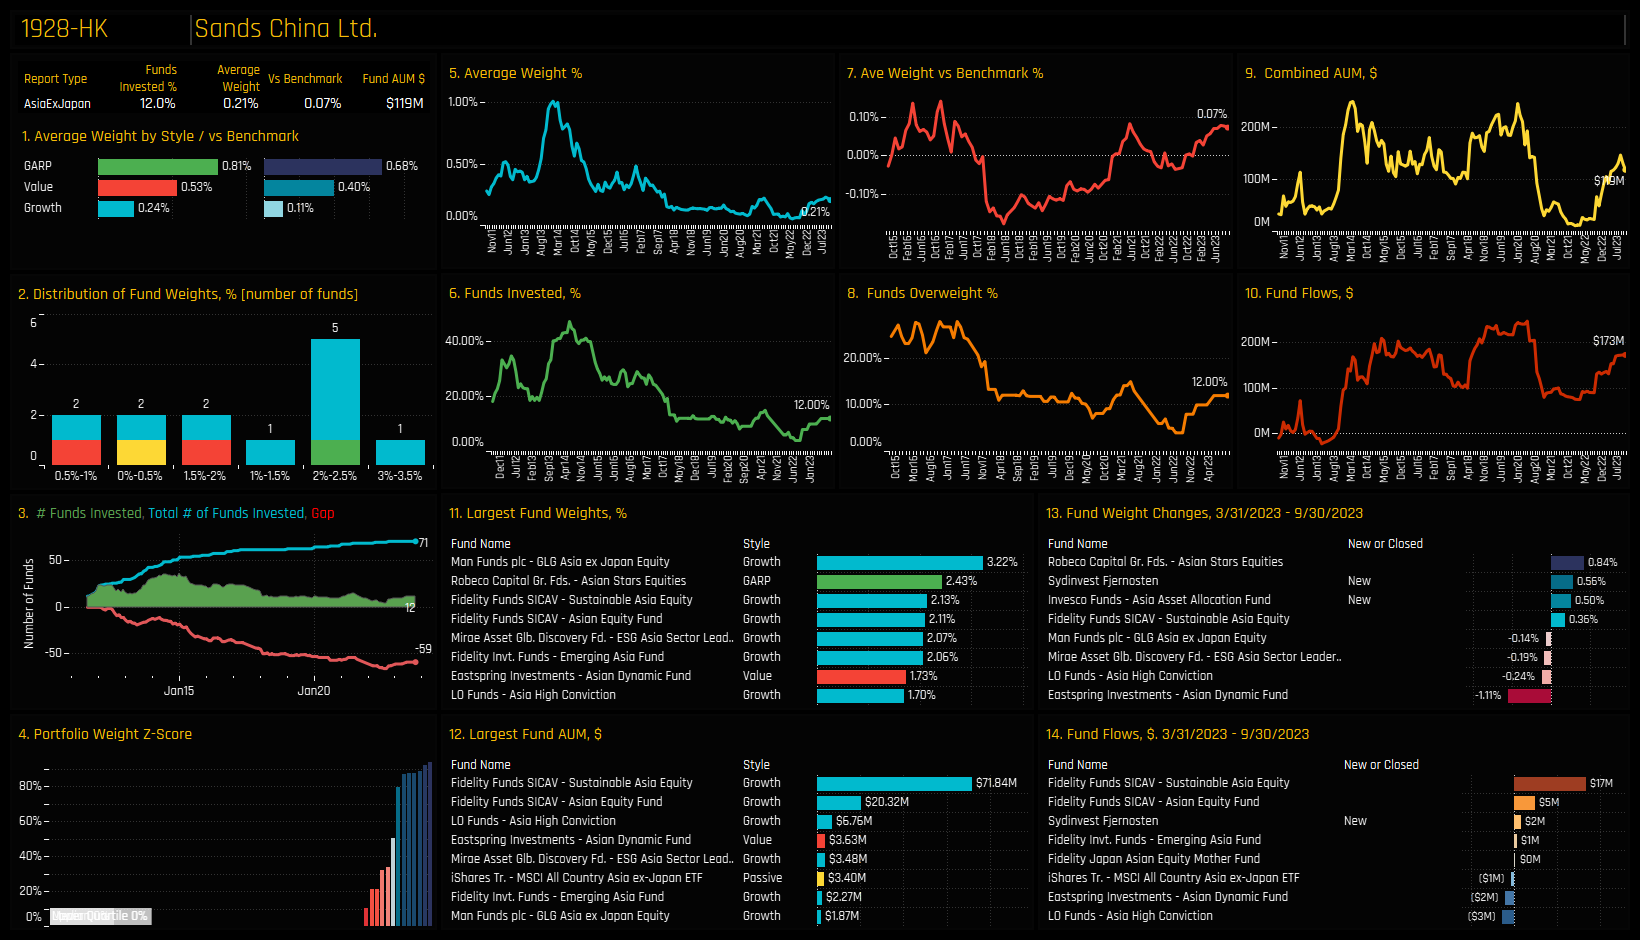
Just 4 companies comprise the entire Casinos/Gaming allocation, with Galaxy Entertainment the most widely held company with 16% of funds invested at an average weight of 0.26%. Sands China is slightly behind but well ahead of fringe holdings in Bloomberry Resorts Corp and Kangwon Land. Despite Galaxy’s more widespread ownership profile, Sands China dominates the larger fund levels positions, as shown in the bottom chart.
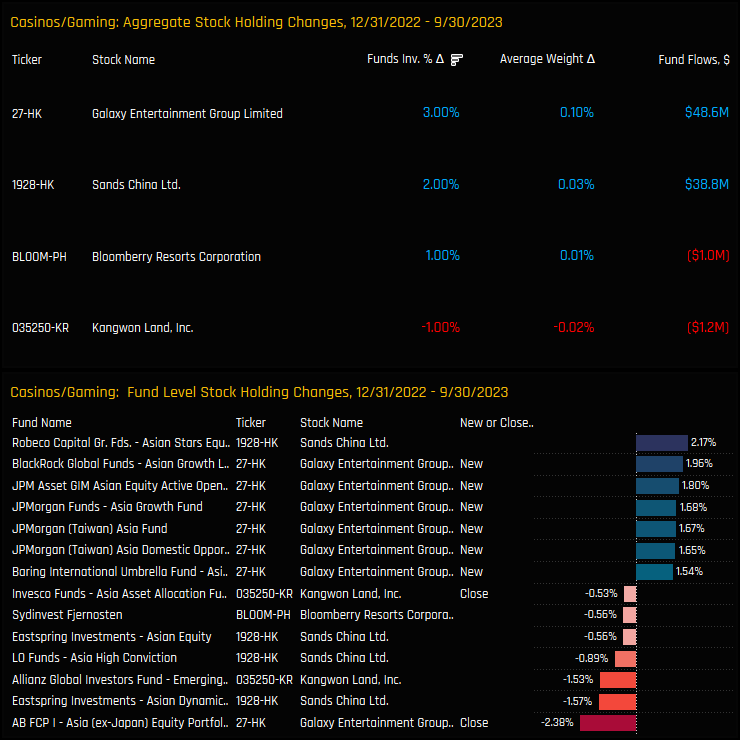
Stock level activity over the course of 2023 shows increases in investment levels for both Galaxy Entertainment and Sands China, but Galaxy certainly edges it in terms of the size and scale of new positions. Whilst Robeco Asian Stars increased their Sands China weight by +2.17%, BlackRock, JP Morgan and Barings all opened new exposure in Galaxy Entertainment in sizes ranging from 1.5% to 2%. It has formed the backbone of the recent rotation.
Conclusions & Links
The chart to the right shows the percentage of funds invested in each of the individual Casino/Gaming companies since 2011. It confirms that both Sands China and Galaxy Entertainment have been the mainstays of investment within the sector over the last decade. Both now sit towards the bottom of their historical ownership ranges but both have seen investment levels move from the lows.
So we find ourselves in the initial phases of a rebound, with a noticeable shift in sentiment as significant investment funds are re-entering the sector. Given that most previous investors are still observing from the sidelines, the path of least resistance may lean to the upside.
Click below for the extended data report on Casino/Gaming Asia Ex-Japan investor positioning. Scroll down for stock profiles on Galaxy Entertainment and Sands China
• After a spike higher in fund ownership in 2021, active Asia Ex-Japan funds are beginning to close out positions.
• Funds including T.Rowe Price, LO Funds and Nikko AM have closed out exposure this year.
• JD.com remains a very well owned stock among institutional investors, at a time when performance is anything but stellar so far this year.
Time-Series & Stock Level Activity
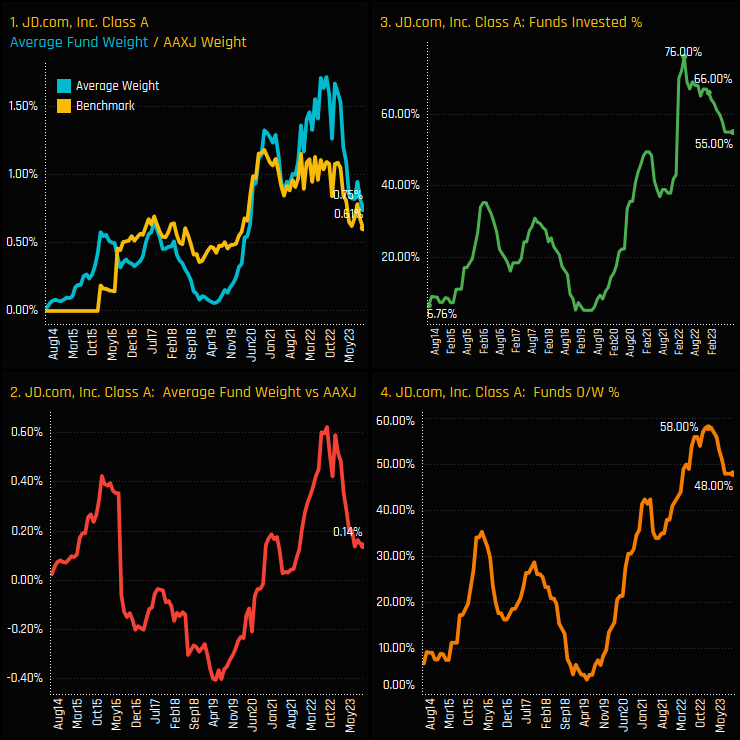
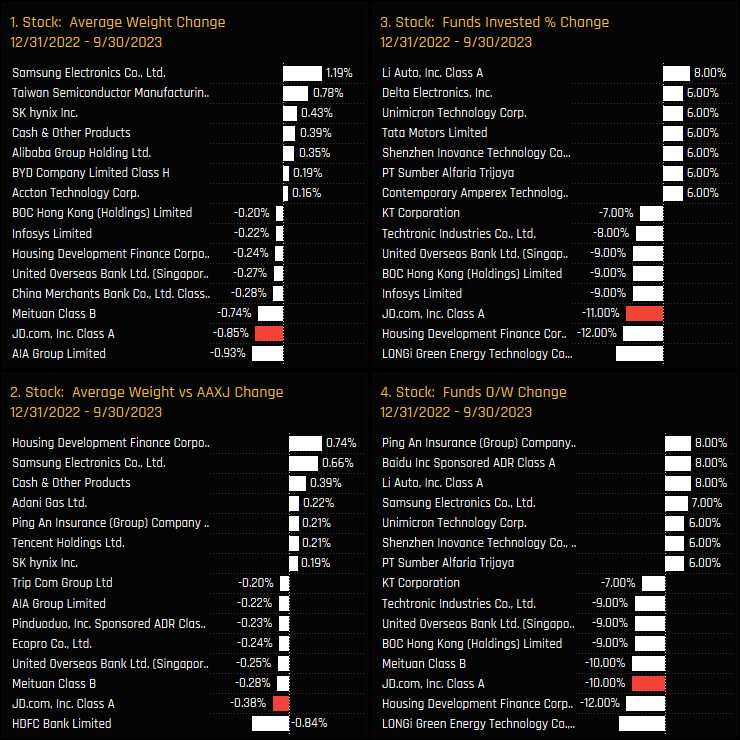
The percentage of Asia Ex-Japan funds invested in JD.com is falling. From a peak of 76% of funds in March 2022 an increasing number of funds are closing out positions, leaving 55% invested at the end of last month (ch2). In conjunction, average holding weights have fallen from 1.7% to 0.75% over a similar period (ch1) and benchmark overweights have moved closer to neutral (ch2). Despite these falls, JD.Com remains a well positioned stock, with 48% of the Asia Ex-Japan funds in our analysis positioned overweight.
Fund activity for JD.Com in 2023 has been among the most negative of any stock. A total of 11% of funds closed out entirely (ch3), average weights fell by -0.85% (ch1) and overweights collapsed by -0.38% (ch2). Instead, Asia Ex-Japan funds opened up positions in Li Auto, Delta Electronics and Unimicron Technology Corp, among others. Sentiment towards JD.Com has clearly taken a turn for the worse.
Fund Activity & Positioning
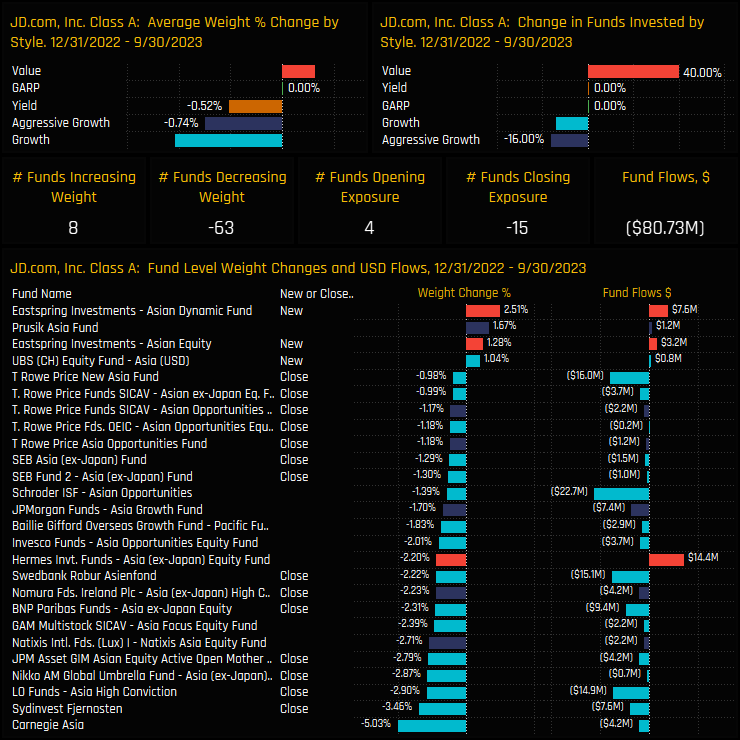
The fund activity underpinning this ownership decline can be seen in the charts below. Over the period 12/30/2022 to 09/30/2023, 63 funds saw weights decline versus 8 increase, whilst 15 funds closed positions versus 4 opening. Leading the exit were a number of Growth focused funds including Carnegie, Sydinvest and LO Funds, among others. Bucking the trend were opening positions from the Value funds of Eastspring (Asia Dynamic and Asian Equity).
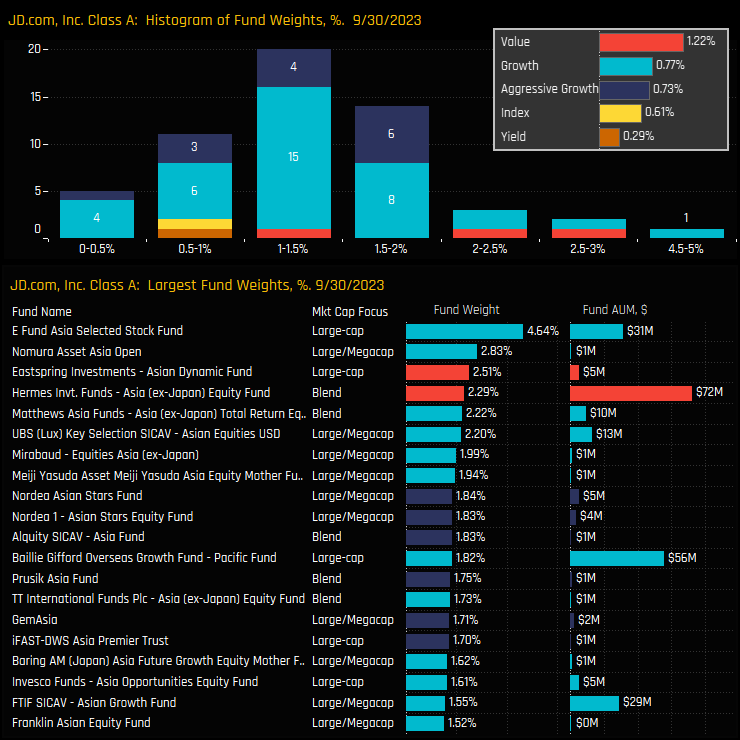
The top chart below shows the histogram of fund weights in JD.com, with the core of the distribution centered at between 0.5% – 2%. The small number of Value funds in our analysis are well invested, but the Growth strategies of E Fund Asia Selected Stock (4.64%) and Nomura Asset Asia Open (2.83%) are the top allocators.
Conclusions & Data Report
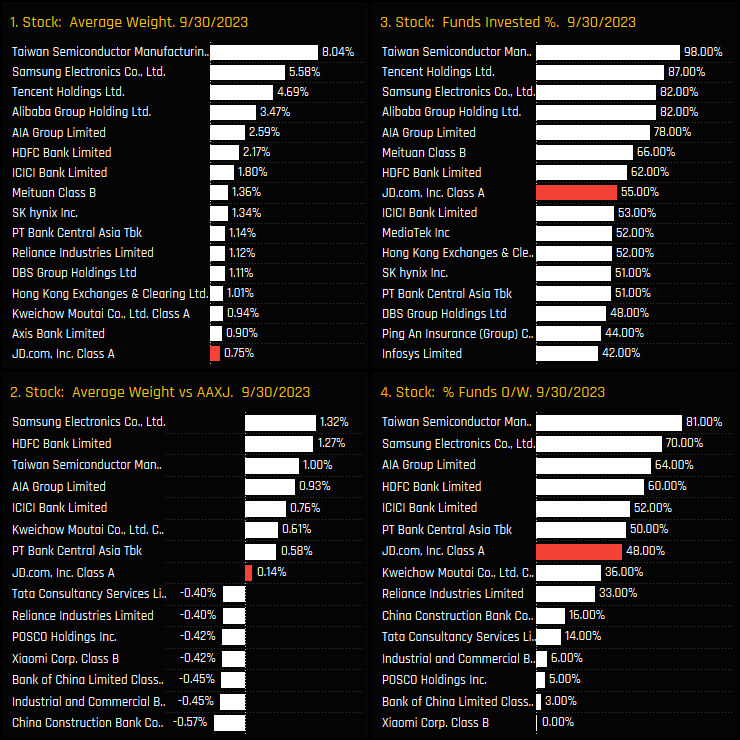
The charts to the right show the latest ownership statistics across the entire Asia Ex-Japan region. JD.com is still the 8th most widely held name, though average holding weights have fallen much further down the list.
It’s worth remembering that positioning took a huge spike higher over a short period between late 2021 and early 2022 (see first chart above), so the recent declines have merely brought ownership levels back towards the top of the longer-term range. In short, JD.com remains a very well owned stock among institutional investors, at a time when performance is anything but stellar so far this year.
Click on the link below for an extended report on positioning in JD.Com among the active Asia Ex-Japan funds in our analysis.
The latest data on aggregate stock level holdings, fund level stock holdings and activity over the last 6-months.
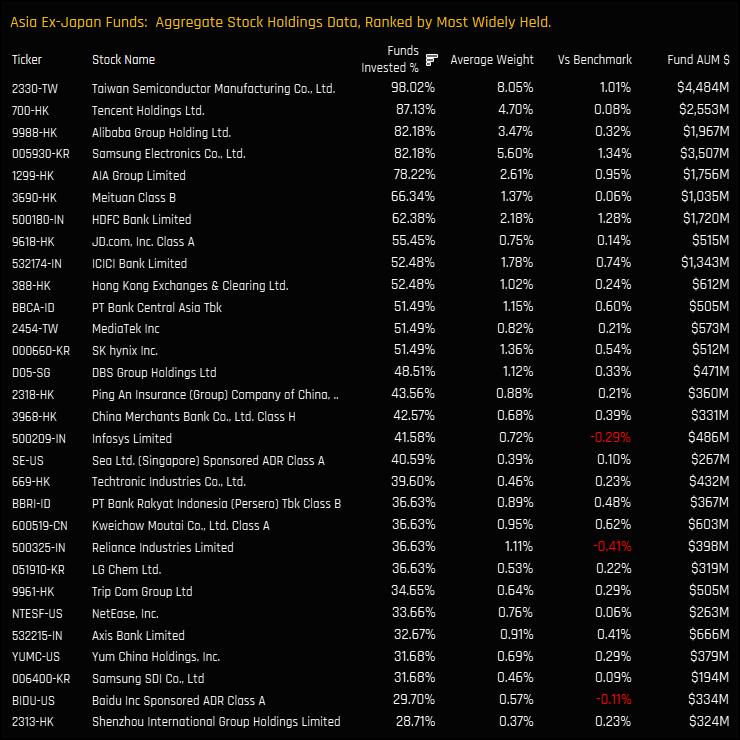
Most Widely Held Stocks
The 30 most widely held stocks among Asia Ex-Japan active equity funds
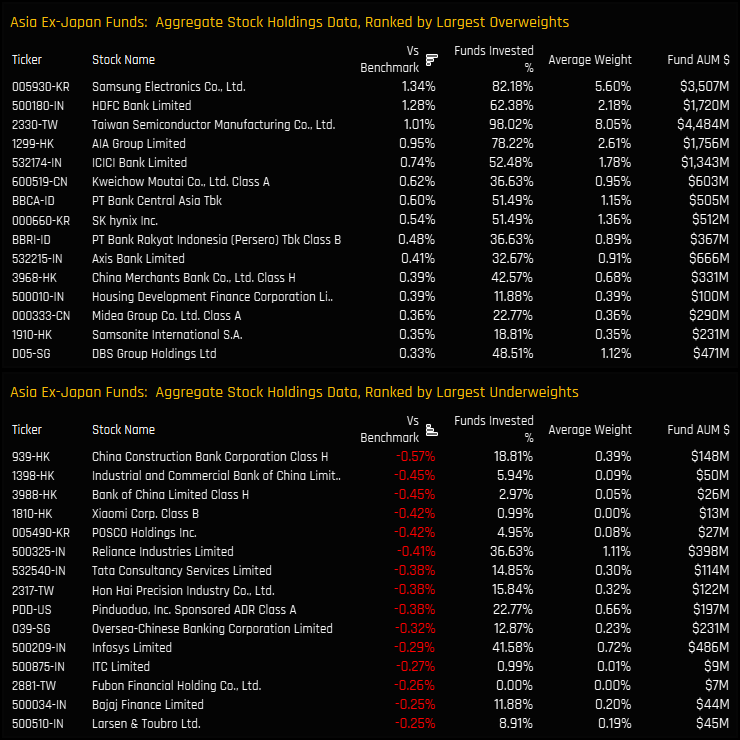
Top Over/Underweights
The top 15 aggregate overweight and underweight stock holdings versus the iShares MSCI AC Asia Ex-Japan ETF
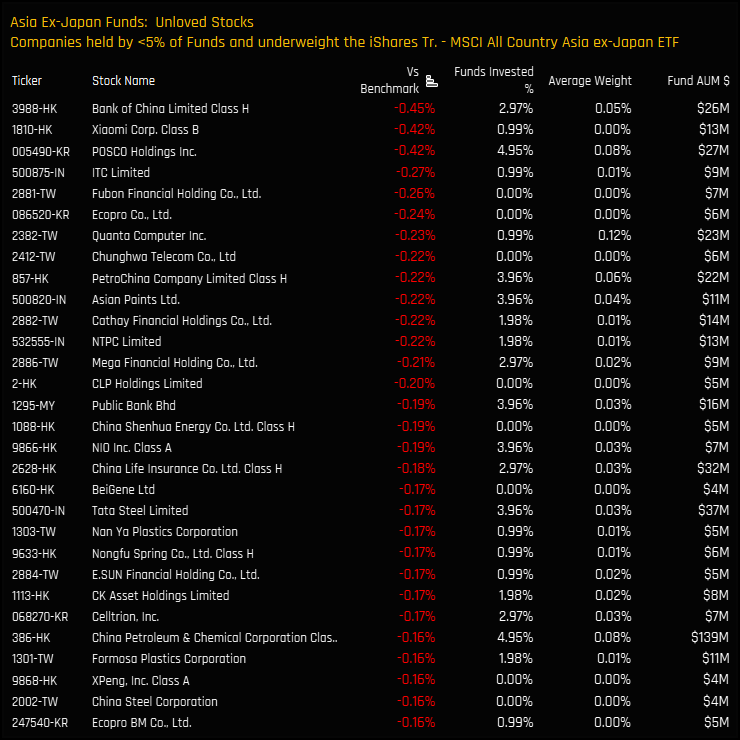
Unloved Stocks
Stocks held by less than 5% of the Asia Ex-Japan Funds in our analysis, and net underweight vs the iShares MSCI AC Asia Ex-Japan ETF (cash component removed and stock weights adjusted)
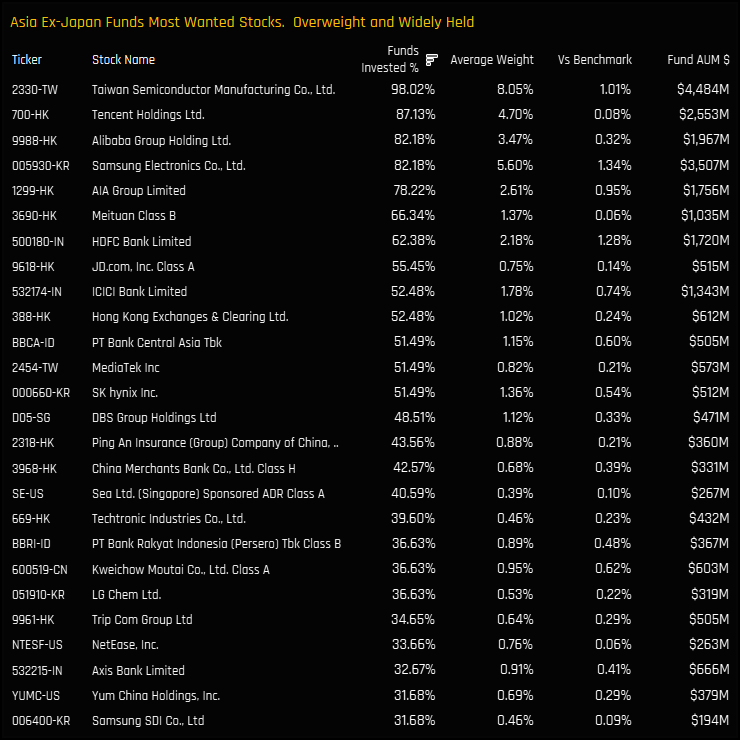
Most Wanted Stocks
Stocks held by more than 30% of the Asia Ex-Japan Funds in our analysis, and net overweight vs the iShares MSCI AC Asia Ex-Japan ETF
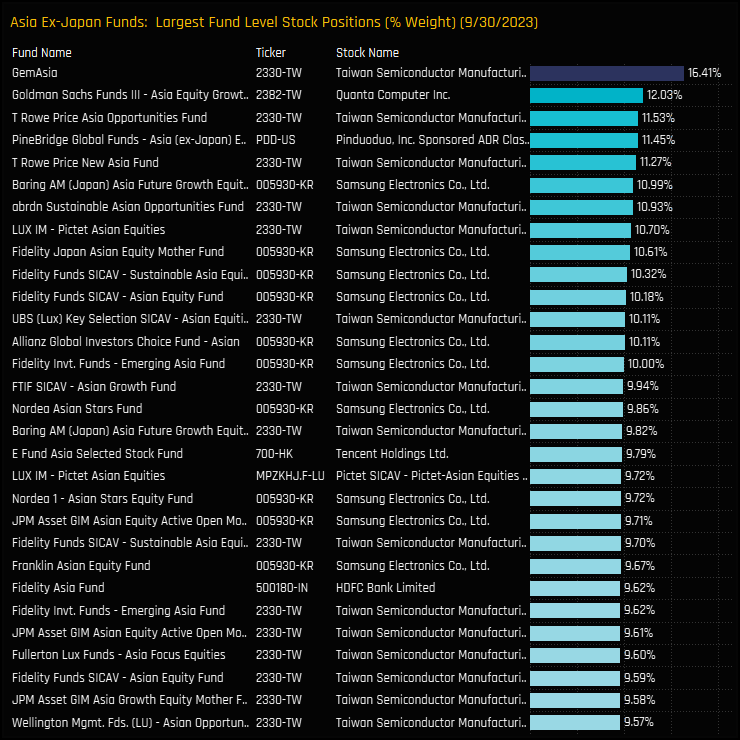
Largest Fund Level Stock Positions, %
The top 30 largest individual fund level stock positions on a portfolio weight basis.
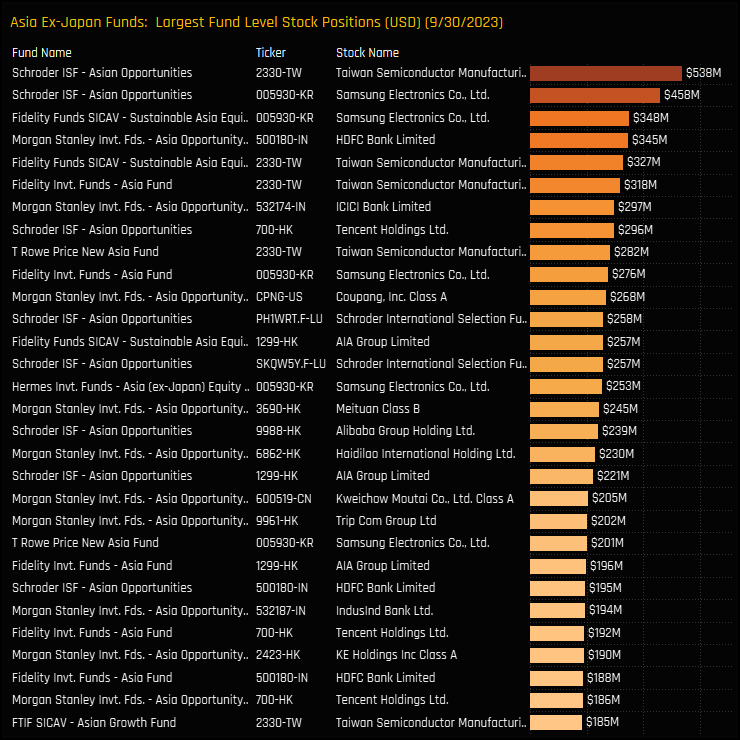
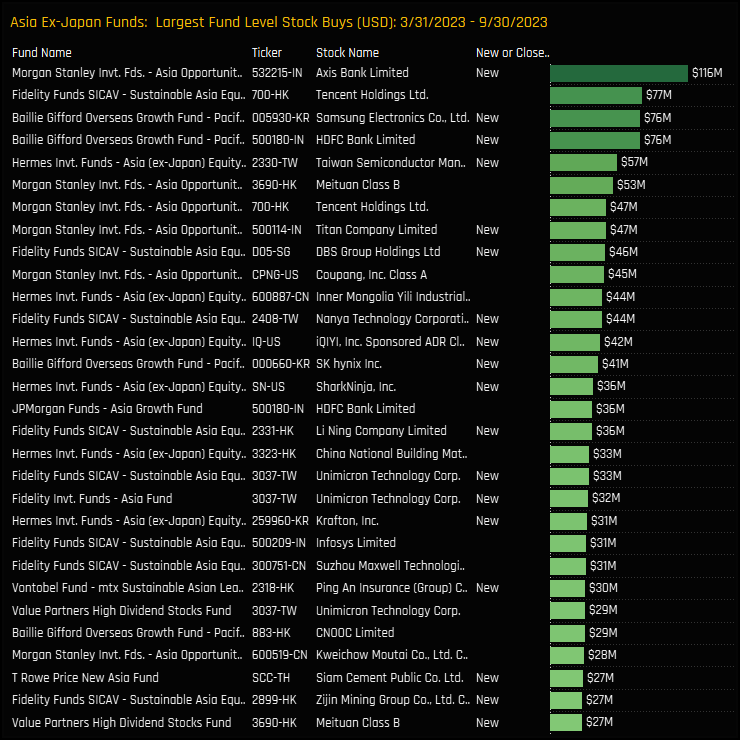
Largest Fund Level Stock Positions, $
The top 30 largest individual fund level stock positions on a fund AUM basis.
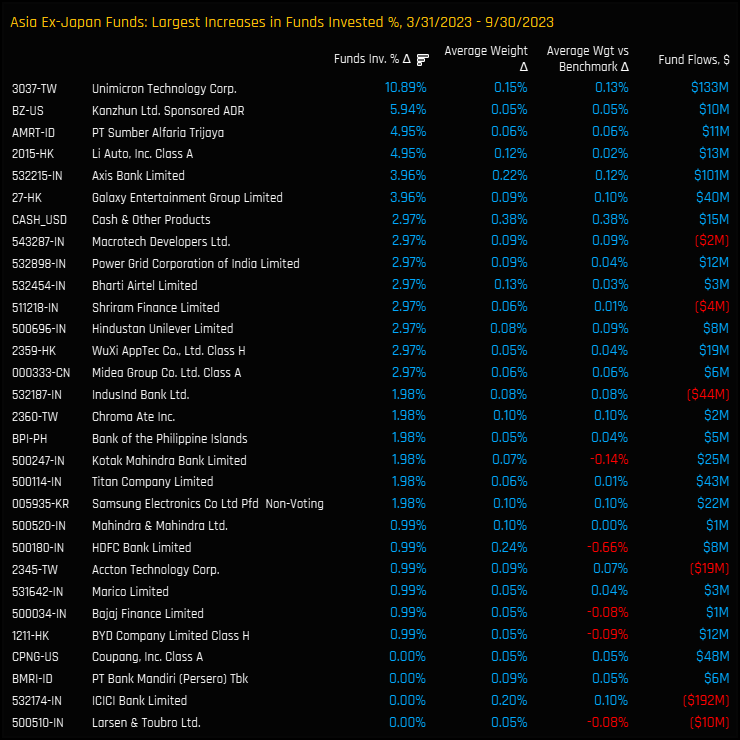
Largest Ownership Increases
The stocks with the largest net increase in the percentage of funds invested between 03/31/2023 and 09/30/2023
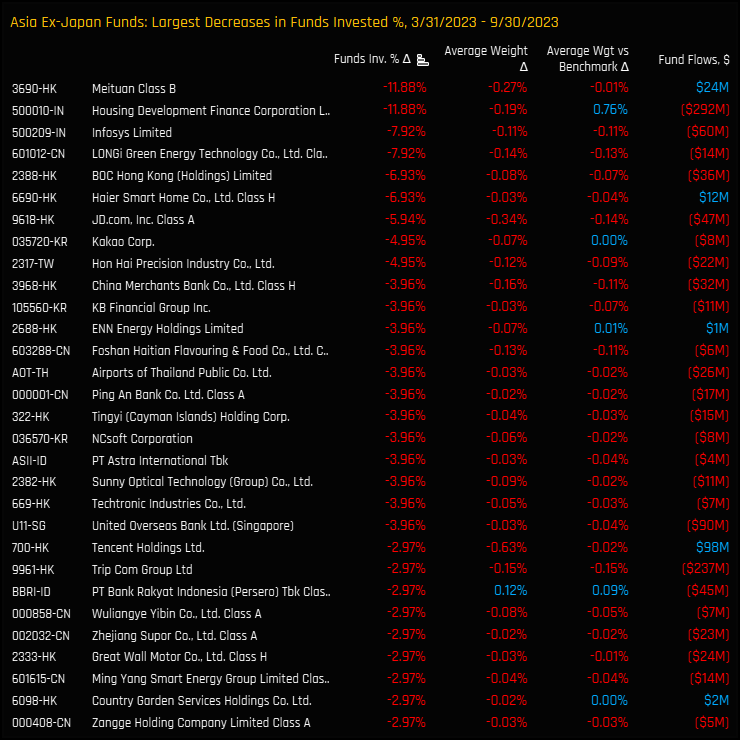
Largest Ownership Decreases
The stocks with the largest net decrease in the percentage of funds invested between 03/31/2023 and 09/30/2023
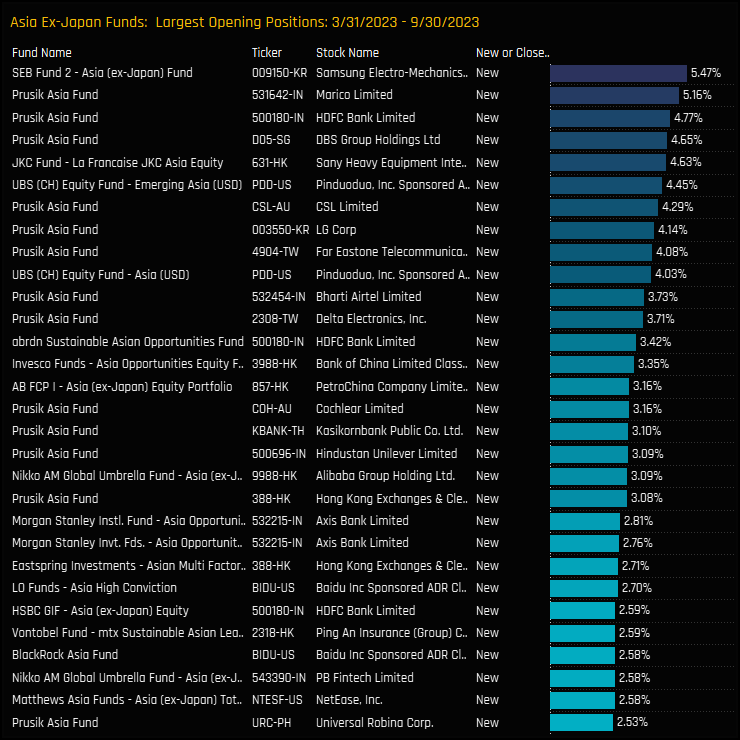
Largest Opening Positions
The largest opening stock positions between 03/31/2023 and 09/30/2023
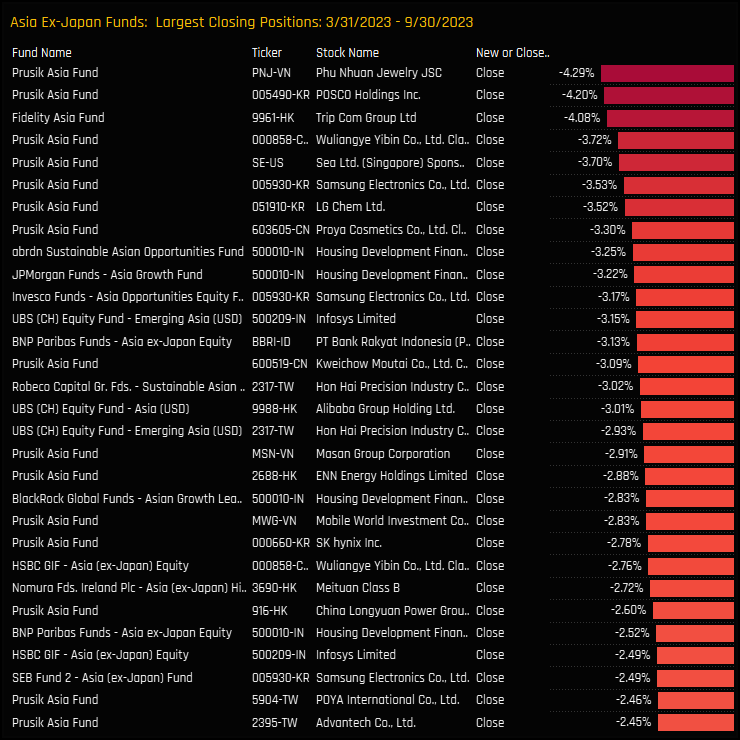
Largest Closing Positions
The largest closing stock positions between 03/31/2023 and 09/30/2023
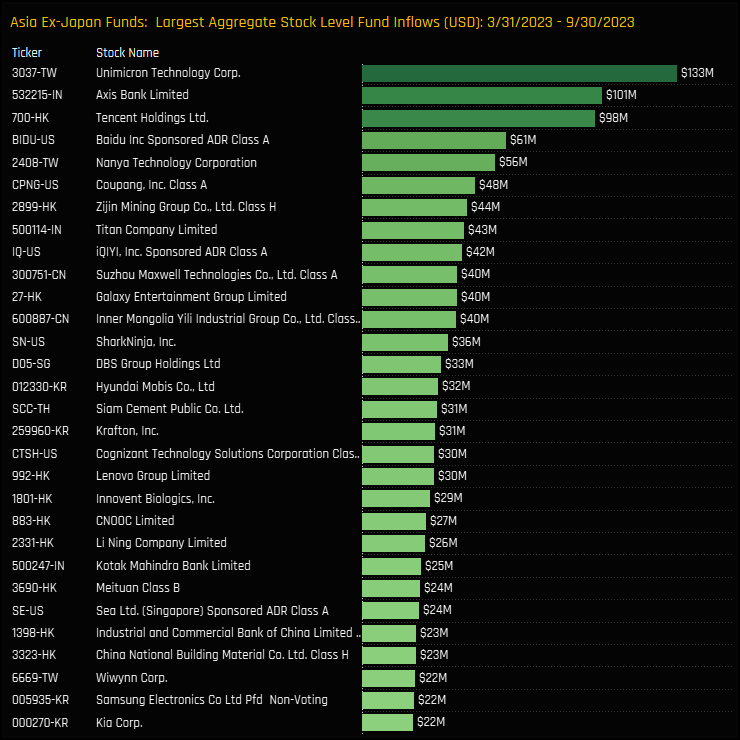
Largest Stock Inflows, $
The largest combined fund inflows on a stock level between 03/31/2023 and 09/30/2023
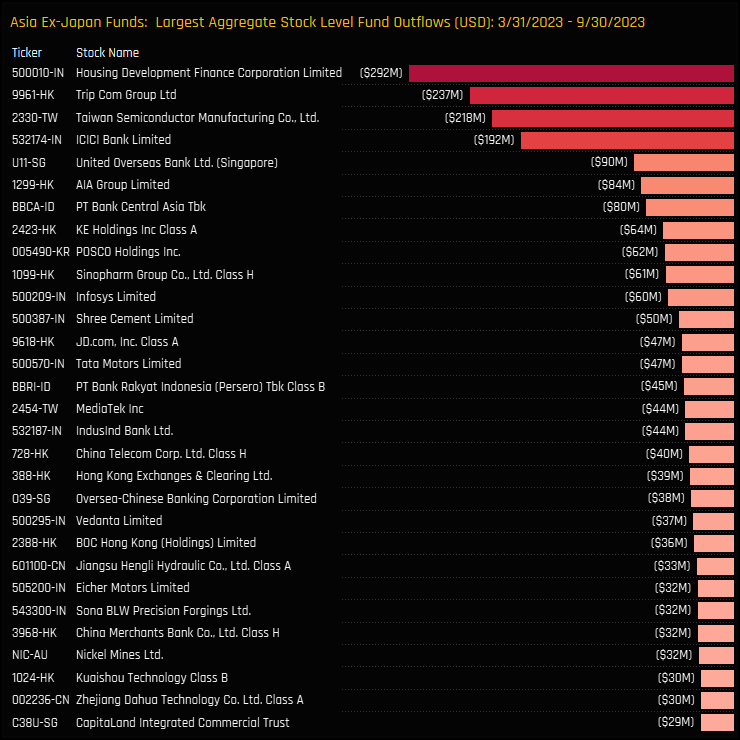
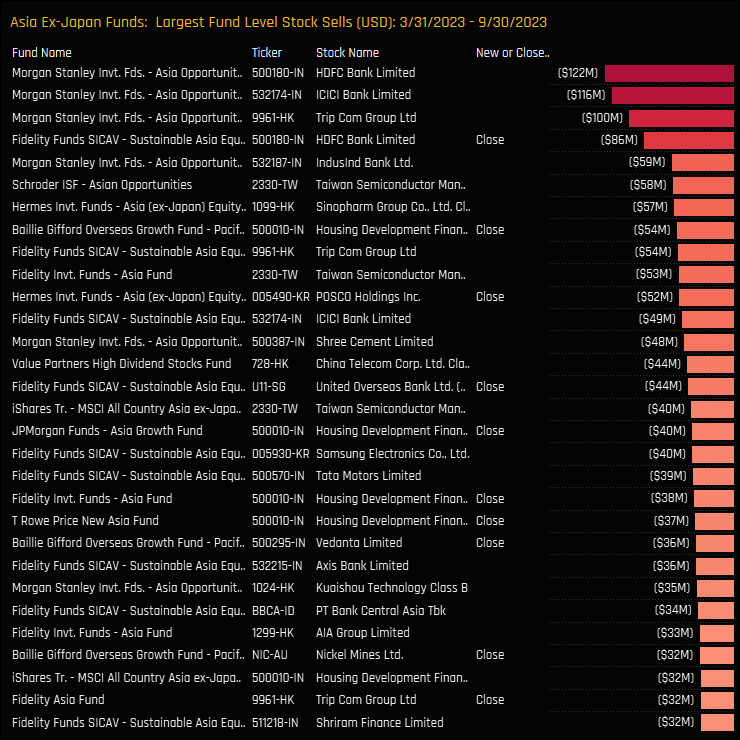
Largest Stock Outflows, $
The largest combined fund outflows on a stock level between 03/31/2023 and 09/30/2023
Largest Fund Level Stock Inflows, $
The largest fund level stock inflows between 03/31/2023 and 09/30/2023
Largest Fund Level Stock Outflows, $
The largest fund level stock outflows between 03/31/2023 and 09/30/2023
100 Active Asia Ex-Japan Funds, AUM $54bn
Asia Ex-Japan Active Funds Ownership Report
Please click on the link below for the full data report on Asia Ex-Japan active fund positioning
For more analysis, data or information on active investor positioning in your market, please get in touch with me on steven.holden@copleyfundresearch.com
Investor Positioning Report — Copley Fund Research Ltd · Last updated: July 2026 · Registered in England and Wales
1. Who we are
Copley Fund Research Ltd provides proprietary institutional fund intelligence to listed companies and investor relations professionals. These terms govern every purchase of an Investor Positioning Report. By completing a purchase you confirm you have read, understood, and agreed to these terms in full.
2. What you are purchasing
The Investor Positioning Report is a bespoke PDF report mapping the institutional fund universe around your stock. It covers current investors, past investors, competitor investors, and white space investors. Every report is built from scratch for the specific company ordered and is not a standardised or templated product.
3. Delivery and process
Following payment or invoice issuance, Copley Fund Research will contact you within one working day to agree your competitor set. Production begins once the competitor set is confirmed in writing. The completed report will be released to you within 48 hours of production starting, provided payment has been received in full; where payment is outstanding, the report will be withheld until payment clears. If the requested company falls outside our covered fund universes, or a competitor set cannot be agreed, Copley Fund Research will issue a full refund or cancel the outstanding invoice.
4. Competitor set agreement
The competitor set is agreed with you in writing prior to production, and the report is built to that agreed specification. Requests to amend the competitor set after delivery, based on a change of preference rather than an error, may be treated as a new order.
5. Refund policy
Because each report is produced individually for your company, orders are non-refundable once production has begun, except as set out in clauses 3 and 5a below. By purchasing, you agree not to dispute the charge with your card provider on the basis that the service was not as described, provided the report has been delivered to the agreed specification or corrected under clause 5a.
5a. Quality remedy
If a delivered report contains a material error caused by Copley Fund Research — for example, an incorrect company analysed, a competitor omitted from the agreed set, or content missing from the specification in clause 2 — Copley Fund Research will correct and redeliver the report at no additional charge, within a reasonable timeframe. This is your sole remedy for such errors.
6. Data and accuracy
All fund positioning data in the report reflects holdings as disclosed at the most recently available reporting date at the time of compilation. The timing of fund holdings disclosures is determined by regulatory requirements applicable to each fund and is outside the control of Copley Fund Research Ltd. This data may not reflect current fund positions. Copley Fund Research takes reasonable care to ensure accuracy but makes no warranty, express or implied, as to the completeness or current accuracy of the underlying data — though this does not affect the quality remedy in clause 5a for errors in how that data was analysed or presented. Past fund positioning is not indicative of future fund behaviour or investment decisions.
7. Not investment advice
The Investor Positioning Report is produced for investor relations intelligence purposes only. It does not constitute investment advice, financial advice, or a recommendation to buy, hold, or sell any security. The data reflects historical fund positioning and must not be relied upon as a prediction of future fund behaviour or investment decisions. Copley Fund Research Ltd is not authorised or regulated by the Financial Conduct Authority for the provision of investment advice.
8. Permitted use and confidentiality
The report is licensed for internal use by the purchasing organisation only. You may share it with employees and directors of your organisation. You may not: reproduce, redistribute, publish, or resell the report or any part of it; share it with any third party outside your organisation without prior written consent; use the fund or portfolio manager names contained in the report to approach those individuals on behalf of Copley Fund Research or in a manner that could damage Copley Fund Research's relationships with those funds; or use the data for any purpose other than your own investor relations strategy. The data, analysis, and methodology contained in the report are the intellectual property of Copley


