Asia Ex-Japan Fund Positioning Analysis, March 2023
In this issue:
Asian Financials: Closing the Underweight
The Philippines Depression
Asia Ex-Japan Fund Holdings Guide
89 Active Asia Ex-Japan Funds, AUM $55bn
Asian Financials: Closing the Underweight
An increasing number of Asia Ex-Japan funds are moving to overweight the Financials sector
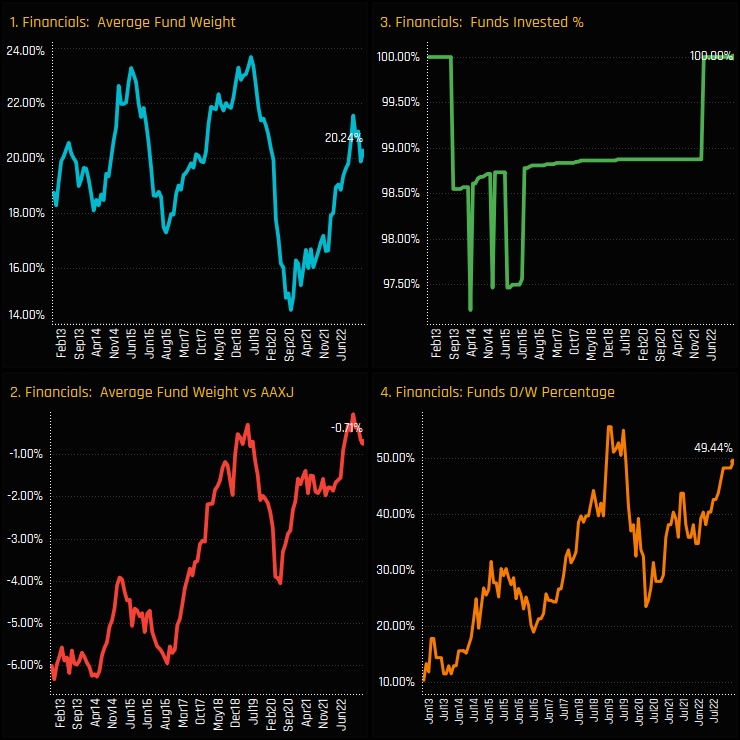
An increasing number of Asia Ex-Japan funds are moving to an overweight position in the Financials sector. Chart 2 below shows the average active fund weight minus the iShares Asia Ex-Japan ETF weight in the Financials sector over the last decade. From a range of -4% to -6% between 2011 and 2016 and a dip down to -4% following the COVID pandemic in 2020, active managers now stand just -0.71% below the benchmark, on average. Commensurate with these moves is a surge in absolute exposure (ch1) and an increase in the percentage of funds who are overweight the Financials sector (ch4).
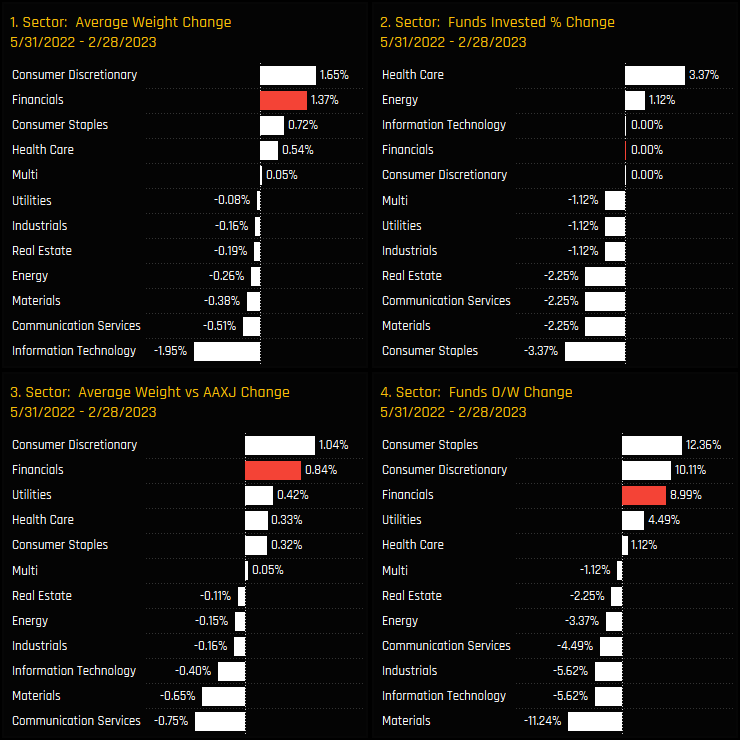
The charts below analyse the change in our ownership metrics between the most recent move higher in May 2022 and today. Financials have seen strong absolute and relative increases in positioning compared to sector peers over that period. These moves were part of a broader rotation, with Asia Ex-Japan managers scaling back exposure to the Information Technology and Materials sectors and increasing exposure to both the Consumer Discretionary and Consumer Staples sectors.
Sector Allocations & Sentiment
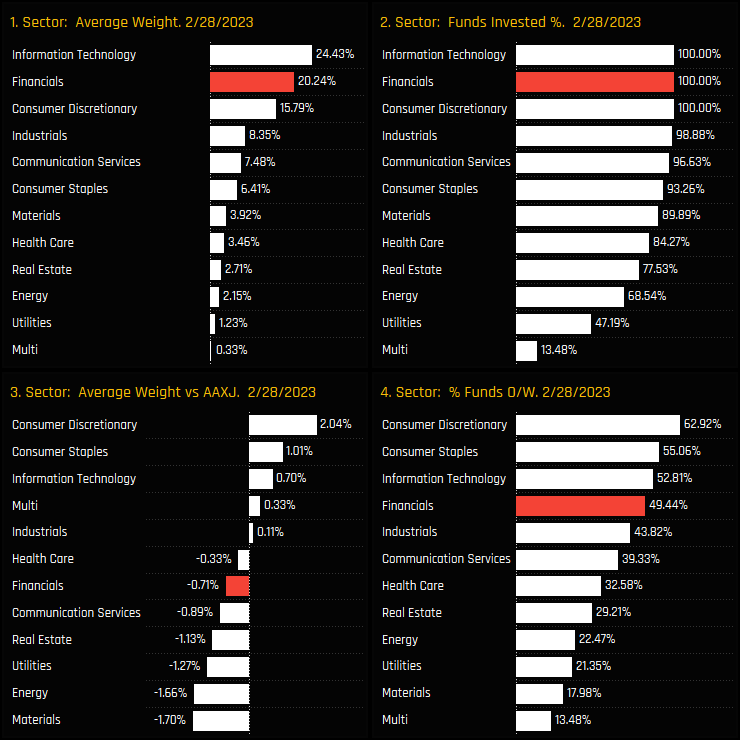
Financials are the 2nd largest sector holding after Information Technology on an average fund weight basis. On a relative basis in charts 3&4, Financials are climbing up the ranks, with almost half of the managers in our analysis positioned overweight and the key underweights now in the Materials and Energy sectors.
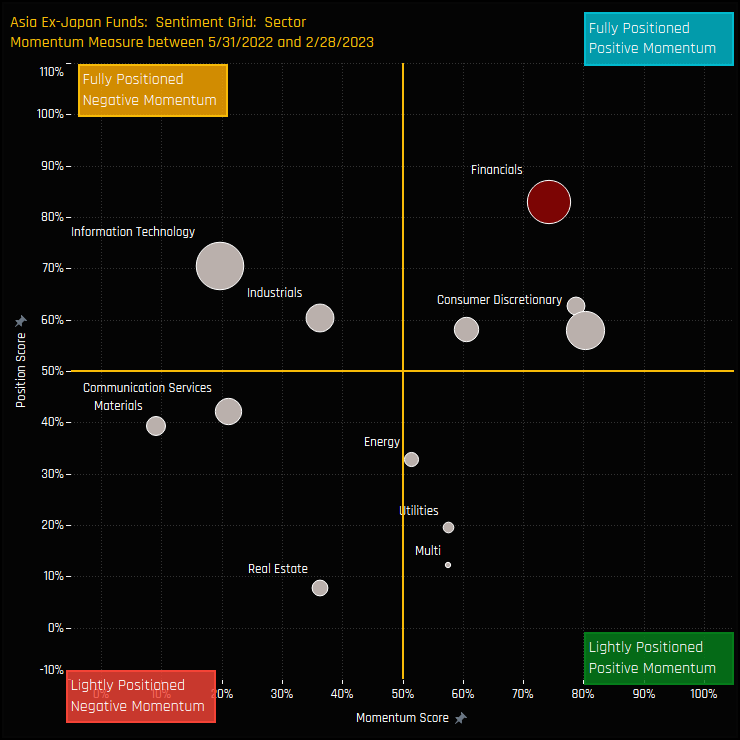
The sentiment grid below shows where current positioning in each Sector sits versus its own history going back to 2011 on a scale of 0-100% (y-axis), against a measure of fund activity for each Sector between 05/31/2022 and 02/28/2023 (x-axis). It highlights a definitive split between sectors, with Financials joining Health Care, Consumer Discretionary and Consumer Staples in the top-right quadrant, indicative of strong positioning and strong momentum among managers.
Fund Holdings & Activity
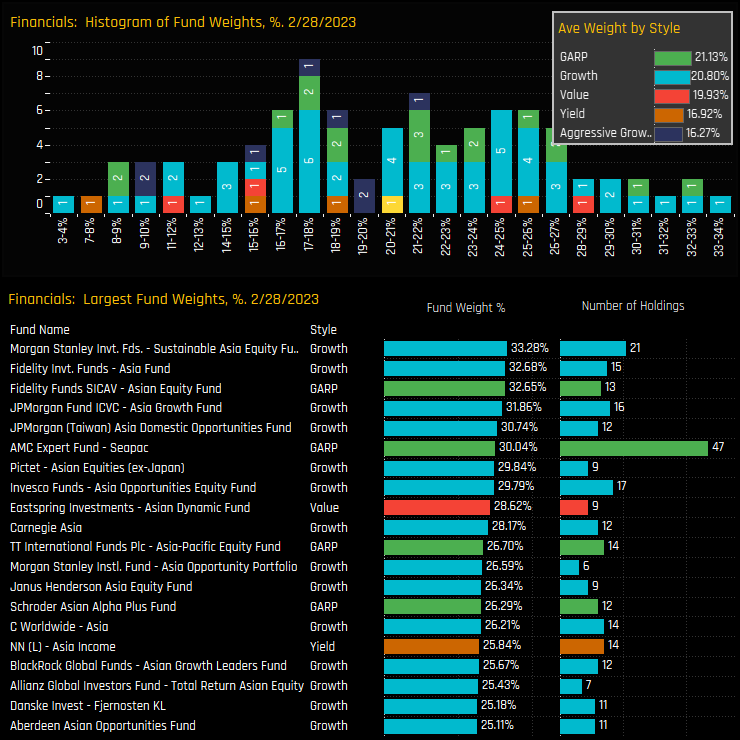
The distribution of Financials fund weights is spread over a wide range, though the majority of funds allocate somewhere between 16% and 27%. Top holders are north of 30%, led by Morgan Stanley Asia Sustainable (33.3%), Fidelity Asia (32.7%) and Fidelity Asian Equity (32.6%).
Fund holding changes between 05/31/2022 and 02/28/2023 show ownership growth across all Style groups with the exception of Yield, though changes were far from one-directional. Large increases from Jupiter Asia (+11.9%) and Wellington Asia Opportunities (+10.9%) were partially offset by reductions from Maple-Brown Abbot Asia Ex-Japan (-8.8%) and Matthews Asia Ex-Japan (-8.1%).
Financials Country Positioning
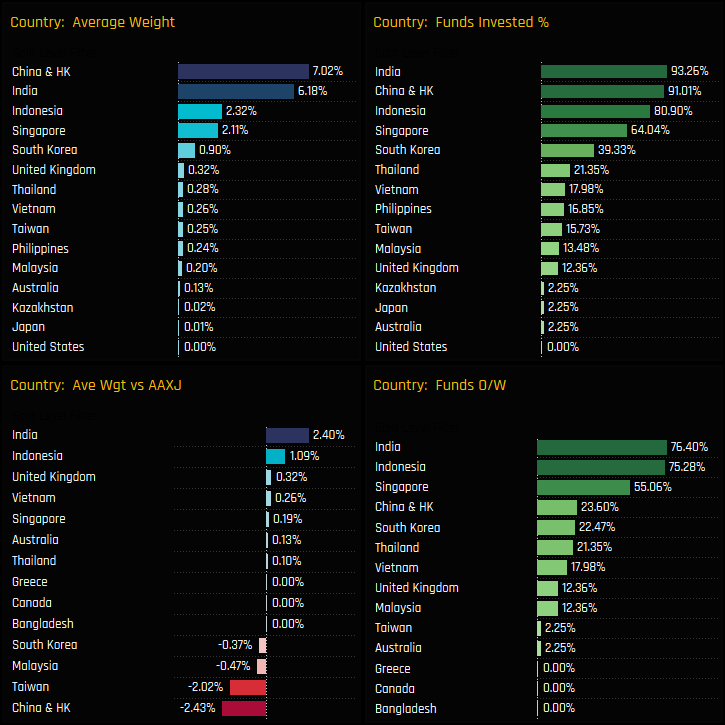
Split by Country, China & HK and India are the dominant Financials exposures, accounting for 65% of the total Financials allocation. Indonesia and Singapore form a definitive second tier before allocations really start to drop off. India and Indonesian Financials are the consensus overweights, held above benchmark by over 75% of funds, whilst Taiwan and China & HK Financials are the key underweights. South Korean, Malaysian and Taiwan Financials hold little appeal, with the majority of Asia Ex-Japan investors not invested.
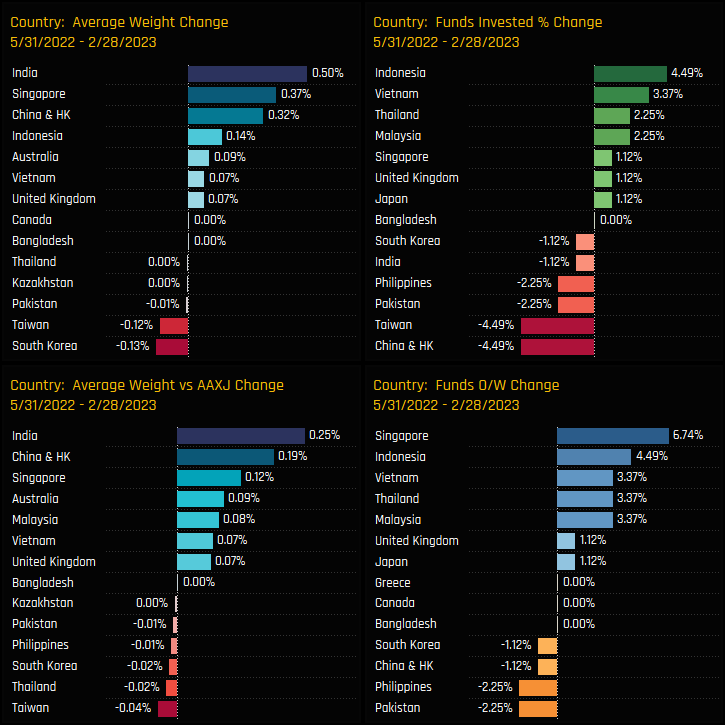
Country level activity between 05/31/2022 and 02/28/2022 highlights a mostly positive picture, with the majority of countries seeing ownership levels increase. Again though, it wasn’t a clean sweep. Whilst most of the key ASEAN nations saw ownerships levels increase, led by Indonesia and Vietnam Financials, -4.5% of funds closed their Taiwan and China & HK Financials exposure.
Country Sentiment
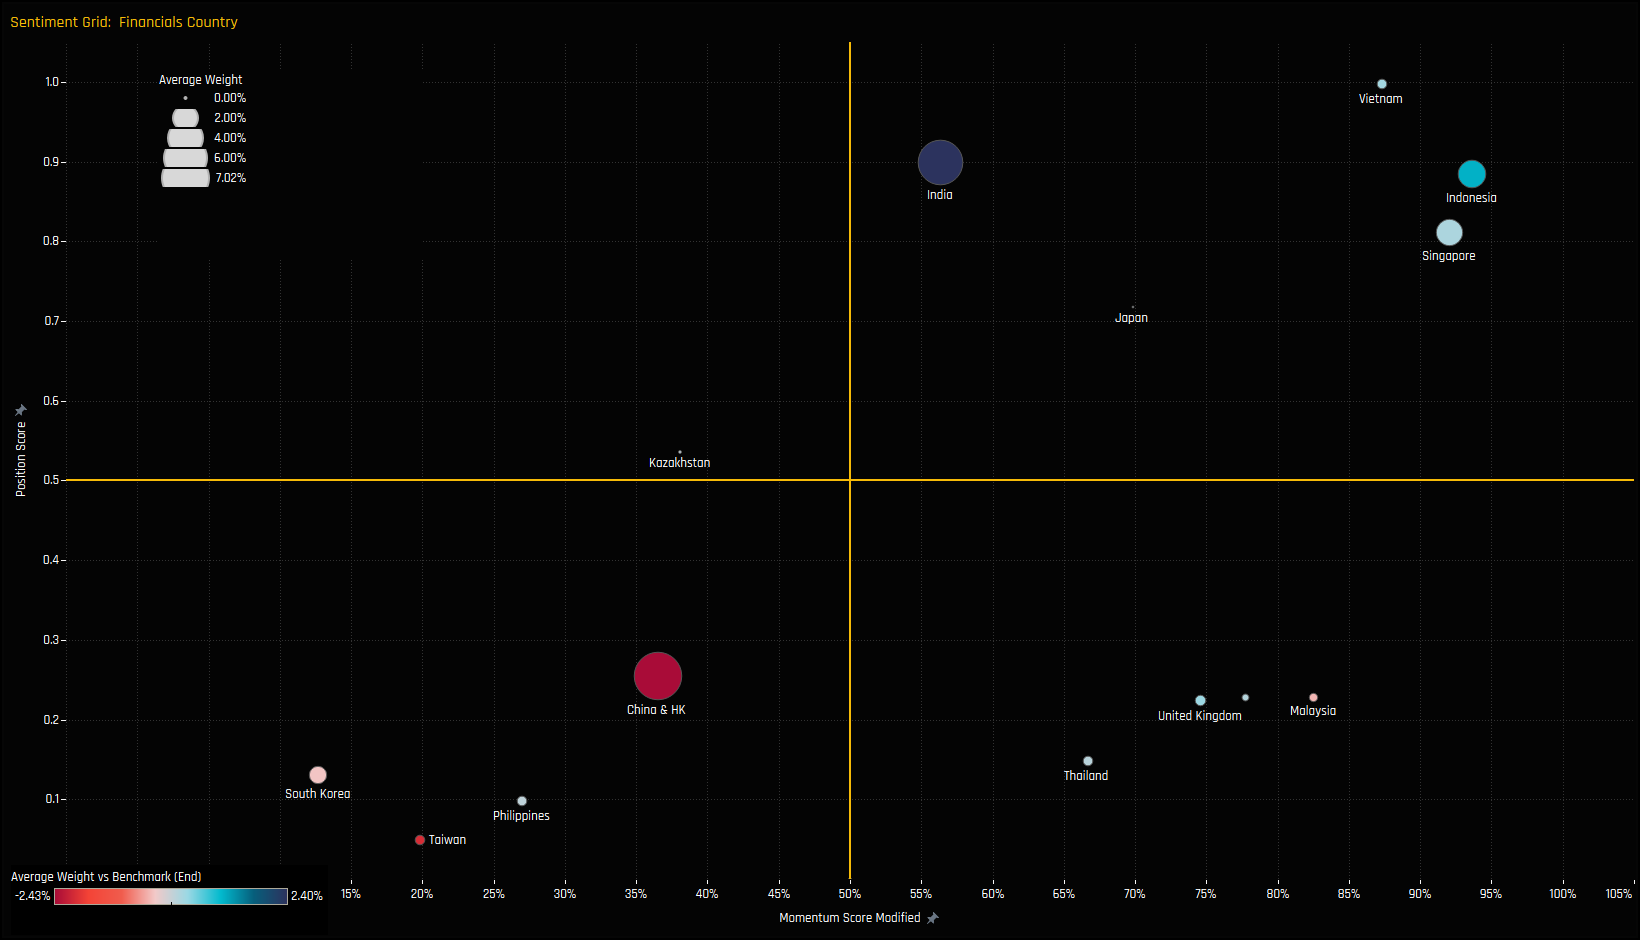
The sentiment grid below shows where current positioning in each Country in the Financials sits versus its own history going back to 2011 on a scale of 0-100% (y-axis), against a measure of fund activity for each Country between 05/31/2022 and 02/28/2023 (x-axis).
The majority of Countries find themselves in the right-hand side of the Grid, reflecting the increases in fund ownership over the period. Vietnam, Indonesia and Singapore Financials are approaching maximum levels of ownership, whilst Malaysia and Thailand are moving higher from a low base. China & HK, Taiwan, South Korea and The Philippines are suffering from outward rotation and depressed levels of positioning.
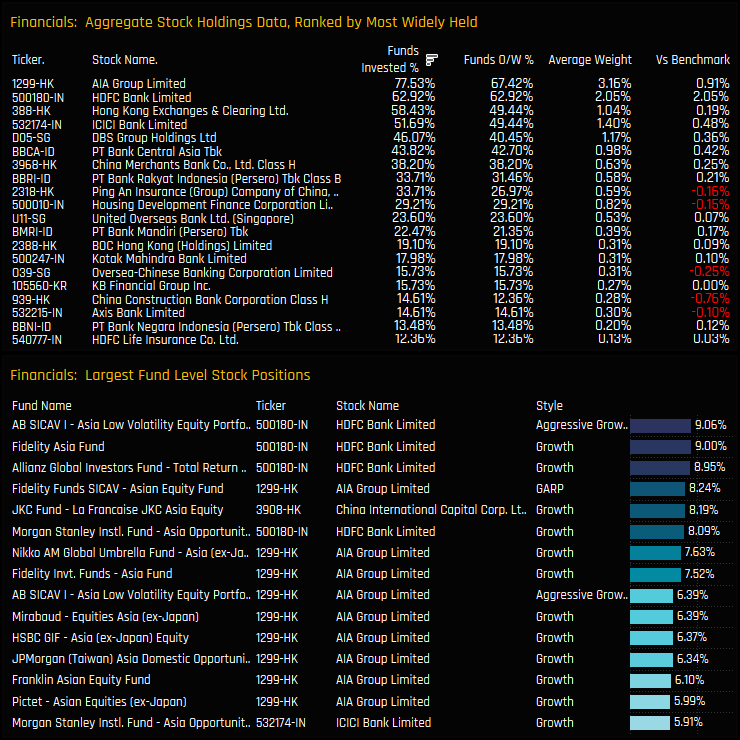
Stock Holdings & Activity
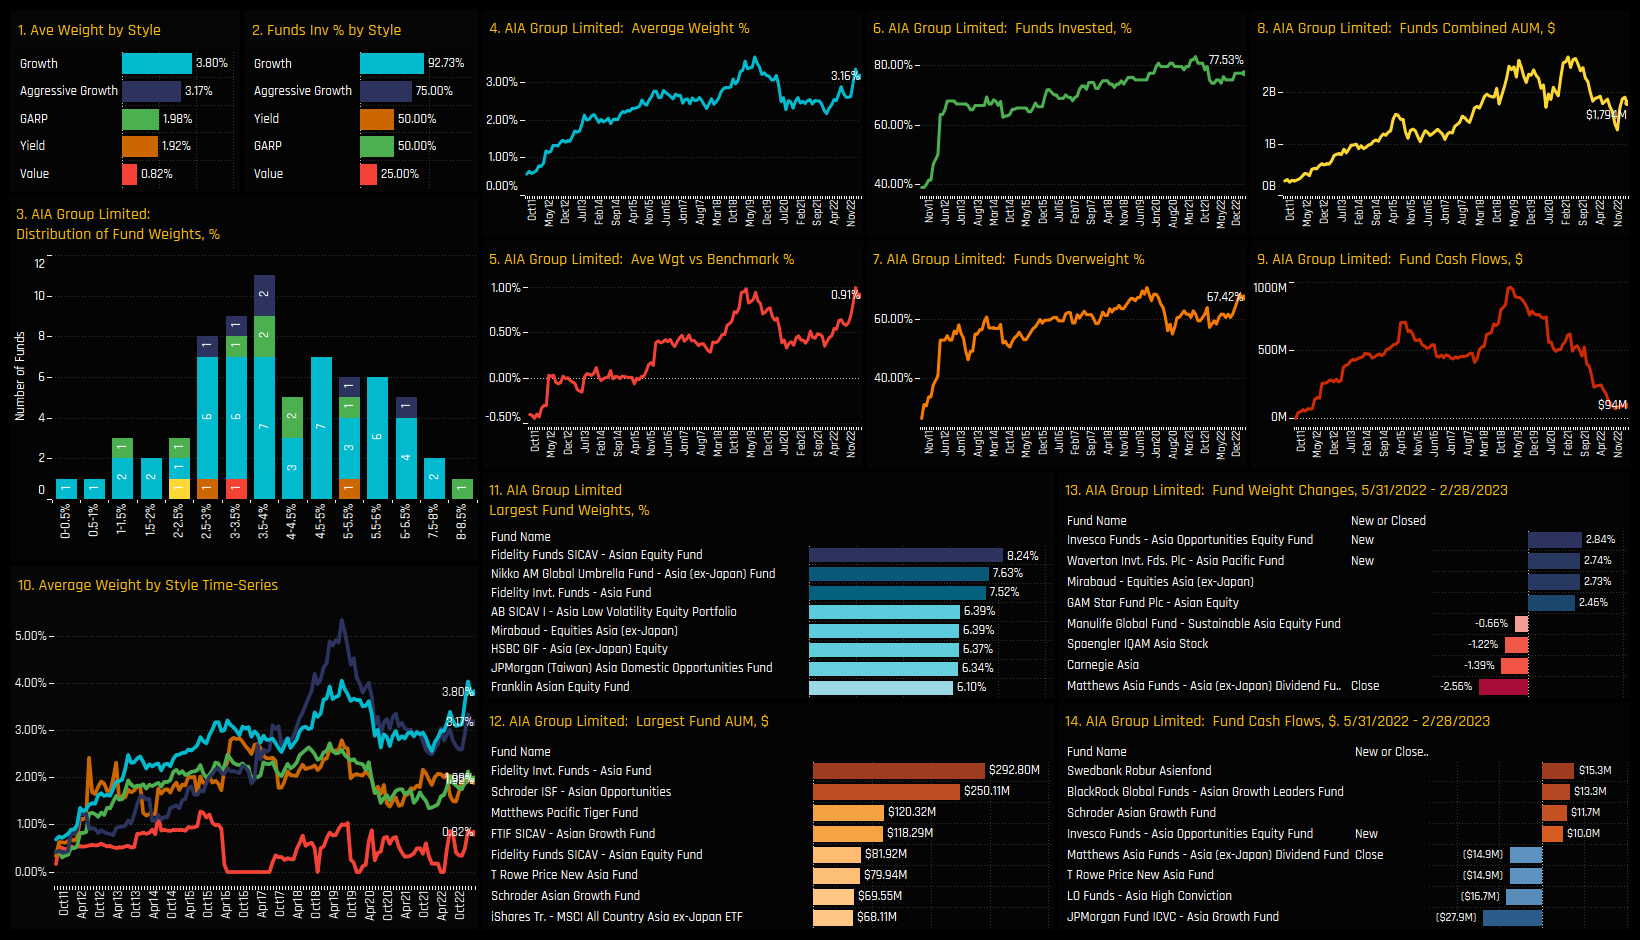
Stock exposure in the Financials sector is spread across a large number of companies. A top 6 has emerged, consisting of AIA Group, HDFC Bank, HK Exchanges & Clearing, ICICI Bank, DBS Group and PT Bank Central Asia. All 6 are held by more than 40% of the funds in our Asian analysis and all are net overweight holdings. Of the 6, AIA Group and HDFC Bank are held in larger size on a fund level, as shown in the lower chart, with AIA Group a top 5 holding for 41 funds in our analysis, HDFC Bank for 11 funds.
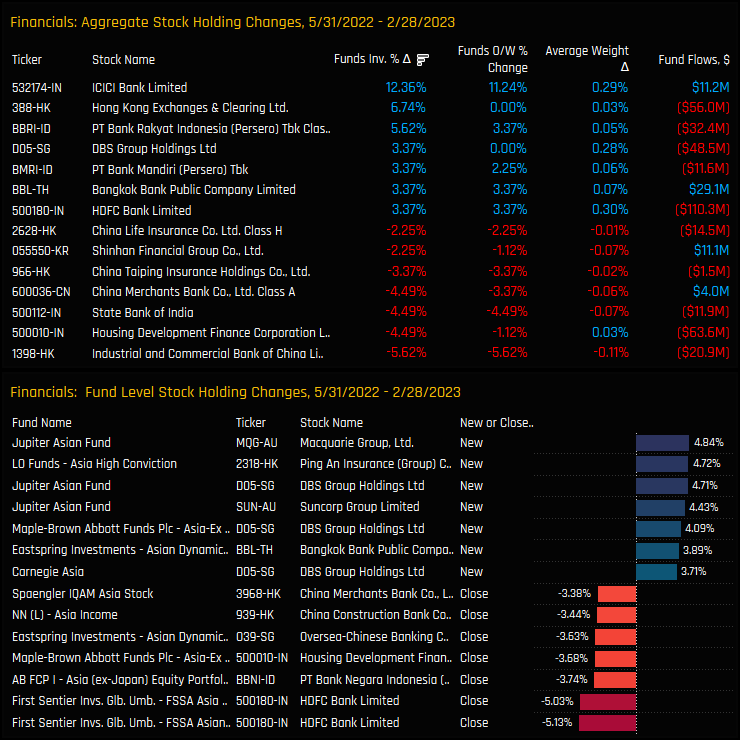
Rotation within the sector has been significant over the last 9 months. Asia Ex-Japan funds have increased holdings in ICICI Bank, HK Exchanges and PT Bank Rakyat Indonesia, whilst decreased in ICBC, Housing Development Finance Corp and State Bank of India. On a fund level, DBS Group Holdings is prevalent among the larger openings over the period, led by new positions from Jupiter, Maple-Brown Abbot and Carnegie.
Conclusions & Links
An increasing number of Asia Ex-Japan funds are positioning themselves overweight the Financials sector. Over the course of 2022 and in to 2023, managers have actively switched from underweight to overweight, though this has been a selective rotation. On a country level, selected ASEAN nations have benefited from inflows, whilst Asia Ex-Japan investors remain cautious on China & HK, Taiwan and South Korean Financials.
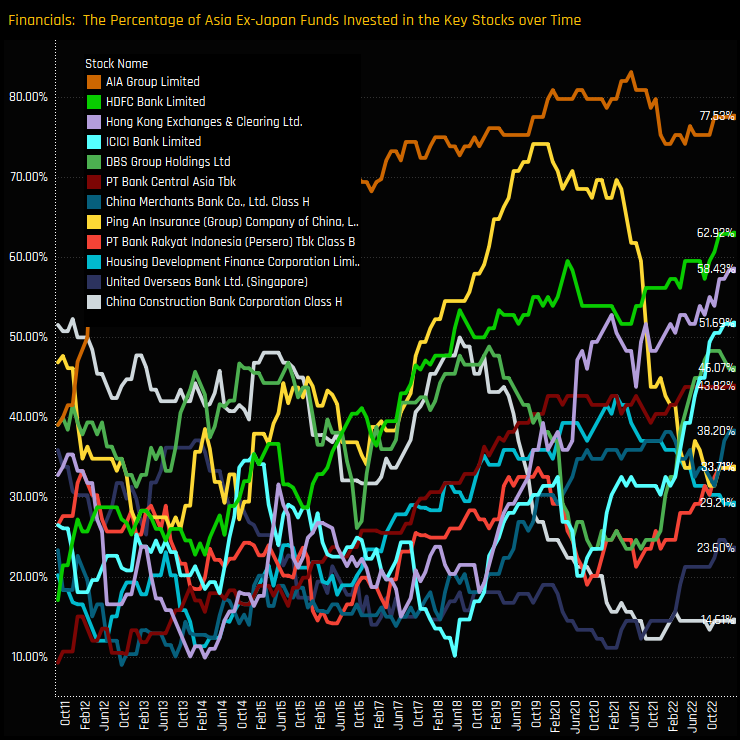
On a stock level, the sector is home to a number of high conviction holdings, led by AIA Group Limited and HDFC Bank, though there has been a strong degree of rotation among individual stocks. Over the longer-term, ownership levels have risen to record highs for a number of companies, including HDFC Bank, ICICI Bank and HK Exchanges & Clearing as the chart opposite shows. Against this, Ping An Insurance and China Construction Bank Corp have seen ownership levels fall heavily in recent years.
Please click below for an extended data report on the Financials sector. Scroll down for stock profiles for ICICI Bank and AIA Group Limited.
Philippines ownership falls to record lows among Asia Ex-Japan managers.
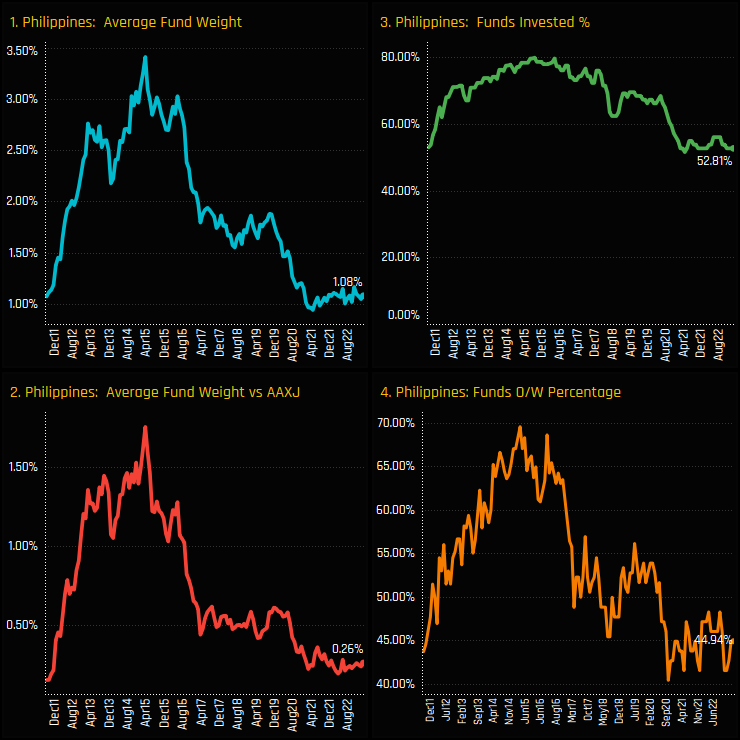
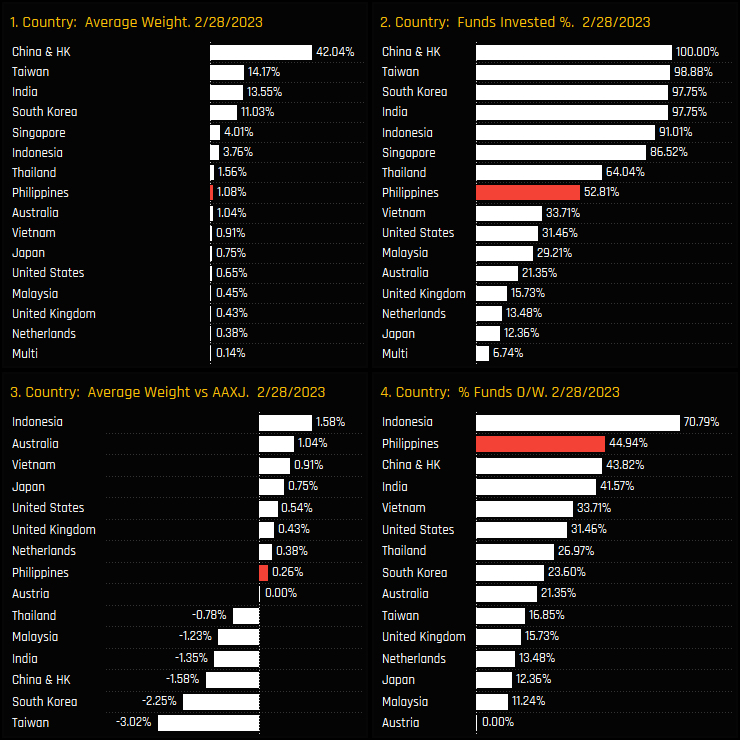
Fund ownership and aggregate exposure in The Philippines has rarely looked as bad. ASEAN as a region suffered during the early phases of the COVID pandemic, but countries led by Indonesia, then Singapore and now Thailand are making a comeback, yet The Philippines has been left behind. Average weights have traversed a horizontal path for the last 2-years (ch 1) and the percentage of funds invested is close to an all-time low on 52.8%. On a relative basis, managers are still overweight on average, but it’s a minor position at +0.26% above benchmark.
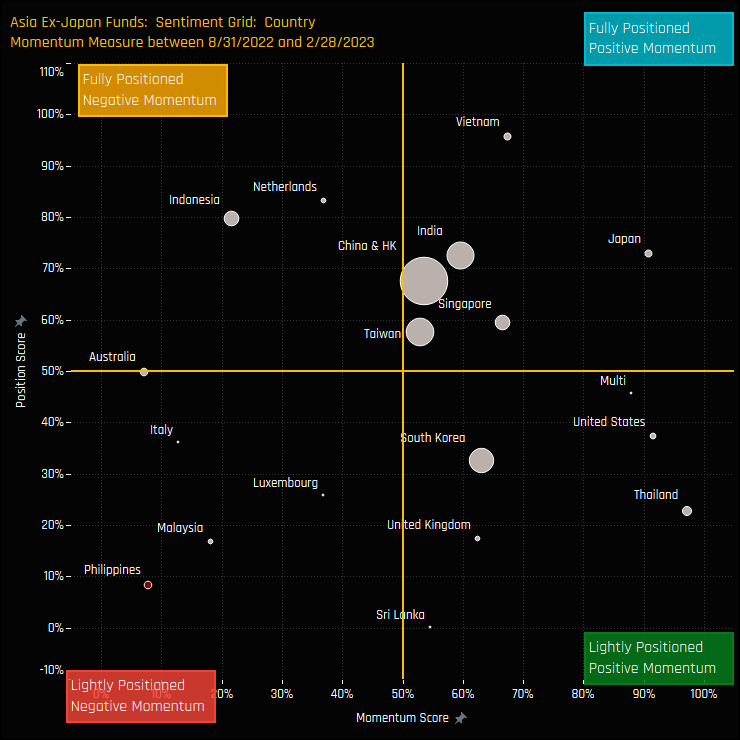
To visually depict the plight of The Philippines, the Sentiment Grid below shows where current positioning in each Country sits versus its own history going back to 2011 on a scale of 0-100% (y-axis), against a measure of fund activity for each Country between 08/31/2022 and 02/28/2023 (x-axis). The Philippines is out on its own in the bottom left-hand quadrant, with depressed positioning and negative manager activity over the last 6-months.
Fund Holdings and Activity
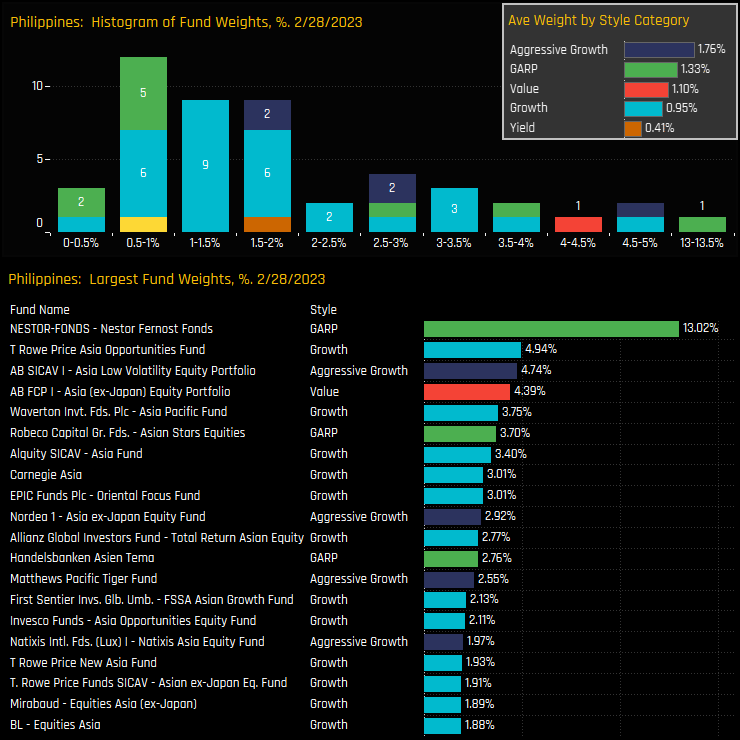
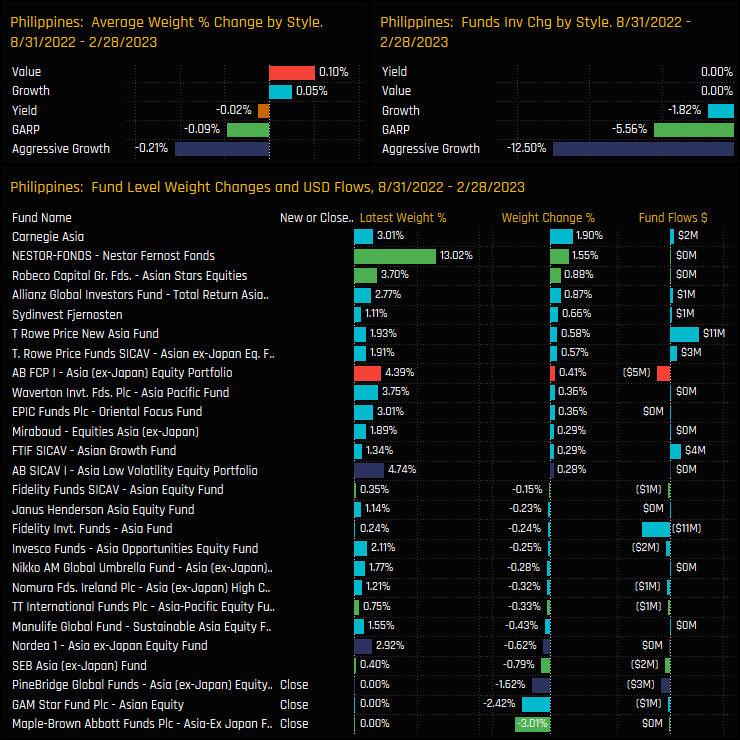
On a fund level, of the 58% of funds who have exposure to The Philippines, most hold less than a 2% stake. Aside from Nestor Fernost’s outsized position of 13%, the larger allocations top out at under 5%, with T Rowe Price, Alliance Berstein and Waverton heading the list of the top holders.
Fund activity over the last 6-months has seen some 2-way activity, with Carnegie and T Rowe Price among those increasing allocations. But it’s the closures from Maple-Brown Abbot Asia Ex-Japan (-3%), GAM Star Asian Equity (-2.42%) and Pinebridge Asia Ex-Japan (-1.62%) that stand out.
Stock Holdings & Activity
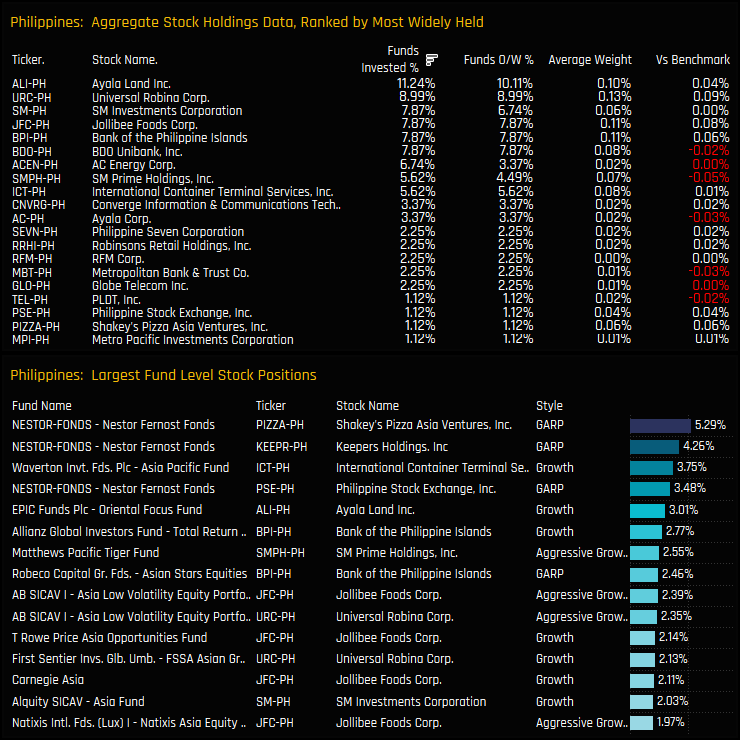
Stock holdings in The Philippines are extremely light, with the most commonly held company that of Ayala Land Inc, owned by just 11.24% of funds at an average weight of 0.10%. Individual fund level positions are mostly lower than 3%, with Nestor Fernost’s holdings in Shakey’s Pizza and Keeper’s Holdings topping the charts.
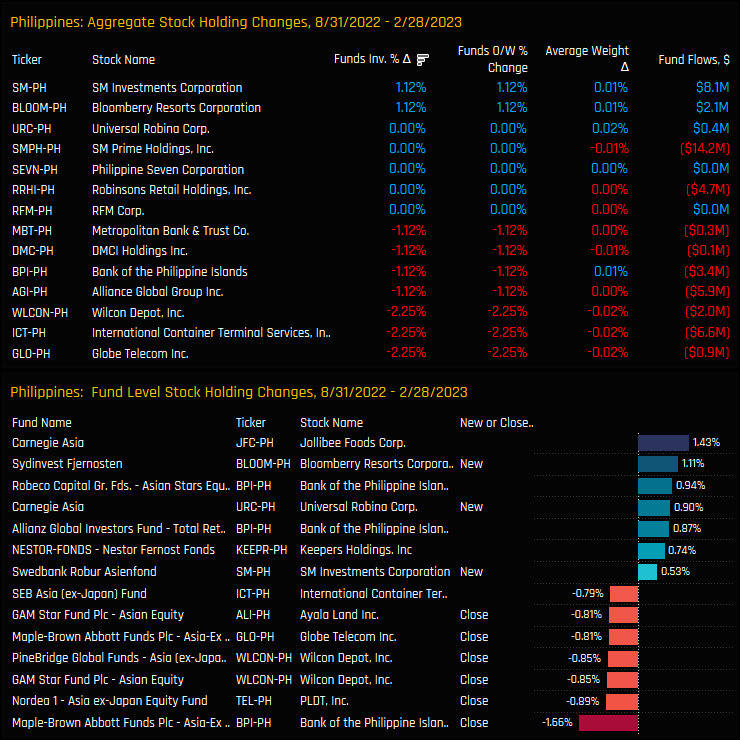
Stock rotation over the last 6-months reflects the diminishing holdings picture, with -2.25% of funds closing out holdings in Globe Telecom, International Container Terminal Services and Wilcon Depot.
Conclusion and Links
In a world where relative performance is king, the risks of NOT holding exposure to the Philippines is diminishing. Shrinking benchmark weights and a dwindling active investor base means it is becoming ever easier to avoid Philippines exposure entirely. The charts to the right show The Philippines well down the pecking order of both average fund weights (ch1) and the percentage of funds invested (ch2). Against the benchmark, the favourable rankings more reflect a small benchmark weight than a high conviction overweight.
Of course, this lack of positioning presents an opportunity for the contrarian investor, should the investment case present itself, but right now sentiment among the managers in our analysis isn’t pointing in that direction.
For more data and analysis on positioning in The Philippines among active Asia Ex-Japan investors, please click on the link opposite for the latest positioning report.
A new report that breaks down individual holding weights, AUM and activity across regions, countries and sectors.
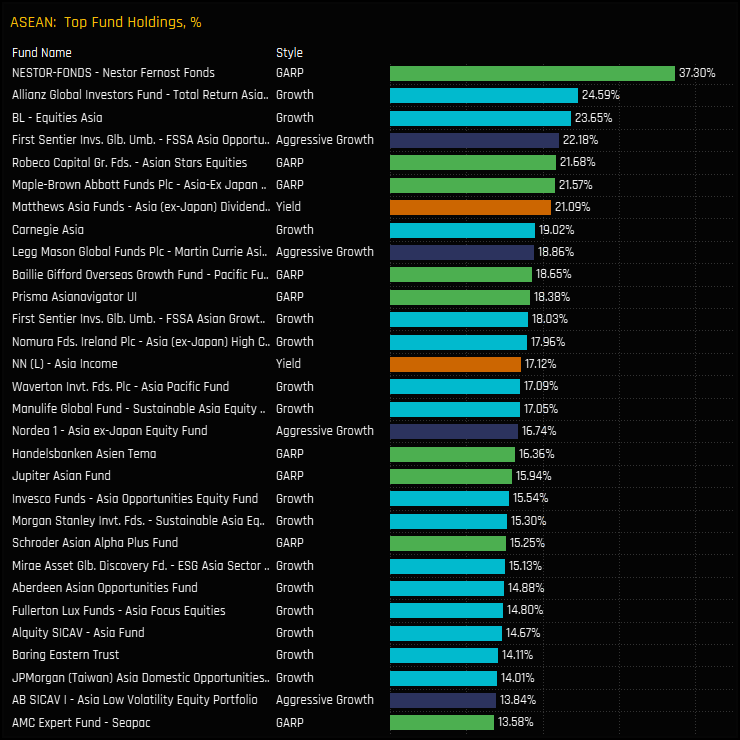
Top Holders
Lists of the largest holders on a portfolio weight and USD basis across regions, sectors and countries. Example chart below shows the largest weights in the ASEAN region.
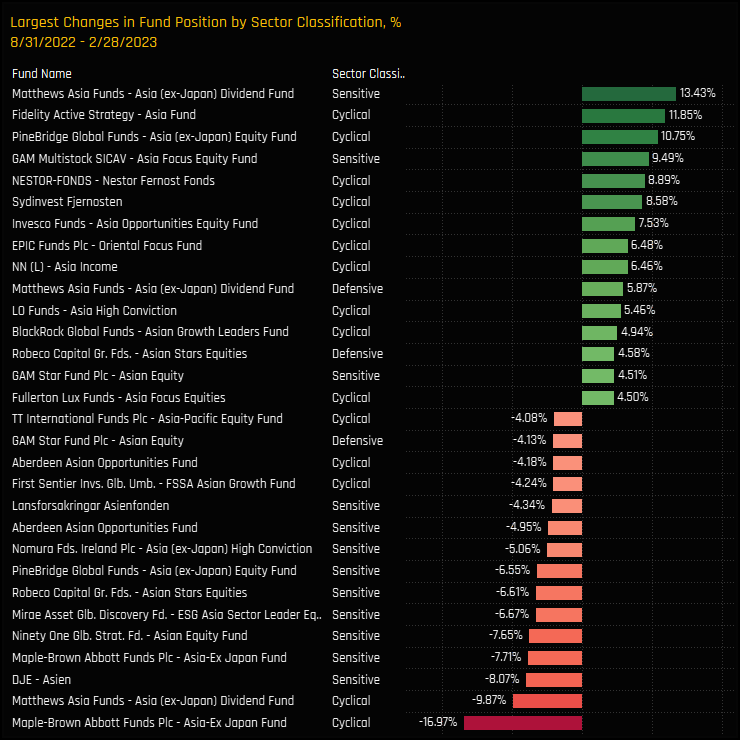
Fund Activity
The largest fund weight changes over the last 6-month period. Example chart below shows the largest changes in Sector Classification weight among the 89 funds in our analysis.
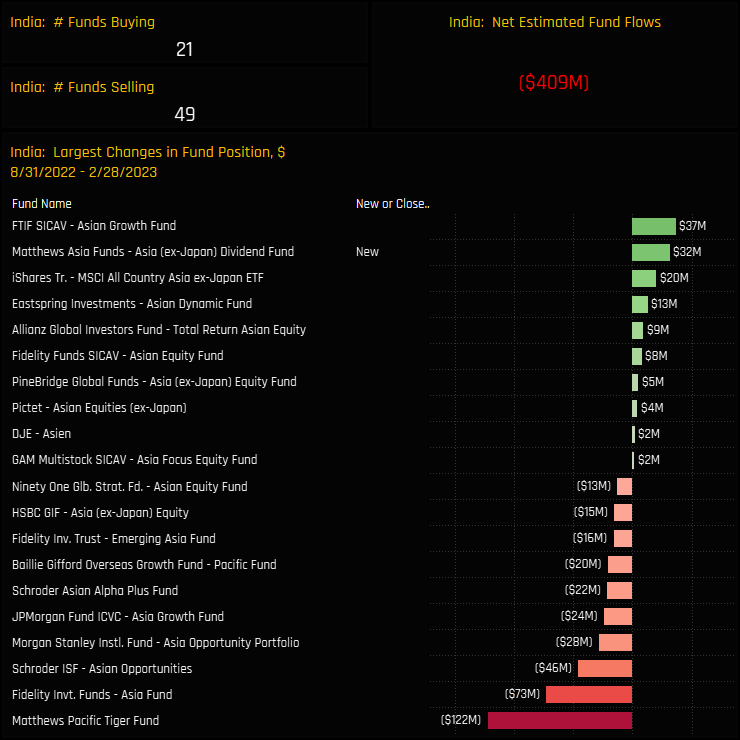
Fund Flows, $
Fund flows are also captured, with each 2-page dossier on the major sectors, regions and countries breaking down the largest flows on a fund level. The below chart shows the largest flows in India, the number of buyers and sellers and the net flows out of the country over the last 6-months.
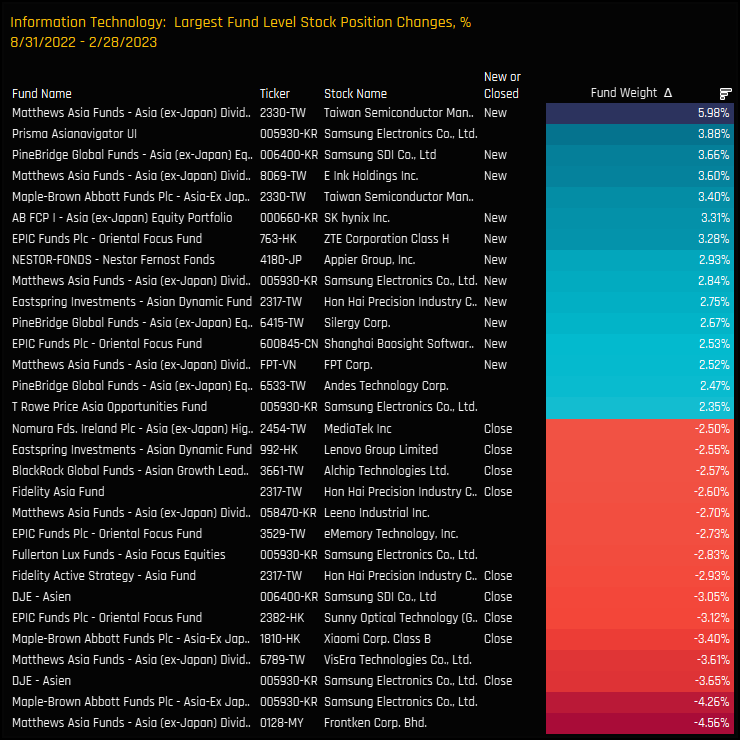
Stock Holdings
On a stock level, the report provides details on the largest stock holdings on a weight and US dollar level, together with the key changes and fund flows. The below chart shows the largest stock weight changes over the last 6-months in the Information Technology sector.
Download
Please click on the link opposite to access the full report
For more analysis, data or information on active investor positioning in your market, please get in touch with me on steven.holden@copleyfundresearch.com


