Asia Ex-Japan Funds: Q3 Performance & Attribution

92 Asia Ex-Japan funds, AUM $60bn.

Q3 Performance & Attribution

In this piece, we provide an overview of Q3 performance among the Asia Ex-Japan active funds in our analysis. We look at quarterly performance broken down by Style and Market Cap focus, together with longer-term analysis of active versus passive. We then breakdown this quarter’s performance based on the average active Asia Ex-Japan fund stock portfolio versus the iShares MSCI Asia Ex-Japan ETF (AAXJ).

Q3 Active Returns

The last quarter was a challenging one for active Asia Ex-Japan managers. The return distribution shows the bulk of managers losing between -18% and -14% over the period, with the average of -13.76% largely in line with the benchmark. Aggressive Growth and Value managers were the only Style groups to outperform over the period, driven by stronger returns from the Small/Midcap end of the spectrum.

The top and bottom performers on the quarter are listed below. On top is the Value strategy of Maple Brown Asia Ex-Japan on -2.27%, followed by the Aggressive Growth funds of First Sentier and Morgan Stanley’s Sustainable Asian Growth. On the negative side, Aberdeen Asian Opportunities lost more than a 5th of its value in Q3.

Returns by Style & Market Cap Focus

The grid below shows the top 3 and bottom 3 performers in each Style and Market Cap bucket

Long-Term Performance

The moderate outperformance in Q3 has helped stem the tide of underperformance seen in both Q1 and Q2, with September’s outperformance of +1.2% a big boost for active managers. Still though, the 5 consecutive months of underperformance between Dec 21 and April 22 has driven underperformance to -2.46% over the last 12 months.

Over the longer-term, Asian active managers have generally had more periods of outperformance than underperformance, beating the benchmark in 9 of the last 15 years.


Fund Positioning

We now analyse the drivers behind this quarter’s absolute and relative performance. We start by looking at the average stock portfolio generated from the holdings of the 92 funds in our Asia Ex-Japan analysis. This is the portfolio we use for our monthly positioning analysis. The largest absolute weights are in China & HK Consumer Discretionary (12.59%), Taiwan Technology (11.92%) and China & HK Financials (7.09%). On a stock level, Taiwan Semiconductor tops the list, with average holding weights of 7.21%, followed by average Cash Holdings (4.29%) and Tencent Holdings (4.03%). The top 40 stocks listed in the right-hand table account for 50.21% of the total portfolio.

Fund Performance

The performance of the active Asia Ex-Japan portfolio came in at -12.64% on the quarter. This differs slightly from the ‘average fund performance’ of -13.76% due to a combination of fees, delays in fund reporting and the fact that we take monthly snaps of each portfolio. The charts below show the performance of each country, sector, country sector and stock in the portfolio. The underperformance of China & HK is a standout, specifically in Materials and Technology, though Taiwan and South Korea weren’t far behind. The outperformers were in India and Indonesia.

Portfolio Contribution

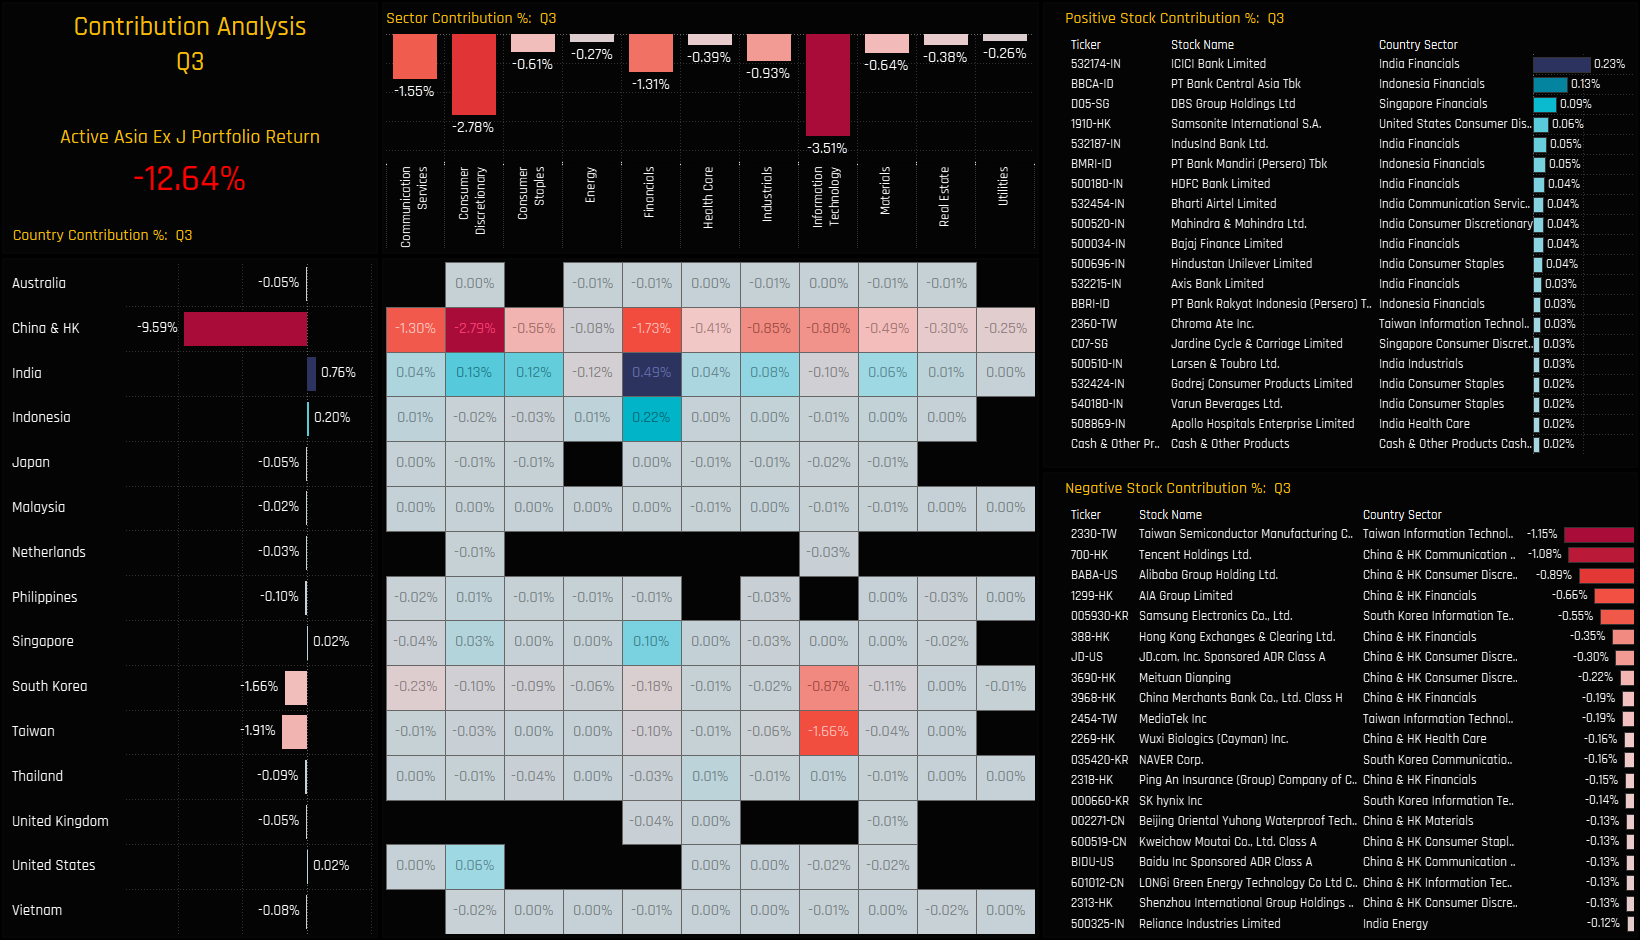
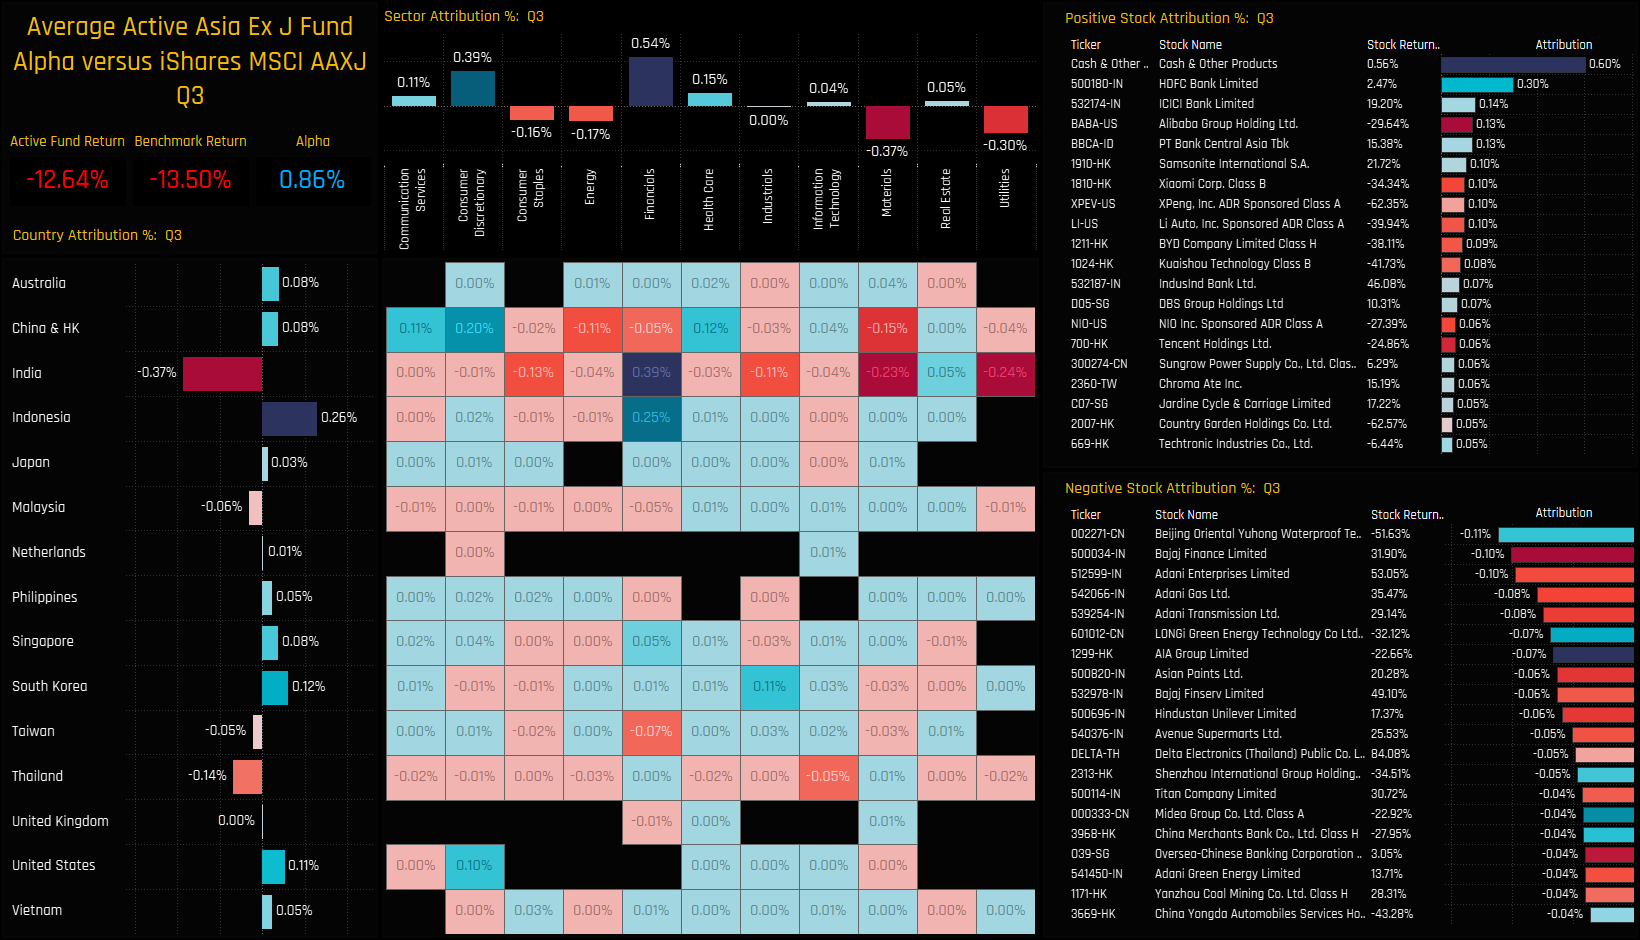
Marrying the performance of each portfolio component with the weight in the active portfolio provides the contribution of each country, sector and stock to the overall quarterly performance of -12.64%. China & HK alone accounts for -9.59% of that return over the quarter, with particular negatives coming from Consumer Discretionary (Alibaba, JD.Com), Communication Services (Tencent, Baidu), and Financials (AIA Group, HK Exchanges). Taiwan Technology (TSMC, MediaTek) and South Korean Tech (Samsung Electronics, SK Hynix) also dragged on overall returns. Financials in India and Indonesia provided some respite on the upside, led by ICICI Bank Limited and PT Bank Central Asia.

Relative Fund Positioning

To understand the drivers of the outperformance over the quarter, we first need to look at the positioning of the active portfolio in relation to the benchmark. We use the iShares MSCI Asia Ex-Japan ETF (AAXJ) as our benchmark proxy. On a sector level, underweights in Utilities, Communication Services and Energy are offset by overweights in Consumer Discretionary, Consumer Staples and Information Technology. Financials shows some significant deviations from benchmark, with overweights in India and Indonesia offset by underweights in China & HK and Taiwan.

Portfolio Attribution

Marrying the performance of each portfolio component with the relative overweights and underweights in the active portfolio provides the attribution of each country, sector and stock to relative returns. The portfolio generated overall outperformance of +0.86% on the quarter, differing slightly from the outperformance of +0.07% derived from the fund performance for the reasons stated above, and the fact that we are using the ETF and not the MSCI Index. On a sector level, Financials (India/Indonesia) and Consumer Discretionary (China & HK, US) generated outperformance versus underperformance from Materials (India, China & HK) and Utilities (India). Outperformance from Indonesian overweight positions were offset by outperformance from key Indian underweights. On a stock level, Cash positions, overweights in HDFC Bank / ICICI Bank and underweights in Alibaba Group Holdings were key drivers of outperformance. Overweights in Beijing Oriental Yuhong Waterproof Technology, underweights in Bajaj Finance and the 3 Indian Utilities were costly to Asia Ex-Japan managers over the quarter.

For more analysis, data or information on active investor positioning, please get in touch with me on steven.holden@copleyfundresearch.com