275 Active GEM Funds, AUM $370bn
EMEA Focus: Allocations Hit All-Time Lows
In this piece, we provide a comprehensive analysis of EMEA country positioning among active GEM equity funds. After the demise of Russia, active EM managers are positioned at their lowest ever levels in the EMEA region, moving from a multi-year overweight to a key underweight in little over 12 months. On a country level, we find a clear rotation out of CE3, Turkey and of course, Russia towards the MENA regions and to a lesser extent, South Africa and Greece.
Regional Ownership Picture
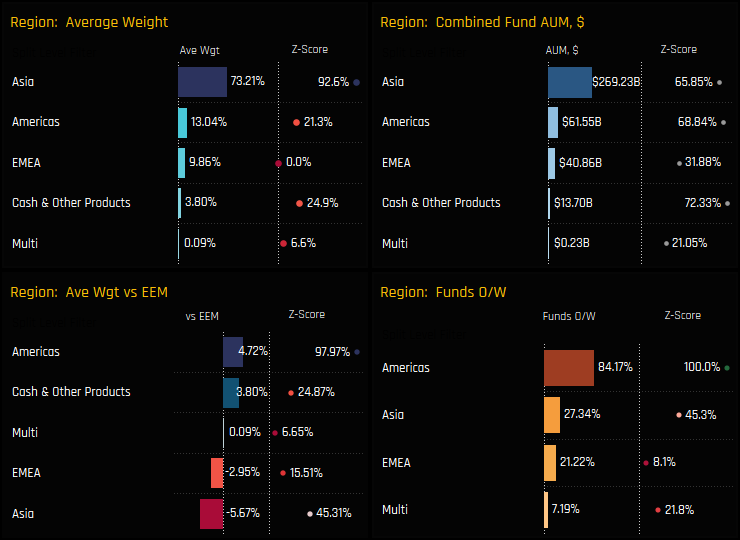
The EMEA region now sits 3rd in the pecking order of EM regional fund allocations, with a clear gap to the Americas in 2nd place and a gulf to the dominant Asian countries (top left chart below). Versus the benchmark, the Americas have become a consensus overweight, with a record 84.2% of funds overweight (bottom right) at an average +4.72% above benchmark (bottom left). Following the demise of Russia and the addition of Saudi Arabia to the benchmark index, EMEA has moved to a consensus underweight position, with just 21.2% of managers positioned higher than the benchmark iShares MSCI Emerging Markets ETF (EEM).
Regional ownership changes over the last 6-months are highlighted in the charts below. Between the reporting period 02/28/2022 – 08/31/2022, active EM managers have favoured the Americas, with average weights increasing by +0.89% (top left), positive fund flows (top right) and an increase in the number of funds positioned overweight (bottom right). Against this, EMEA saw average weights fall by -1.16% and sizeable fund outflows of -$7.5bn, though there was a small increase in the percentage of funds positioned overweight of +2.16%. Exposure levels across Asia also fell, with all 4 measures of ownership moving lower over the period.

EMEA Focus
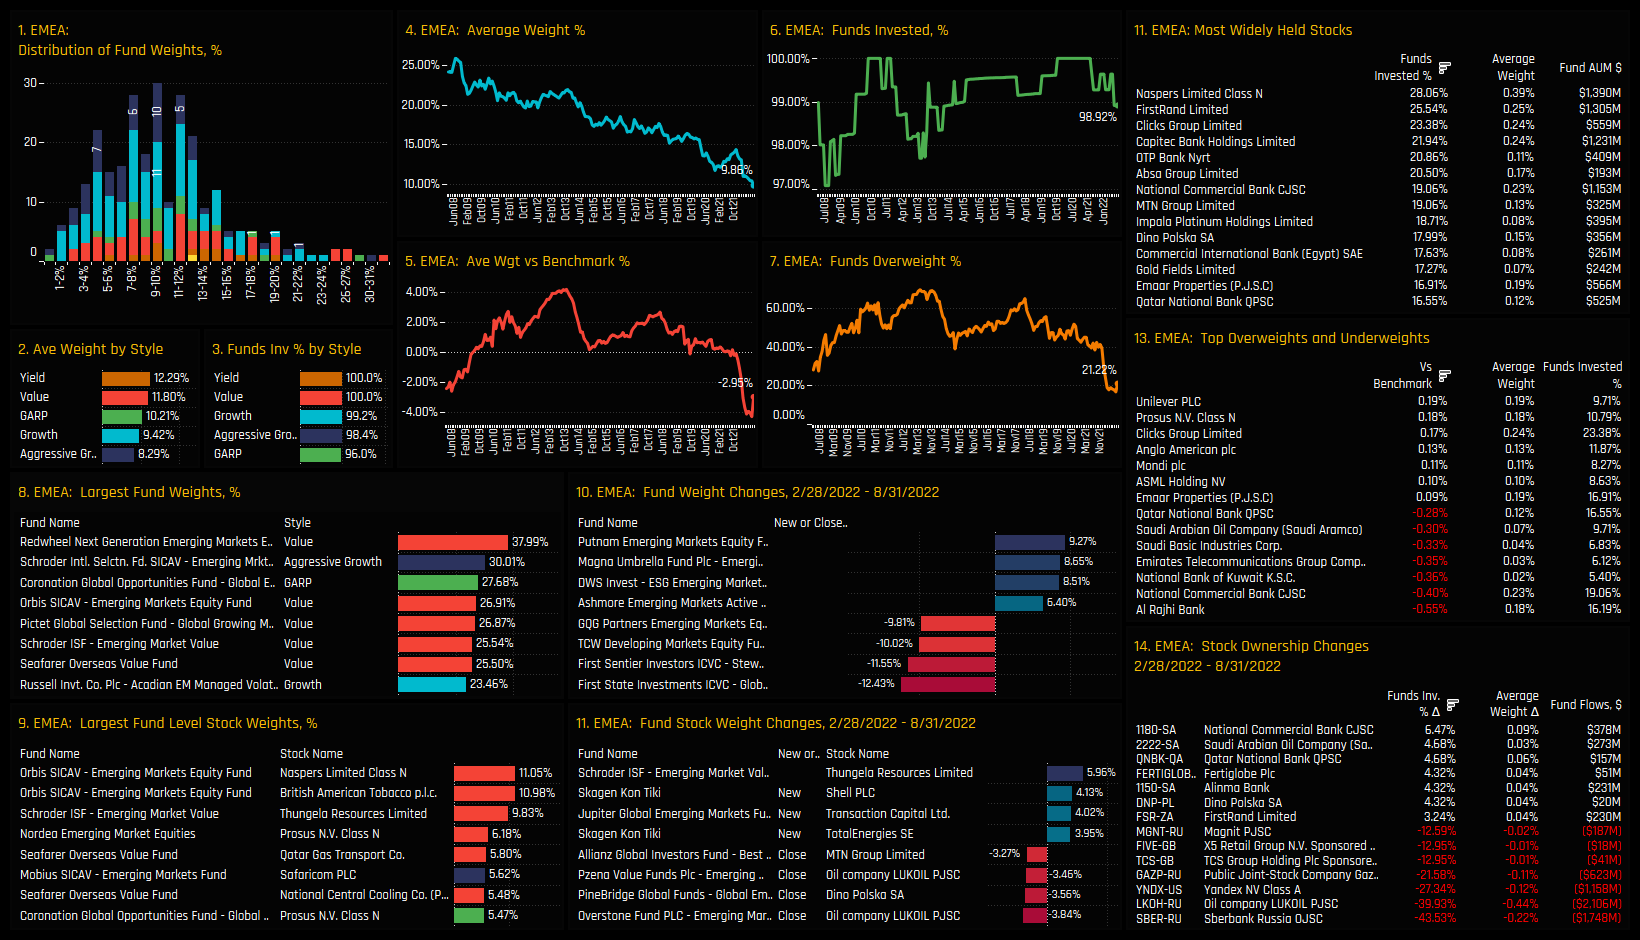
The 14 charts in the dashboard below capture the various ownership metrics for investment in the EMEA region among active EM funds. Charts 1-3 show the distribution of EMEA portfolio weights and the average weight split by style. It shows the peak of the distribution around 9% with a reasonably long tail to the upside. The Style split clearly favours the Value end of the spectrum, with average Value fund weights of 11.8% backed up by outsized positions from Redwheel Next Generation EM Equity (37.8%) and Orbis Emerging Markets Equity (26.9%).
The time-series of average weights (ch4) shows EMEA allocations at their lowest ever levels, with a corresponding fall in the relative weight (ch5) as more funds move to underweight (ch7). The 4 most widely held stocks are in South Africa (ch11) whereas all of the top underweights are in the MENA region (ch13). Activity over the last 6-months shows increased holdings in a host of MENA stocks, led by National Commercial Bank and Saudi Aramco, whilst Russian equities bore the brunt of the selling (ch14).
Country Ownership Picture
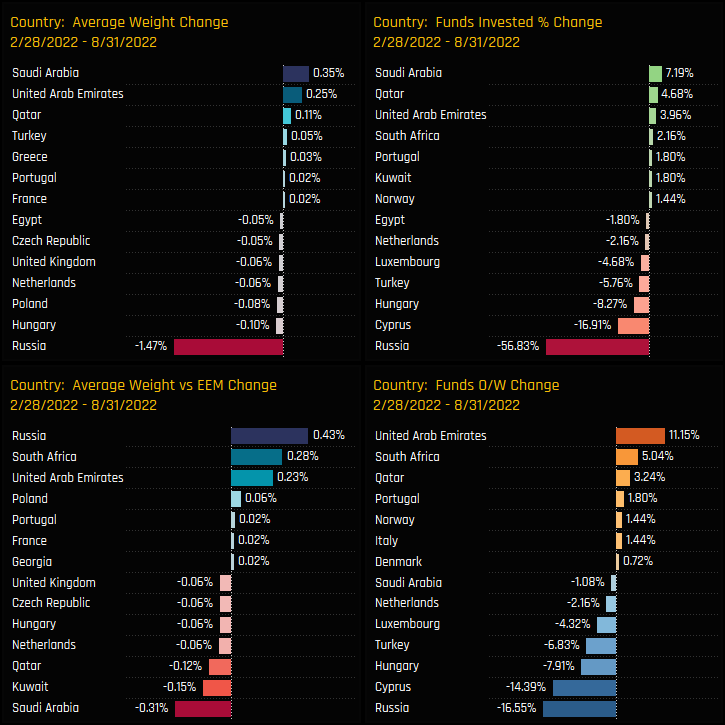
The latest snapshot of EMEA country ownership among active GEM funds is shown in the 4 charts below. On an absolute basis, South Africa tops the list with average weights of 3.33%, followed by Saudi Arabia (1.24%), non-benchmark UK stocks (0.9%) and the United Arab Emirates (0.8%). The rest of EMEA’s ‘old guard’ occupy an ever diminishing slice of EM country allocations, ranging from Turkey (0.53%) down to Czech Republic (0.11%). Relative to benchmark, EM related holdings in the UK, the Netherlands and France occupy the top 3 overweight country positions, with active managers running sizeable underweights in Saudi Arabia, Qatar and Kuwait.
Changes over the last 6-months are dominated by the exodus out of Russia, with 56.8% of managers closing positions and average weights falling by -1.47%, on average. Saudi Arabia was the key beneficiary during this period, with +7.19% of funds opening positions and average weights increasing by +0.35%. Qatar, the U.A.E and South Africa also captured ownership increases over the period, though not enough to offset the drop in Russian allocations, which clearly found their way outside of the EMEA nations.

Country Sentiment
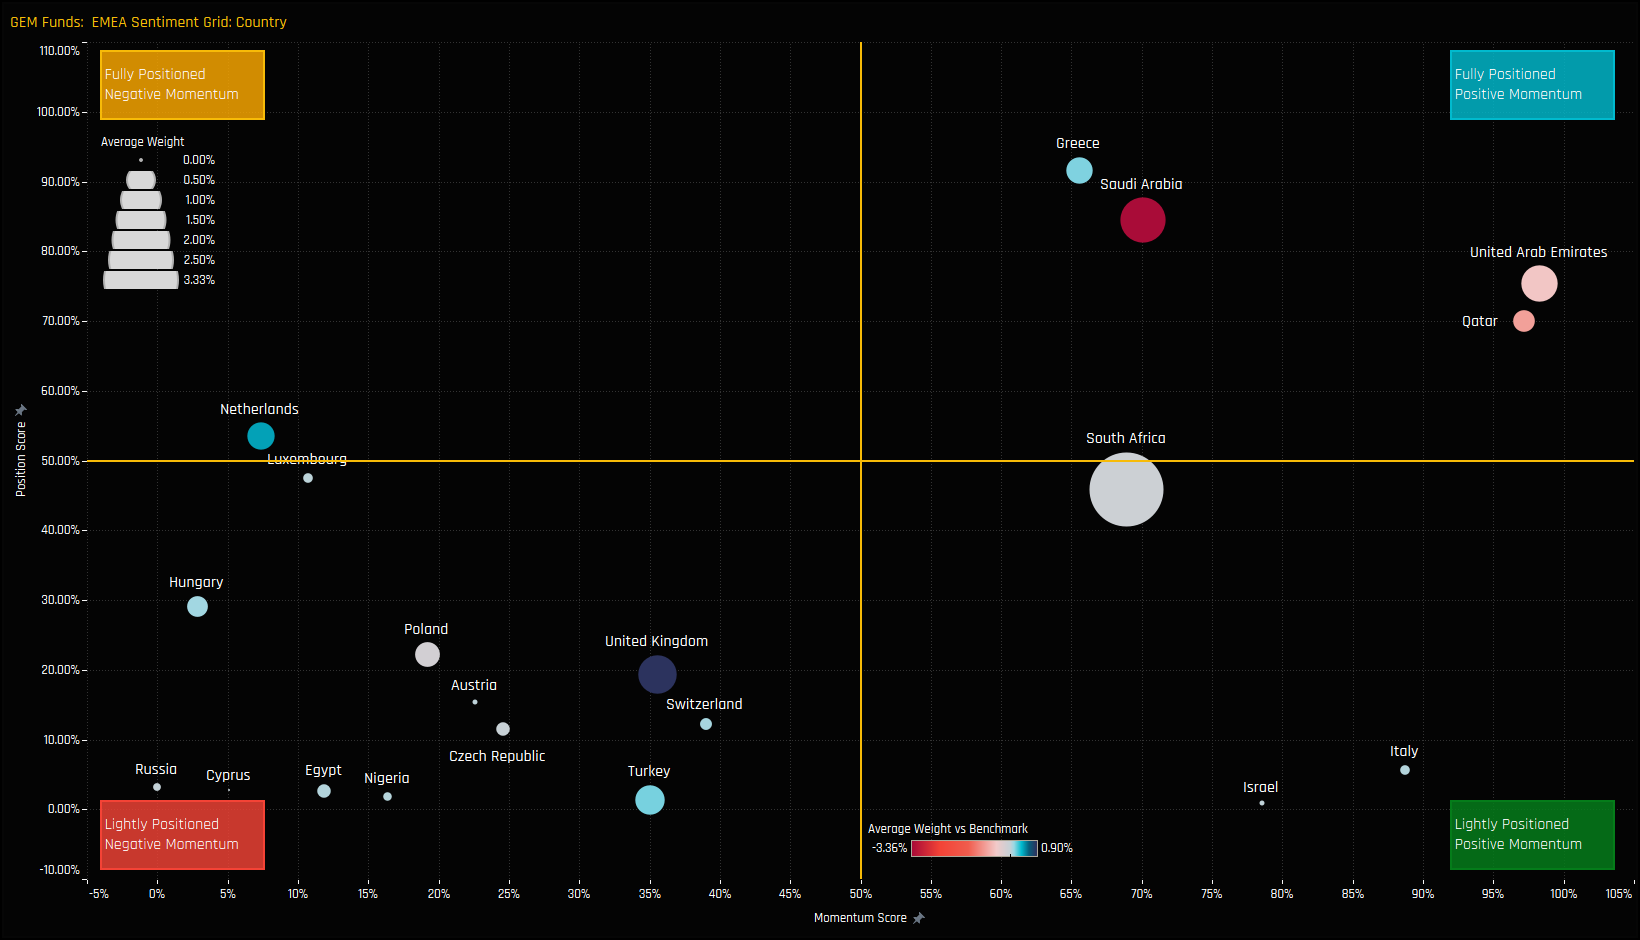
The chart below shows where current positioning in each country sits versus its own history going back to 2008 on a scale of 0-100% (y-axis), against a measure of fund activity for each country between 02/28/2022 and 08/31/2022 (x-axis). The size of the bubble represents the average fund weight in that country and the colour its weight versus the iShares Emerging Markets EEM ETF.
We can split the countries in to 2 groups. Firstly, the group of 5 major EM countries that sit on the right-hand side of the grid, indicative of net positive activity among managers over the last 6-months. Positioning levels in Greece, Saudi Arabia, Qatar and the U.A.E are towards the higher end of their historical ranges, with South Africa more towards the middle. The 2nd group consists of the CE3 countries, Turkey and Russia, all on the bottom left hand side of the grid, indicative of negative manager activity and allocations that are towards the lower end of their historical ranges.
South Africa
South Africa is something of a fallen angel when it comes to EM investment. The time-series of average weights (ch4) show South African allocations towards the lower end of the long-term range, but stabilizing from the lows of December last year. In addition, the average underweight has tightened to —0.07% (ch5) as an increasing number of funds position themselves overweight the benchmark index (ch7). Chart 1 shows the holding distribution, with the majority of managers allocating less than 8%, though there is reasonably long tail to the upside. The Style split favours the Value end of the spectrum, with Schroders EM Value (18.84%), Pictet Global Growing Markets (15.7%) and Orbis EM Equity (14.03%) the largest holders, pushing the average Value fund allocation to 4.28%.
The most widely held stocks are Naspers, owned by 28.1% of managers, followed by FirstRand Limited (25.5%) and Clicks Group (23.4%). Overweights in Clicks Group and Mondi plc are offset by underweights in Standard Bank Group and Sasol Limited. Stock rebalancing over the last 6-months has been skewed to the buyside, with +3.24% of funds opening positions in FirstRand Limited, Sibanye Stillwater and Nedbank Group. On the negative side, -2.16% of managers closed positions in Barloworld Limited and -1.8% in Mondi plc. Overall, managers are quite well exposed to South Africa, with 89.2% of managers holding some exposure and 41.4% overweight the benchmark, though absolute weights are well below the 5%-6% range that existed through 2008 – 2019. South Africa certainly hasn’t been the ‘go to’ beneficiary of the Russian decline.
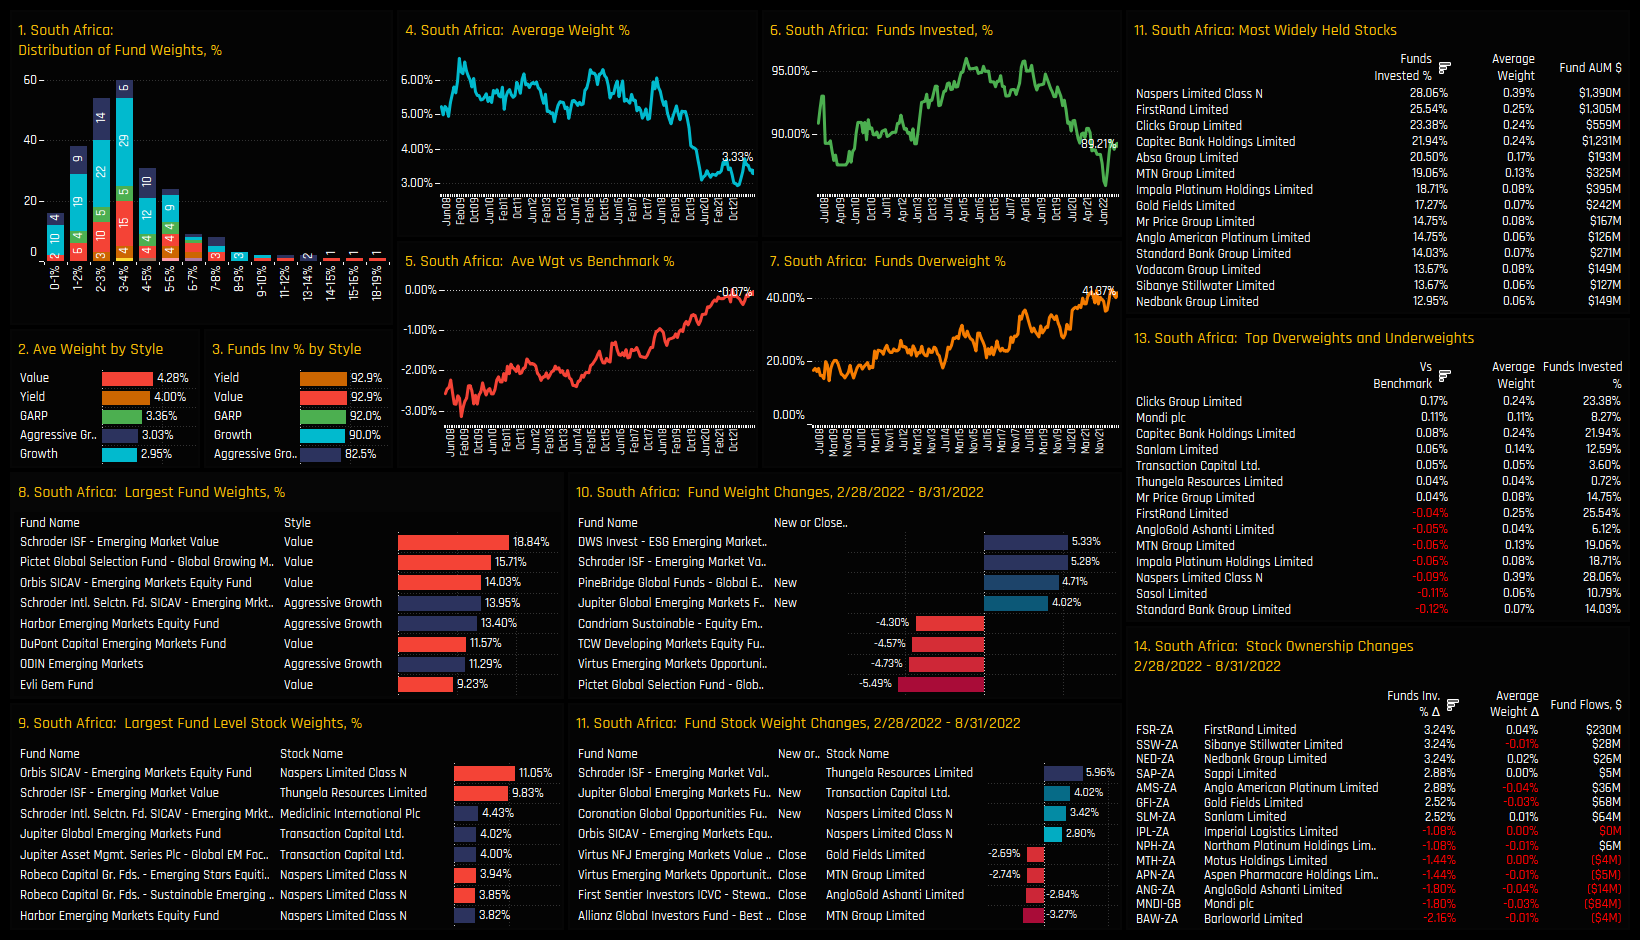
Click on the link below for the latest data report on South African positioning among active GEM funds.
Saudi Arabia
Saudi Arabia has seen an incredible boom in GEM fund ownership over the last 3-years. A record 38.85% of managers now have exposure to Saudi Arabian stocks, though only 4.7% are overweight the benchmark. The low average weight of just 1.24% is down to the 61.15% of funds who do not hold a position at all, pushing underweights to a record -3.36% below benchmark. Those that do have exposure typically hold between 0% – 5%, with a tail the upside led by Quoniam EM Minrisk (12.48%) and UNI Global EM Equity (11.81%). The Style split is mixed, with Yield and Growth investors finding more reasons to invest in Saudi Arabia than their Value and Aggressive Growth peers.
The most widely held stocks are National Commercial Bank and Al Rajhi Bank, held by 19.06% and 16.19% of managers respectively. The largest overweight and top 2 largest fund positions are in the iShares MSCI Saudi Arabia ETF, perhaps reflective of the desire to cover underweights rather than any specific stock conviction. Activity between 02/28/22 and 08/31/22 is heavily skewed to the buy side, with +6.47% of funds opening positions in National Commercial Bank and +4.68% in Saudi Aramco. Even with these increases, the current ownership picture does not feel resolved at all, with far more funds avoiding Saudi Arabia than would be suggested by its benchmark weight. The trend has further to run.

Click on the link below for the latest data report on Saudia Arabian positioning among active GEM funds.
United Arab Emirates
Average fund weights in the U.A.E are at their highest levels on record, driven by active rotation as more managers open exposure to MENA’s second largest index constituent. The percentage of funds invested stands at 43.5%, some way from the highs of 56.4% back in mid-2017 which hints at the potential for ownership to grow further from here. The Style split highlights the U.A.E’s appeal to Value and Yield managers, with high conviction positions from Seafarer Overseas Value (9.47%) and Redwheel Next Generation EM Equity (8.93%), though the bulk of holders sit at between 1%-2%.
Stock investment is fairly light, with the most popular holdings of Emaar Properties and Aldar Properties held by 16.9% and 13.7% of managers respectively. The underweights are a prominent part of the U.A.E ownership picture, with decent sized index holdings such as Emirates Telecommunications and First Abu Dhabi Bank largely avoided by active EM investors. Activity over the last 6-months has been very positive, with increases in ownership seen in Fertiglobe plc, Emaar Properties and Dubai Electricity and Water. Yet despite this positive picture, much like Saudi Arabia, the pain trade for the majority of active EM investors is for further outperformance of the U.A.E.

Click on the link below for the latest data report on U.A.E positioning among active GEM funds.
Turkey
Turkish allocations among GEM funds are at their lowest levels on record. Average weights of 0.53% and funds invested of 39.21% mark the culmination of a multi-year exodus among active EM managers. Among those that do have exposure, most hold less than a 2% weight, save for a number of Value funds led by Polunin Developing Countries (11.94%) and Global Advantage EM High Value (11.44%). The outlier is the Aggressive Growth strategy of Mobius Emerging Markets, though this is more focused on the small-cap end of the spectrum.
Whichever way you cut it, stock ownership is light among active managers, with little in the way of standout benchmark risks for EM funds. BIM Birlisk Magazalar is the most widely held stock, owned by 11.15% of managers at an average weight of 0.06%. Over the last 6-months, activity has been skewed to the sell-side, with net closures in Ford Otomotiv, Turk Telecom and Turkcell far outweighing the moderate increases in ownership across Koc Holding and Isbank. With Jupiter and First State throwing in the towel this year, the consensus trade in Turkey is to avoid it completely.
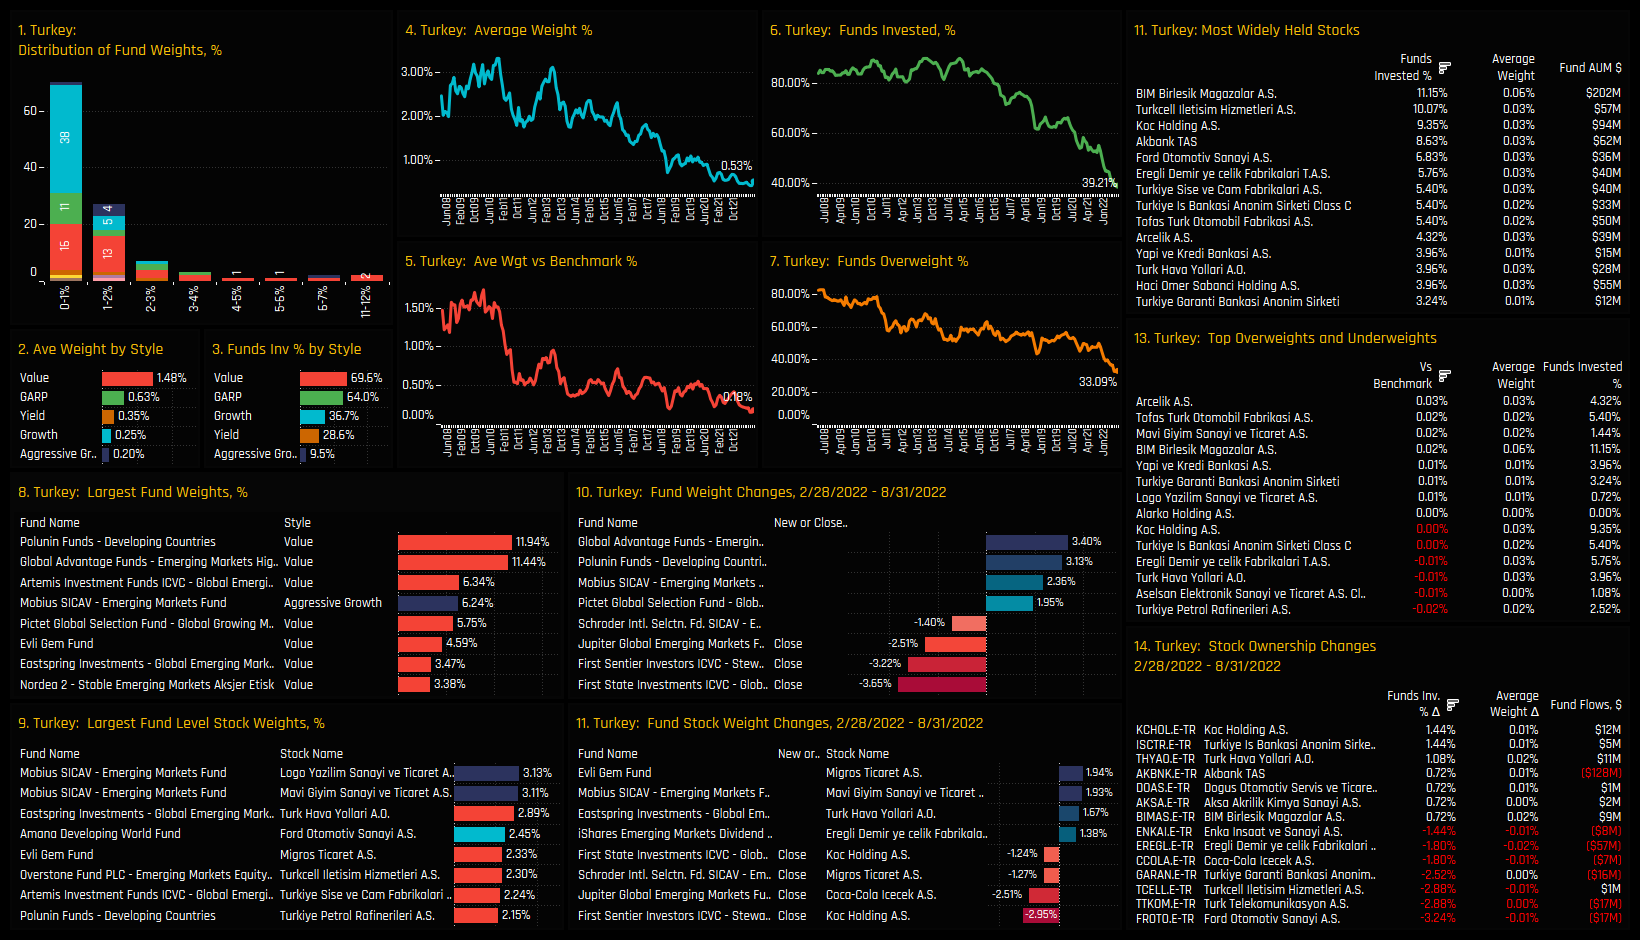
Click on the link below for the latest data report on Turkish positioning among active GEM funds.
Greece
Meanwhile, Greek allocations are on a upward trajectory. Average holding weights of 0.42% have followed a roughly positive trend since the lows of 2015, with 37.41% of managers invested and 32.7% overweight, all towards the top end of their decade long ranges. Like Turkey, Greece is a minor allocation for the majority of holders, with only a small number of funds allocating above 5%, led by Cullen EM High Dividend (7.16%) and Redwheel Next Generation EM Equity (5.57%). Despite this, current exposure represents a net overweight versus the iShares EEM ETF, on average.
On a stock level, there is a more conviction among managers than there is for Turkey, with 4 stocks held by more than 10% of funds and the largest fund level stock holdings in the 2.5%-5% range. Hellenic Telecommunications, Jumbo S.A, Alpha Bank SE and Greek Organisation Of Football share similar ownership profiles and account for over half of the total Greek allocation. Of the quartet, Greek Organisation Of Football captured the largest increase in funds invested of +2.16% over the last 6-months, aided by BNY Mellon’s new position of +2.12%.

Click on the link below for the latest data report on Greek positioning among active GEM funds.
Poland
Poland has followed a similar trajectory to Turkey, though perhaps not quite on the same scale. Average fund weights of 0.37% sit at the lower end of the long-term range, but there has been an uptick in outright ownership of late, with the funds invested percentage increasing to 44.96% from a low of 39.35% in September of last year. Still though, the majority of fund allocations in Poland sit below 1%, with Value and GARP funds more heavily invested than their Aggressive Growth peers. Fund activity over the last 6-months has been balanced, with closures from Pinebridge Global EM (-3.56%) and BlackRock Sustainable EM (-1.79%) offset by openings in Ashmore EM Equity ESG (+3.54%) and Thornburg Developing World (+2.1%).
There are 5 Polish stocks owned by more than 10% of active EM funds, but Dina Polska is the standout holding. It is held by 17.99% of managers at an average weight of 0.15% and occupies 9 of the 10 largest fund level stock holdings, led by Aubrey Capital Global EM (3.59%) and Ashmore EM Equity ESG (3.54%). Over the last 6-months, a further 4.32% of EM managers have opened exposure in Dina Polska, whilst managers scaled back exposure in PZU and PKO. The consensus is to be underweight Poland at the moment, but many of those who are overweight are expressing it through a single exposure to Dina Polska. High conviction indeed.
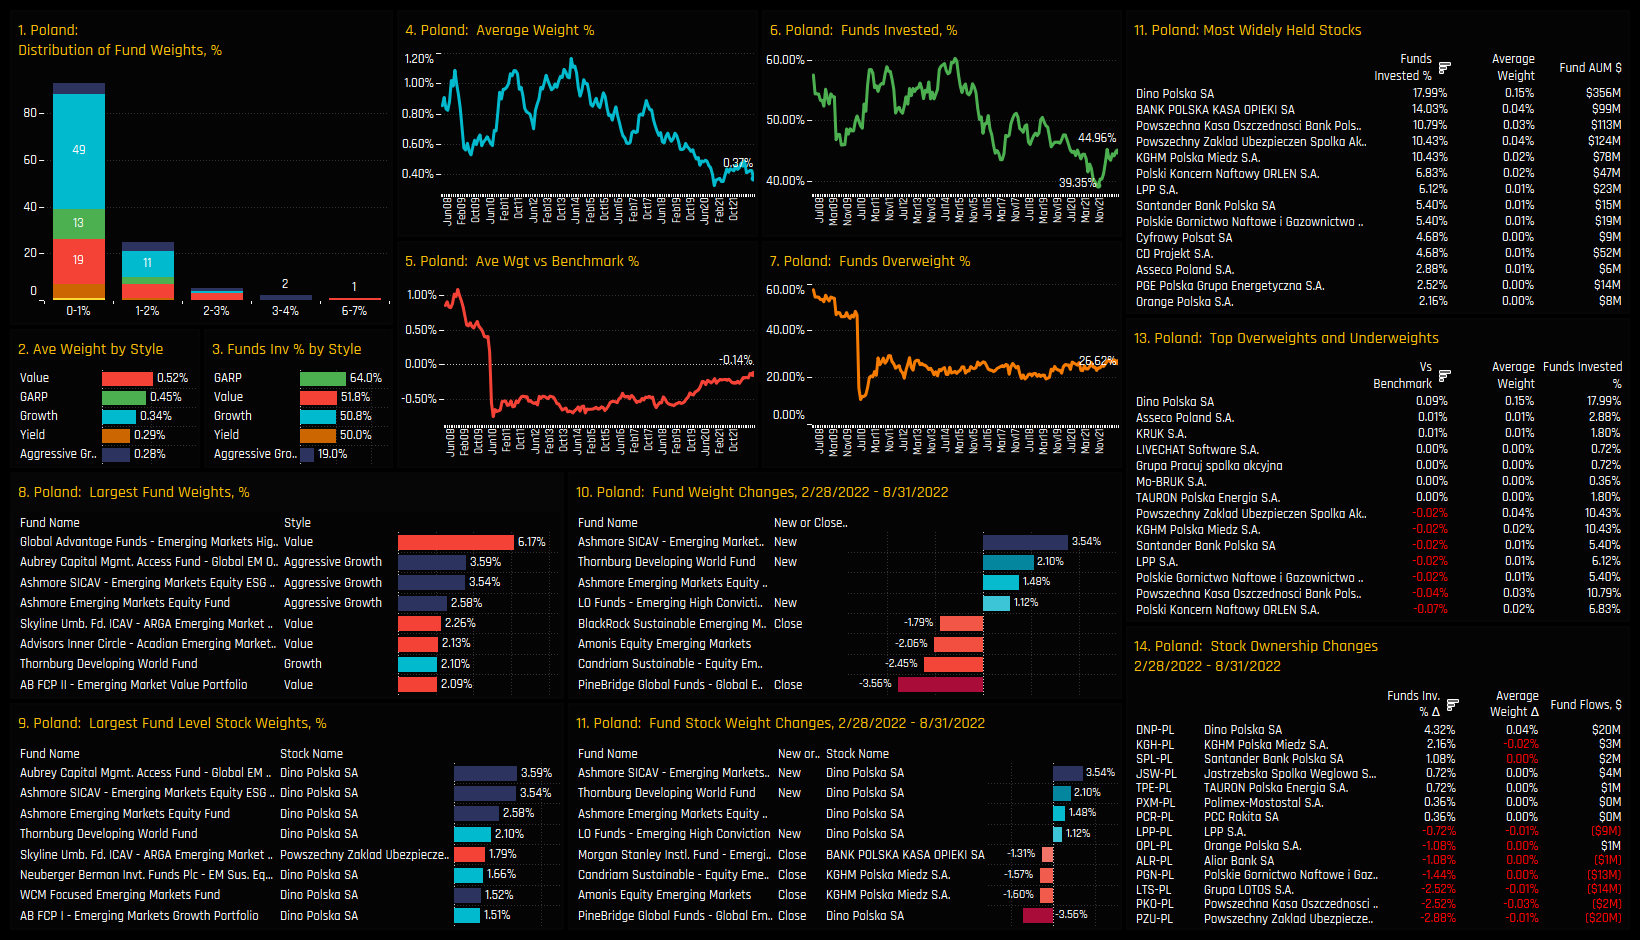
Click on the link below for the latest data report on Poland positioning among active GEM funds.
Hungary
Ownership trends in Hungary paint a dismal picture of investor sentiment. Despite seeing a small rebound in 2021, the downward trend in exposure that started in 2019 has resumed, with average weights falling to 0.26% and funds invested to 34.53%, both close to record lows. The majority of funds allocate either zero or less than 1% to Hungarian stocks, with a moderate bias towards the Value end of the Style spectrum. Closures have dominated openings over the last 6-months, led by Ashmore EM Equity ESG (-1.8%), Threadneedle Global EM (-1.49%) and Pictet Emerging Markets (-1.44%).
The Hungarian stock universe is small, with only 5 companies registering investment among the 278 funds in our EM analysis. The most widely held stock remains OTP Bank by a small distance, owned by 20.86% of managers at an average weight of 0.11%. However, investment levels in OTP Bank have plummeted over the last 6-months, with -9.71% of EM investors closing out positions, led by Ashmore EM Equity ESG (-1.8%), Threadneedle Global EM (-1.49%) and Pictet Emerging Markets (-1.44%). The only bright spots were opening positions in MOL Oil & Gas, tempering an otherwise lackluster appetite for Hungarian exposure through 2022.

Click on the link below for the latest data report on Hungary positioning among active GEM funds.
Qatar
Qatar is seeing a strong return to form, with both average weights and funds invested moving significantly higher over the last 6-months. New positions from William Blair EM Growth (+1.98%), Victory Sophus EM (+1.74%) and Aviva Global EM Unconstrained (+1.71%) helped push the overall funds invested percentage to 25.54%, up from low of 14.4% in July of last year but off the highs of 29.38% in 2014. Qatar remains a fringe holding, with the majority of fund weights between 1%-2% and all but Seafarers Overseas Value allocating below a 5% allocation. Qatar is still a net underweight holding by -0.85% on average, mainly down to the 74.5% of funds who hold a zero allocation.
On a stock level, Qatar National Bank has risen to become the favoured holding in the region, owned by 16.6% of funds after seeing an increase of +4.68% over the last 6-months. It dominates the list of high conviction fund holdings in chart 9, with new positions from Aviva Global EM Unconstrained (+1.71%), Ashmore EM ESG (+1.63%) and William Blair EM Growth (+1.32%) highlighted in chart 11. Despite this, Qatar National Bank represents the largest underweight in Qatar, alongside Qatar Islamic Bank, Masraf Al-Rayan and Industries of Qatar.
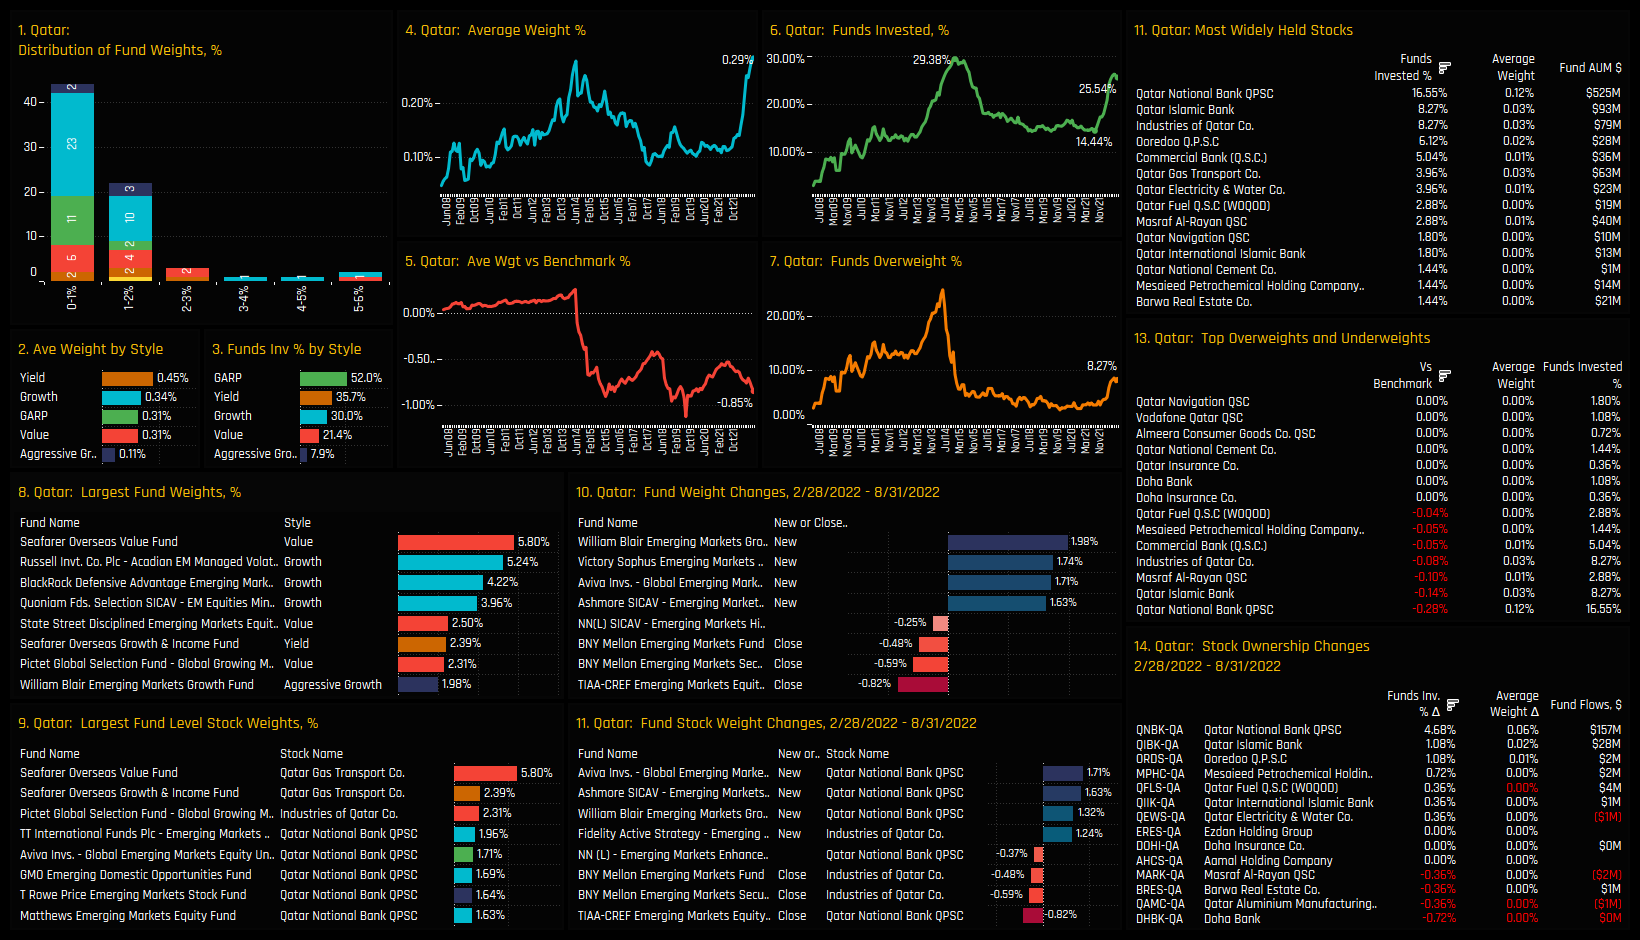
Click on the link below for the latest data report on Qatar positioning among active GEM funds.
Kuwait
Kuwait is starting to appear on the radar of active EM investors. Average fund weights and the percentage of funds invested in Kuwait have risen steadily over the last 2-years, with current levels their highest on record. But with only 9% of managers holding a position, Kuwait remains a low conviction holding, with most of those invested showing less than a 1% allocation. In conjunction with this ownership rally, the relative outperformance of the Kuwaiti market this year has pushed index weights higher, driving the net underweight to record levels of -0.80% below the iShares EEM ETF.
As we would expect with such a moderate ownership picture, stock holdings are light. National Bank of Kuwait is the most widely held stock, owned by 5.40% of funds and among the larger of the individual fund level holdings. Over the last 6-months, new positions from NN EM High Dividend (+0.46%) and GMO EM Domestic Opportunities (+0.45%) have helped push ownership levels higher. National Bank of Kuwait also forms almost half of the net underweight in Kuwait, alongside Kuwait Finance House and Boubyan Bank. With underweights increasing and more active managers investing, Kuwait is becoming harder to ignore.
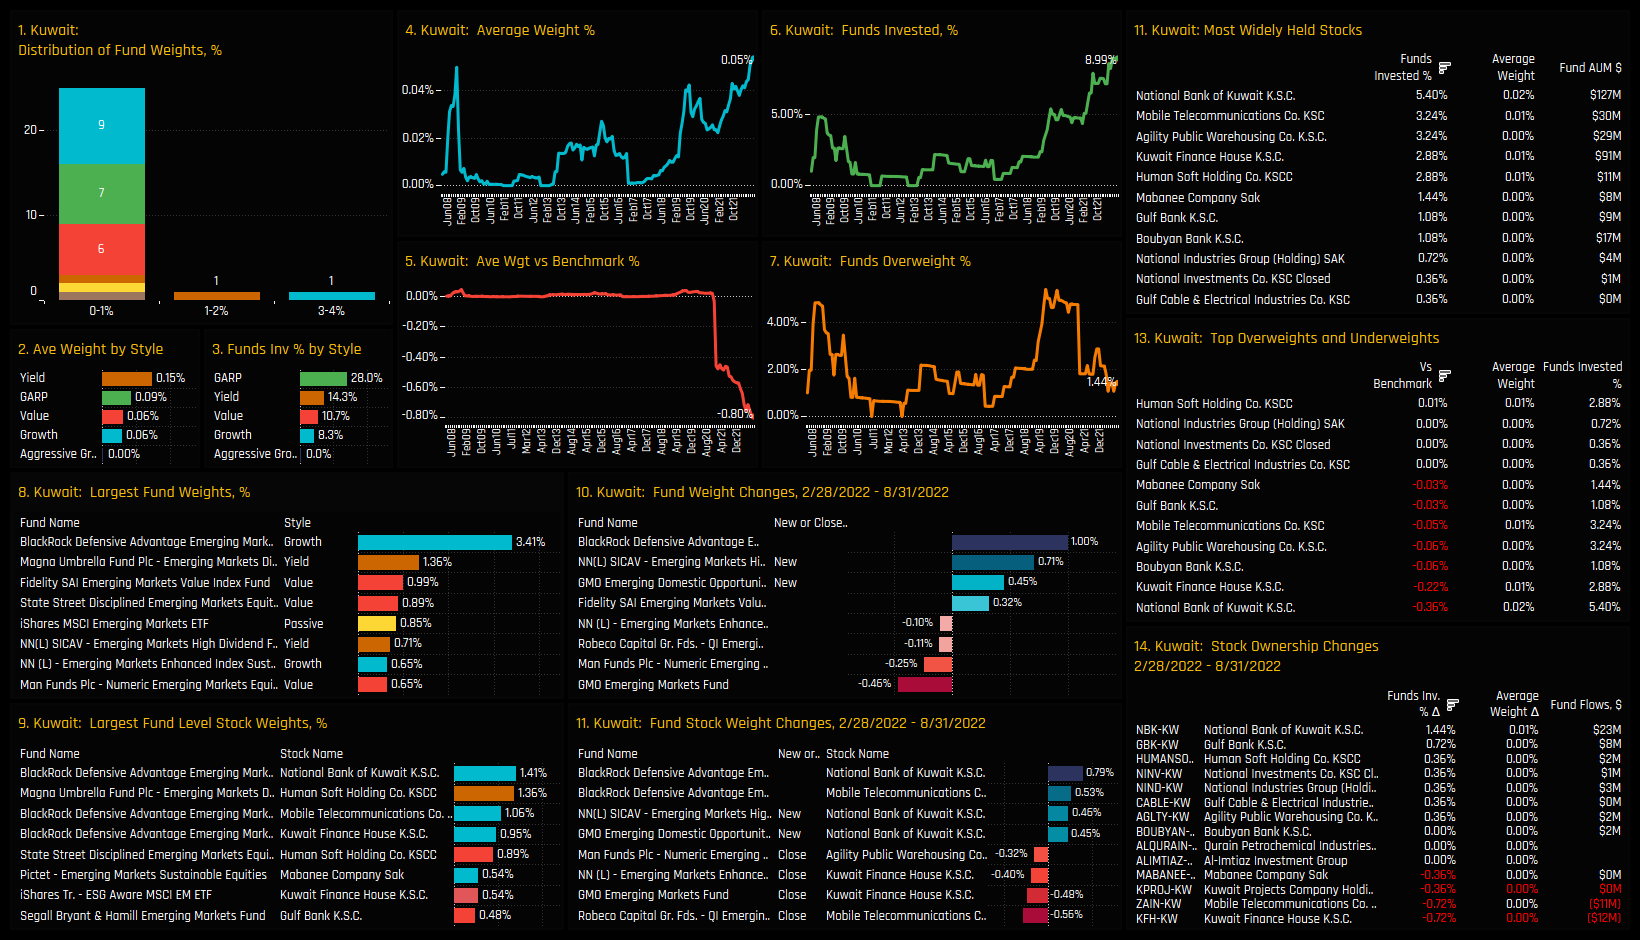
Click on the link below for the latest data report on Kuwait positioning among active GEM funds.
Developed European stocks are at their lowest ever allocation in EM portfolios of 2.02%. Once a dominant theme among EM active funds, DM European allocations peaked at over 4% through 2013 with around 80% of managers invested to some degree. There is still a select group of funds where investing in Developed market stocks is part of their core strategy, led by Coronation Global Opportunities (21.54%), American New World (16.7%) and Artisan Developing World (13.15%). However, the majority hold less than a 4% weight, with allocations well correlation to Style and in favour of Growth.
The most widely held stocks are Anglo American, owned by 11.87% of managers, followed by Prosus NV (10.8%) and Unilever PLC (9.71%). Because of their perceived quality, individual fund position sizes are often sizeable, led by Orbis EM with a 10.98% position in BATS and Nordea EM Equities with a 6.18% position in Prosus NV. Stock rebalancing over the last 6-months has been skewed to the sell side, with -8.27% of funds closing positions in Ozon Holdings, -6.12% in Headhunter Group and -4.32% in Allegro. On the fund side, Skagen Kon Tiki increased exposure the most over the period, buying in to Shell PLC and TotalEnergies as part of a 8.27% increase in exposure.
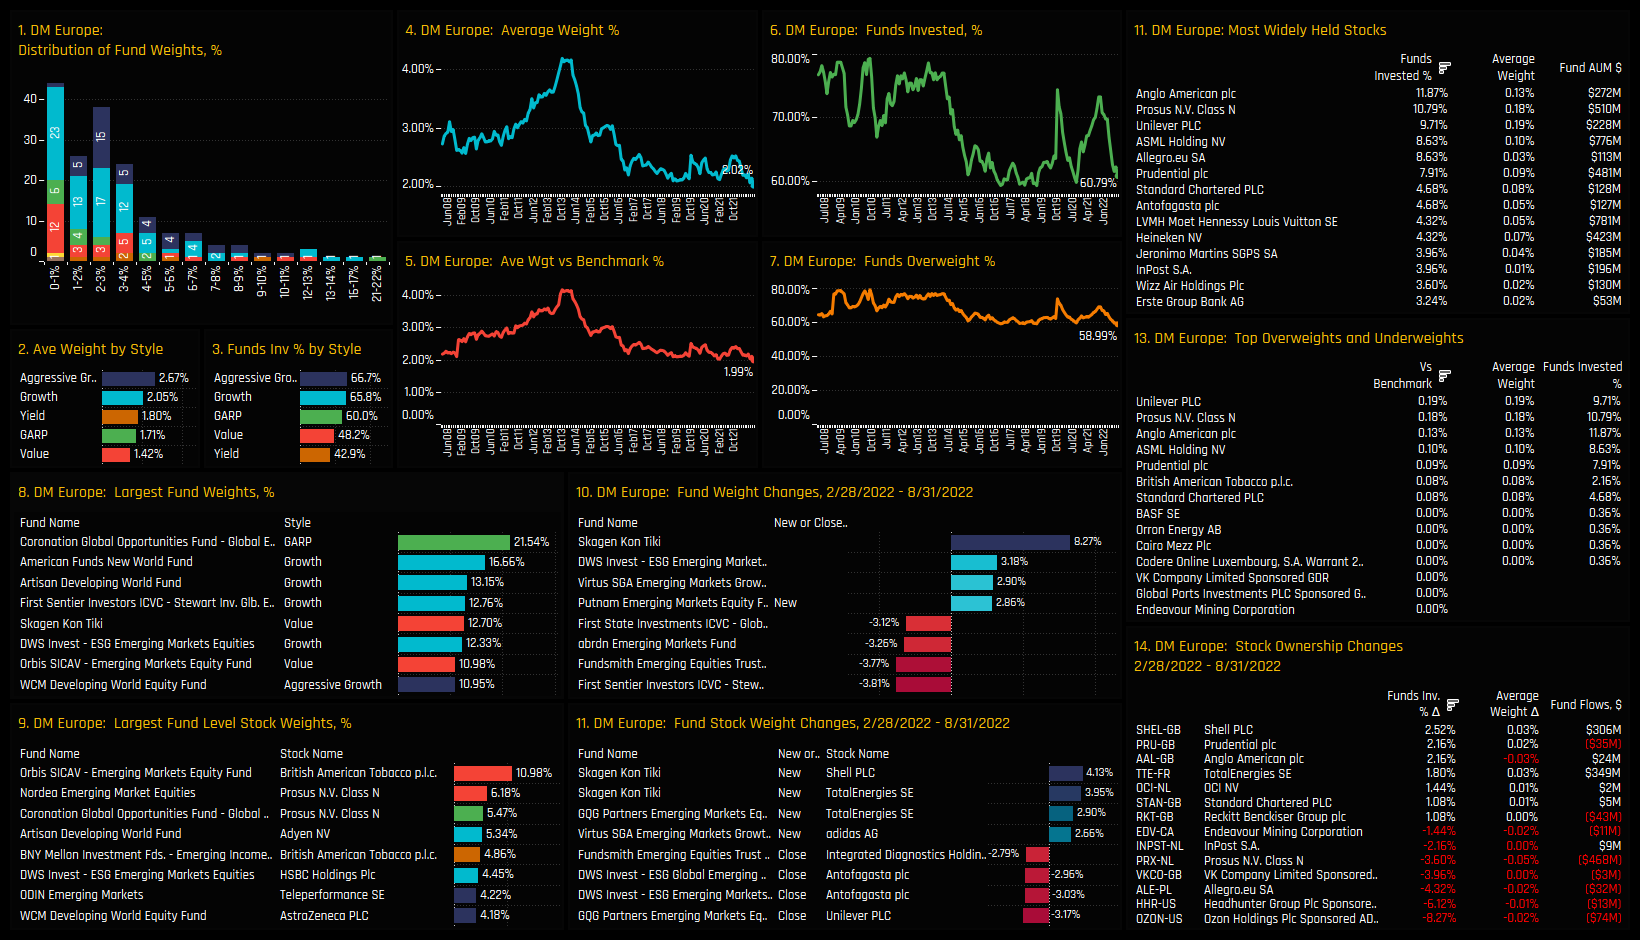
Click on the link below for the latest data report on DM European positioning among active GEM funds.
For more analysis, data or information on active investor positioning, please get in touch with me on steven.holden@copleyfundresearch.com
Related Posts

- Steve Holden
- May 17, 2024
Active GEM Funds: Top-Down Country Insights
355 emerging market Funds, AUM $410bn Active GEM Funds: Top-Down Country Insights Summar ..

- Steve Holden
- February 27, 2024
Alibaba Group Holdings: Positioning Update
361 emerging market Funds, AUM $400bn Alibaba Positioning Overview • Despite average weights ..

- Steve Holden
- May 26, 2023
GEM Fund Positioning Analysis, May 2023
375 emerging market Funds, AUM $400bn GEM Fund Positioning Analysis, May 2023 In this issue: Qa ..

