In this issue:
Qatar: Momentum Stalls
Consumer Discretionary: Active Rotation
BYD Company: Moves to Top Auto Holding in EM
Emerging Markets Stock Positioning Update
375 emerging market Funds, AUM $400bn
Qatar: Momentum Stalls
Fund exposure to Qatari stocks saw a strong increase between 2021 and 2022, but recent activity has seen some of those new investors scale back exposure. It remains a key underweight for active EM equity funds.
Time-Series & Country Positioning
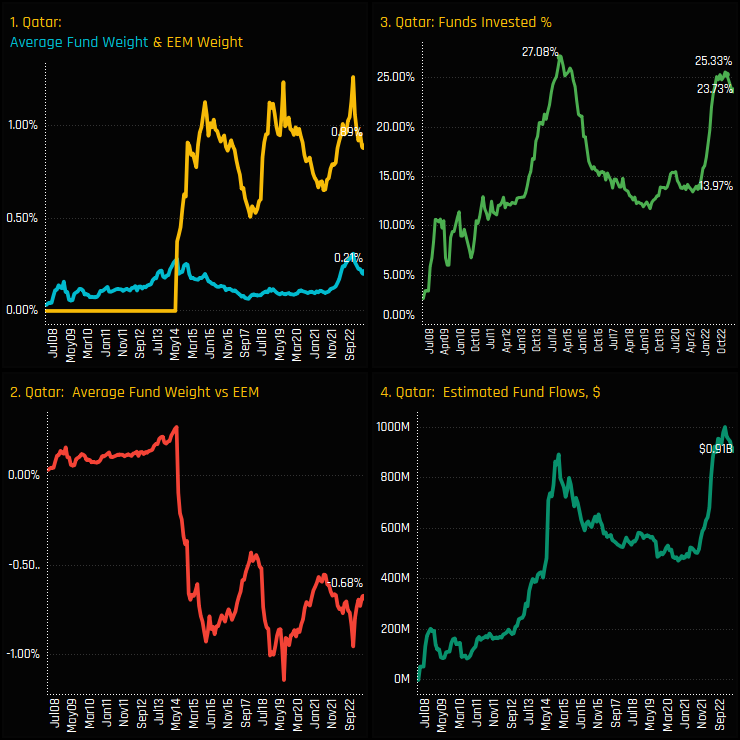
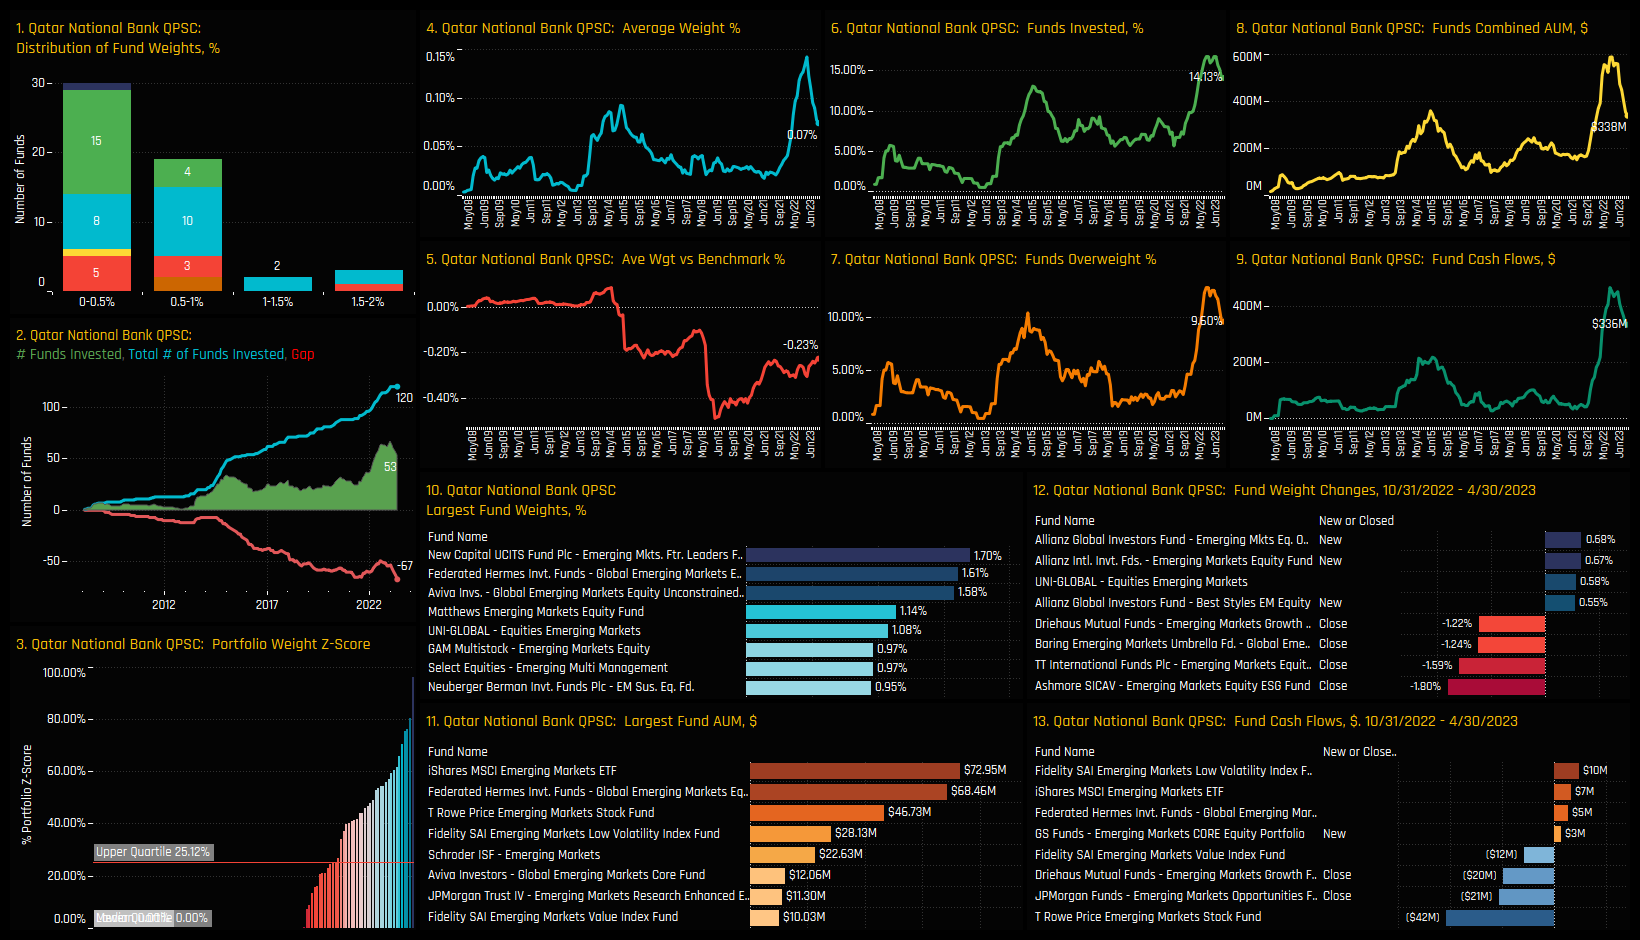
The rally in Qatar ownership among active EM funds has stalled. Chart 3 below shows the percentage of funds invested in Qatar over time. It highlights a surge in ownership from 14% of funds back in August 2021 to a recent peak of 25.3% in December of last year, just falling shy of the record 27.1% of funds following Qatar’s inclusion in to the MSCI EM index in 2014. Since then, ownership momentum has stalled and even fallen slightly, with net fund closures and moderate fund outflows (ch4). Versus the benchmark, active EM managers have been underweight Qatar ever since it’s inclusion in to the MSCI EM index in 2014 (ch2).
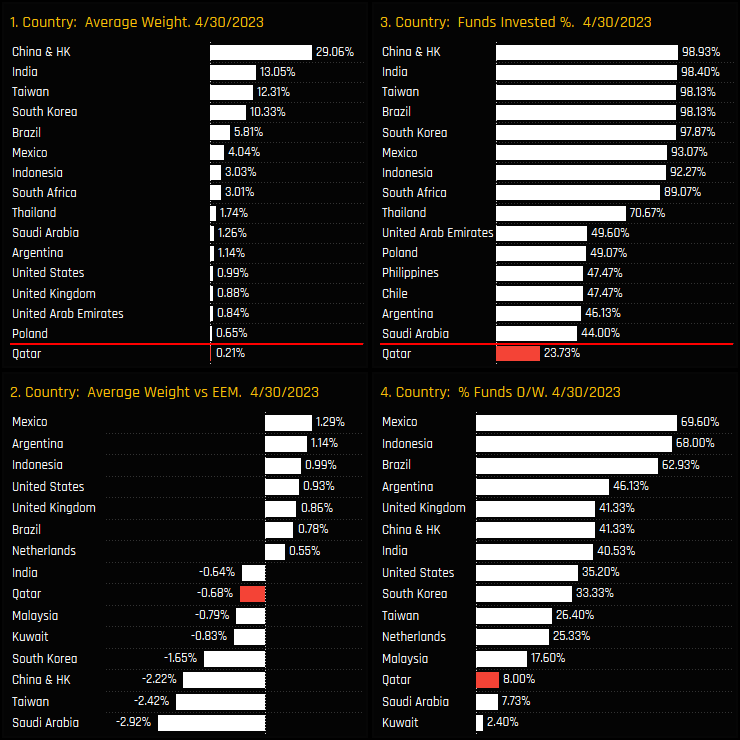
Qatar sits well down the pecking order of country allocations among EM active managers. It is the 29th largest country weight on average (ch1) and the 25th most widely held (ch3). But it’s versus the benchmark where Qatar stands out. Average fund weights of 0.21% are well behind the iShares MSCI Emerging Markets ETF weight of 0.89%, placing Qatar as the 7th largest country underweight. This puts Qatar very much in the ‘underowned’ category, with over three quarters of the funds in our analysis happy to run a zero position, despite the risks of performance deviation from the benchmark.
Fund Holdings & Activity
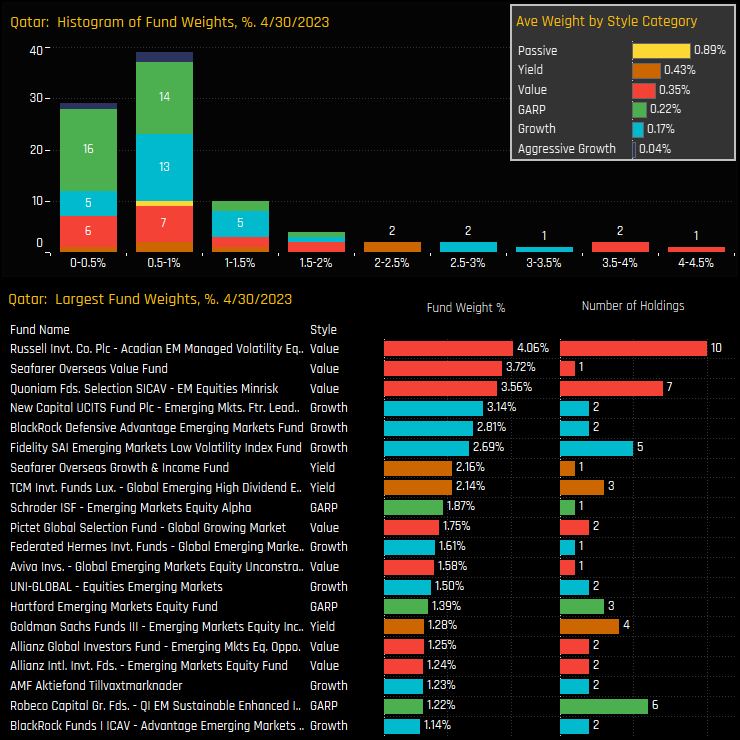
Breaking down the aggregate holdings to a fund level shows the majority of the current investor base in Qatar holding less than a 1.5% stake. There is a moderate tail to the upside led by the Value strategies of Acadian EM Managed Volatility (4.06%), Seafarer Overseas Value Fund (3.72%) and Quoniam EM Equities Minrisk (3.56%). On a Style basis, all groups are underweight the benchmark on average, with Value strategies ahead of their Growth peers.
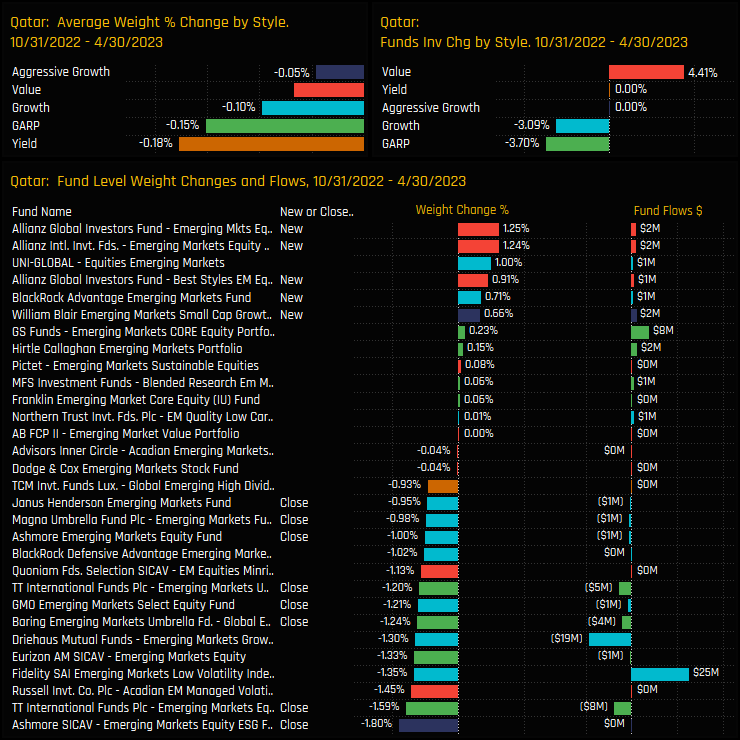
Fund level changes over the last 6-months favoured the sell-side, though not exclusively so. Closures outnumbered openings by a factor of 2 and average weights fell for all Style groups. The positives were at the Value end of the spectrum, with a net +4.4% of Value managers opening positions, led by new exposure from a number of Allianz EM strategies. Closures were led by GARP and Growth strategies, with Ashmore EM ESG (-1.8%) and TT International EM Equity (-1.59%) the larger of the position closures.
Stock Holdings & Activity
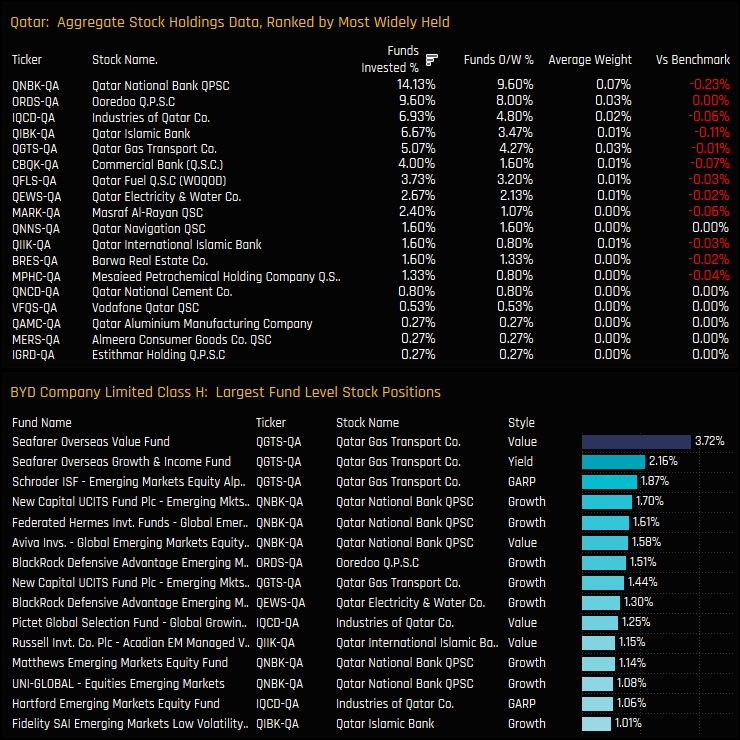
Stock ownership in Qatar is light, with the most widely held company that of Qatar National Bank, owned by 14.1% of the EM funds in our analysis at an average weight of 0.07%. It is also the largest net underweight position at -0.23% below benchmark on average, followed by Qatar Islamic Bank (-0.11%) and Commercial Bank (-0.07%). On a fund level, Qatar National Bank is prevalent among the larger positions in the bottom chart, but decent sized holdings in Qatar Gas Transport from Seafarer and Schroders top the list.
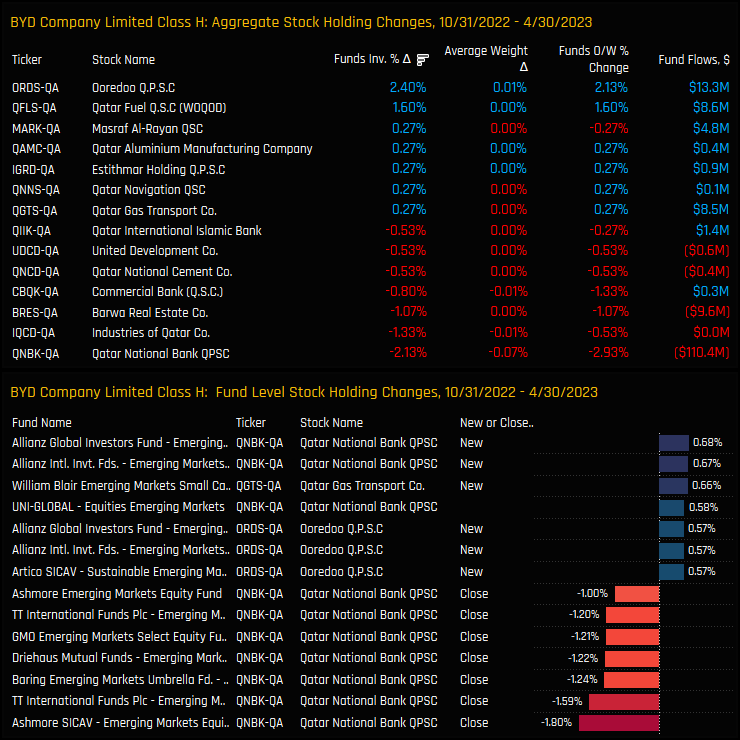
Stock level activity between 10/31/2022 and 04/30/2023 was skewed to the sell-side, with a net -2.13% of the 375 EM funds in our analysis closing exposure to Qatar National Bank. Indeed, all of the top 10 closing positions were in Qatar National Bank, led by Ashmore, TT International and Barings. On the positive side, +2.4% of funds opened exposure to Ooerdoo Q.P.S.C, with Allianz and Artico among those opening small exposures.
Conclusions & Links
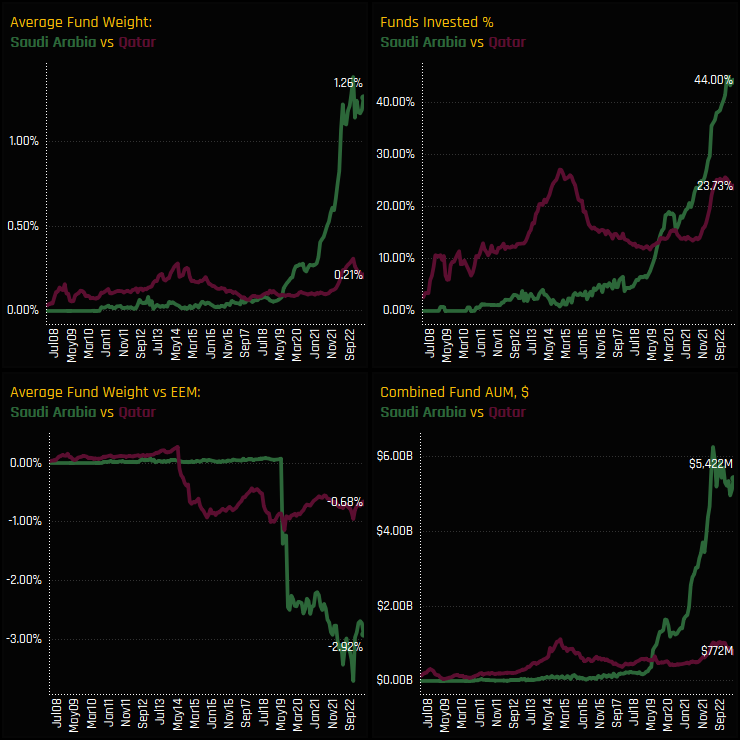
The charts to the right show EM fund ownership over time for both Qatar and Saudi Arabia. From once being the dominant exposure, Qatar has been heavily eclipsed by Saudi Arabia since it was admitted to the MSCI EM index back in 2019. In contrast to Qatar, Saudi ownership continued to grow aggressively after its MSCI EM entry, whereas Qatar ownership dropped off in the months following admission in 2014. Saudi Arabia is now a country position for 44% of the funds in our analysis at an average weight of 1.26%, whereas Qatar is owned by 23.7% of managers at a weight of 0.21%. Both countries are key underweights for active EM managers, but Saudi is the larger underweight by some distance.
From our analysis and from discussions with managers, there is a sense that Saudi is on the path to full ownership, and that it will become harder to avoid exposure as index weights remain above 4% and an increasing number of active peers buy in. The fact that ownership growth in Qatar has stalled suggests that active managers are more comfortable in avoiding Qatar exposure, for now. Ownership levels failed to surpass the previous highs of 2014, with some managers now scaling back the new exposures they put on between 2021 and 2022. One wonders whether these were short-term positions in the context of rising oil prices and a rotation out of Tech. However, given Qatar’s rising prominence on the Global stage and the growing appetite for investment in the MENA region, we would be surprised if investment levels remained this low for long. Now could represent an opportunity for active managers to get ahead of peers and close the gap to benchmark.
Please click on the link below for a more detailed data pack on Qatar positioning among active EM funds. Scroll down for a stock profile on Qatar National Bank.
Active fund weights in the Consumer Discretionary sector have started to diverge from the benchmark, with an increasing number of funds positioning themselves overweight.
Time-Series & Industry Positioning
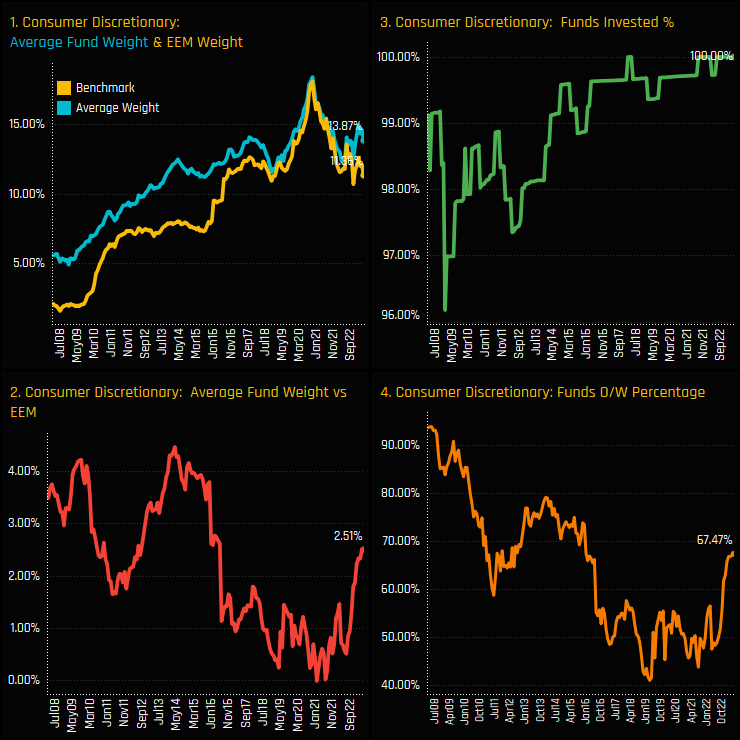
Active Emerging Market fund allocations in the Consumer Discretionary sector are once again breaking away from their passive benchmark. A prominent overweight sector holding from 2008 to 2020 (ch2), active managers moved to equal weight in 2021 following a fall in absolute exposure from the highs in late 2020 (ch1). Since the lows hit in late 2021, sentiment in the sector has been on the rise, with average weights moving ahead of the iShares MSCI Emerging Markets ETF by +2.51% and with 67.5% of funds positioned ahead of the index (ch4).
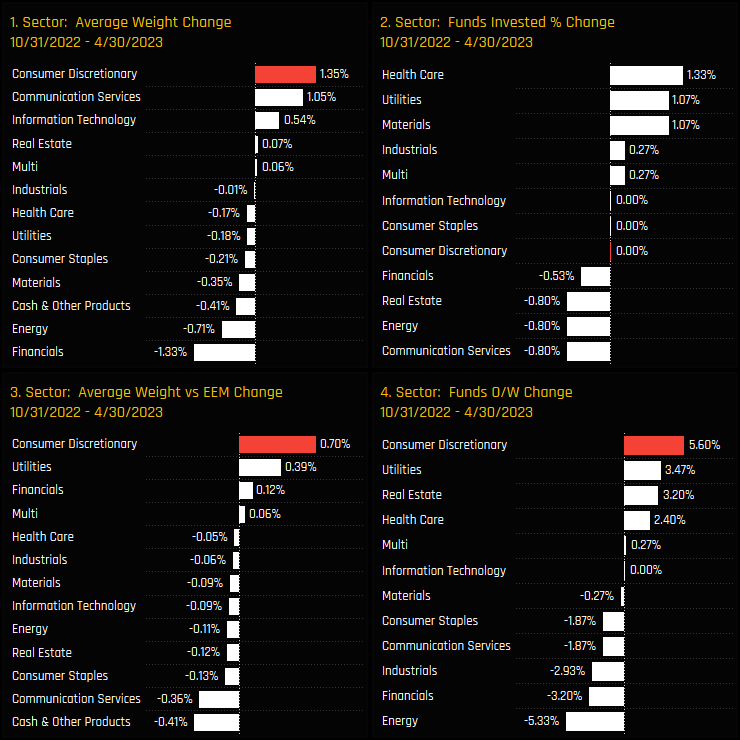
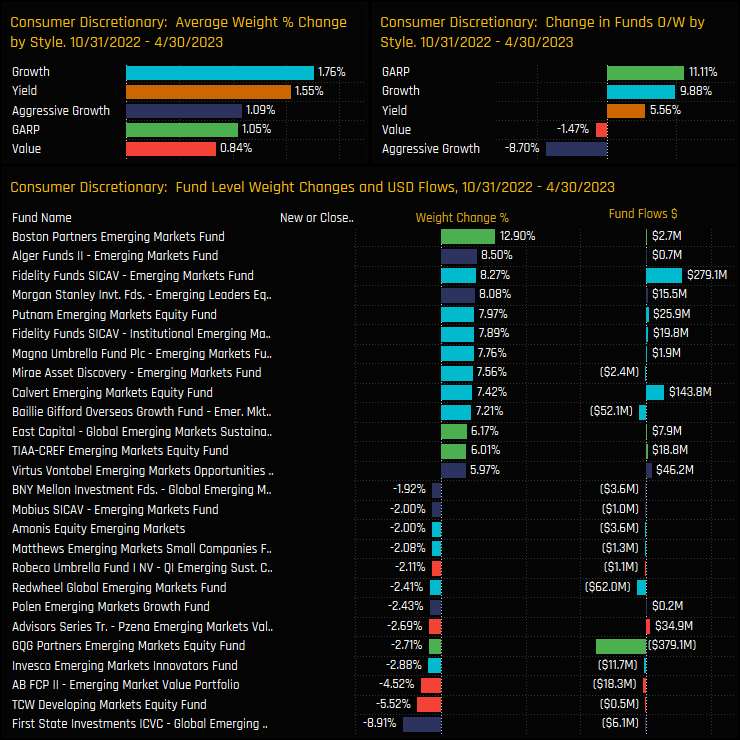
The improving sentiment in the Consumer Discretionary sector can be clearly seen when analysing the change in sector ownership among EM funds over the last 6-months. The Consumer Discretionary sector saw the largest increase in average weight of +1.35%, the largest overweight move of +0.7% and the highest percentage of funds switching to an overweight stance over the period. On the other side of this rotation, EM funds scaled back exposure to the Financials and Energy sectors.
Sector Holdings & Sentiment
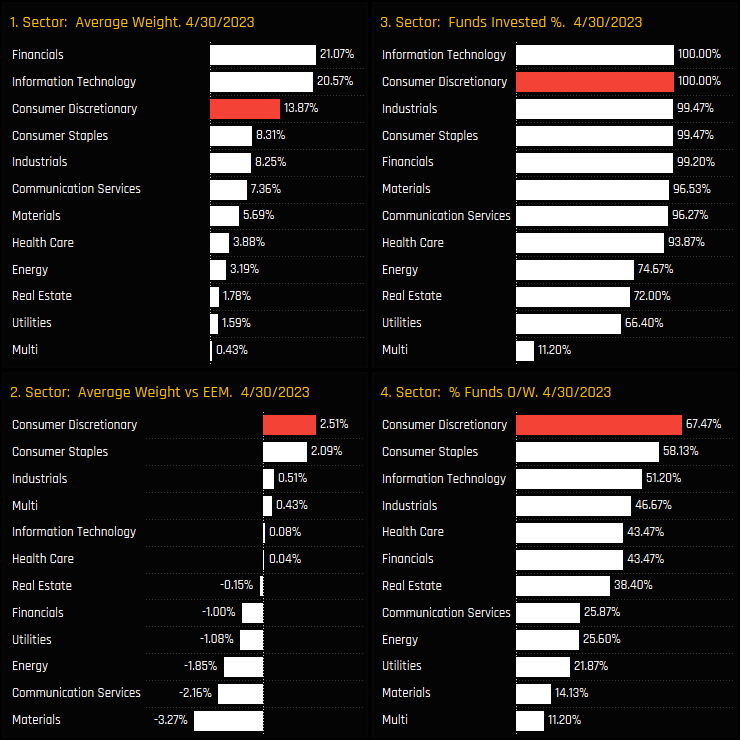
The latest snap of sector exposures among EM funds is shown in the charts below. Consumer Discretionary is the 3rd largest exposure, some way behind the dominant Financials and Tech sectors, but well ahead of the chasing pack of Industrials, Consumer Staples and Communication Services (ch1). It is one of only 2 sectors to be held by every fund (ch3), but it is against the benchmark where active exposure really stands out. Consumer Discretionary is the consensus overweight among managers (ch4) and a major overweight position alongside Consumer Staples, offsetting sizeable underweights in the Materials and Communication Services sectors.
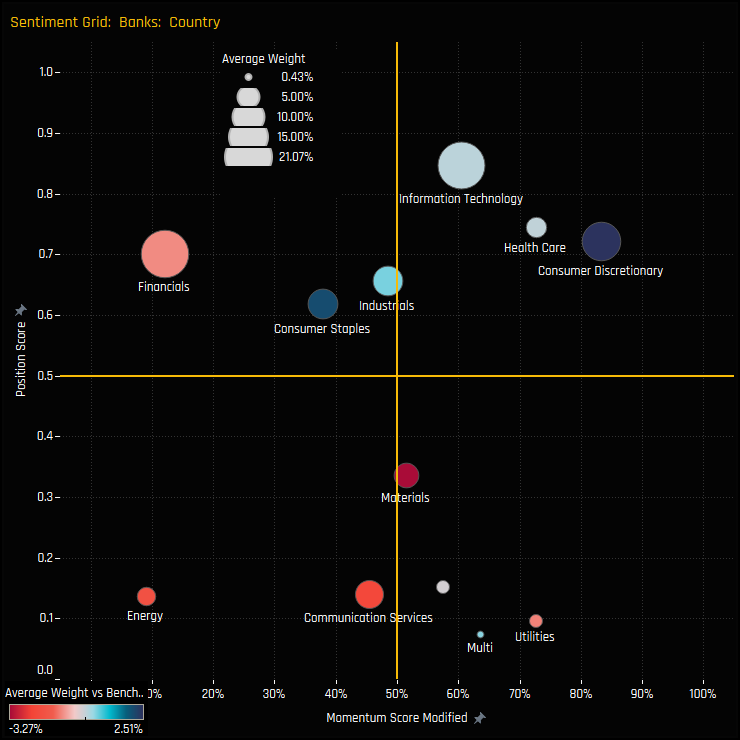
The sentiment grid below shows where current positioning in each EM sector sits versus its own history going back to 2008 on a scale of 0-100% (y-axis), against a measure of fund activity for each sector between 10/31/2022 and 04/30/2023 (x-axis). The Consumer Discretionary sector sits in the top-right quadrant, with positioning closing in on the highs after positive rotation among managers. In contrast, positioning in Energy and Communication Services is near record lows, whilst Financial stocks are seeing outward rotation whilst positioning remains at the higher end of historical levels.
Fund Holdings & Activity
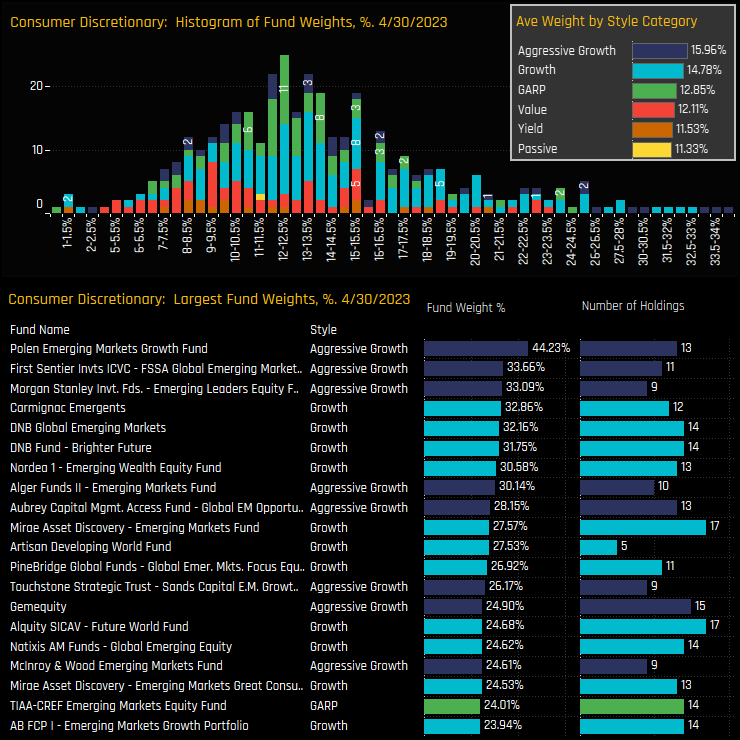
Fund allocations in the Consumer Discretionary sector span a wide range, but the peak of the distribution sits at between 8% and 15.5%. The long tail to the upside is headed by funds at the Aggressive Growth end of the spectrum and led by Polen Emerging Markets Growth (44.2%) and First Sentier Global EM Focus (33.7%). Indeed, allocations are largely correlated to Style, with Aggressive Growth funds averaging 3.85% more than their Value peers, though all Style groups are overweight the iShares MSCI EM ETF, on average.
Fund level activity between 10/31/2022 and 04/30/2023 shows all Style groups increasing weights in the Consumer Discretionary sector, but activity wasn’t all one-way. In terms of the percentage of funds moving to overweight, Yield, Growth and GARP funds saw positive moves, but 8.7% of the Aggressive Growth funds in our analysis moved to underweight. On balance though, fund level activity was skewed to the buyside, with large increases by Boston Partners EM (+12.9%) and Alger EM (+8.5%) offsetting smaller reductions by First State EM (-8.9%) and TCW Developing Markets (-5.5%).
Stock Holdings & Activity
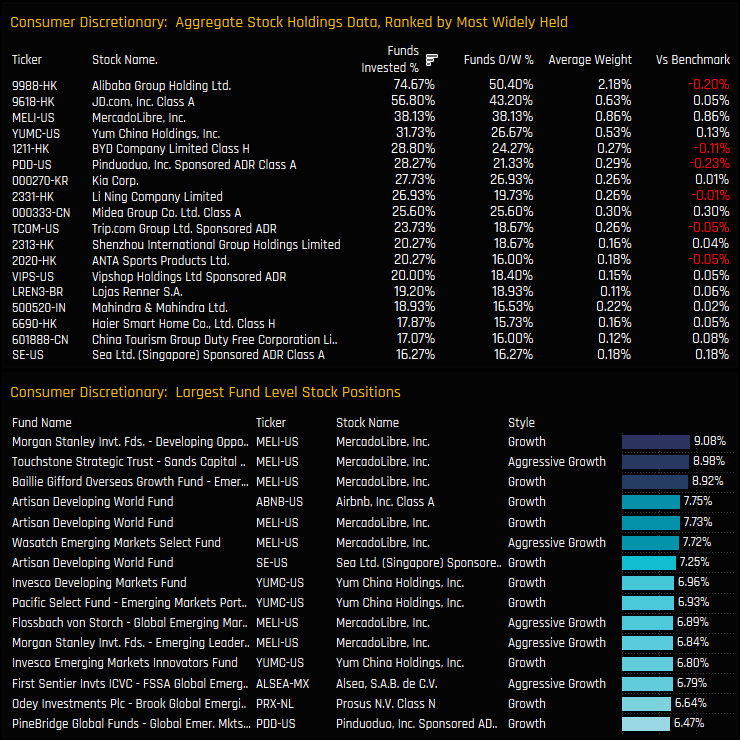
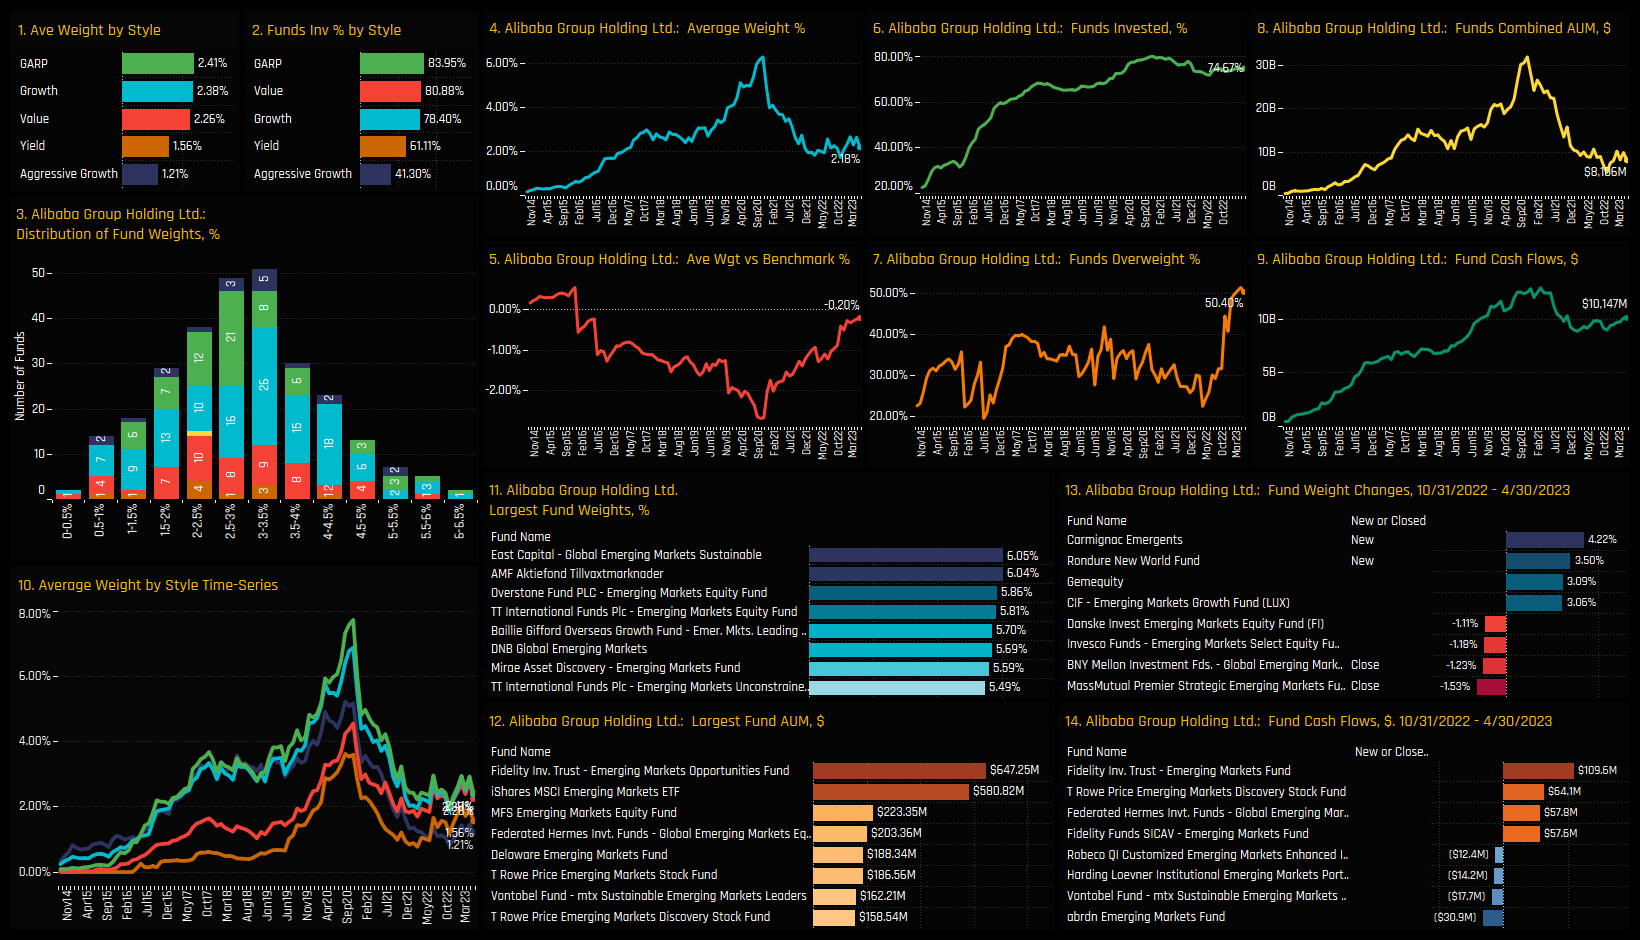
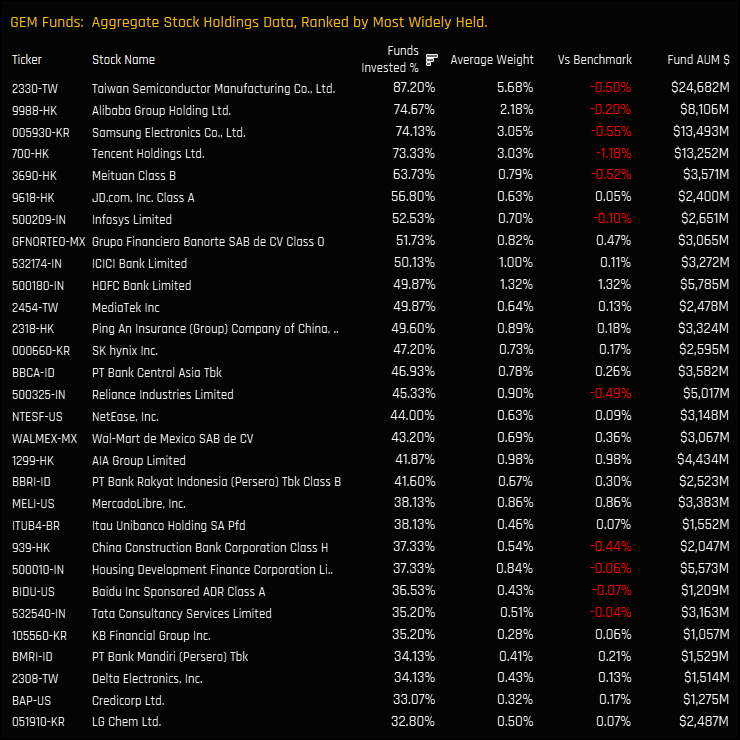
The most widely held stock in the Consumer Discretionary sector is Alibaba Group Holdings, owned by 74.7% of managers at an average weight of 2.18%. The depth of stock ownership is impressive, with 9 stocks owned by more than 25% of managers and a long tail of companies owned by more than 10% of funds. Despite being the most widely owned stock, Alibaba Group Holdings doesn’t feature among the larger individual stock holdings in the bottom chart, which instead is dominated by sizeable positions in MercadoLibre from Morgan Stanley, Touchstone Sands and Baillie Gifford, among others.
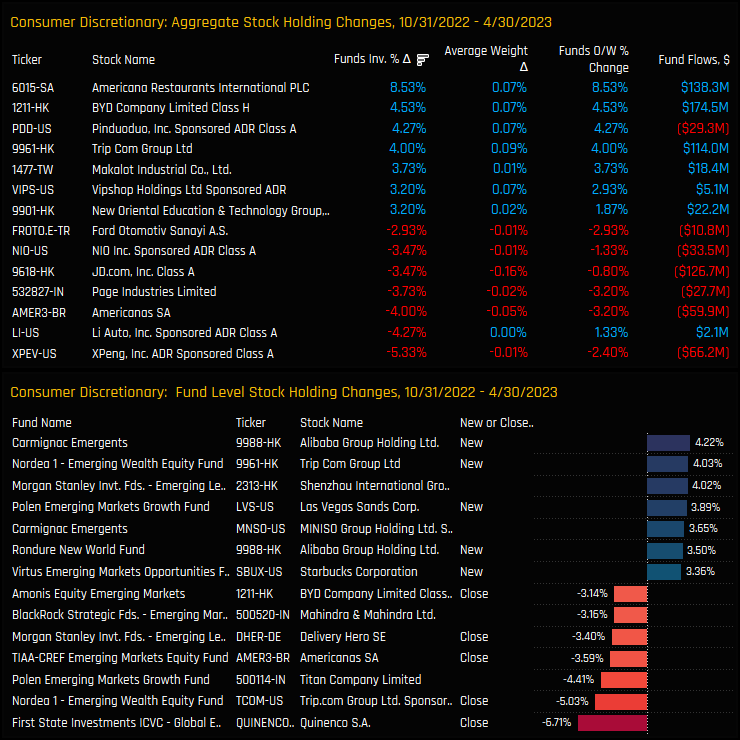
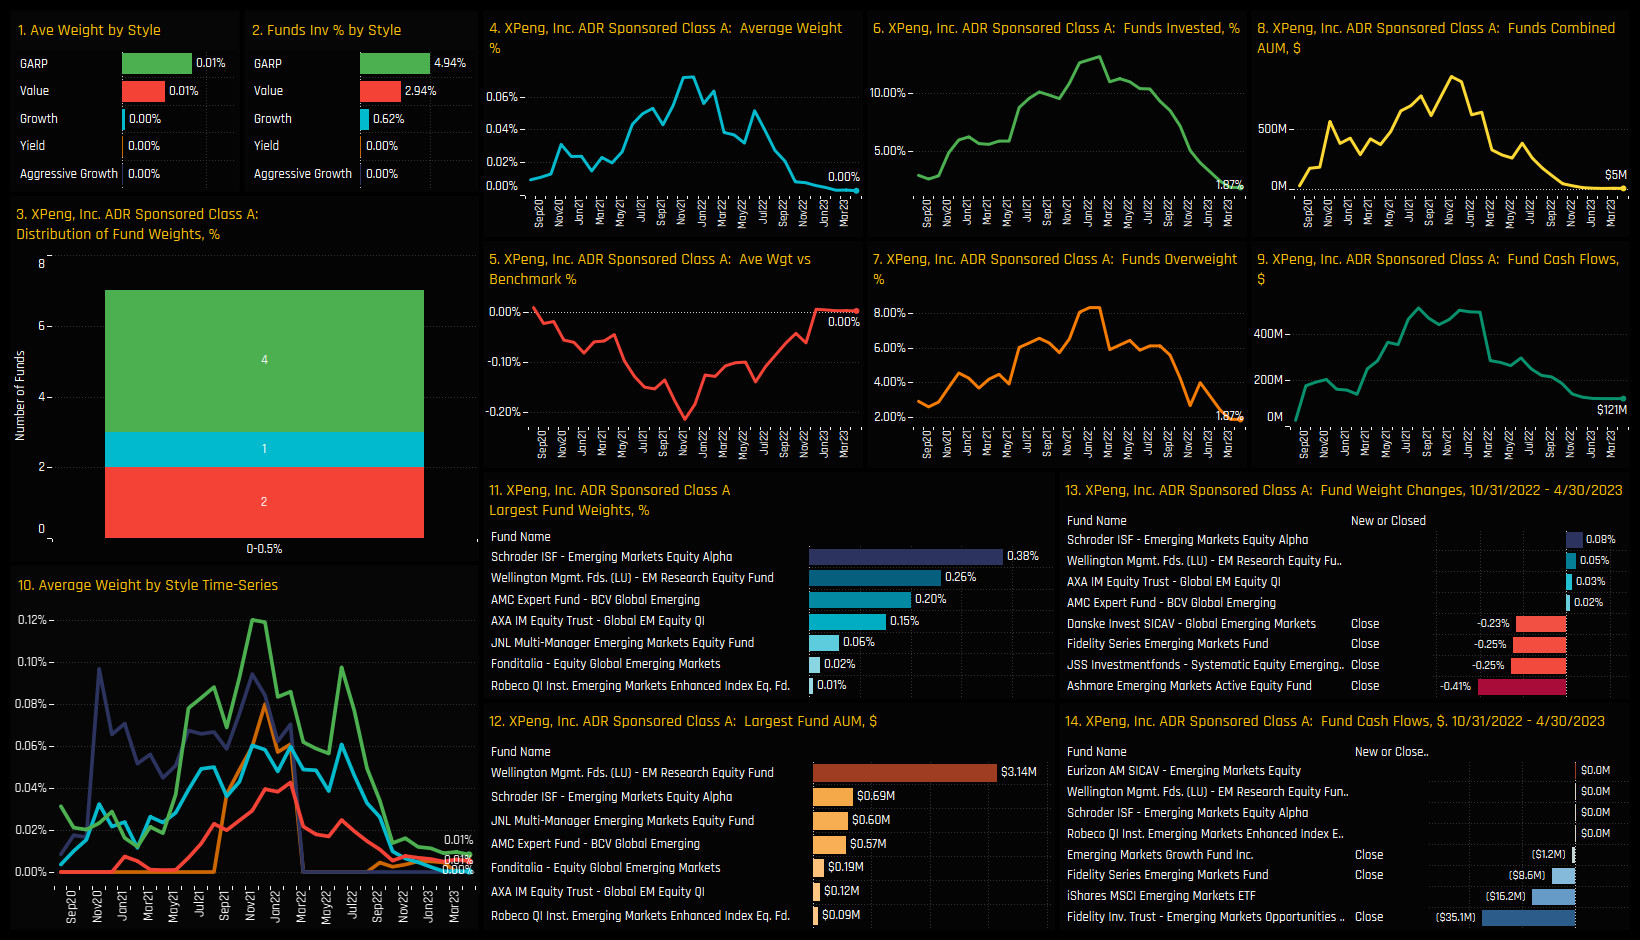
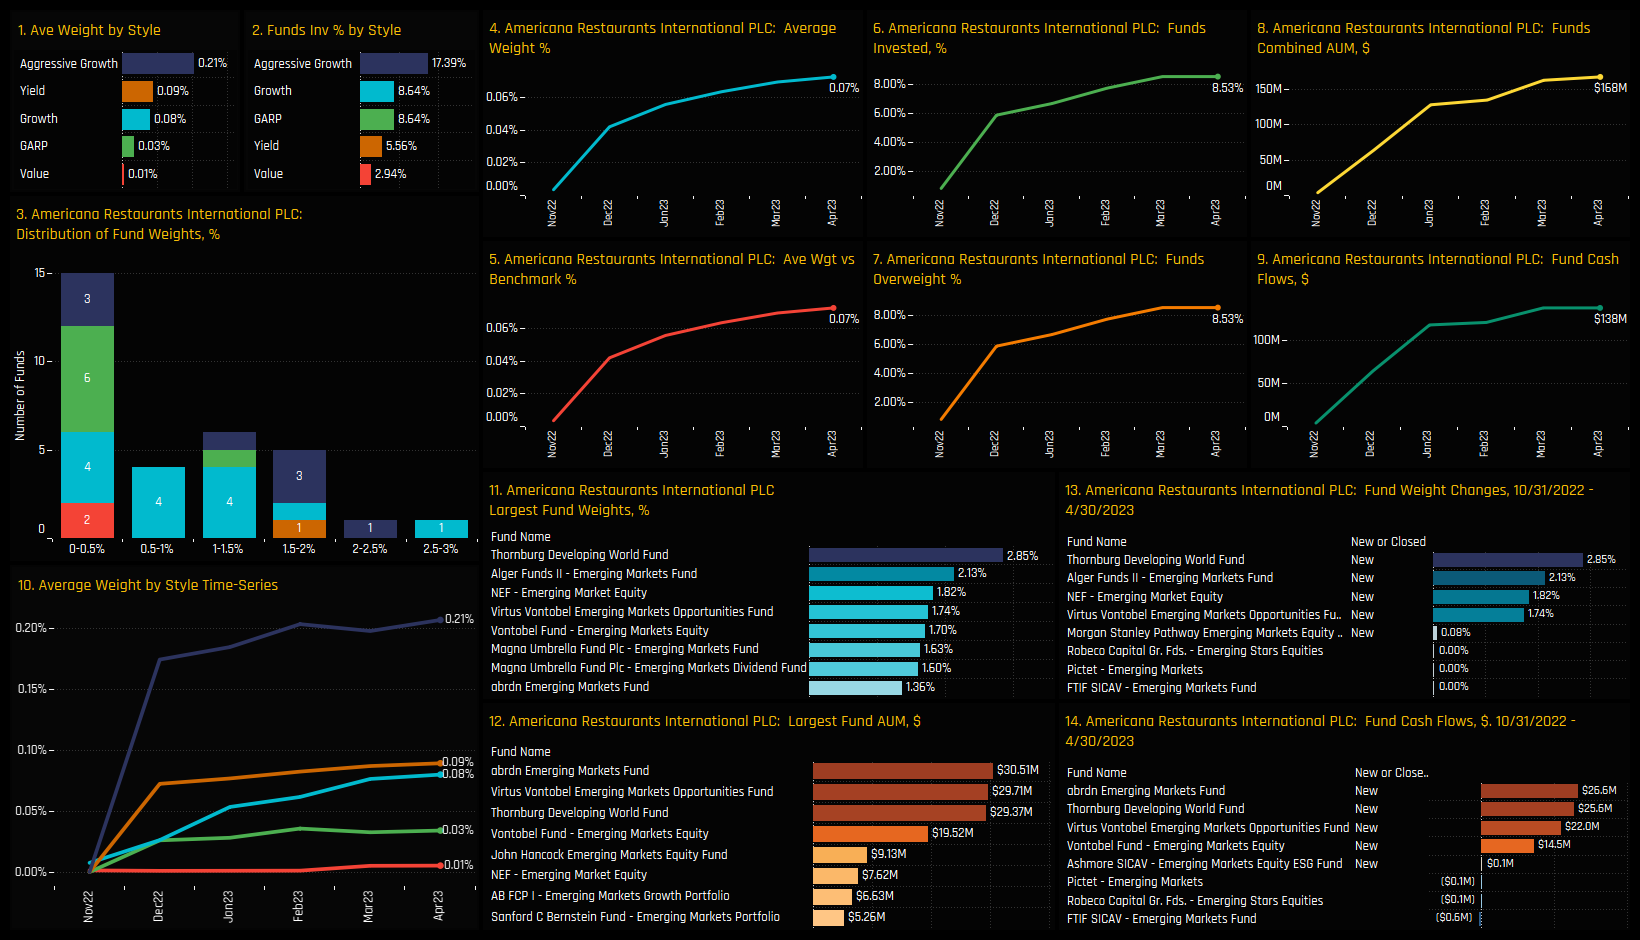
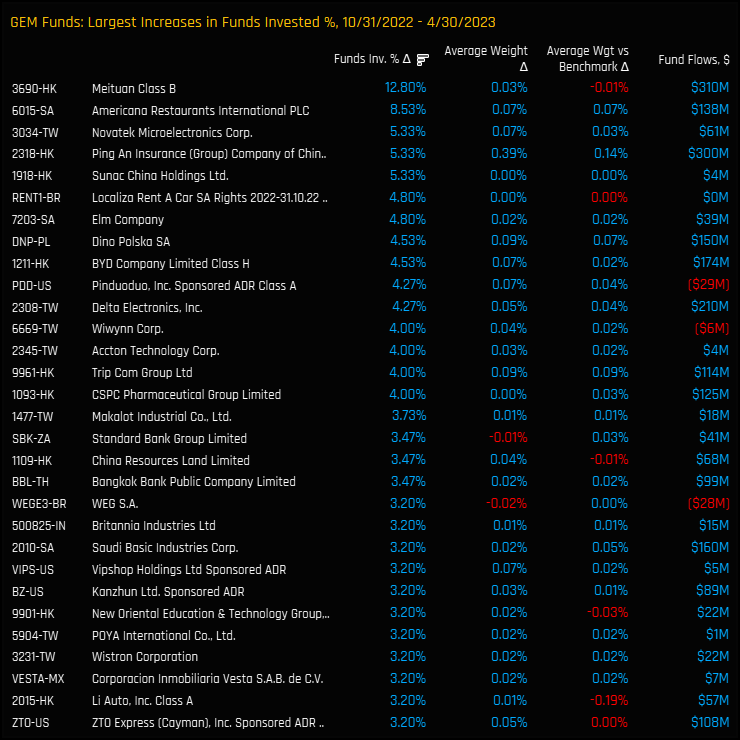
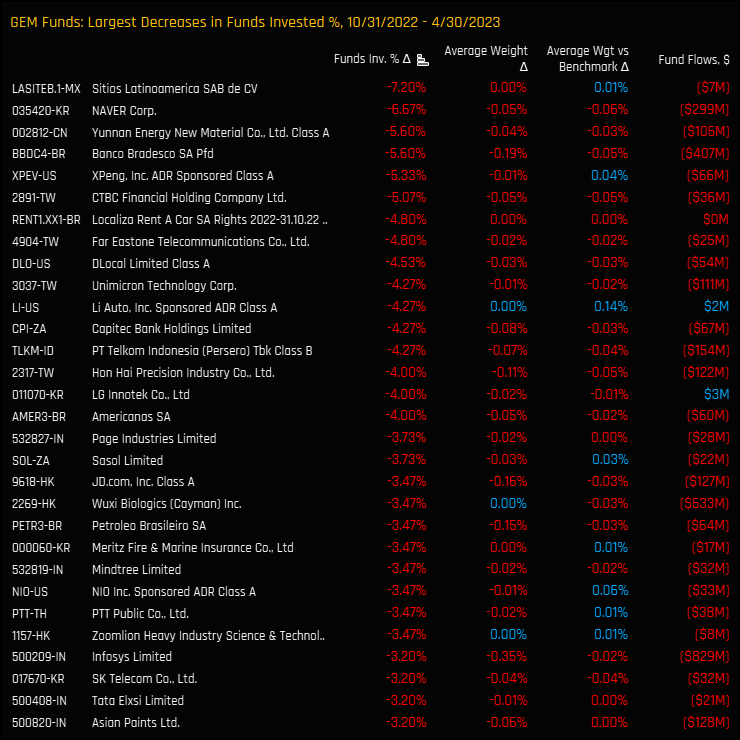
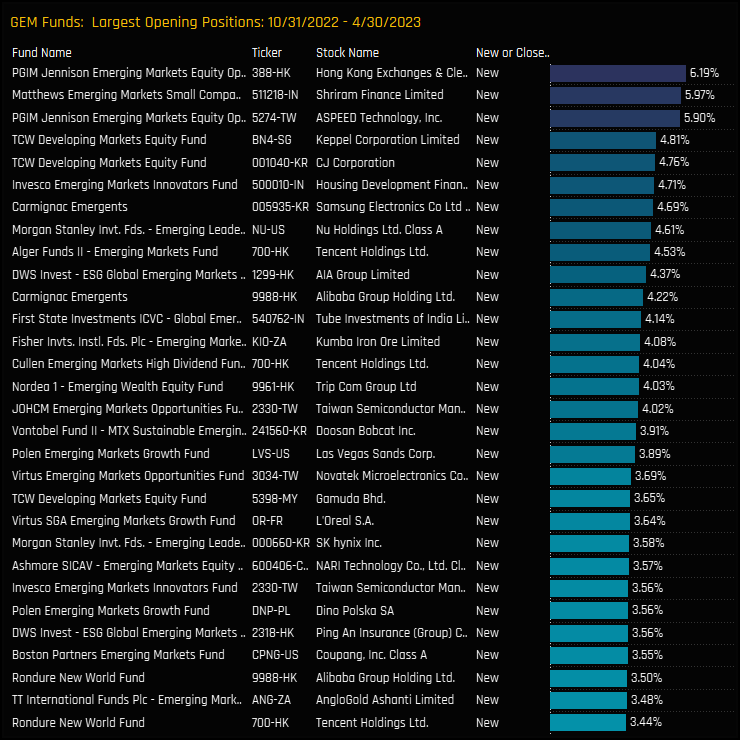
Stock level activity over the last 6-months reflects the overall increase in ‘Discretionary exposure but again isn’t all one-way. New IPO Americana Restaurants International captured investment from 8.5% of the funds in our analysis, in addition to strong ownership growth in BYD Company, Pinduoduo Inc and Trip Com Group. On the negative side, active EM managers reduced holdings in XPeng Inc, Li Auto and Americanas SA. On a fund level, new positions in Alibaba Group Holdings from Carmignac Emergents and Trip Com Group from Nordea EM Wealth Equity were the standouts.
Conclusions & Links
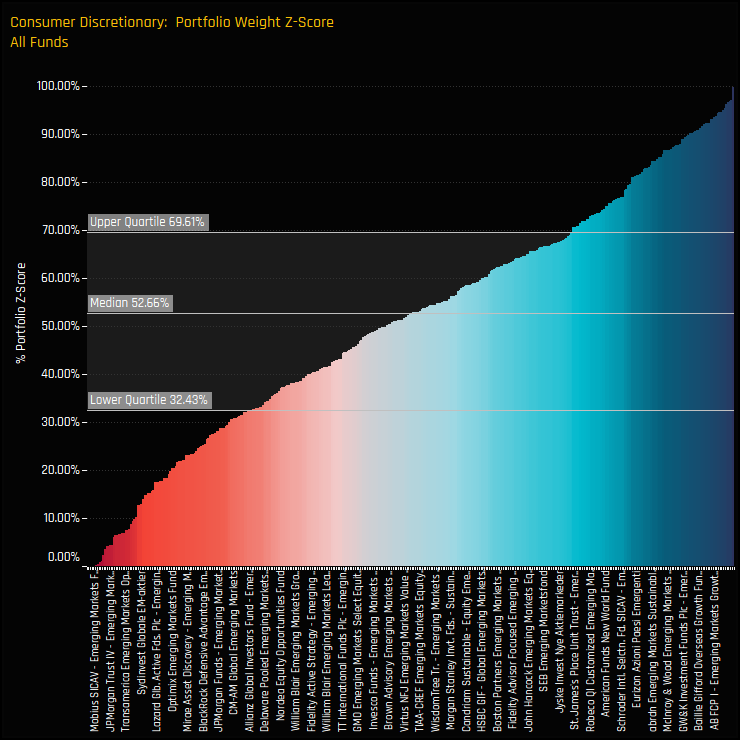
A growing number of active EM funds are positioning themselves for the outperformance of the Consumer Discretionary sector. Average overweights have risen to +2.51% above the iShares MSCI EM benchmark following a significant rotation by active managers.
Is positioning becoming stretched here? The chart to the right would suggest otherwise. It shows the Z-Score of each fund’s current weight in the Consumer Discretionary sector compared to its own history going back to 2008, or when the fund was opened if later. Three quarters of the managers in our analysis have a Z-Score of less than 69.6% and half a Z-Score of less than 52.7%. This is by no means an overowned sector.
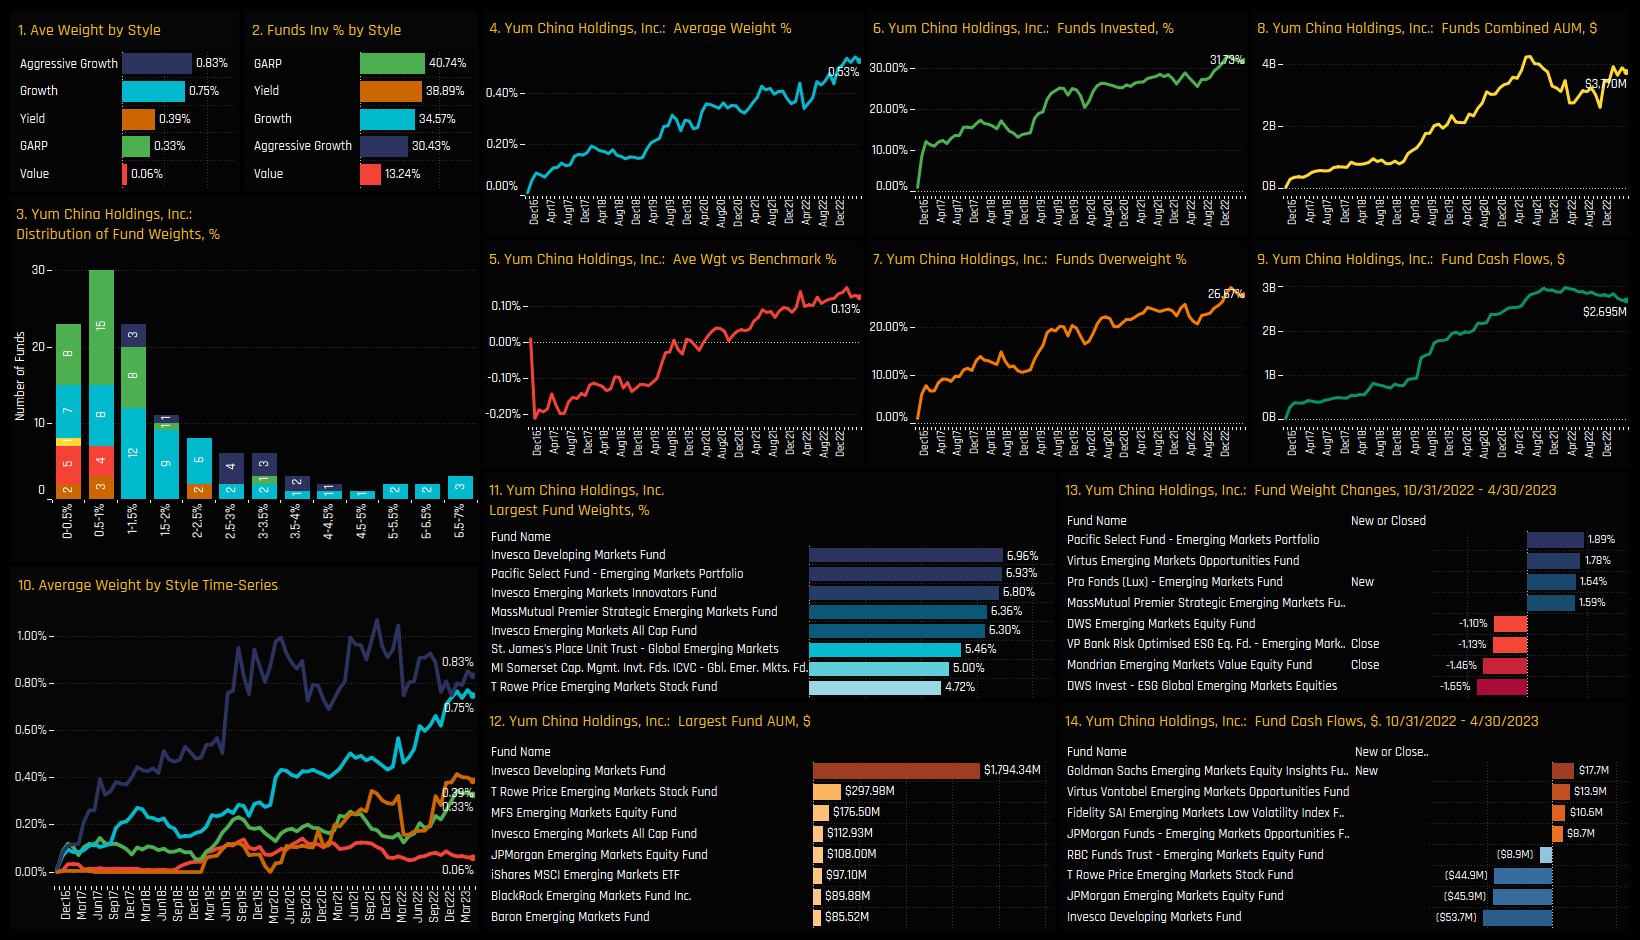
Click below for an extended data report on Consumer Discretionary positioning among the active EM funds in our analysis. Scroll down for profiles on Alibaba, Yum China Holdings, XPeng Inc and Americana Restaurants International.
Stock Profile: Americana Restaurants International PLC
375 emerging market Funds, AUM $400bn
BYD Company: Moves to Top Auto Holding in EM
After years of being an avoided stock, GEM active managers are ramping up allocations to BYD. Recent fund rotation has pushed exposure to its highest level on record.
Time-Series Analysis & Autos Activity
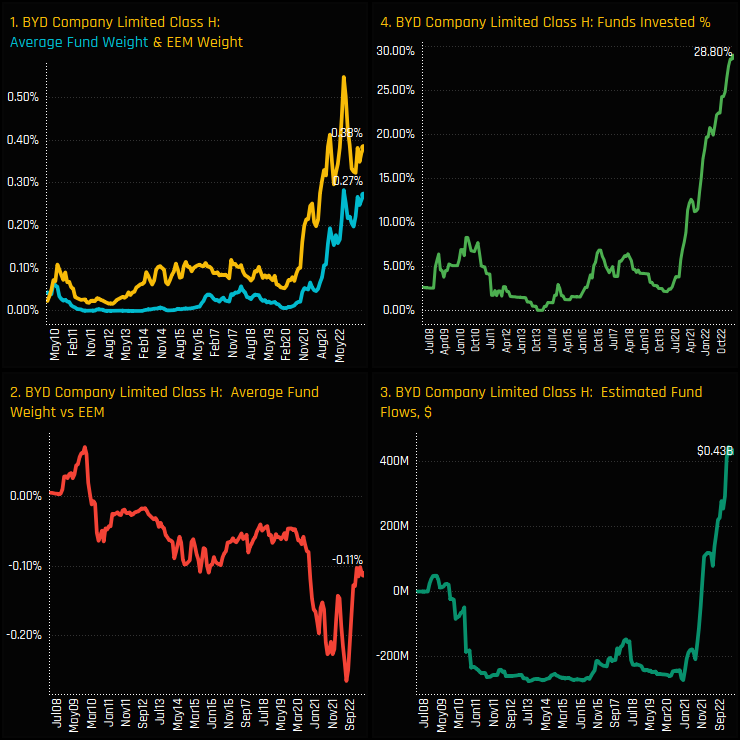
Investment in BYD Company Limited H Shares has reached a record high. The stock, which was consistently “unloved” by Emerging Market investors between 2008 and 2020, now has a record 28.8% of the funds in our analysis holding a stake. Investor sentiment changed tack in the late part of 2020 when just 5% of managers owned a position. Since then, consistent fund inflows on the back of new positions has reclassified the stock as something of an investor favourite. Active investors remain underweight the iShares MSCI EM index on average, but recent activity has seen that underweight reduce significantly.
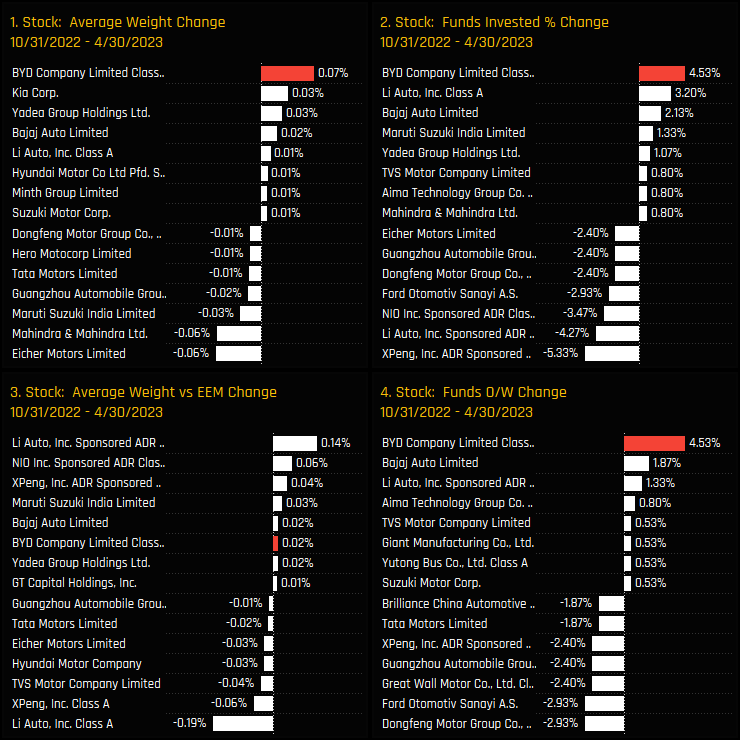
Over the last 6-months, BYD has maintained this positive momentum and has faired well versus Emerging Market peers in the Motor Vehicle industry group, as highlighted in the charts below. It captured the largest increase in average weight of +0.07% over the period, saw the percentage of funds invested rise by +4.5% and a further +4.5% of funds switch to overweight. This wasn’t part of an industry-wide move, with outflows seen in many of it’s competitors such as XPeng Inc, Li Auto and Nio Inc.
Fund Level Activity & Latest Holdings
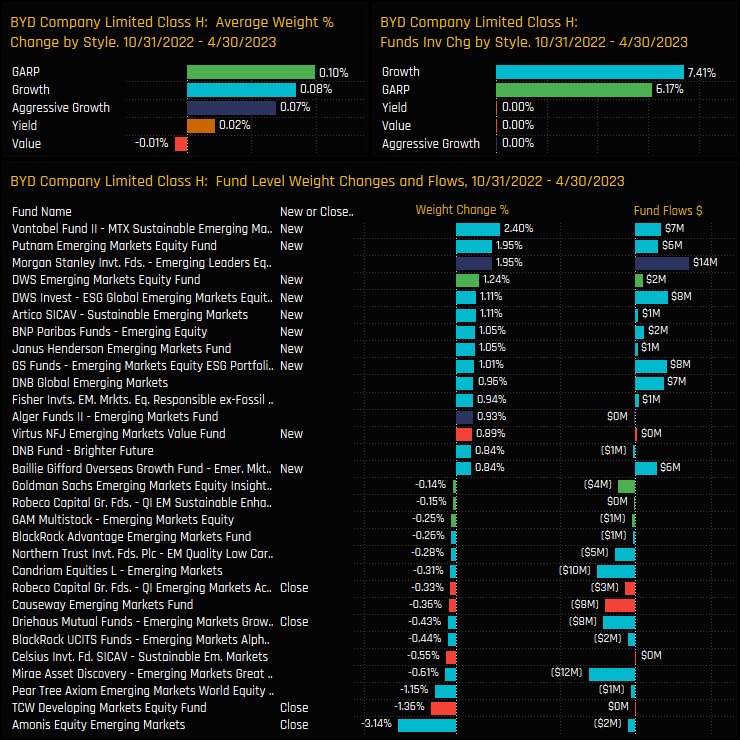
The below charts show the Style breakdown and fund level activity driving this rotation. On a Style basis, Growth and GARP funds were responsible for much of the move higher, with +7.4% and +6.2% of funds opening positions respectively. On a fund level, between 10/31/2022 and 04/30/2023, 22 funds opened new positions in BYD, led by Vontobel MTX Sustainable (+2.4%) and Putnam Emerging Markets (+1.95%).
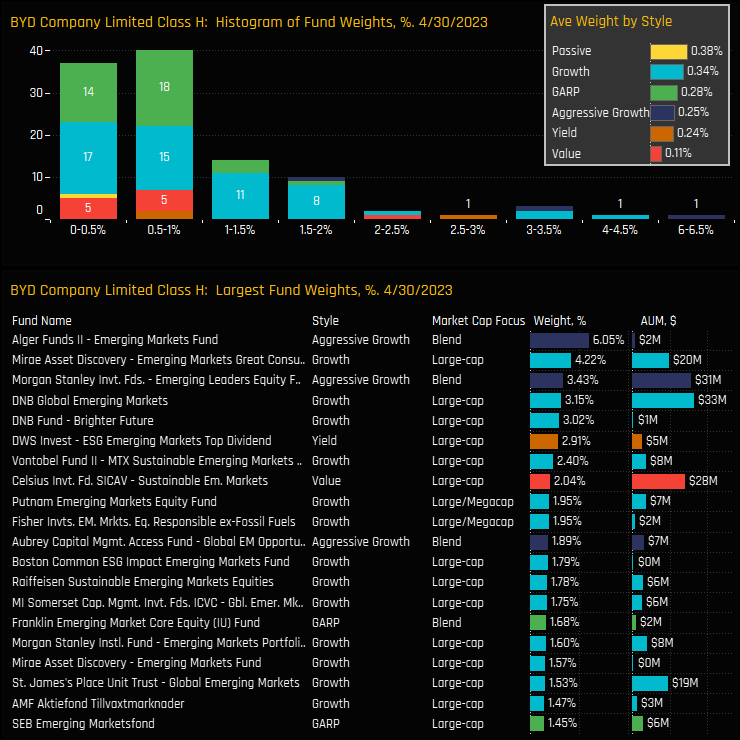
The histogram of fund weights in BYD is shown in the top chart below, and highlights the majority of holders at between the 0.0% and 2% level. Only 8 funds hold above 2% as shown in the bottom chart, led by Alger Emerging Markets (6.05%) and Mirae Emerging Markets Great Consumer (4.2%). BYD is not a particularly large holding for the majority of funds and remains a net underweight across all Style groups.
Conclusions & Links
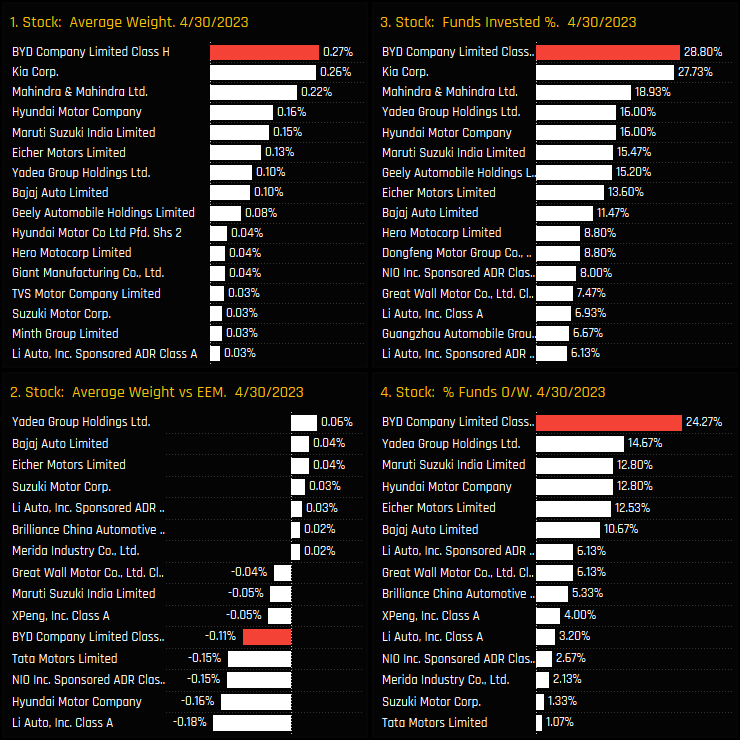
The chart to the right shows the latest ownership statistics for stocks in the Motor Vehicles industry group. BYD has risen up the ranks to become the most widely held and largest weight in the sector, surpassing Kia Corp and Mahindra & Mahindra over the last 2-years.
Clearly, EM investors are growing in confidence that BYD can maintain its leading position in the electric vehicle market, and further capitalize on the growing global trend towards sustainable transportation.
Click on the link below for an extended data report on BYD Company Limited Class H positioning among active Emerging Market funds.
The latest aggregate and fund level stock holding metrics among active Global EM investors.
Most Widely Held Stocks
The 30 most widely held stocks among GEM active equity funds
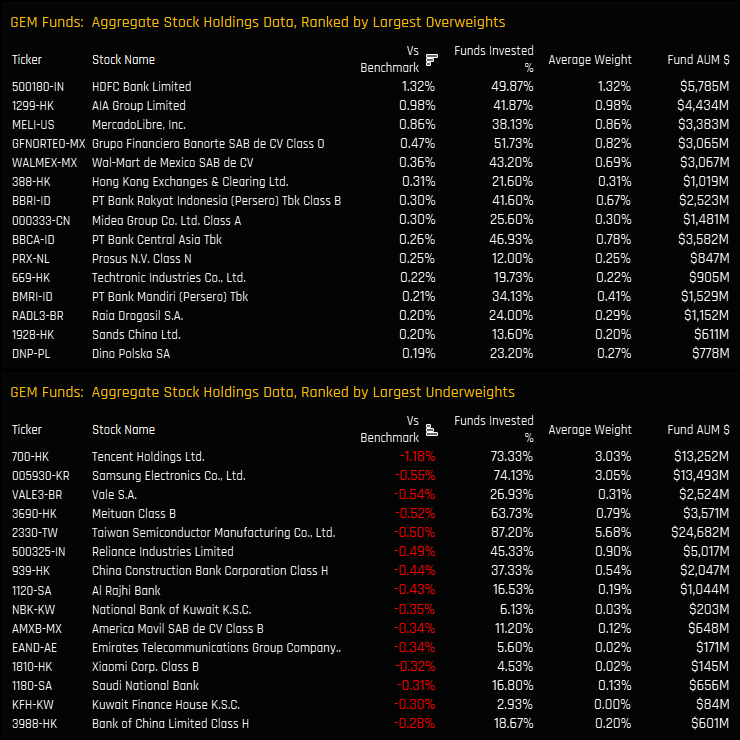
Top Over/Underweights
The top 15 aggregate overweight and underweight stock holdings
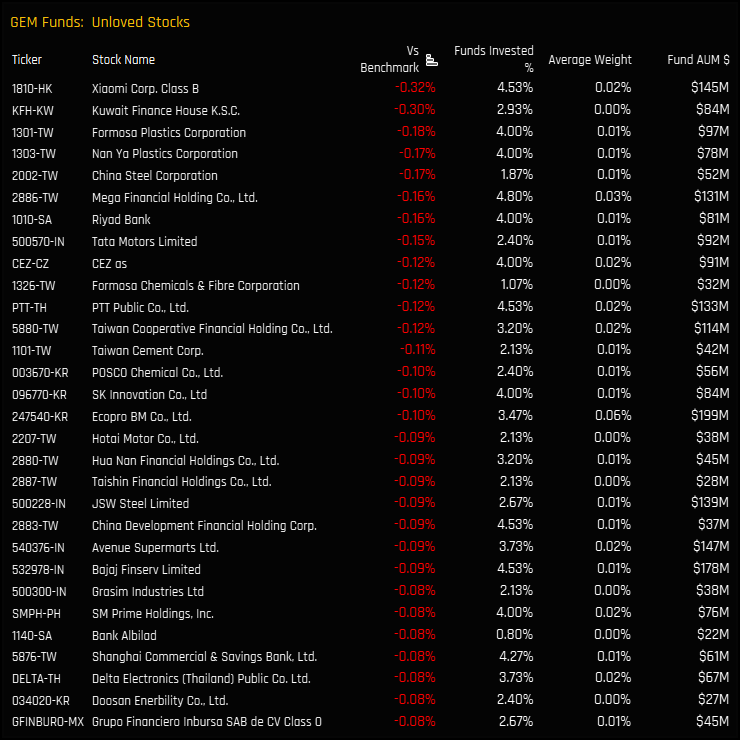
Unloved Stocks
Stocks held by less than 5% of the GEM Funds in our analysis, and net underweight vs the iShares MSCI EM ETF (cash component removed and stock weights adjusted)
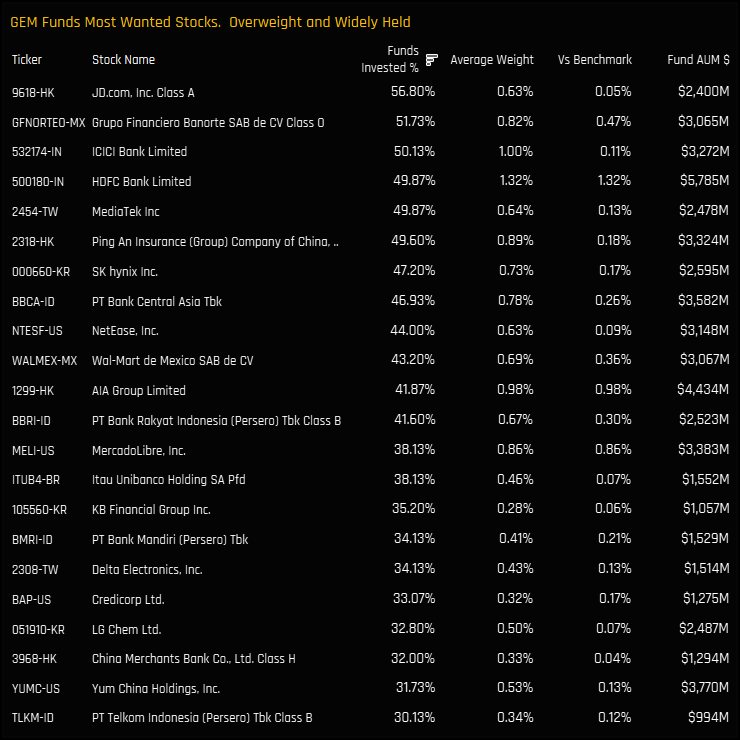
Most Wanted Stocks
Stocks held by more than 30% of the GEM Funds in our analysis, and net overweight vs the iShares MSCI EM ETF
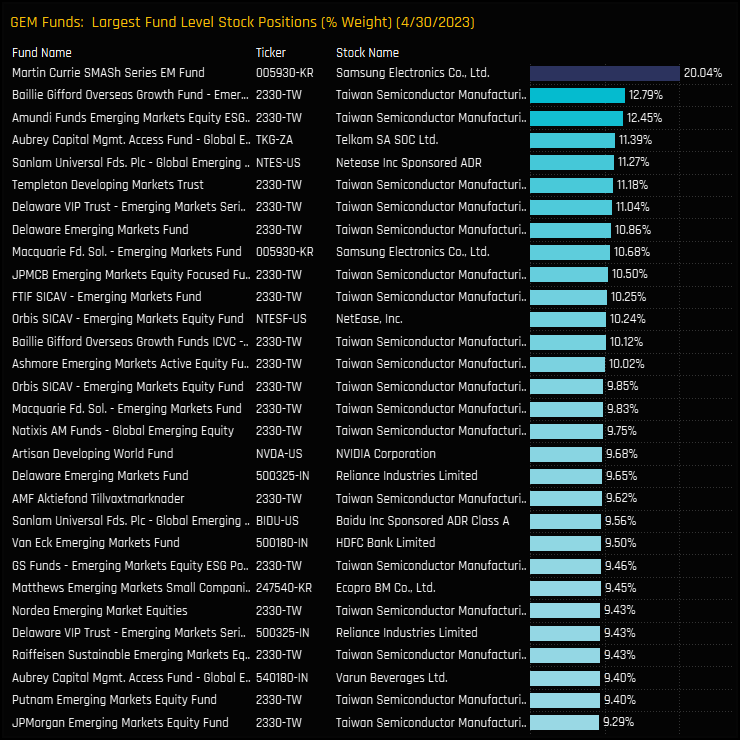
Largest Fund Level Stock Positions, %
The top 30 largest individual fund level stock positions on a portfolio weight basis.
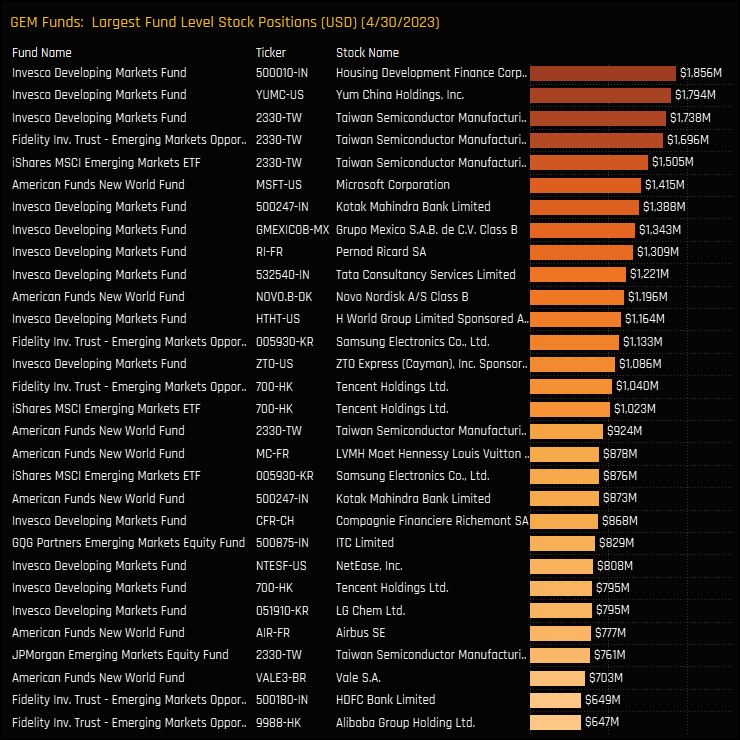
Largest Fund Level Stock Positions, $
The top 30 largest individual fund level stock positions on a fund AUM basis.
Largest Ownership Increases
The stocks with the largest net increase in the percentage of funds invested between 10/31/2022 and 04/30/2023
Largest Ownership Decreases
The stocks with the largest net decrease in the percentage of funds invested between 10/31/2022 and 04/30/2023
Largest Opening Positions
The largest opening stock positions between 10/31/2022 and 04/30/2023
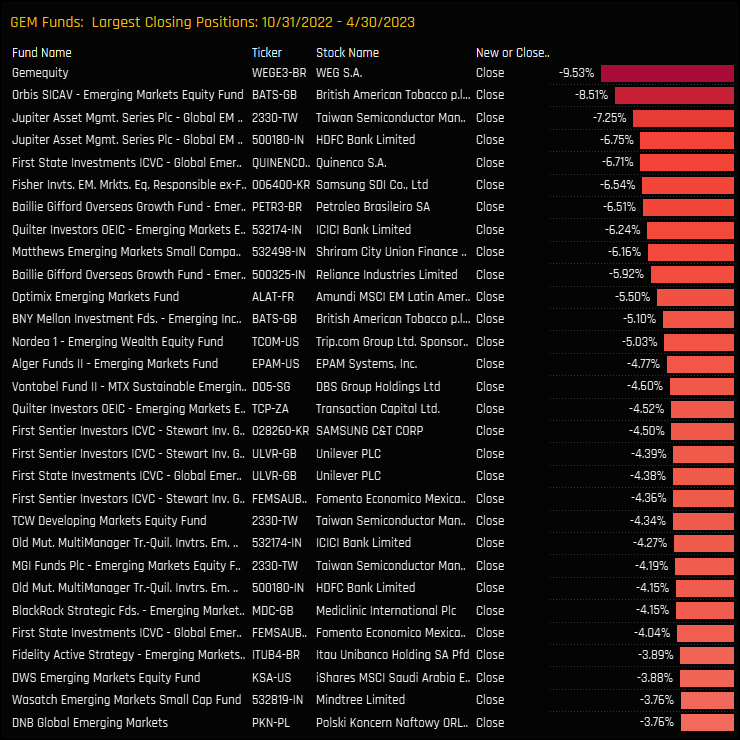
Largest Closing Positions
The largest closing stock positions between 10/31/2022 and 04/30/2023
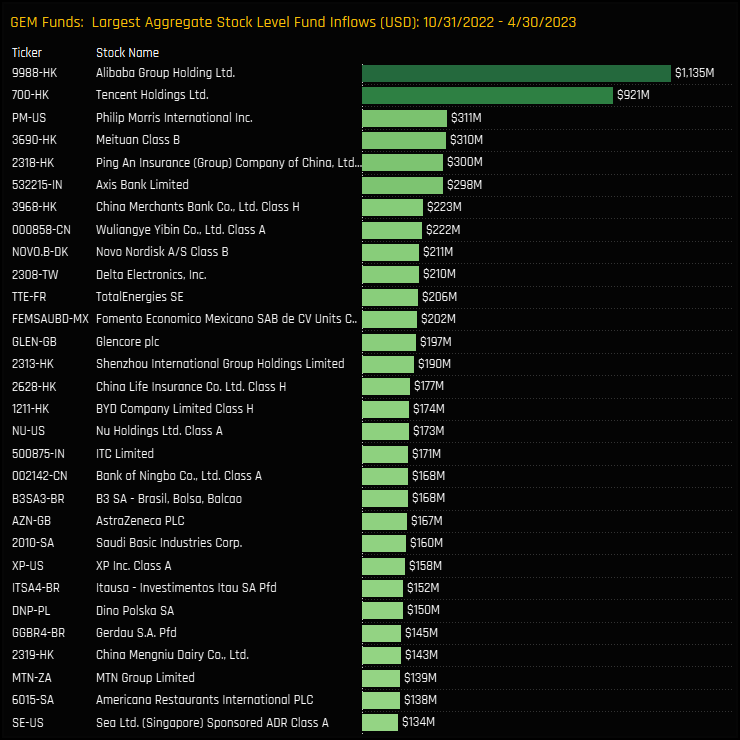
Largest Stock Inflows, $
The largest combined fund inflows on a stock level between 10/31/2022 and 04/30/2023.
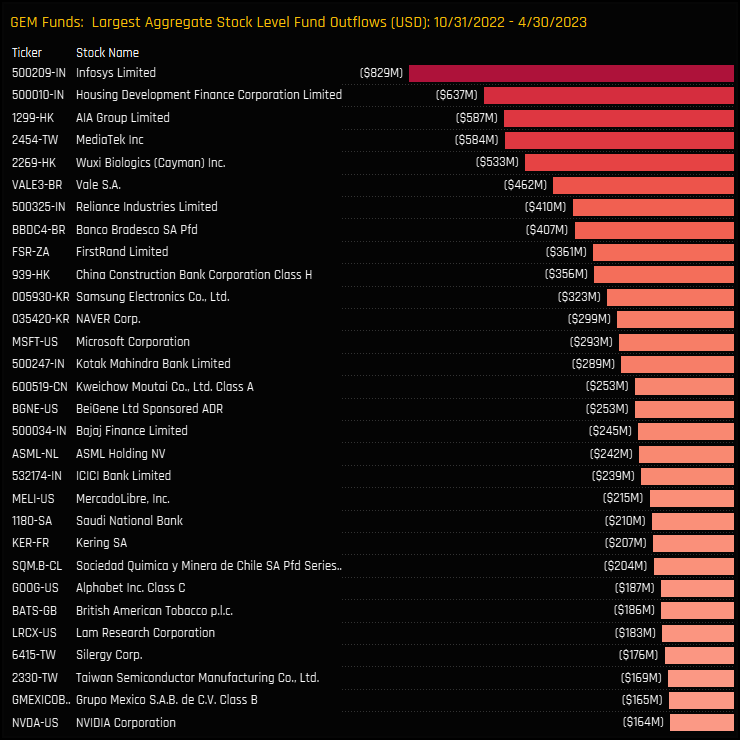
Largest Stock Outflows, $
The largest combined fund outflows on a stock level between 10/31/2022 and 04/30/2023.
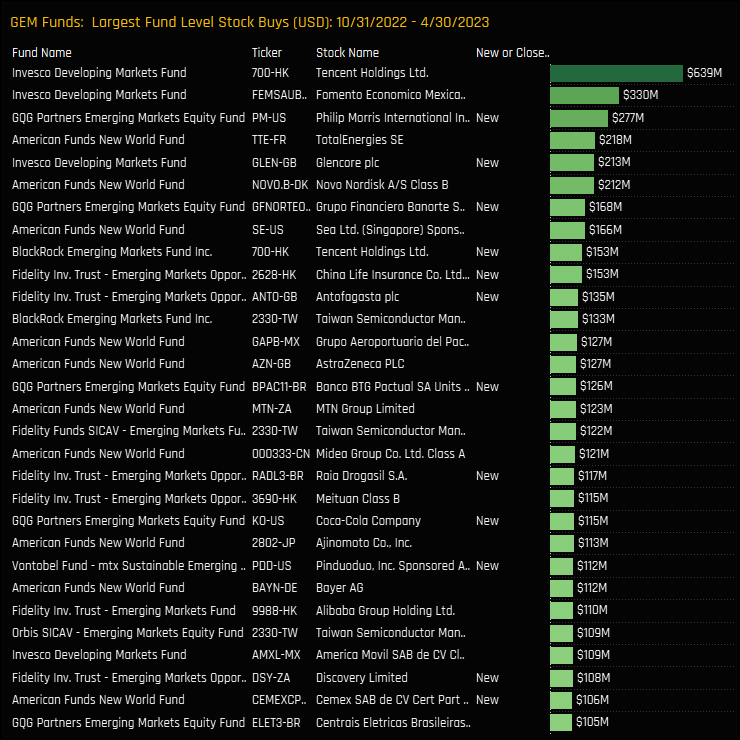
Largest Fund Level Stock Inflows, $
The largest fund level stock inflows between 10/31/2022 and 04/30/2023.
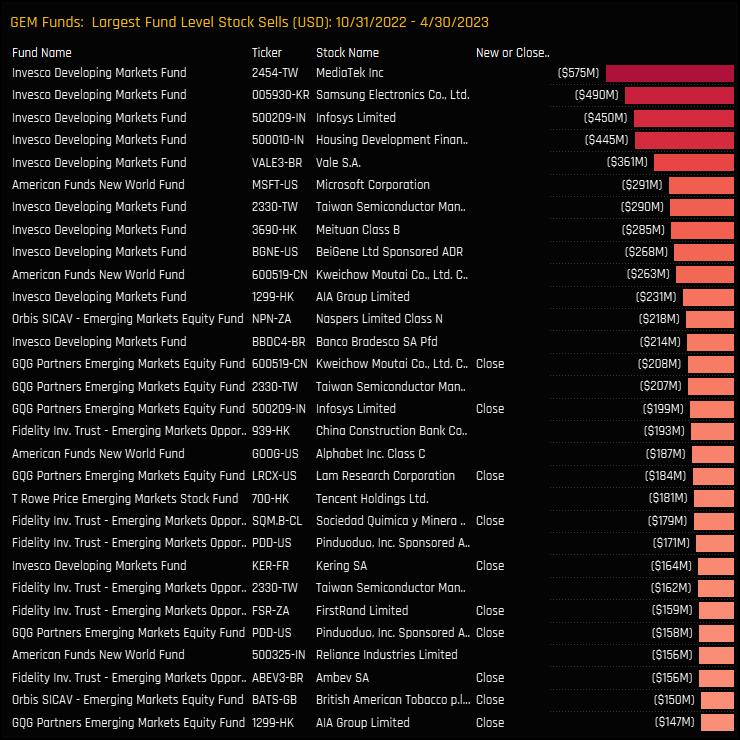
Largest Fund Level Stock Outflows, $
The largest fund level stock outflows between 10/31/2022 and 04/30/2023.
384 emerging market Funds, AUM $400bn
GEM Active Funds Ownership Report
Please click on the link below for the full data report on Global EM active fund positioning
For more analysis, data or information on active investor positioning in your market, please get in touch with me on steven.holden@copleyfundresearch.com
Investor Positioning Report — Copley Fund Research Ltd · Last updated: July 2026 · Registered in England and Wales
1. Who we are
Copley Fund Research Ltd provides proprietary institutional fund intelligence to listed companies and investor relations professionals. These terms govern every purchase of an Investor Positioning Report. By completing a purchase you confirm you have read, understood, and agreed to these terms in full.
2. What you are purchasing
The Investor Positioning Report is a bespoke PDF report mapping the institutional fund universe around your stock. It covers current investors, past investors, competitor investors, and white space investors. Every report is built from scratch for the specific company ordered and is not a standardised or templated product.
3. Delivery and process
Following payment or invoice issuance, Copley Fund Research will contact you within one working day to agree your competitor set. Production begins once the competitor set is confirmed in writing. The completed report will be released to you within 48 hours of production starting, provided payment has been received in full; where payment is outstanding, the report will be withheld until payment clears. If the requested company falls outside our covered fund universes, or a competitor set cannot be agreed, Copley Fund Research will issue a full refund or cancel the outstanding invoice.
4. Competitor set agreement
The competitor set is agreed with you in writing prior to production, and the report is built to that agreed specification. Requests to amend the competitor set after delivery, based on a change of preference rather than an error, may be treated as a new order.
5. Refund policy
Because each report is produced individually for your company, orders are non-refundable once production has begun, except as set out in clauses 3 and 5a below. By purchasing, you agree not to dispute the charge with your card provider on the basis that the service was not as described, provided the report has been delivered to the agreed specification or corrected under clause 5a.
5a. Quality remedy
If a delivered report contains a material error caused by Copley Fund Research — for example, an incorrect company analysed, a competitor omitted from the agreed set, or content missing from the specification in clause 2 — Copley Fund Research will correct and redeliver the report at no additional charge, within a reasonable timeframe. This is your sole remedy for such errors.
6. Data and accuracy
All fund positioning data in the report reflects holdings as disclosed at the most recently available reporting date at the time of compilation. The timing of fund holdings disclosures is determined by regulatory requirements applicable to each fund and is outside the control of Copley Fund Research Ltd. This data may not reflect current fund positions. Copley Fund Research takes reasonable care to ensure accuracy but makes no warranty, express or implied, as to the completeness or current accuracy of the underlying data — though this does not affect the quality remedy in clause 5a for errors in how that data was analysed or presented. Past fund positioning is not indicative of future fund behaviour or investment decisions.
7. Not investment advice
The Investor Positioning Report is produced for investor relations intelligence purposes only. It does not constitute investment advice, financial advice, or a recommendation to buy, hold, or sell any security. The data reflects historical fund positioning and must not be relied upon as a prediction of future fund behaviour or investment decisions. Copley Fund Research Ltd is not authorised or regulated by the Financial Conduct Authority for the provision of investment advice.
8. Permitted use and confidentiality
The report is licensed for internal use by the purchasing organisation only. You may share it with employees and directors of your organisation. You may not: reproduce, redistribute, publish, or resell the report or any part of it; share it with any third party outside your organisation without prior written consent; use the fund or portfolio manager names contained in the report to approach those individuals on behalf of Copley Fund Research or in a manner that could damage Copley Fund Research's relationships with those funds; or use the data for any purpose other than your own investor relations strategy. The data, analysis, and methodology contained in the report are the intellectual property of Copley


