Active Asia Ex-Japan managers are reassessing their exposure to the Energy sector
Time-Series & Sector Activity
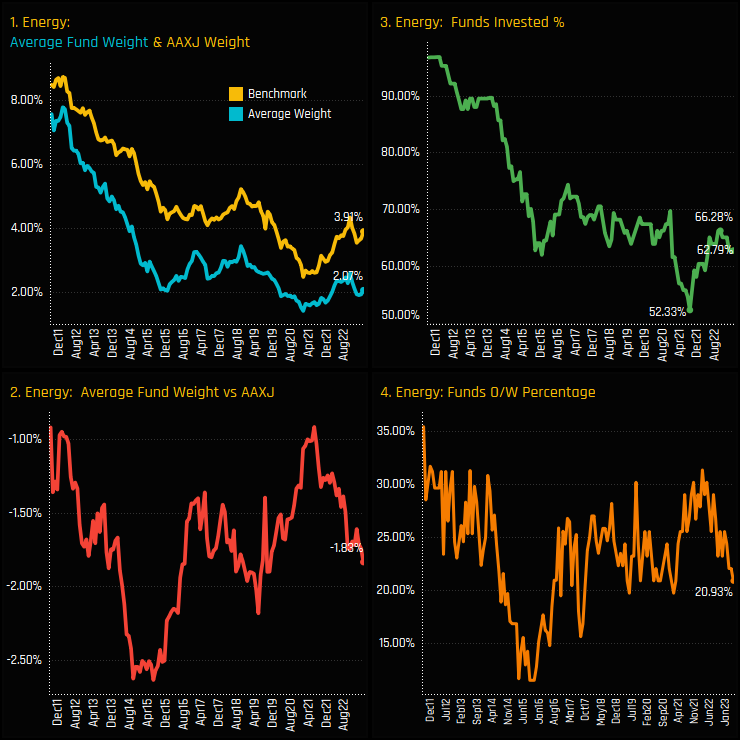
The recovery in Energy allocations among Asia Ex-Japan funds has stalled, and has started to reverse. The long-term decline in Energy exposure is plain to see in charts 1 and 3 below. They show falling average weights between the period 2011 and 2021, both in the benchmark and among active funds (ch1). More significantly, there has been a fall in the percentage of active funds with any exposure to the Energy sector at all (ch3). This trend hit a bottom in late 2021, with the percentage of funds invested rallying from a low of 52% to a high of 66.3% in October last year. Since then, the direction of travel has reversed, with funds either closing out entirely or switching to an underweight position (ch4).
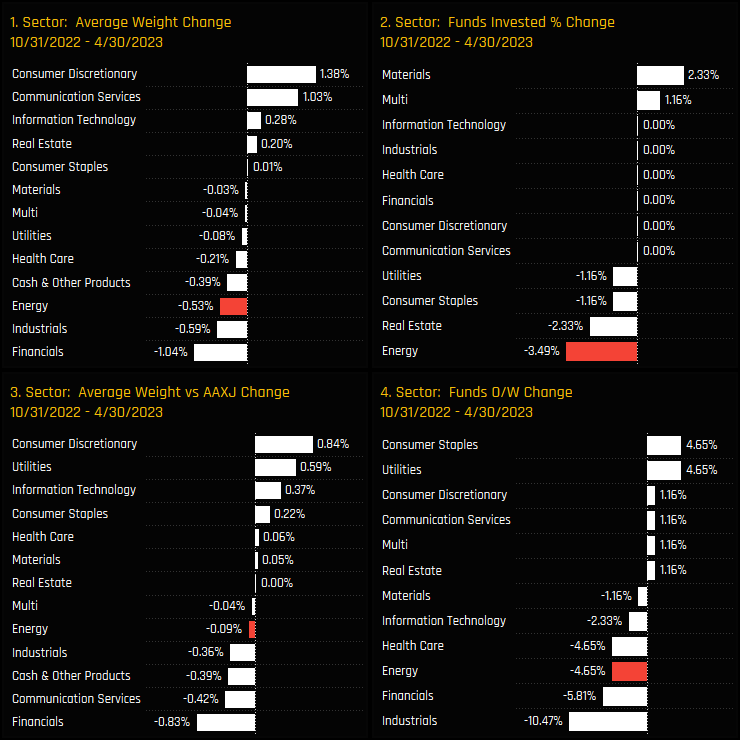
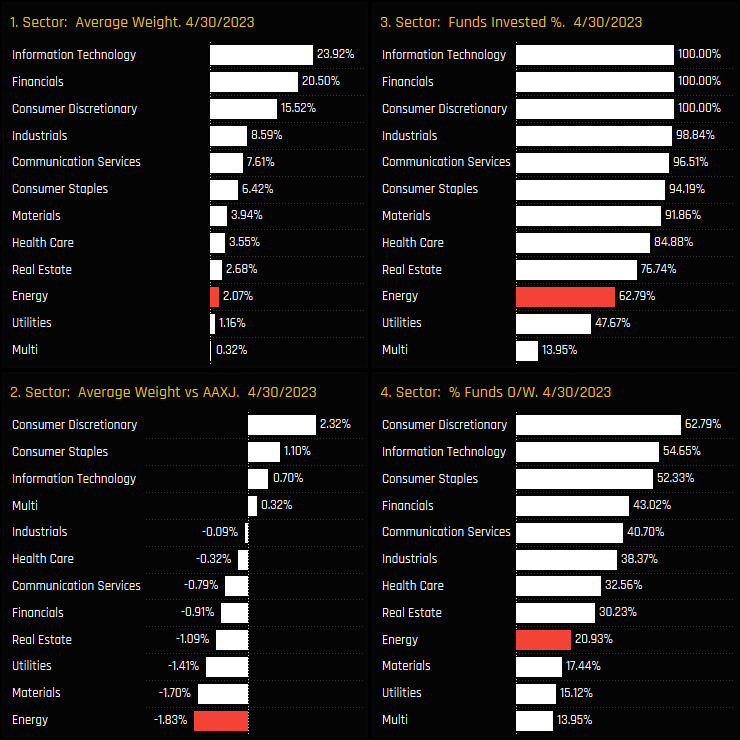
The charts below show the change in sector level ownership among Asia Ex-Japan funds since the start of the recent decline until today (10/31/2022 to 04/30/2023). The Energy sector saw the largest decline in outright ownership (ch2) and the 3rd largest drop in average fund weights (ch1) over the period, with Asia Ex-Japan investors instead increasing exposure to the Consumer Discretionary, Communication Services and Technology sectors. Versus the benchmark, net underweights increased by -0.09% as a further 4.65% of funds moved to underweight.
Fund Holdings & Activity
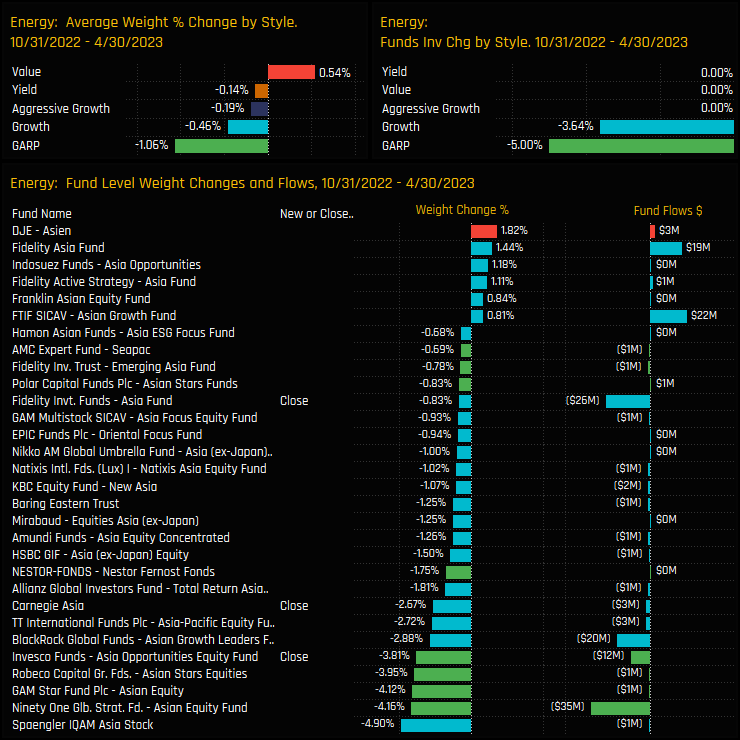
Over the same 6-month period, all Style groups except Value scaled back holdings as shown in the top charts below. GARP funds saw the largest declines, with -5% of funds closing exposure entirely and average weights falling by -1.06%. On a fund level, the majority of activity was to the sell side, with 3 closures and some large weight reductions led by Spaengler Asia Stock (-4.9%) and Ninety One Asian Equity (-4.2%).
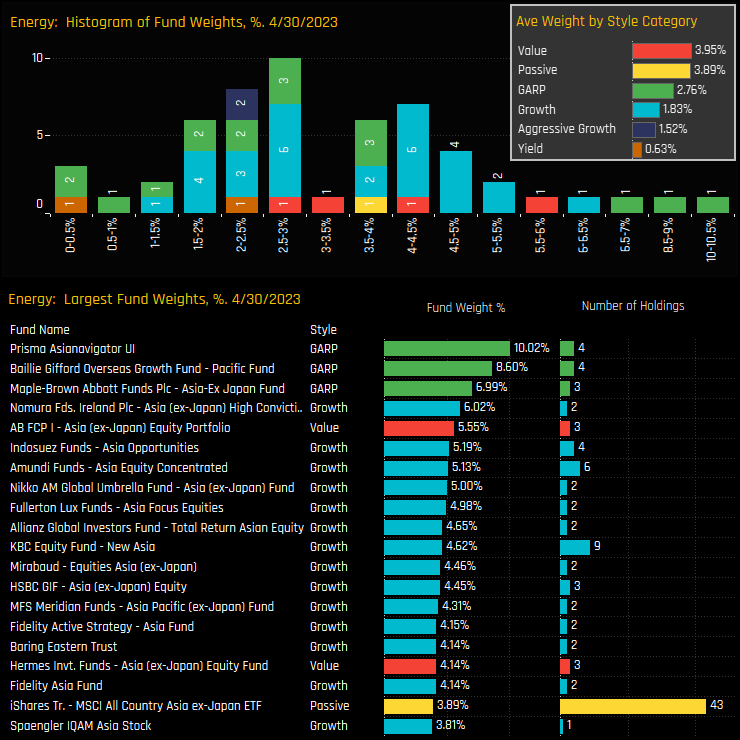
Of the remaining 62.8% of managers holding exposure to the Energy sector, the majority hold between a 1.5% and 5% allocation, with holdings maxing out at 10% for the Prisma Asianavigator Fund. Allocations are largely correlated to Style, with Value funds holding 3.95% on average versus Aggressive Growth on 1.52%. Most of the top holders own less than 4 stocks in the sector, compared to 43 for the iShares MSCI AAXJ ETF.
Country Holdings & Activity
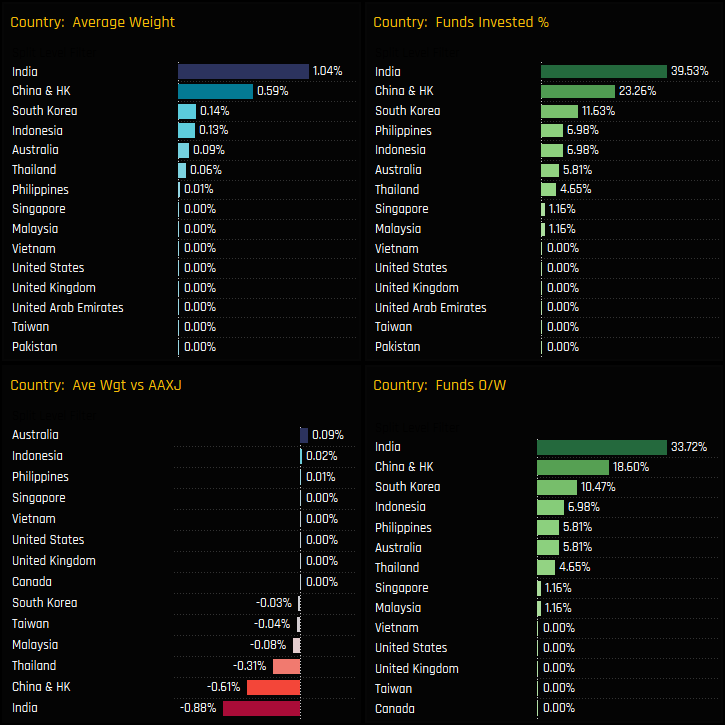
Broken down by country, Energy is dominated by India and China & HK, who account for 79% of the total Energy allocation. Despite this, both countries are not widely held, with just 39.5% holding Indian Energy exposure and 23.3% China & HK Energy. As such, both countries represent net underweights compared to the iShares MSCI Asia Ex-Japan ETF, alongside the almost totally avoided Thailand.
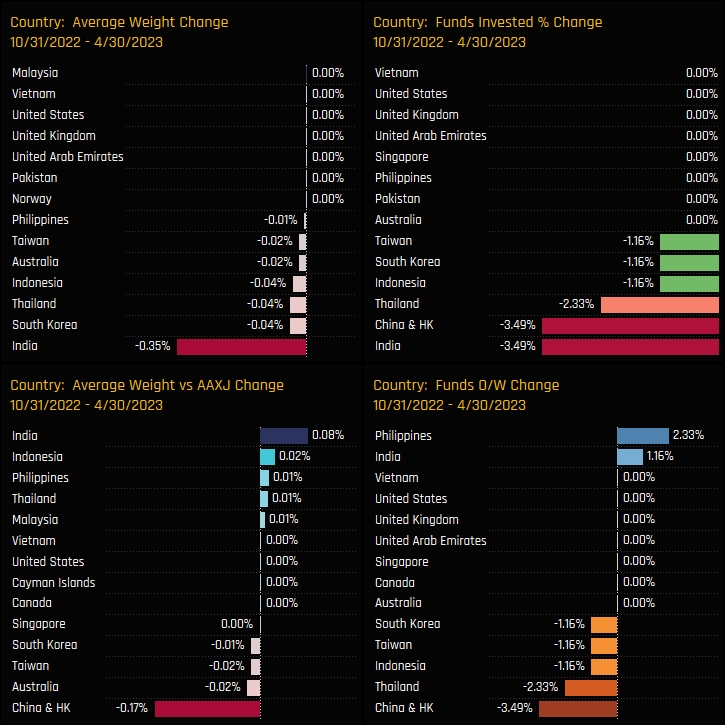
Country level changes over the last 6-months reflect the overall decline in Energy exposure, and are led by India’s -0.35% fall in average weight and -3.5% drop in funds invested. China & HK Energy faired little better, losing the same number of investors and with underweights increasing by a further -0.17%. In short, there were very few positives.
Stock Holdings & Activity
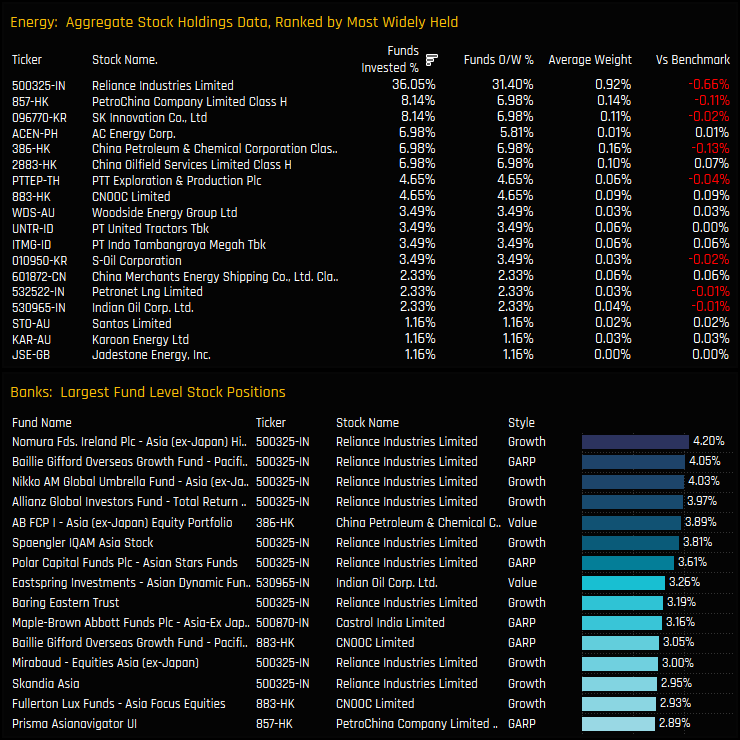
On a stock level, Reliance Industries is a hugely dominant exposure within the Energy sector. It is owned by 36% of funds at an average weight of 0.92% and accounts for almost all of the total Indian energy exposure. In contrast, China & HK Energy exposure is spread over a wider number of companies, with PetroChina Company, China Petroleum & Chemical and China Oilfield Services held by between 6%-8% of investors and at similar average weights.
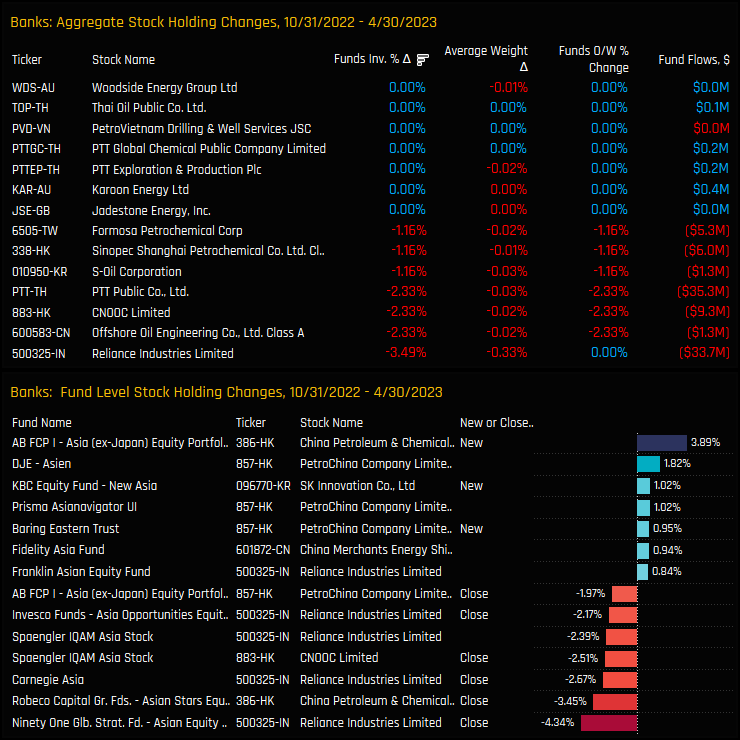
Stock ownership changes over the last 6-months were negative across the board. Reliance Industries lost investment from -3.5% of the funds in our analysis as average weights fell by -0.33%. Offshore Oil Engineering Co and CNOOC Limited saw the percentage of funds fall by -2.3%, with no stock seeing an increase over the period. On a fund level, the larger closures were in Reliance Industries and led by Ninety One Asian Equity (-4.34%) and Carnegie Asia (-2.67%).
Conclusions & Links
Active Asia Ex-Japan managers are reassessing their exposure to the Energy sector. After a brief respite from the long-term downward trend in ownership between 2021 – 2022, managers have once again started to reduce positions.
On a stock level, Reliance Industries is clearly the bellwether for the sector, accounting for almost half of the total Energy exposure among active funds. But recent activity has seen selected managers exit the stock, and it remains a key underweight for active managers in the region. Outside of Reliance Industries, there doesn’t appear to be a high degree of conviction among any of the other stocks in the sector.
The chart to the right shows Energy well down the pecking order of sector allocations among managers, with only Utilities a smaller allocation on average. Versus the iShares MSCI AAJX ETF, Energy is the largest sector underweight alongside Materials and Utilities, with managers overweight the Consumer sectors and Information Technology.
All of this combines to make Energy a low conviction holding among active Asia Ex-Japan managers. The funds in our analysis appear comfortable in being positioned underweight or with no exposure at all, and with an investible universe that is lacking appeal, there are few signs of this changing.
Click on the links below for a more detailed report on the Asia Ex-Japan Energy sector.
After years of being an avoided stock, Asia Ex-Japan managers are ramping up allocations to BYD. Recent fund rotation has pushed exposure to its highest level on record.
Time-Series & Stock Activity
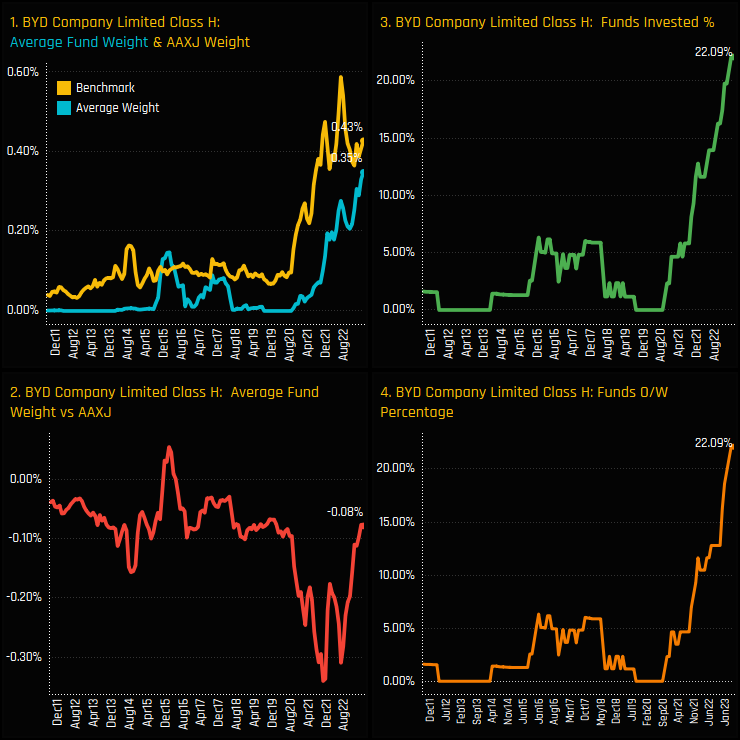
Ownership in BYD Company Limited H Shares has soared to record levels. A consistent ‘unloved’ stock among Asia Ex-Japan investors between 2010 and 2020, the percentage of funds invested has risen from zero at the end of 2020 to just over 22% today. This remarkable rise has resulted in the collapsing of a sizeable underweight position that ran from 2020 – 2022. Sentiment has never been stronger.
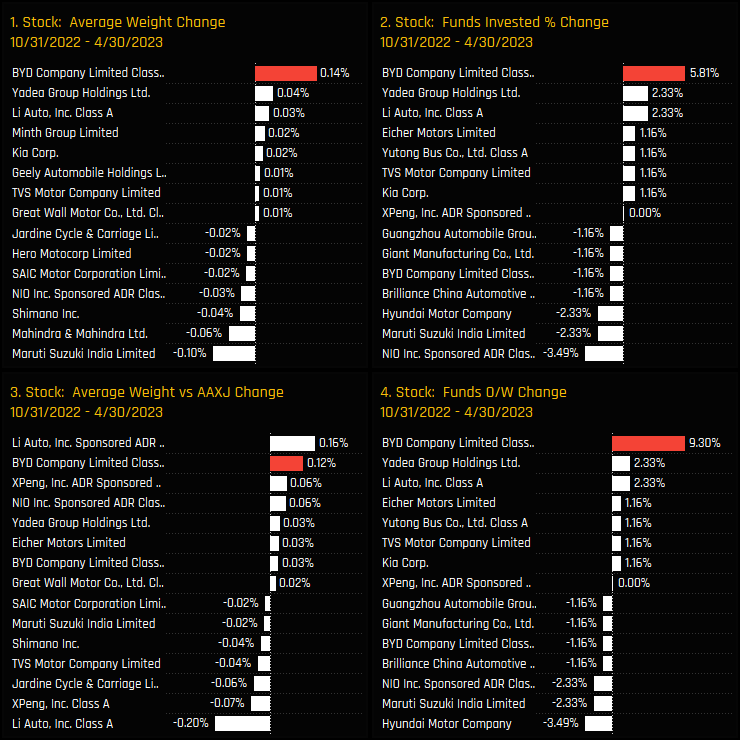
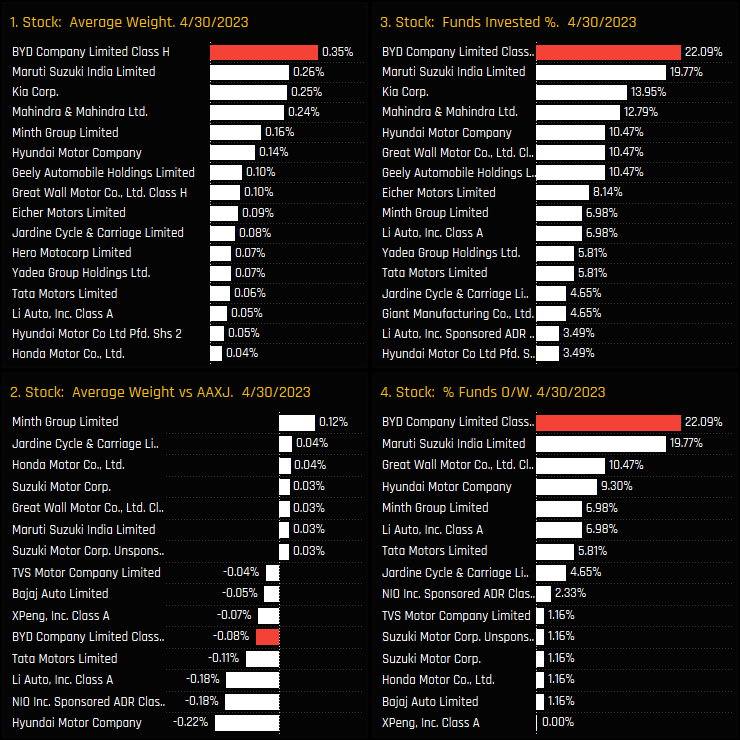
Over the last 6-months, BYD has maintained this positive momentum and has faired well versus Asia Ex-Japan peers in the Motor Vehicle industry group, as highlighted in the charts below. It captured the largest increase in average weight of +0.14% over the period, saw the percentage of funds invested rise by +5.8% and a further +9.3% of funds switch to overweight. This wasn’t part of an industry-wide move, with outflows seen in many of it’s competitors such as Nio Inc, Maruti Suzuki and Hyundai Motor Company.
Fund Activity & Positioning
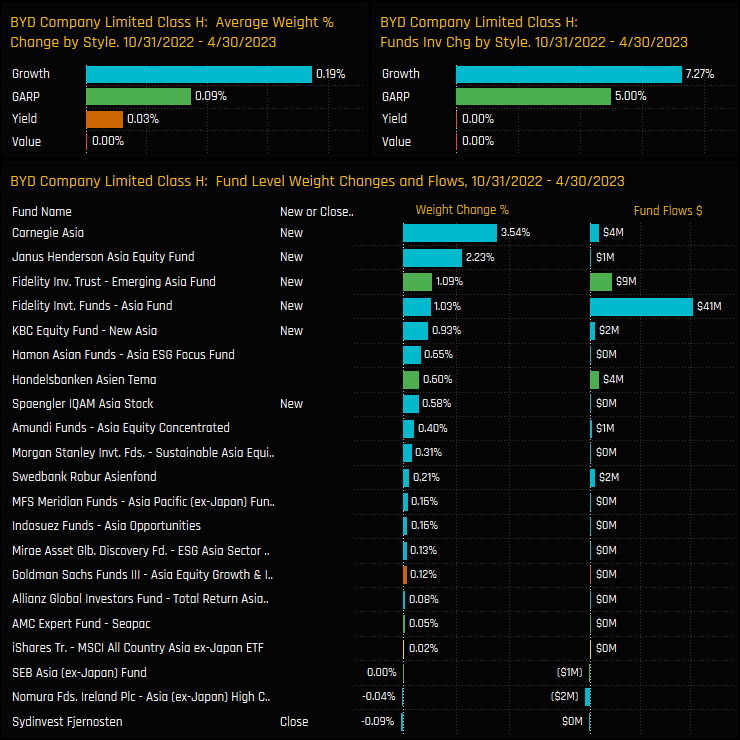
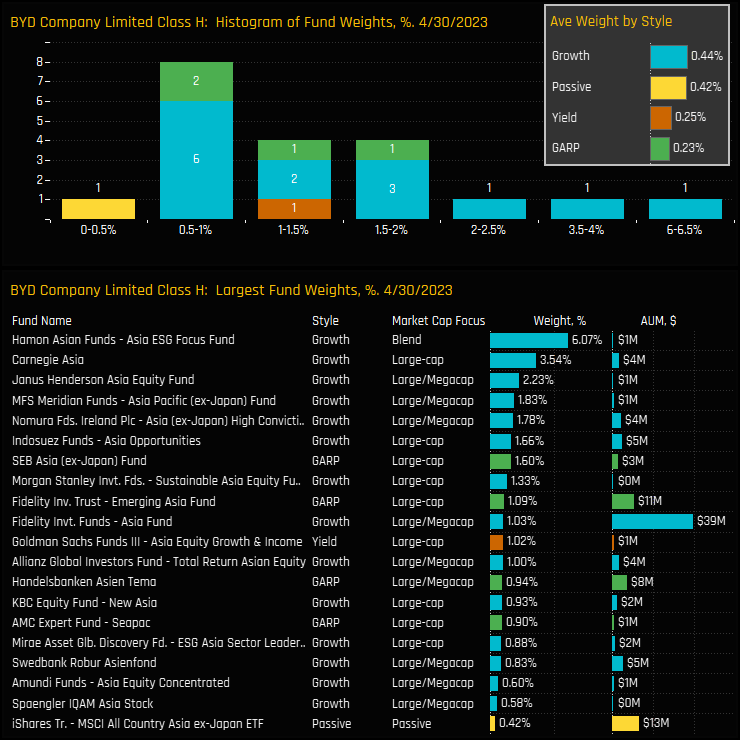
The below charts show the Style breakdown and fund level activity driving this rotation. On a Style basis, Growth and GARP funds were responsible for much of the move higher. On a fund level, between 10/31/2022 and 04/30/2023 a further 6 funds opened new positions in BYD, led by Carnegie Asia (+3.54%) and Janus Henderson Asia Equity (+2.23%).
The histogram of fund weights in BYD is shown in the top chart below, and highlights the majority of holders at between the 0.5% and 2% level. Only 3 funds are above 2% as shown in the bottom chart. BYD is therefore not a particularly large holding in the majority of portfolios, but all current holders are positioned ahead of the benchmark weight of 0.42%.
Conclusions & Links
The chart to the right shows the latest ownership statistics for stocks in the Motor Vehicles industry group. BYD has risen up the ranks to become the most widely held and largest weight in the sector, surpassing Maruti Suzuki and Kia Corp over the last 2-years.
Clearly, Asia Ex-Japan investors are growing in confidence that BYD can maintain its leading position in the electric vehicle market, and further capitalize on the growing global trend towards sustainable transportation.
Click on the link below for an extended data report on BYD Company Limited Class H positioning among active Asia Ex-Japan funds.
The latest aggregate and fund level stock holding metrics among active Asia Ex-Japan investors.
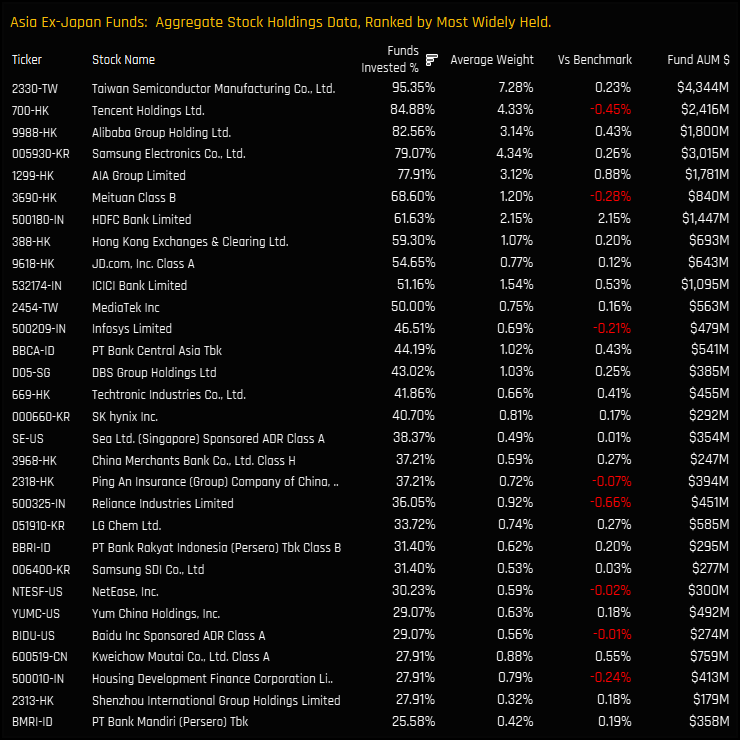
Most Widely Held Stocks
The 30 most widely held stocks among Asia Ex-Japan Active Funds
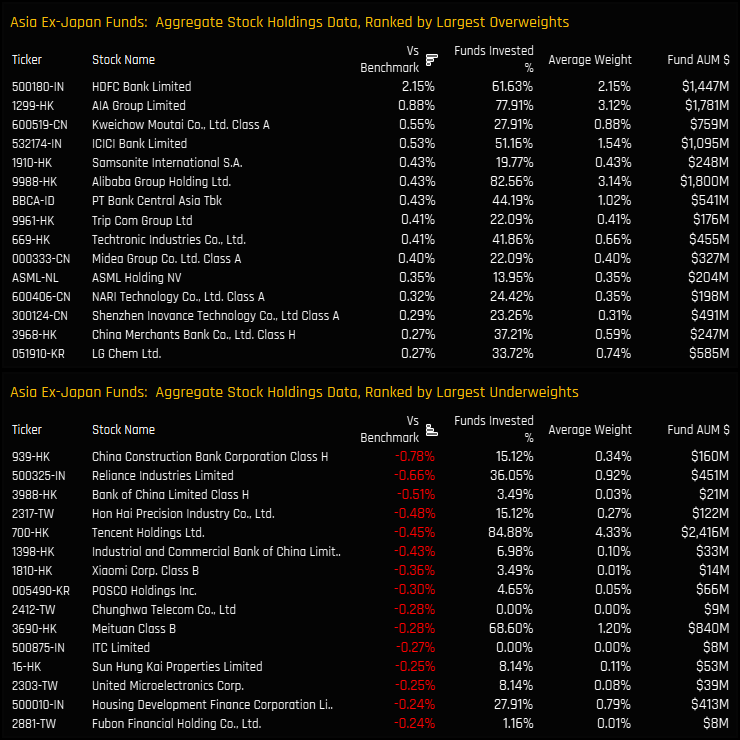
Top Over/Underweights
The top 15 aggregate overweight and underweight stock holdings
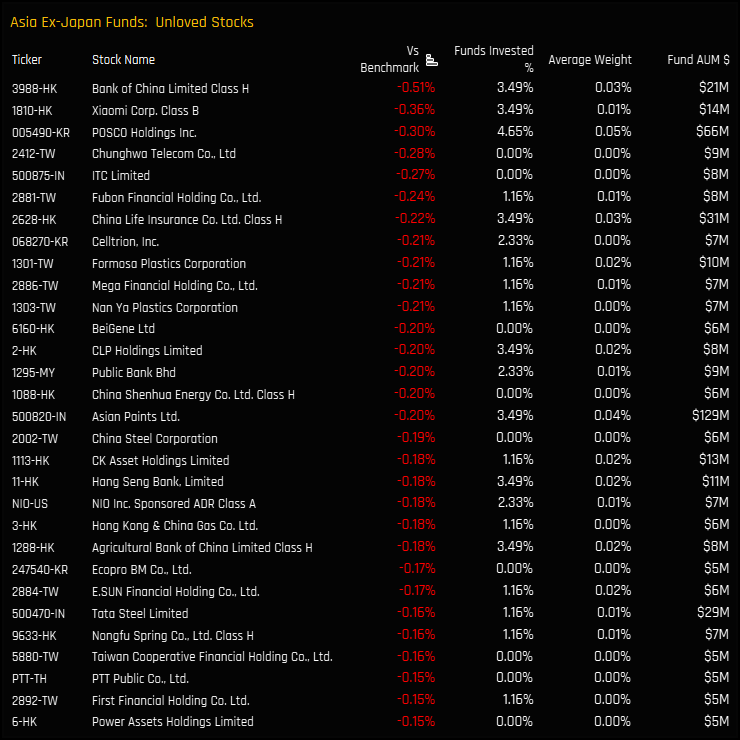
Unloved Stocks
Stocks held by less than 5% of the Asia Ex-Japan Funds in our analysis, and net underweight vs the iShares Asia Ex-Japan ETF (cash component removed and stock weights adjusted)
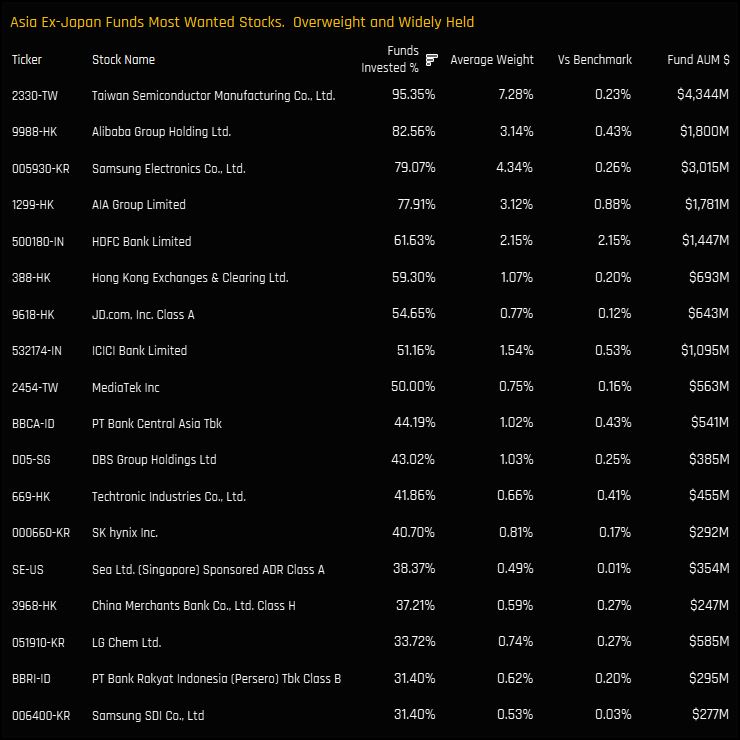
Most Wanted Stocks
Stocks held by more than 30% of the Asia Ex-Japan Funds in our analysis, and net overweight vs the iShares Asia Ex-Japan ETF.
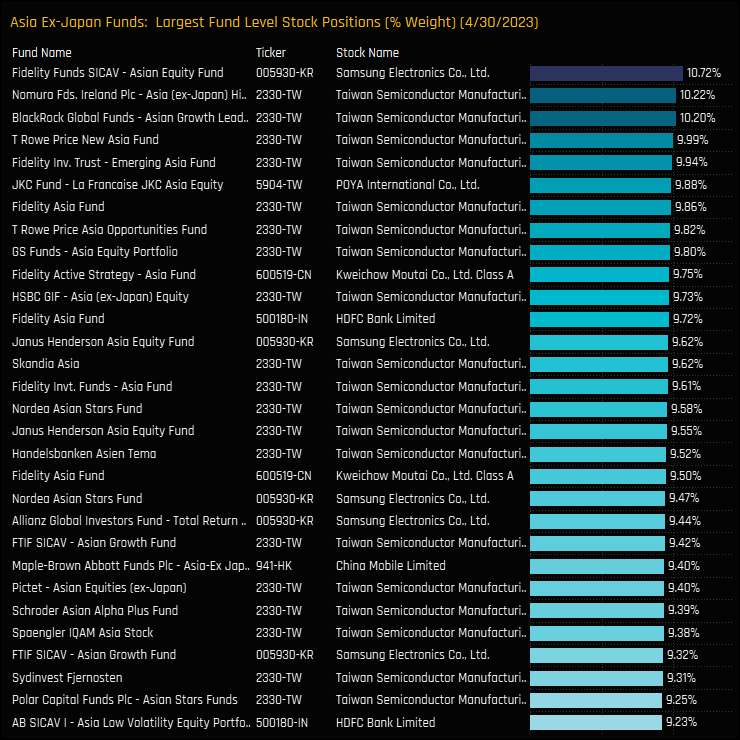
Largest Fund Level Stock Positions, %
The top 30 largest individual fund level stock positions on a portfolio weight basis.
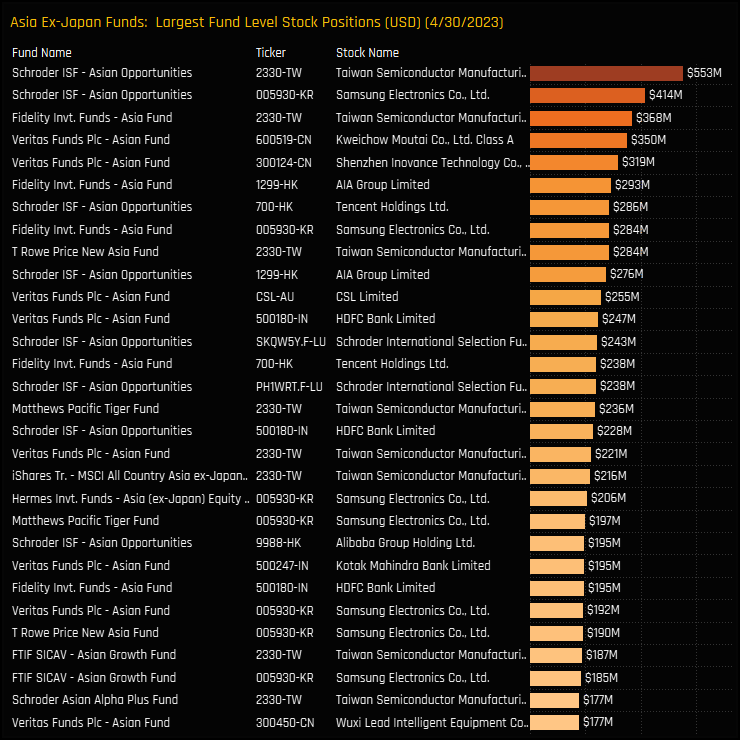
Largest Fund Level Stock Positions, $
The top 30 largest individual fund level stock positions on a fund AUM basis.
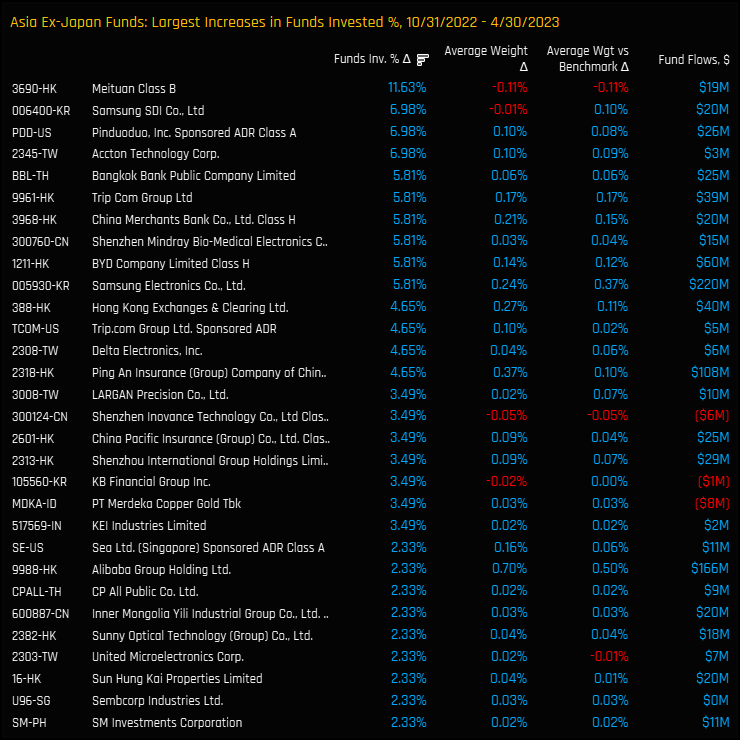
Largest Ownership Increases
The stocks with the largest net increase in the percentage of funds invested between 10/31/2022 and 04/30/2023
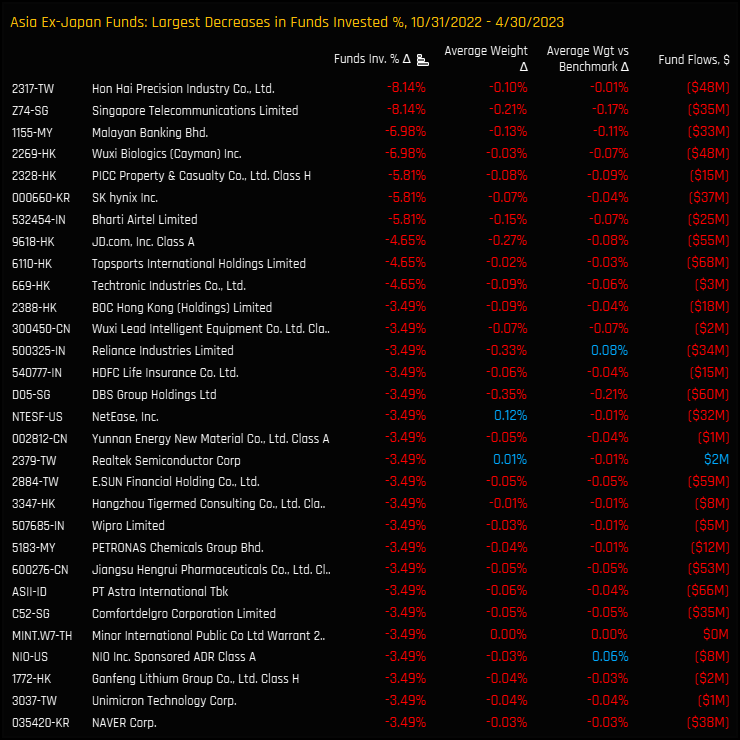
Largest Ownership Decreases
The stocks with the largest net decrease in the percentage of funds invested between 10/31/2022 and 04/30/2023
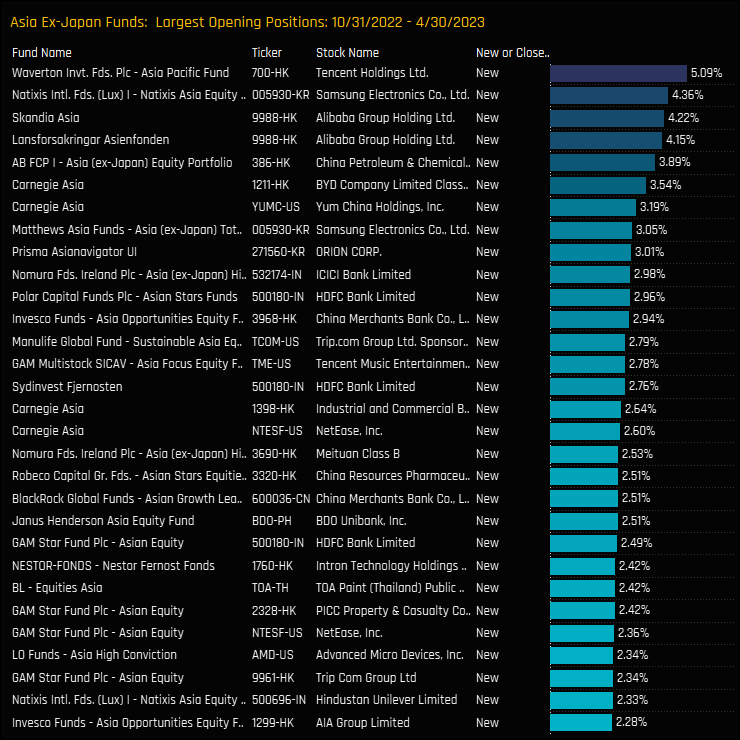
Largest Opening Positions
The largest opening stock positions between 10/31/2022 and 04/30/2023
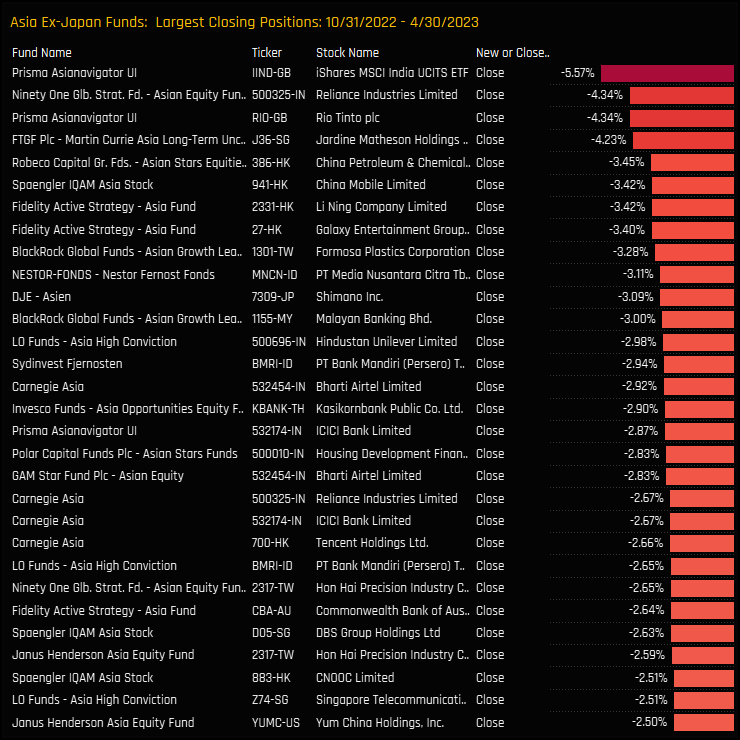
Largest Closing Positions
The largest closing stock positions between 10/31/2022 and 04/30/2023
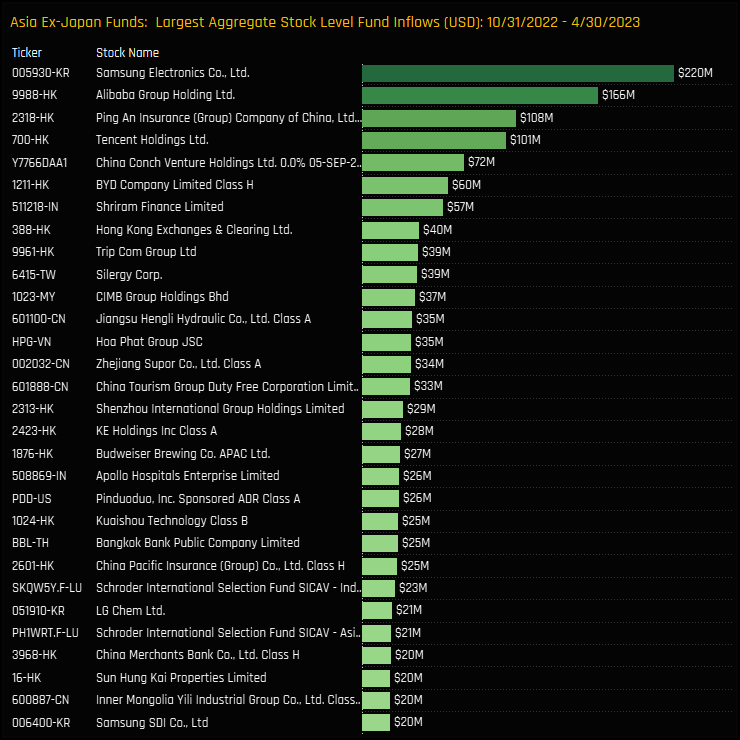
Largest Stock Inflows, $
The largest combined fund inflows on a stock level between 10/31/2022 and 04/30/2023.
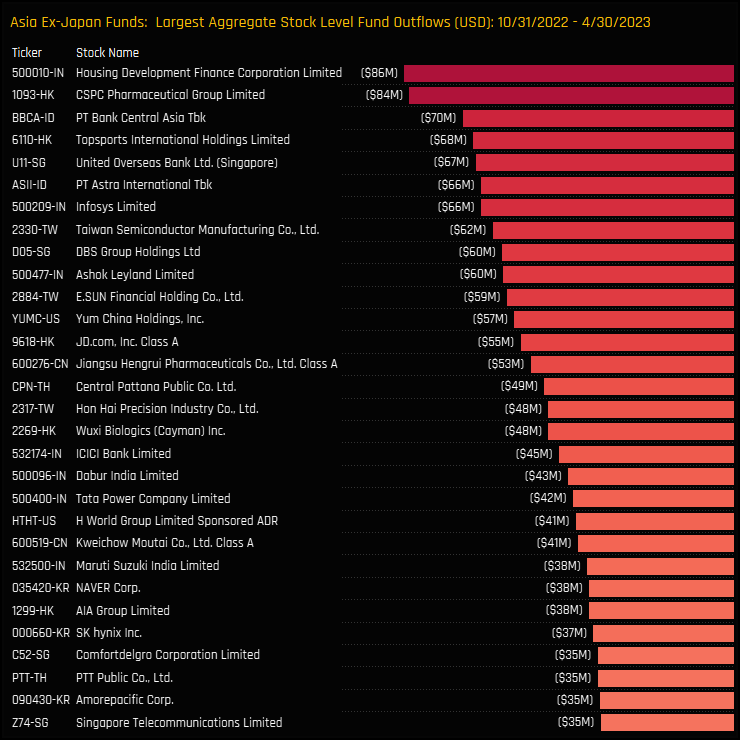
Largest Stock Outflows, $
The largest combined fund outflows on a stock level between 10/31/2022 and 04/30/2023.
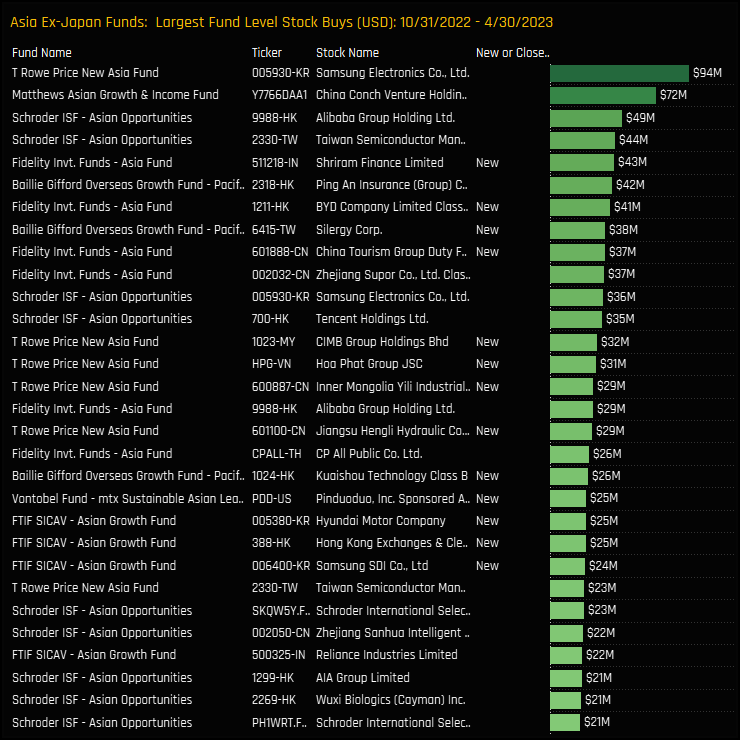
Largest Fund Level Stock Inflows, $
The largest fund level stock inflows between 10/31/2022 and 04/30/2023.
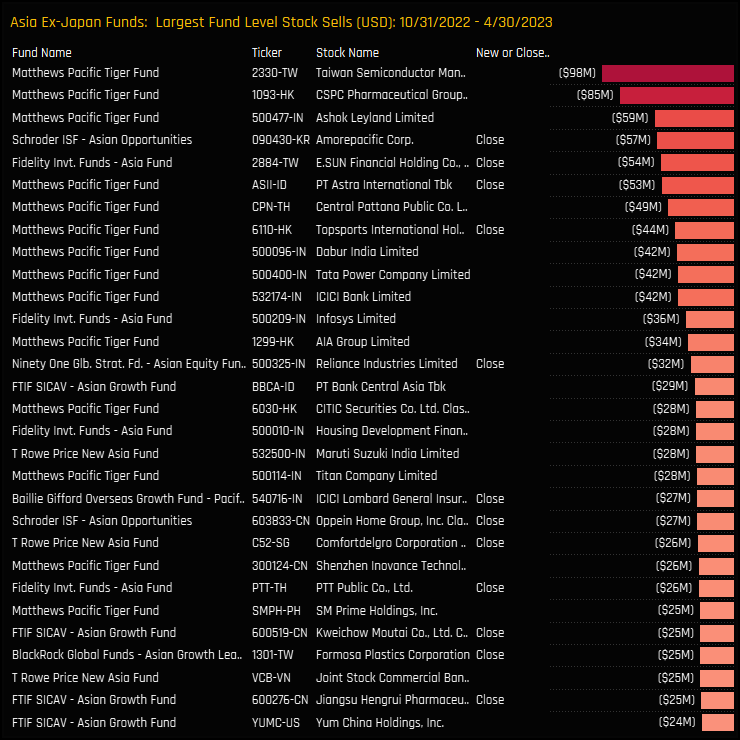
Largest Fund Level Stock Outflows, $
The largest fund level stock outflows between 10/31/2022 and 04/30/2023.
86 Asia Ex-Japan Equity Funds, AUM $54.5bn
Asia Ex-Japan Active Funds Ownership Report
To round off this month's research, please click on the link below for the full data report on Asia Ex-Japan active fund positioning
For more analysis, data or information on active investor positioning in your market, please get in touch with me on steven.holden@copleyfundresearch.com
Investor Positioning Report — Copley Fund Research Ltd · Last updated: July 2026 · Registered in England and Wales
1. Who we are
Copley Fund Research Ltd provides proprietary institutional fund intelligence to listed companies and investor relations professionals. These terms govern every purchase of an Investor Positioning Report. By completing a purchase you confirm you have read, understood, and agreed to these terms in full.
2. What you are purchasing
The Investor Positioning Report is a bespoke PDF report mapping the institutional fund universe around your stock. It covers current investors, past investors, competitor investors, and white space investors. Every report is built from scratch for the specific company ordered and is not a standardised or templated product.
3. Delivery and process
Following payment or invoice issuance, Copley Fund Research will contact you within one working day to agree your competitor set. Production begins once the competitor set is confirmed in writing. The completed report will be released to you within 48 hours of production starting, provided payment has been received in full; where payment is outstanding, the report will be withheld until payment clears. If the requested company falls outside our covered fund universes, or a competitor set cannot be agreed, Copley Fund Research will issue a full refund or cancel the outstanding invoice.
4. Competitor set agreement
The competitor set is agreed with you in writing prior to production, and the report is built to that agreed specification. Requests to amend the competitor set after delivery, based on a change of preference rather than an error, may be treated as a new order.
5. Refund policy
Because each report is produced individually for your company, orders are non-refundable once production has begun, except as set out in clauses 3 and 5a below. By purchasing, you agree not to dispute the charge with your card provider on the basis that the service was not as described, provided the report has been delivered to the agreed specification or corrected under clause 5a.
5a. Quality remedy
If a delivered report contains a material error caused by Copley Fund Research — for example, an incorrect company analysed, a competitor omitted from the agreed set, or content missing from the specification in clause 2 — Copley Fund Research will correct and redeliver the report at no additional charge, within a reasonable timeframe. This is your sole remedy for such errors.
6. Data and accuracy
All fund positioning data in the report reflects holdings as disclosed at the most recently available reporting date at the time of compilation. The timing of fund holdings disclosures is determined by regulatory requirements applicable to each fund and is outside the control of Copley Fund Research Ltd. This data may not reflect current fund positions. Copley Fund Research takes reasonable care to ensure accuracy but makes no warranty, express or implied, as to the completeness or current accuracy of the underlying data — though this does not affect the quality remedy in clause 5a for errors in how that data was analysed or presented. Past fund positioning is not indicative of future fund behaviour or investment decisions.
7. Not investment advice
The Investor Positioning Report is produced for investor relations intelligence purposes only. It does not constitute investment advice, financial advice, or a recommendation to buy, hold, or sell any security. The data reflects historical fund positioning and must not be relied upon as a prediction of future fund behaviour or investment decisions. Copley Fund Research Ltd is not authorised or regulated by the Financial Conduct Authority for the provision of investment advice.
8. Permitted use and confidentiality
The report is licensed for internal use by the purchasing organisation only. You may share it with employees and directors of your organisation. You may not: reproduce, redistribute, publish, or resell the report or any part of it; share it with any third party outside your organisation without prior written consent; use the fund or portfolio manager names contained in the report to approach those individuals on behalf of Copley Fund Research or in a manner that could damage Copley Fund Research's relationships with those funds; or use the data for any purpose other than your own investor relations strategy. The data, analysis, and methodology contained in the report are the intellectual property of Copley


