Related Posts


Global Funds: USA: Record Underweight as Shift to Europe Accelerates
Emerging Market Funds: GQG EM Equity Fund: Breaking From The Pack
Asia Ex-Japan Funds: Country/Sector Positioning Update
China Funds: A-Share Financials: Avoiding the Tail
UK Funds: The UK's Most Wanted Stocks
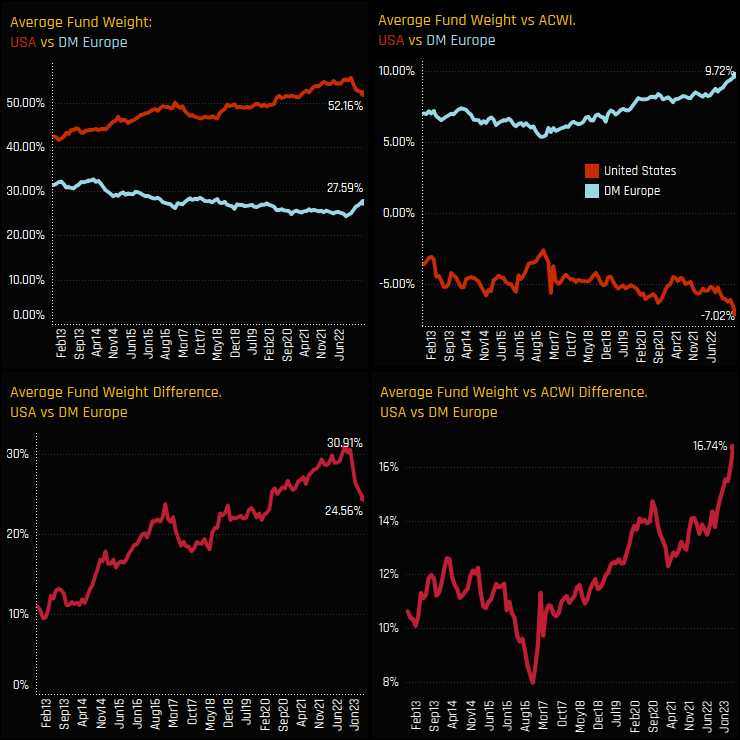
As part of our Global equity fund analysis, we took a deep dive in to the long-term trends in positioning between the USA and Developed Europe. The left hand charts in the dashboard opposite show the dispersion between US and Developed Market Europe fund weights among Global funds over the last decade, with the long-term dominance of the USA starting to reverse in late 2022. The right hand charts show the net over/underweight vs the SPDRs MSCI ACWI ETF, with Global funds increasing overweights in DM Europe and increasing underweights in the US, with today’s spread of +16.74% the highest on record.
In the full report we look at the sectors, stocks and funds driving this rotation, together with a full breakdown of the latest positioning among managers.
Part of the work we do at Copley involves the analysis of individual funds in each of our fund universes. It's important for funds to know where they differ from their active peer group, both for risk management purposes, sales and marketing and to keep ahead of investment trends in their market. We provide hundreds of metrics to help in this regard, and one them is a measure of country dispersion versus the peer group average.
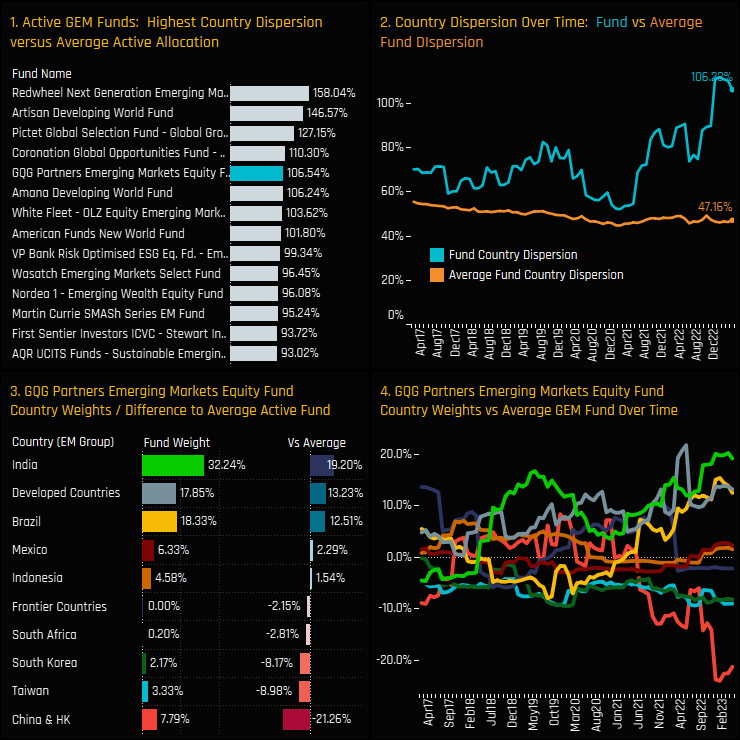
We provide a measure of country dispersion by first calculating the equally weighted average country weight across the 380 active EM funds in our analysis. We then take an individual fund and calculate the absolute differences between its country allocations and the average, and sum them together. The EM funds with the largest country dispersion are shows in chart 1 opposite, with GQG Partners Emerging Markets Equity the 5th highest with a combined country dispersion of 106.5%. Chart 2 shows the evolution of this dispersion over time, with GQG significantly breaking rank with the average GEM fund in recent years. Chart 3 breaks down the dispersion figure by it's individual country components. GQG is running a significant overweight in India, Developed Countries and Brazil compared to the average active fund. Against this, GQG is underweight China & HK stocks, Taiwan and South Korea. The recent rise in country dispersion has been driven by a rotation away from China & HK and in to India, Brazil and Developed market equities.
Our monthly analysis looks at aggregate positioning among active equity funds. We track holdings across regions, countries, sectors, country/sectors, industries and stocks. The chart set opposite highlights the latest positioning set up among country/sectors in the active Asia Ex-Japan fund universe.
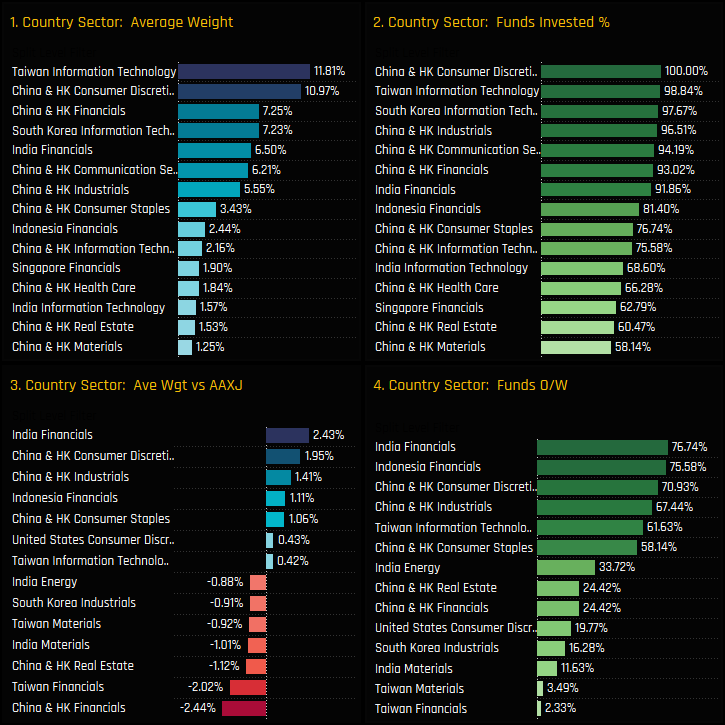
Chart 1. The equally weighted average fund weight. Asia Ex-Japan funds allocate over half of their total allocations in just 7 country/sectors, led by Taiwan Information Technology (11.8%), China & HK Consumer Discretionary (10.97%) and China & HK Financials (7.25%).
Chart 2. The percentage of funds invested in each country/sector. The 7 top country/sectors are widely owned among Asia Ex-Japan investors. Every fund holds exposure to China & HK Discretionary stocks and 92% hold Indian Financials.
Chart 3. Average weight versus the iShares MSCI Asia Ex-Japan ETF (AAXJ). Active managers are overweight Indian Financials, China & HK Consumer Discretionary and China & HK Industrials, on average. Against this, underweights are led by China & HK Financials, Taiwan Financials and China & HK Real Estate.
Chart 4. The percentage of funds who are positioned overweight the AAXJ ETF. Over 3/4 of the funds in our analysis are overweight India Financials and Indonesian Financials - they are the consensus overweight positions in the active Asia Ex-Japan space. In contrast, hardly any funds are overweight Taiwan Financials and Taiwan Materials.
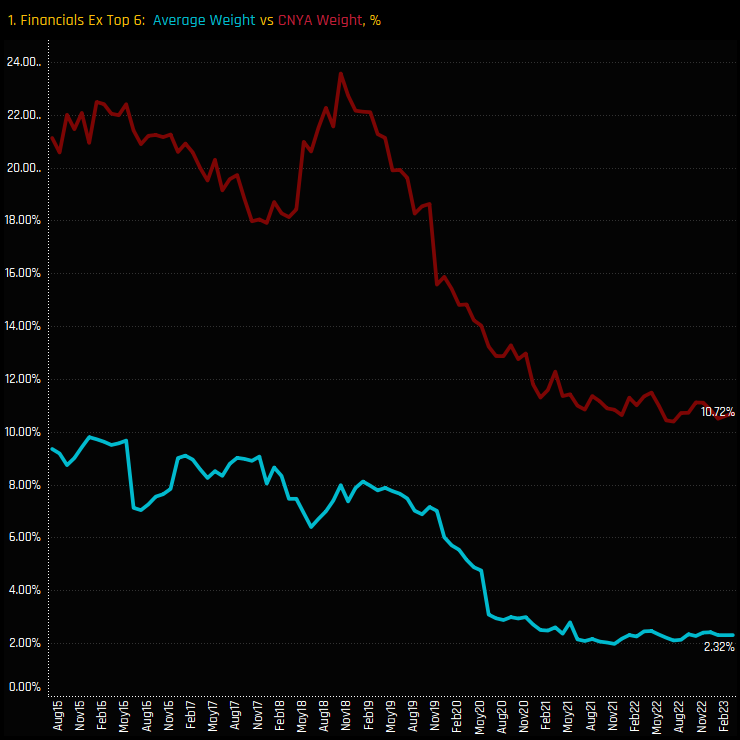
Ownership levels in the China A-Share Financials sector are at their lowest ebb. The driver of this decline appears to be the lack of confidence that active A-Share managers have outside of a small selection of well held companies. The top 6 most widely held Financial stocks make up 5.5% of the average active A-Share fund and 5.75% in the iShares MSCI China A-Share ETF. But its outside of this where the divergence between active and benchmark occurs. All of the stocks outside of the top 6 have struggled to attract interest from active A-Share investors.
The chart opposite shows the average holding weight in the Financials sector minus the top 6 stocks, for both active managers and the benchmark. Across 83 companies, active A-Share funds have allocated just 2.32% whereas the iShares MSCI China A-Share ETF has allocated 10.72%. The message seems pretty clear – stick to the top 6 and avoid the long tail.
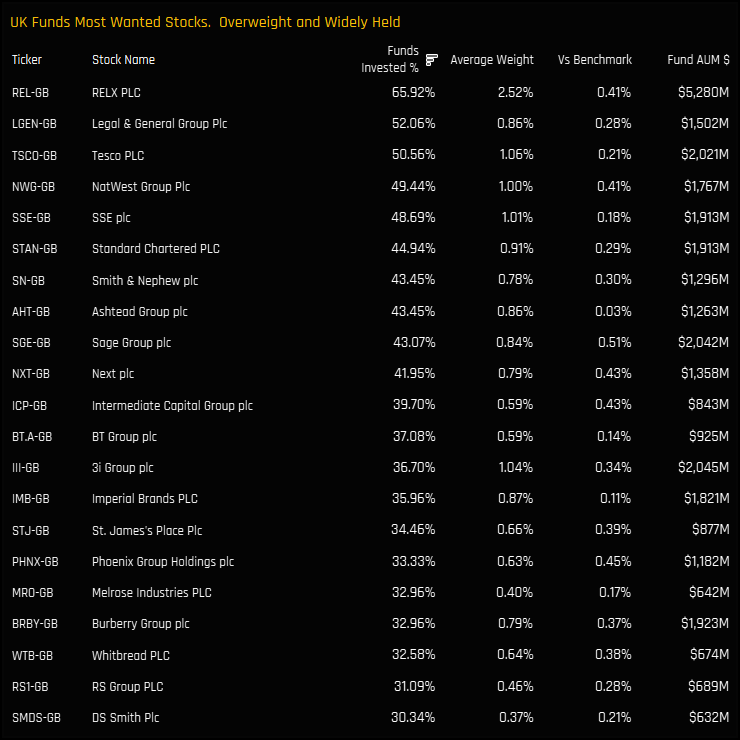
Every quarter we update 14 essential charts on aggregate and fund level stock positioning among the 267 active UK funds in our analysis.
The chart to the right screens for stocks that are held by more than 30% of the UK funds in our analysis and at average holding weights above the FTSE All Share Index. The list is headed by RELX PLC, a company owned by 65.9% of the funds in our analysis at an average weight of 2.52%, or overweight the benchmark by 0.41%.
A fund's relative performance is not only determined by its holdings, but also by its exclusions. By understanding how competitors are positioned, managers can gain clarity on where their outperformance will come from.
For more analysis, data or information on active investor positioning in your market, please get in touch with us on
2023 marks a pivotal year with EM investors significantly increasing holdings in the Saudi mark ..
1600 Active Equity Funds, AUM $4.7tr Fund Positioning Chart Pack Samsung Electronics: Return of ..
The Magnificent 7, comprising Microsoft, Apple, Alphabet, Amazon, Meta, NVIDIA and T ..
Investor Positioning Report — Copley Fund Research Ltd · Last updated: July 2026 · Registered in England and Wales
Copley Fund Research Ltd provides proprietary institutional fund intelligence to listed companies and investor relations professionals. These terms govern every purchase of an Investor Positioning Report. By completing a purchase you confirm you have read, understood, and agreed to these terms in full.
The Investor Positioning Report is a bespoke PDF report mapping the institutional fund universe around your stock. It covers current investors, past investors, competitor investors, and white space investors. Every report is built from scratch for the specific company ordered and is not a standardised or templated product.
Following payment or invoice issuance, Copley Fund Research will contact you within one working day to agree your competitor set. Production begins once the competitor set is confirmed in writing. The completed report will be released to you within 48 hours of production starting, provided payment has been received in full; where payment is outstanding, the report will be withheld until payment clears. If the requested company falls outside our covered fund universes, or a competitor set cannot be agreed, Copley Fund Research will issue a full refund or cancel the outstanding invoice.
The competitor set is agreed with you in writing prior to production, and the report is built to that agreed specification. Requests to amend the competitor set after delivery, based on a change of preference rather than an error, may be treated as a new order.
Because each report is produced individually for your company, orders are non-refundable once production has begun, except as set out in clauses 3 and 5a below. By purchasing, you agree not to dispute the charge with your card provider on the basis that the service was not as described, provided the report has been delivered to the agreed specification or corrected under clause 5a.
If a delivered report contains a material error caused by Copley Fund Research — for example, an incorrect company analysed, a competitor omitted from the agreed set, or content missing from the specification in clause 2 — Copley Fund Research will correct and redeliver the report at no additional charge, within a reasonable timeframe. This is your sole remedy for such errors.
All fund positioning data in the report reflects holdings as disclosed at the most recently available reporting date at the time of compilation. The timing of fund holdings disclosures is determined by regulatory requirements applicable to each fund and is outside the control of Copley Fund Research Ltd. This data may not reflect current fund positions. Copley Fund Research takes reasonable care to ensure accuracy but makes no warranty, express or implied, as to the completeness or current accuracy of the underlying data — though this does not affect the quality remedy in clause 5a for errors in how that data was analysed or presented. Past fund positioning is not indicative of future fund behaviour or investment decisions.
The Investor Positioning Report is produced for investor relations intelligence purposes only. It does not constitute investment advice, financial advice, or a recommendation to buy, hold, or sell any security. The data reflects historical fund positioning and must not be relied upon as a prediction of future fund behaviour or investment decisions. Copley Fund Research Ltd is not authorised or regulated by the Financial Conduct Authority for the provision of investment advice.
The report is licensed for internal use by the purchasing organisation only. You may share it with employees and directors of your organisation. You may not: reproduce, redistribute, publish, or resell the report or any part of it; share it with any third party outside your organisation without prior written consent; use the fund or portfolio manager names contained in the report to approach those individuals on behalf of Copley Fund Research or in a manner that could damage Copley Fund Research's relationships with those funds; or use the data for any purpose other than your own investor relations strategy. The data, analysis, and methodology contained in the report are the intellectual property of Copley

