Positioning in the Tobacco industry group falls to lowest levels in history.
Time-Series & Industry Activity
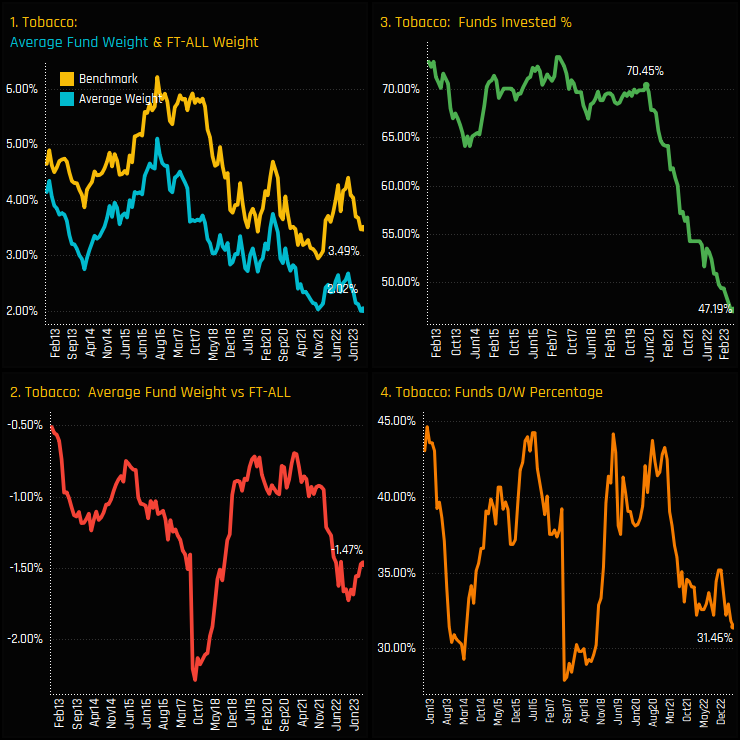
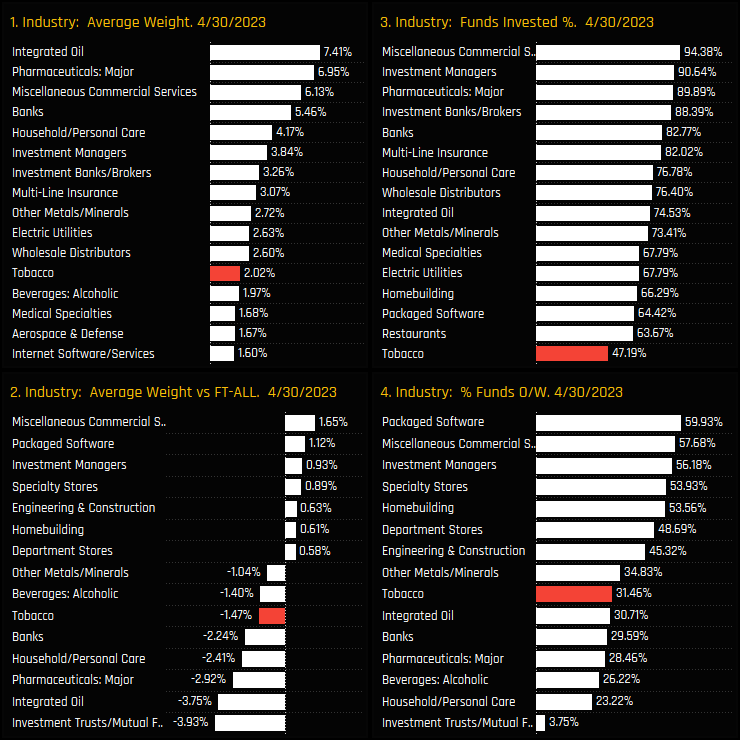
UK Fund ownership in the Tobacco industry group has fallen to its lowest level on record. Perhaps surprisingly, the decline only started to take effect in early 2020 when 70.45% of the UK funds in our analysis still had exposure (ch3). Since then, and perhaps as a result of a growing ESG awareness among investors, the trajectory of ownership has been on an aggressively downward path, with today’s 47.2% fund ownership the lowest on record. In conjunction with this, average weights are at record lows of 2.02% (ch1), or underweight the SPDRs FTSE UK All Share ETF by -1.47% (ch2).
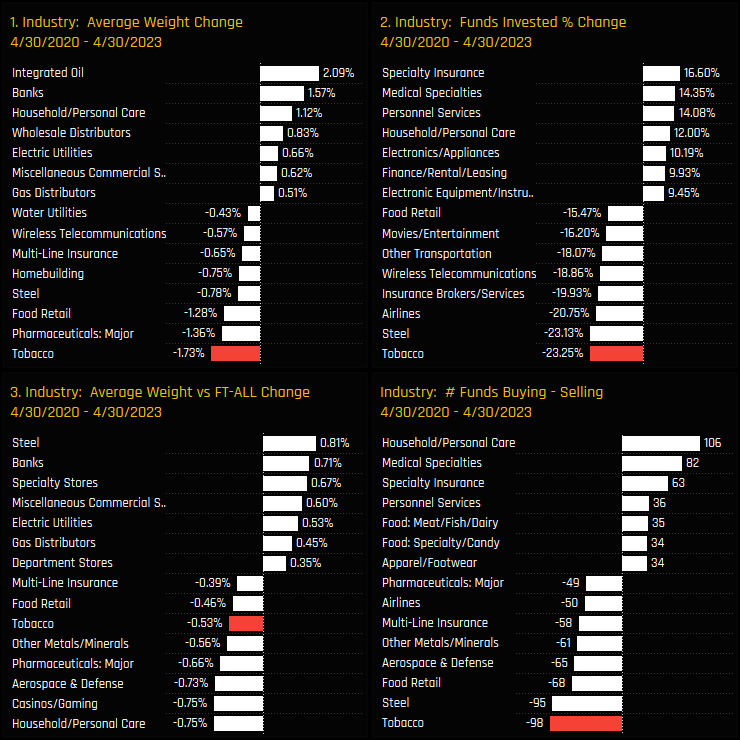
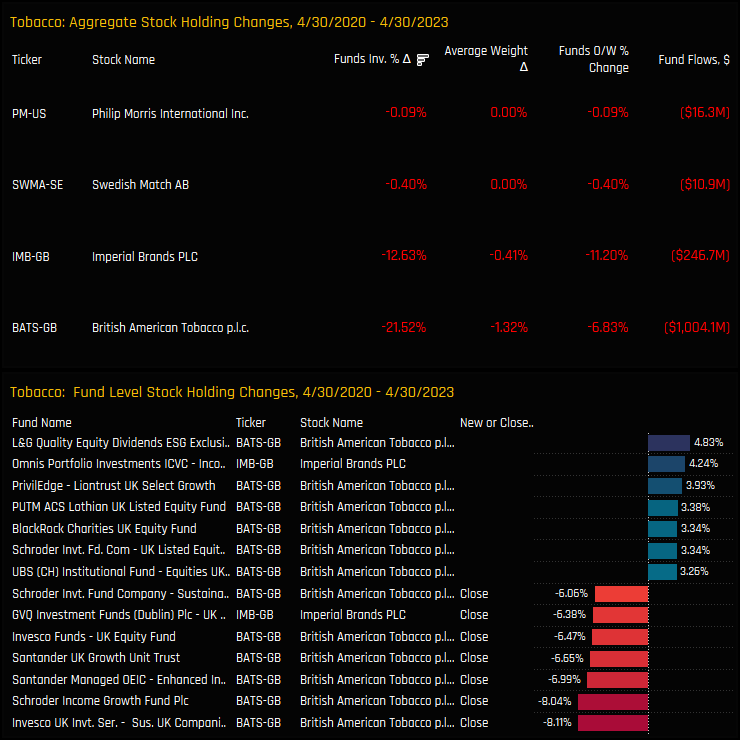
The charts below show the change in industry level ownership among UK funds since the start of the decline until today (04/30/2020 to 04/30/2023). Tobacco stocks saw the largest decline in outright ownership (ch2) and average fund weights (ch1) over the period, with UK investors instead increasing exposure to Integrated Oil, Banks and Specialty Insurance, among others. Versus the benchmark, net underweights increased by -0.53% and sellers (144) outnumbered buyers (46) by 98 funds, the most of any industry group. This has been a sustained and aggressive outward rotation.
Fund Activity & Latest Holdings
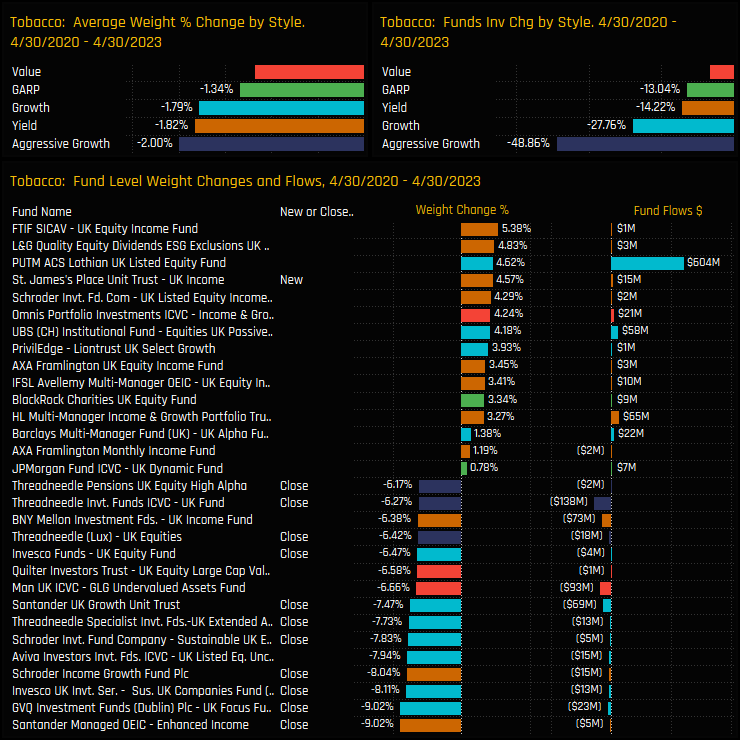
Over the same 3-year period, all Style groups scaled back holdings as shown in the top charts below. Aggressive Growth funds saw the largest declines, with 48.9% of funds closing exposure entirely and average weights falling by -2.0%. On a fund level, there were 59 closures over the period, led by Santander Enhanced Income (-9.02%) and GVQ UK Focus (-9.02%).
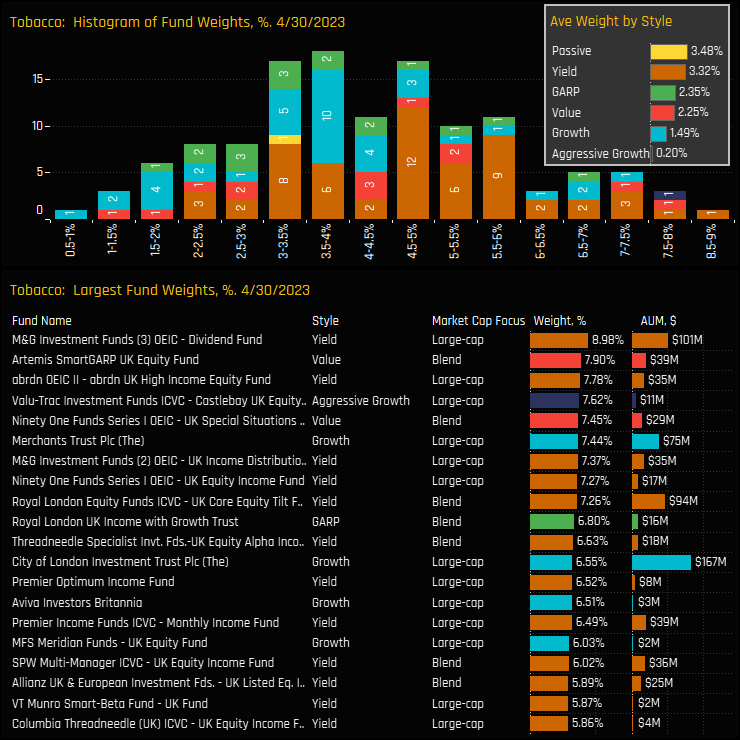
Of the remaining 47.2% of managers holding exposure to the Tobacco industry group, the majority hold between a 2% and 6% allocation, with holdings maxing out at 8.98% for the M&G UK Dividend Fund. All Style groups are positioned underweight the benchmark on average, with Yield funds the larger allocators by a margin and Aggressive Growth almost non-existent from the holdings register.
Stock Holdings & Activity
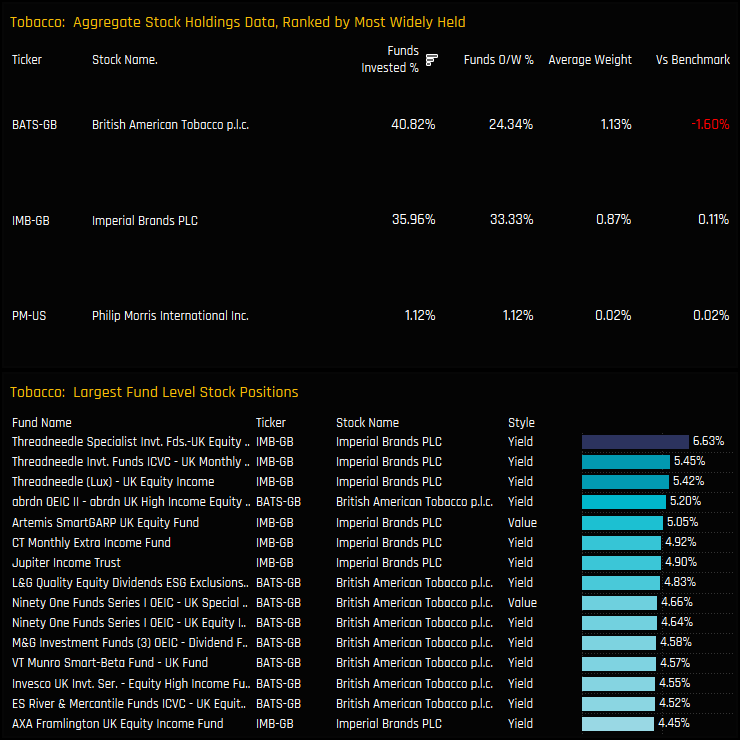
Of the 2 major Tobacco companies in the UK, British American Tobacco is the most widely held with 40.8% fund ownership compared to 35.96% for Imperial Tobacco. Versus the benchmark, the size of BATS positioning leaves managers underweight the FTSE UK All Share index by -1.6%, on average. On an individual fund level, the larger positions are among Yield managers in Imperial Brands, led by the Threadneedle suite of funds.
Stock ownership changes over the last 3-years were negative for all stocks. British American Tobacco lost investment from -21.5% of the funds in our analysis and Imperial Brands -12.6%. On a fund level, the larger closures were in BATS and led by Invesco Sustainable UK Companies (-8.1%) and Schroder UK Income Growth (-8.04%).
Stock Profile: British American Tobacco p.l.c
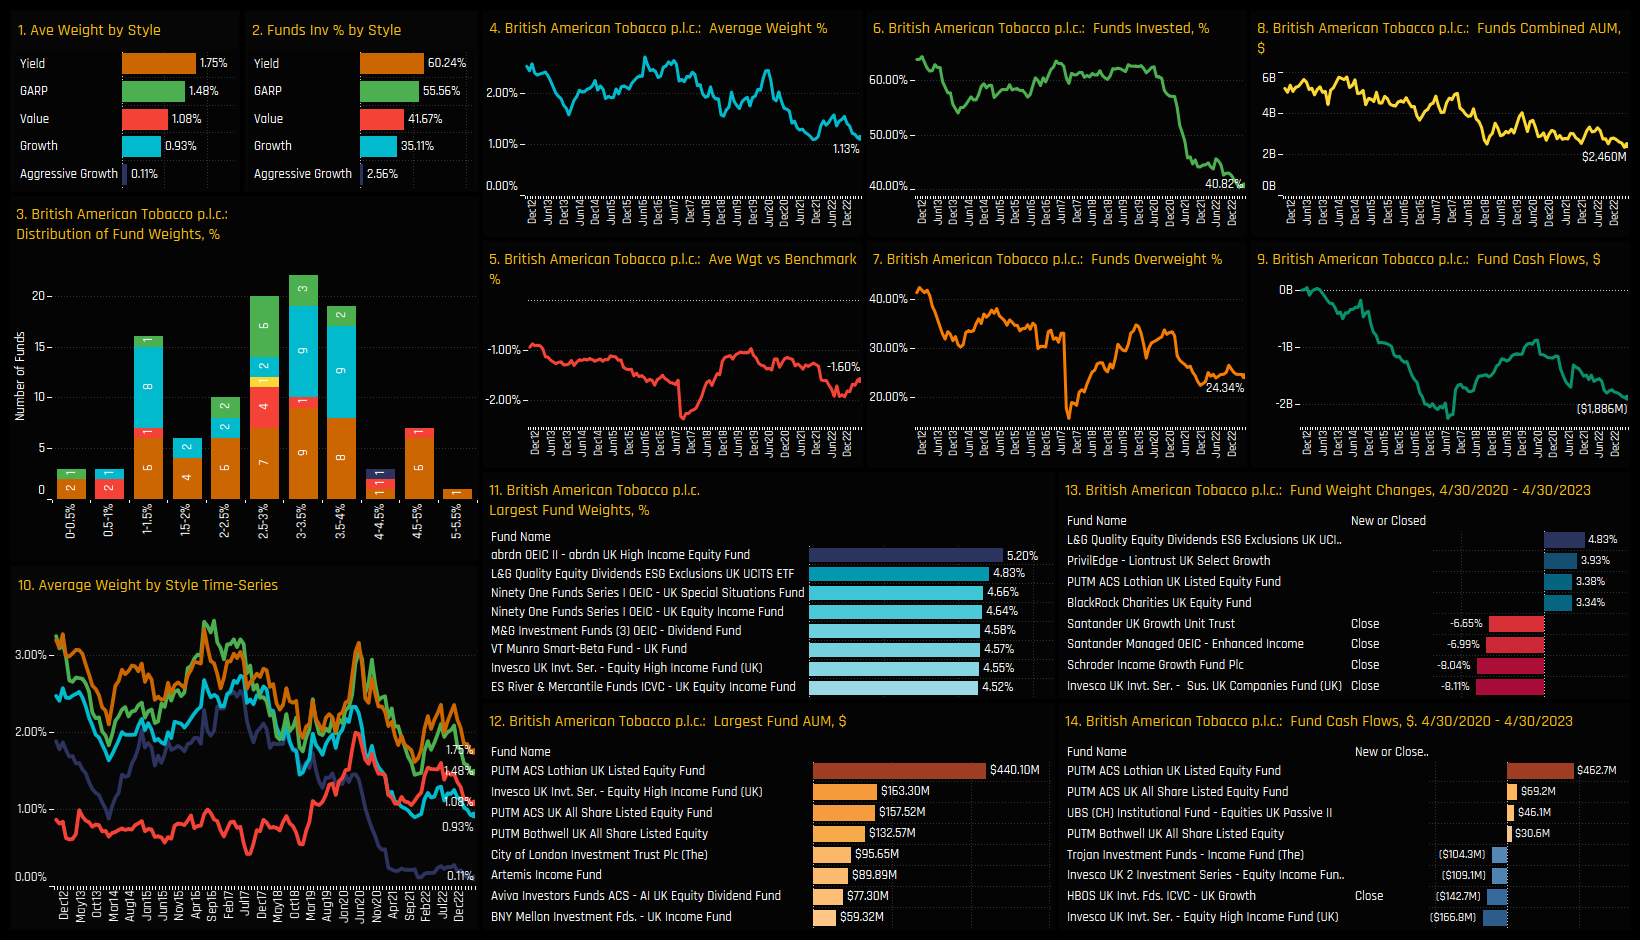
The decline in UK fund exposure in British American Tobacco has been severe to say the least. Once owned by more than 60% of the UK funds in our analysis (ch6), ownership has fallen to 40.8% of funds and with less than a quarter overweight the SPDRs FTSE All Share ETF (ch7). On a Style basis, Yield managers are the larger allocators, with 60.2% of Yield funds invested at average weights of 1.75%, whilst the decline in Aggressive Growth fund exposure can be seen clearly in chart 10. Despite the decline, BATS is still a key holding for a number of funds, led abrdn UK High Income (5.2%) and a further 10 funds with a >4% allocation.
Conclusions & Links
Tobacco stocks are taking an ever smaller percentage in the average UK equity fund. From once being the 3rd largest Industry allocation in early 2011, Tobacco has fallen to the 12th, with less than half of the UK funds in our analysis holding a position.
The decline has been severe and occurred over a relatively short period of time, with ownership levels still above 70% until the early part of 2020. Perhaps the increased scrutiny on ESG scores and the negative connotations of holding tobacco companies have taken their toll on investor sentiment.
For those that have closed out positions in the Tobacco sector, take comfort in the fact that this stance is now in the majority. For those who still hold a large stake, this is becoming an increasingly non-consensus view.
Click on the links below for more detailed reports on the UK Tobacco industry group.
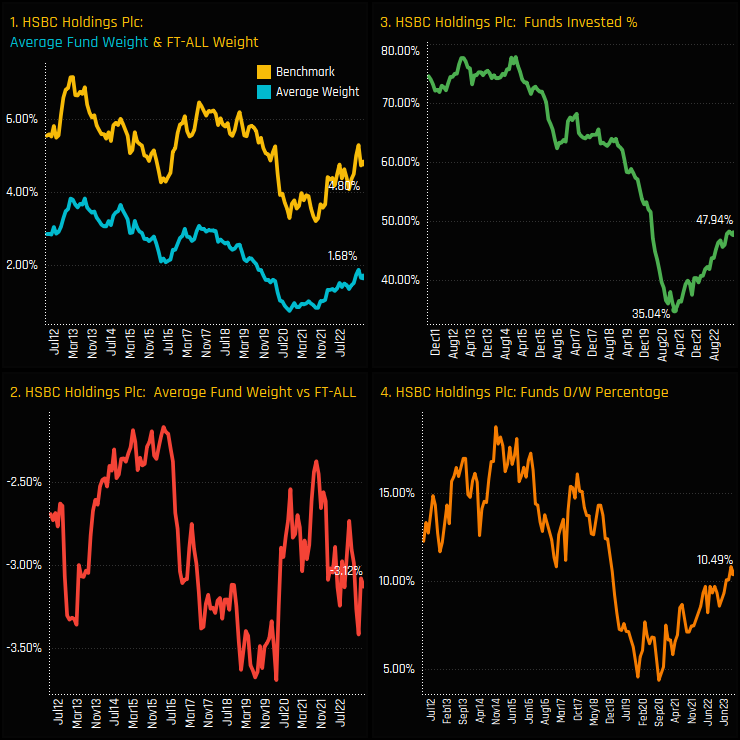
After years of fund ownership decline, UK active managers are beginning to warm to the HSBC investment case.
Time-Series & Stock Activity
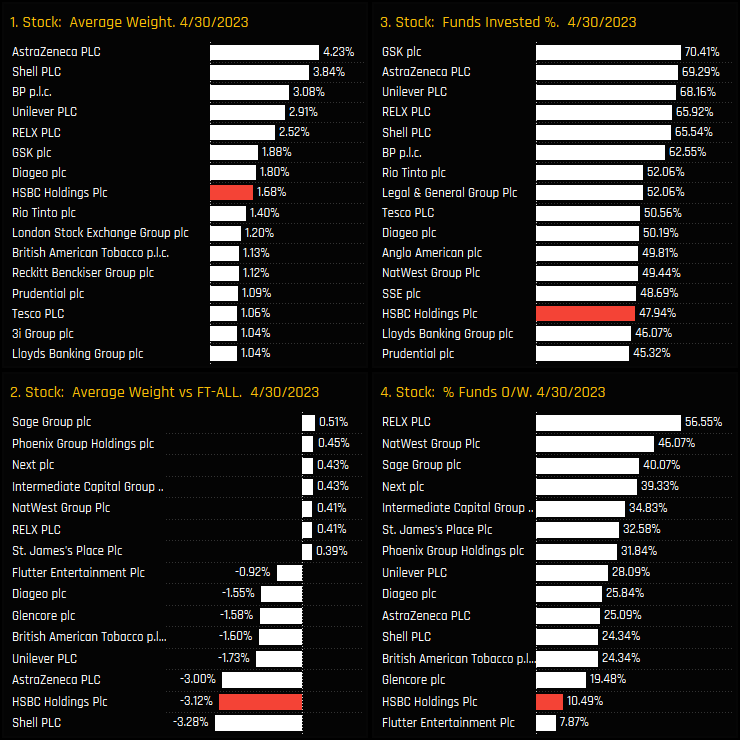
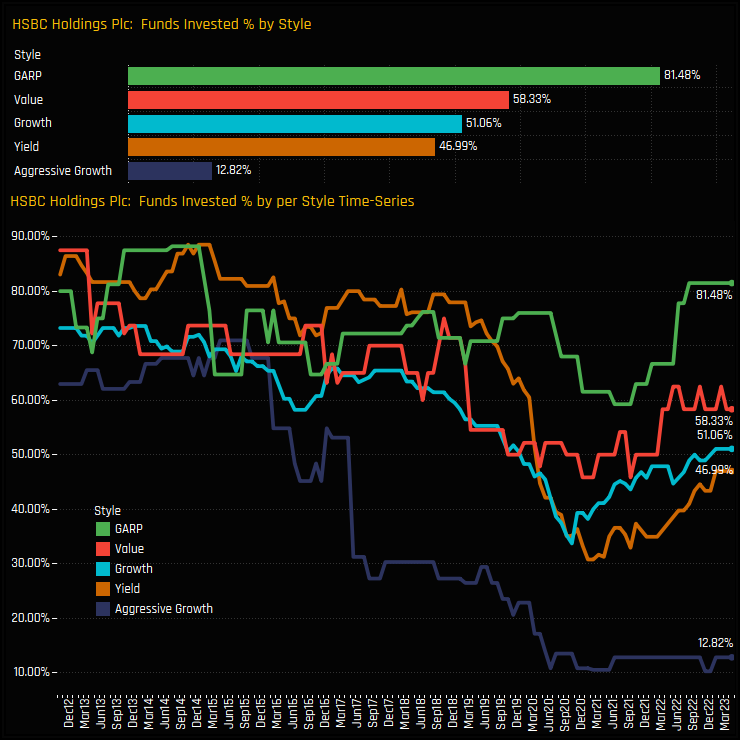
UK fund exposure in HSBC Holdings is on the rise. After a multi-year drop in ownership, UK allocations bottomed out with just 35% of funds invested in early 2021, down from over 70% between 2011-2015 (ch3). Since the lows, a growing number of active UK strategies are buying back in, with average weights moving to 1.68% (ch1) and 48% of funds invested. Despite these gains, current levels represent a significant underweight versus the SPDRs FTSE UK All Share ETF of -3.12% (ch2), with the vast majority of investors positioned below the index (ch4).
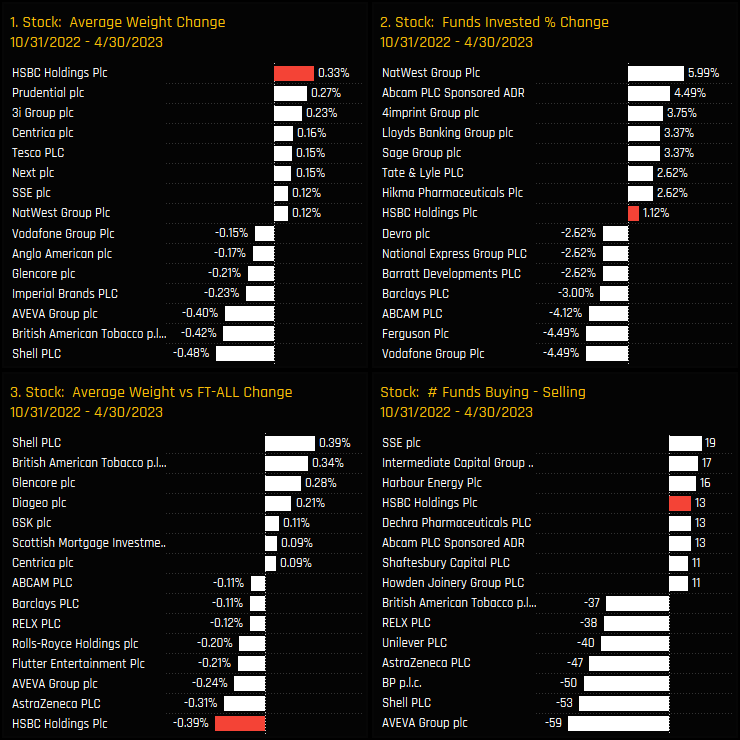
Over the last 6-months, HSBC Holdings has maintained this positive momentum and has faired well versus UK stock peers. It captured the largest increase in average weight of +0.33% over the period, had an excess of buyers over sellers and saw the percentage of funds invested rise by another +1.12%. Despite this positive rotation, the outperformance of HSBC over the period saw index weights make larger gains, increasing the net underweight by a further -0.39%.
Stock Positioning & Sentiment
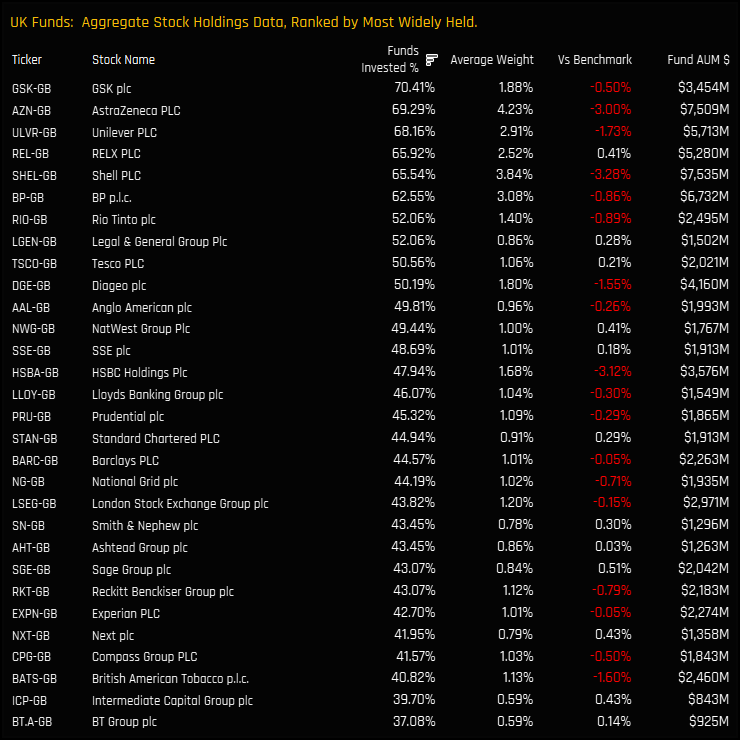
HSBC Holdings is the 8th largest stock holding in the UK on an average weight basis and the 14th most widely held. Versus the FTSE All Share index, HSBC Holdings is one of three stocks that really differentiates UK active funds from their benchmark. On average, UK active funds hold 9.75% across HSBC Holdings, Shell PLC and AstraZeneca compared to 19.15% for the SPDRs FTSE UK All Share ETF.
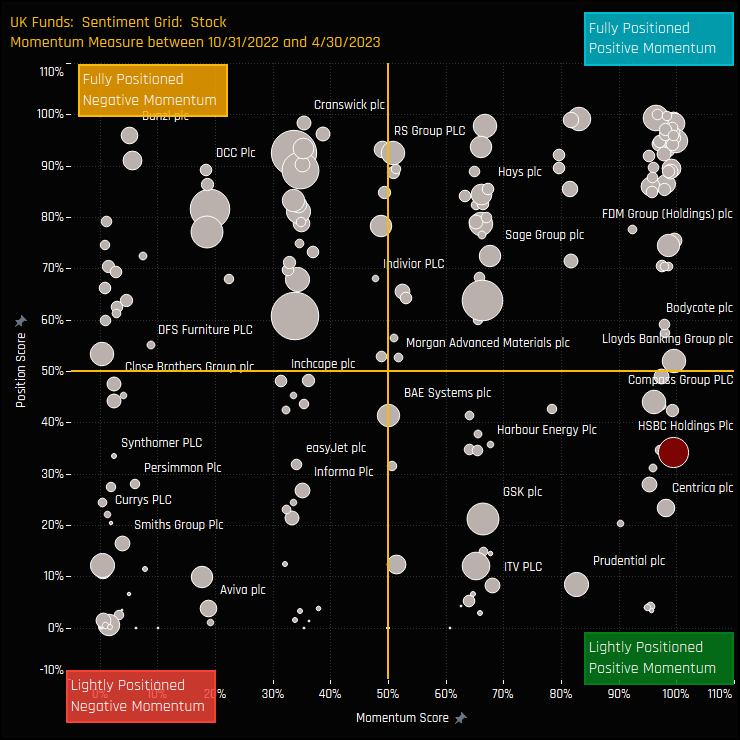
The sentiment grid below shows where current positioning in each UK stock sits versus its own history going back to 2011 on a scale of 0-100% (y-axis), against a measure of fund activity for each stock between 10/31/2022 and 04/30/2023 (x-axis). HSBC Holdings joins Centrica, Compass Group and Lloyds Banking Group as a stock with light positioning compared to it’s long-term history, but with more recent positive rotation.
Gap Analysis
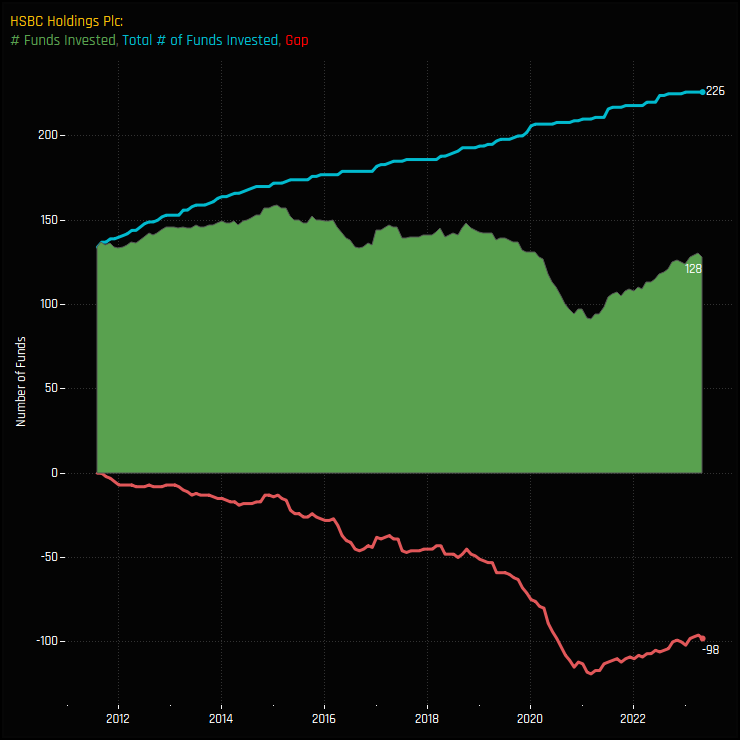
The chart below highlights the scale of the drop in positioning in HSBC Holdings. The blue line represents the total number of UK funds (out of 267) who have ever held a position in HSBC, currently 226. The green shaded area is the number who currently hold a position (128) and the red line the difference. There are 98 funds with a previous history of investment in HSBC who are sitting on the sidelines for now, but that number is declining.
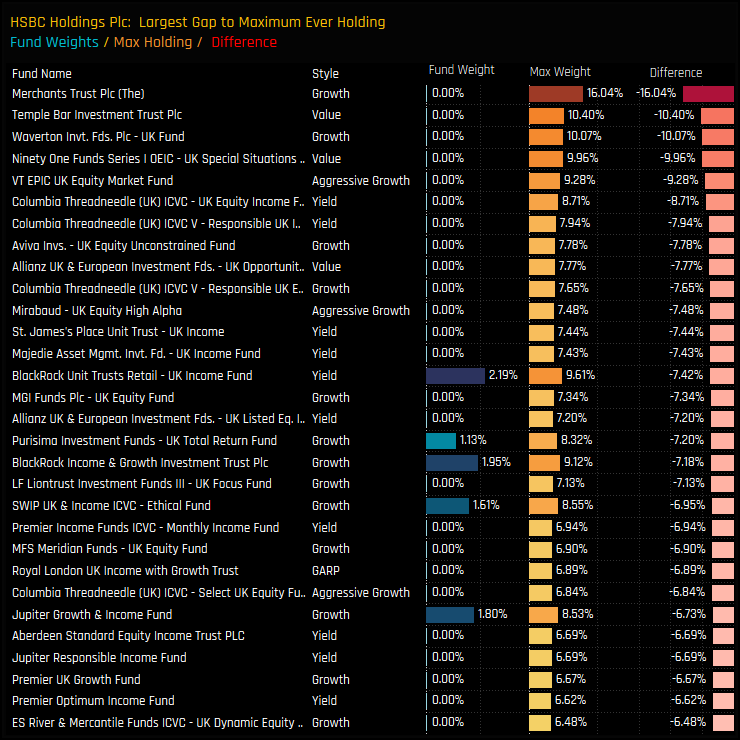
Many of those with previous history were once sizeable holders. The below chart ranks the funds with the largest differences between current weights in HSBC and their maximum ever weight since 2011. It highlights how HSBC Holdings was once a significant allocation for a number of funds, with many holding a +7% weight in the stock, but who currently hold nothing.
Stock Positioning & Activity
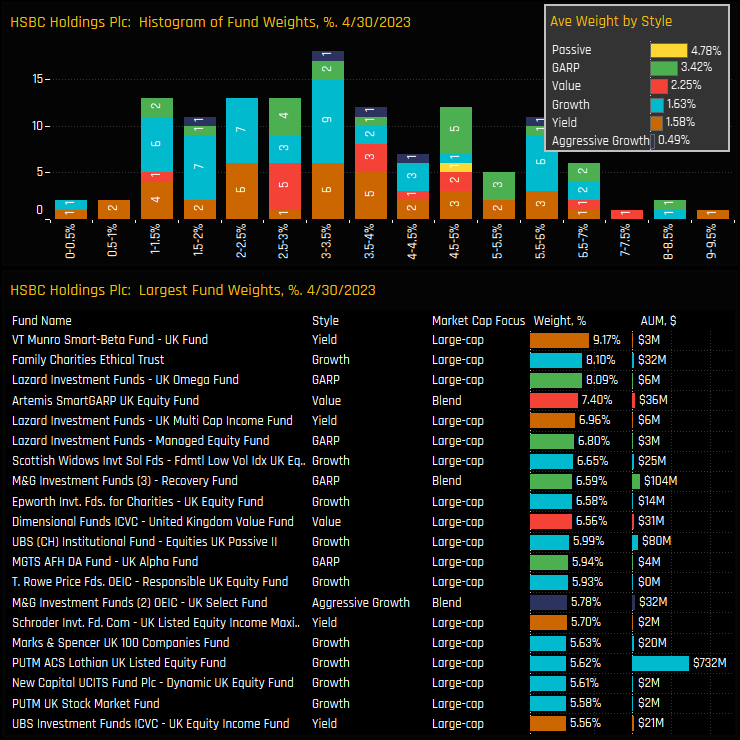
The currently holding distribution in HSBC is centered around the 2% to 5% range, with the top holders above 8% and led by VT Munro Smart-Beta UK on 9.14%. All Style groups are underweight the SPDRs FTSE UK All Share ETF on average, though HSBC clearly holds more appeal to those funds seeking ‘Growth At a Reasonable Price’. Aggressive Growth funds are notable for their marginal allocation of just 0.49% on average.
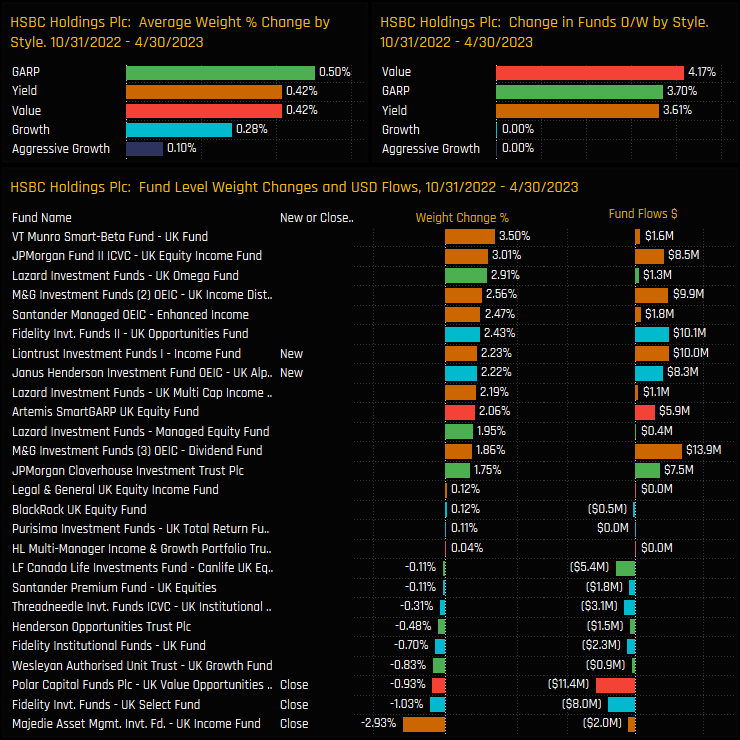
Over the last 6-months, all Style groups saw average allocations increase as a further 4.2% of Value funds, 3.7% of GARP and 3.6% of Yield investors switched to overweight. New positions outnumbered closing positions by a factor of 2, but the larger weight increases were from funds increasing existing holdings, and led by VT Munro Smart Beta (+3.5%) and JP Morgan UK Equity Income (+3%).
Conclusions & Links
The chart to the right plots the evolution of HSBC ownership for each of the Style groups. The continued decline in Aggressive Growth fund ownership is countered by increases across the other Style groups since 2020/2021, most notably for GARP funds. Yield, Growth and Value funds still remain well below historical levels of positioning.
So compared to history, HSBC ownership is low. The shift in sentiment that started in 2020/2021 has simmered along at a relatively slow pace, though it is undoubtably happening. HSBC’s efforts to cut costs, dispose of non-core assets and focus on returning capital to shareholders has clearly resonated with a growing number of UK investors.
This combination of increasing ownership among active peers and rising benchmark weights only heightens the risk of not holding a position in HSBC for a UK equity fund. After all, active management is a relative pursuit. In our analysis, HSBC is shown to be a well known name among investors, with many having a history of holding a significant allocation. With outperformance this year of ~13% compared to the FTSE All Share index, HSBC Holdings is no longer a comfortable stock to avoid.
Click on the link below for an extended data report on HSBC positioning among active UK funds.
The latest aggregate and fund level stock holding metrics among active UK investors.
Most Widely Held Stocks
The 30 most widely held stocks among UK Active Funds
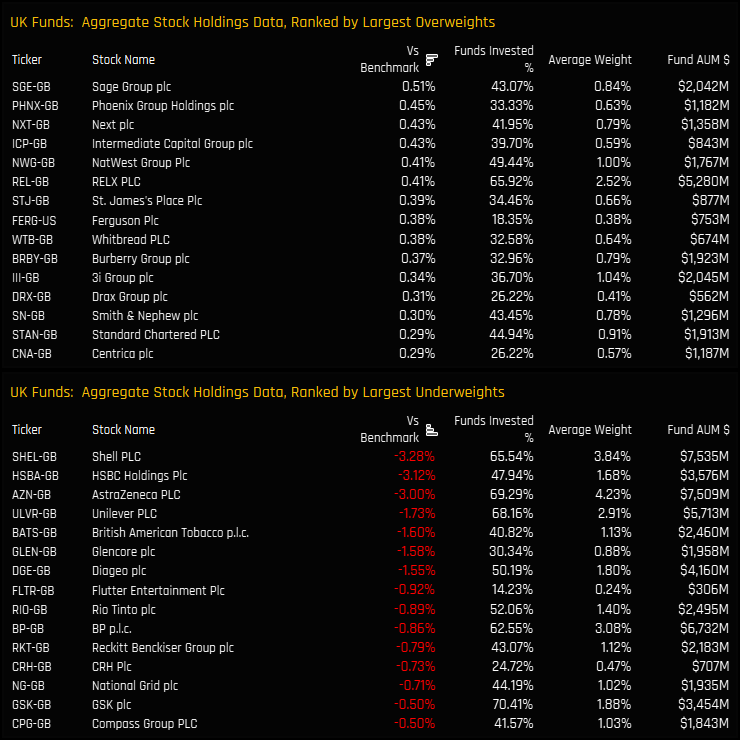
Top Over/Underweights
The top 15 aggregate overweight and underweight stock holdings
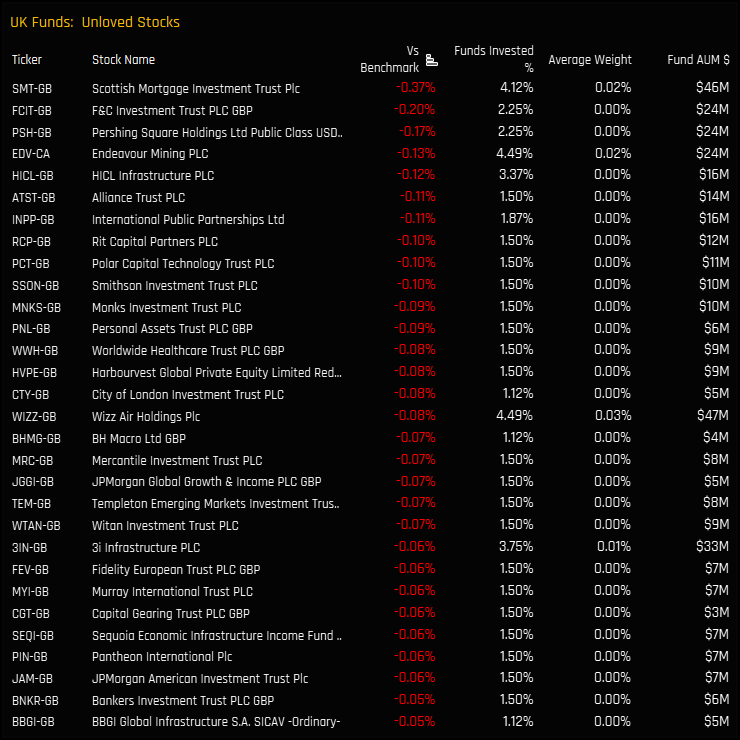
Unloved Stocks
Stocks held by less than 5% of the UK Funds in our analysis, and net underweight vs the SPDRs FTSE UK All Share ETF (cash component removed and stock weights adjusted)
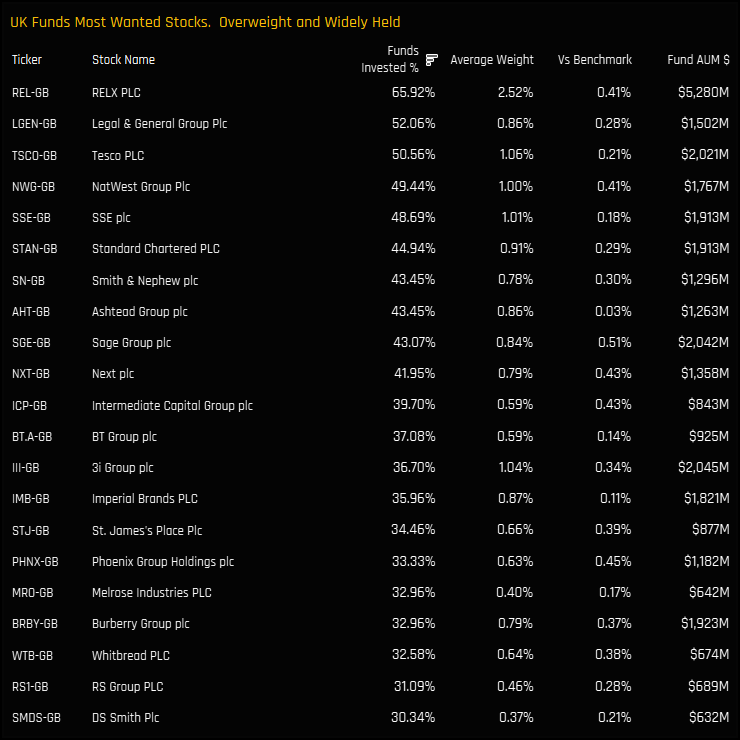
Most Wanted Stocks
Stocks held by more than 30% of the UK Funds in our analysis, and net overweight vs the SPDRs FTSE UK All Share ETF.
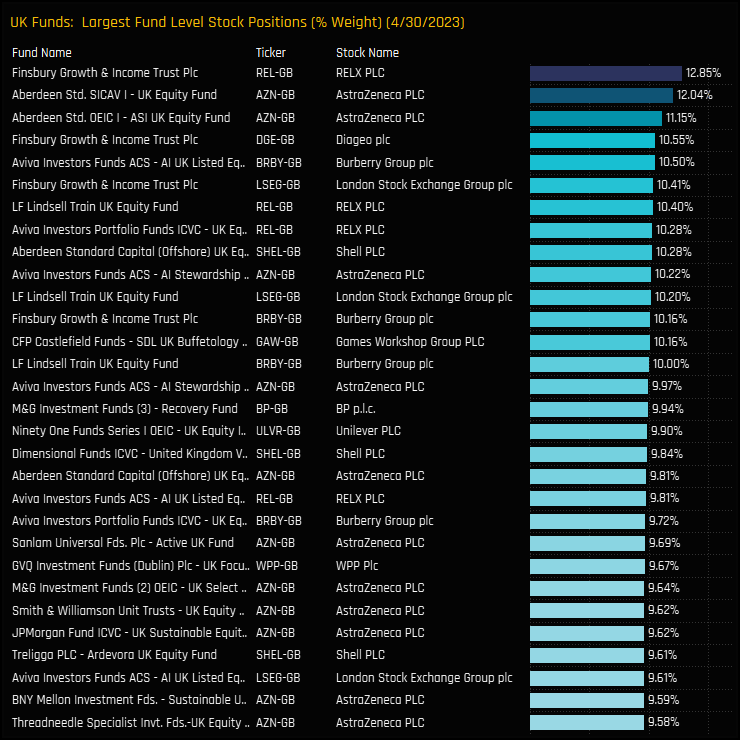
Largest Fund Level Stock Positions, %
The top 30 largest individual fund level stock positions on a portfolio weight basis.
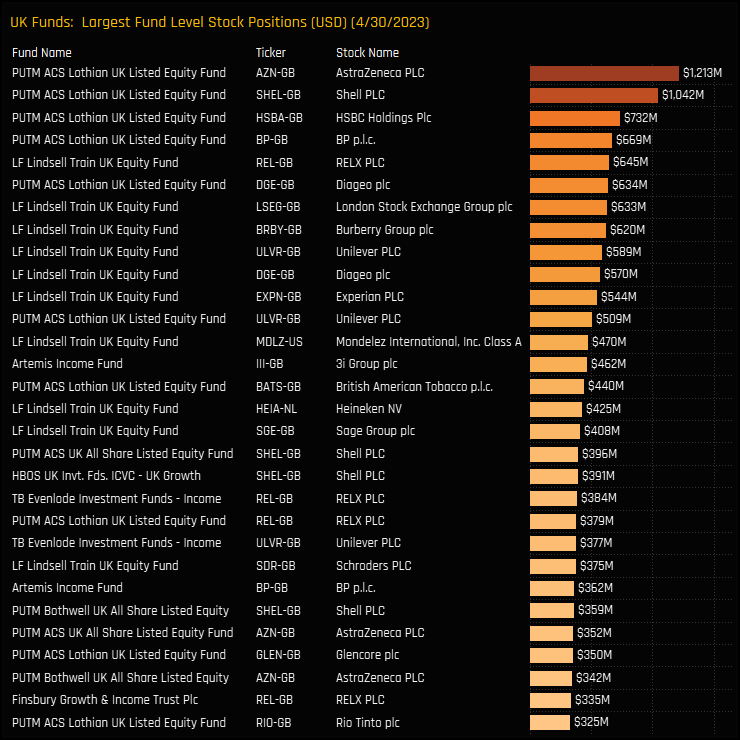
Largest Fund Level Stock Positions, $
The top 30 largest individual fund level stock positions on a fund AUM basis.
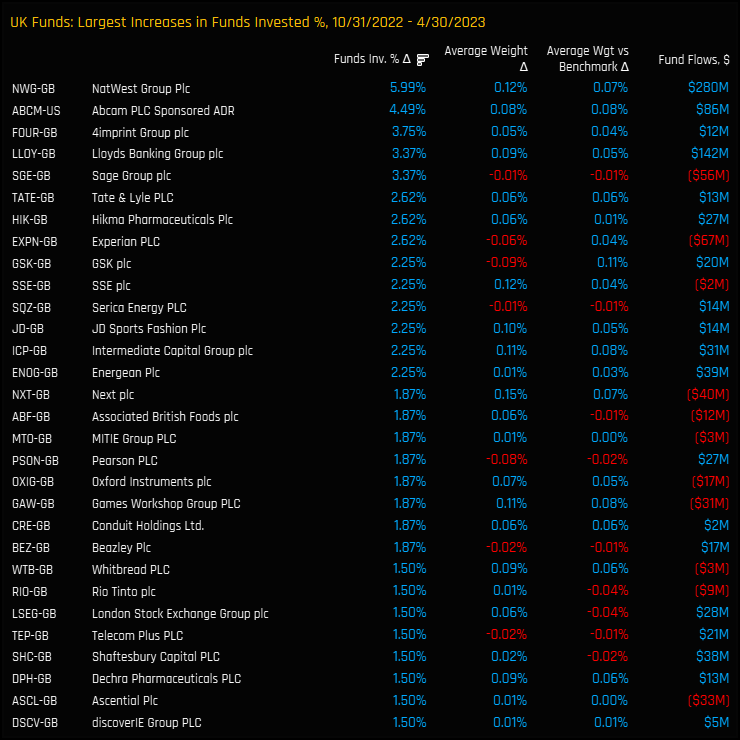
Largest Ownership Increases
The stocks with the largest net increase in the percentage of funds invested between 10/31/2022 and 04/30/2023
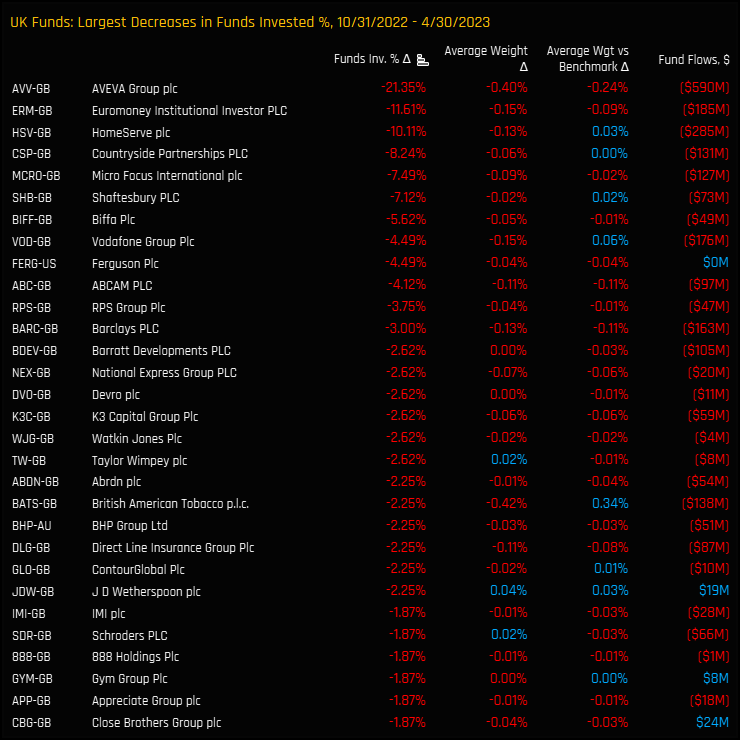
Largest Ownership Decreases
The stocks with the largest net decrease in the percentage of funds invested between 10/31/2022 and 04/30/2023
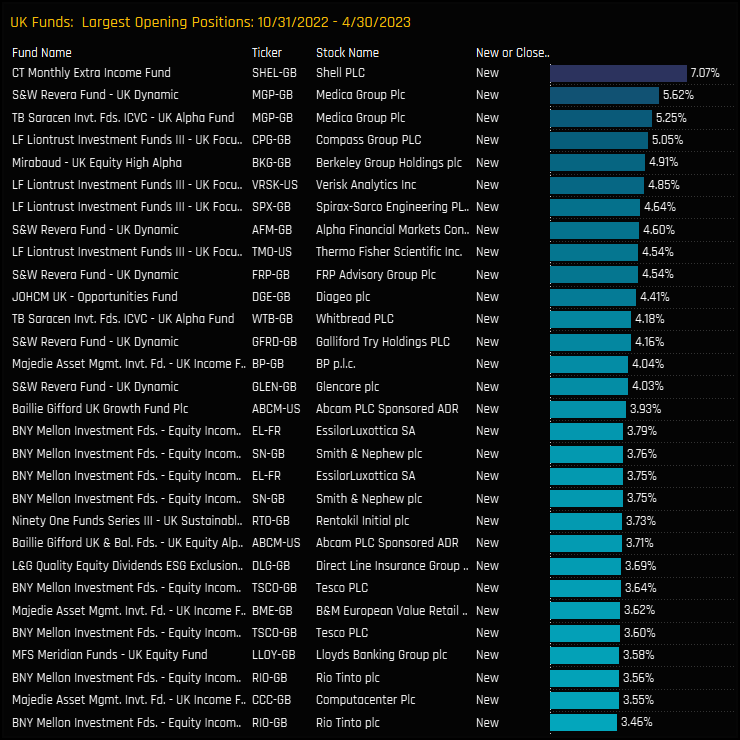
Largest Opening Positions
The largest opening stock positions between 10/31/2022 and 04/30/2023
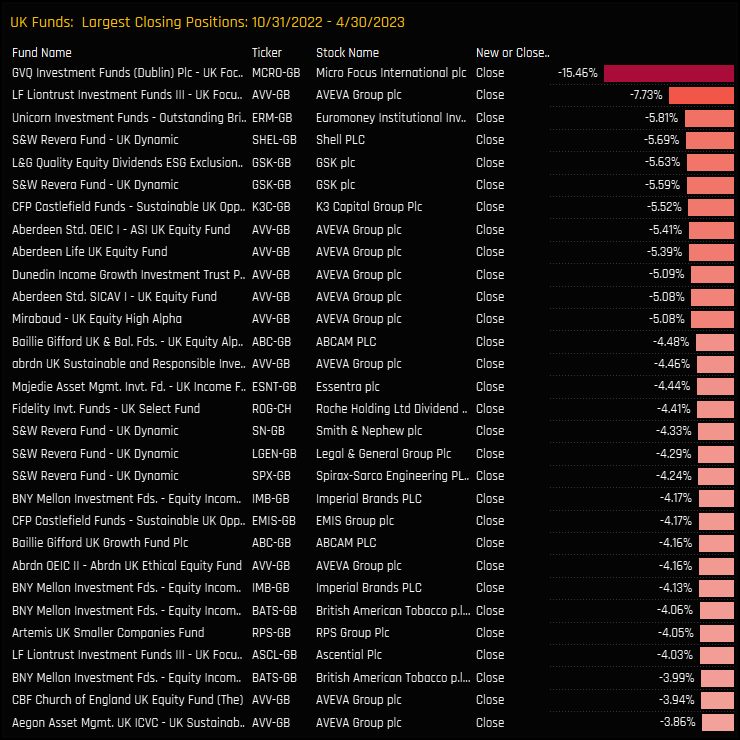
Largest Closing Positions
The largest closing stock positions between 10/31/2022 and 04/30/2023
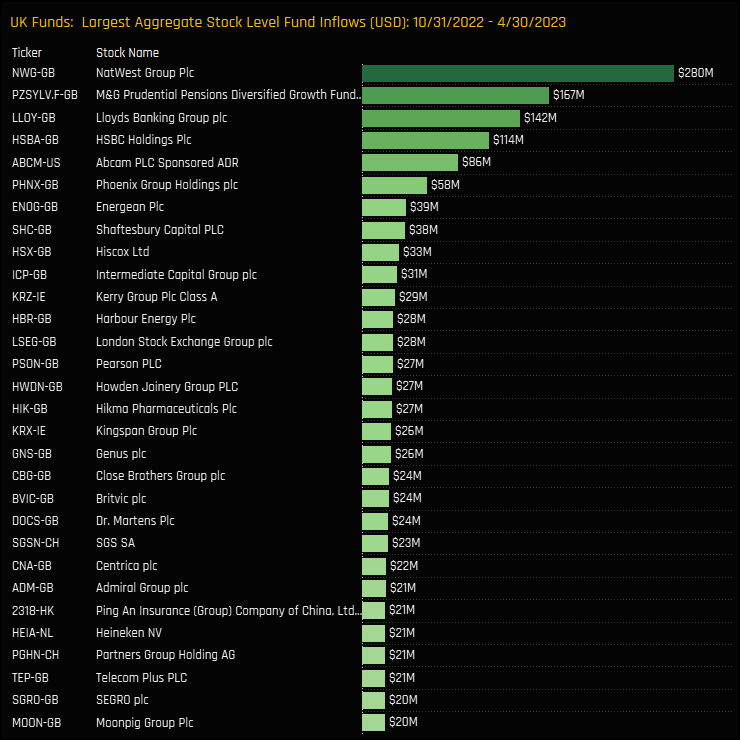
Largest Stock Inflows, $
The largest combined fund inflows on a stock level between 10/31/2022 and 04/30/2023.
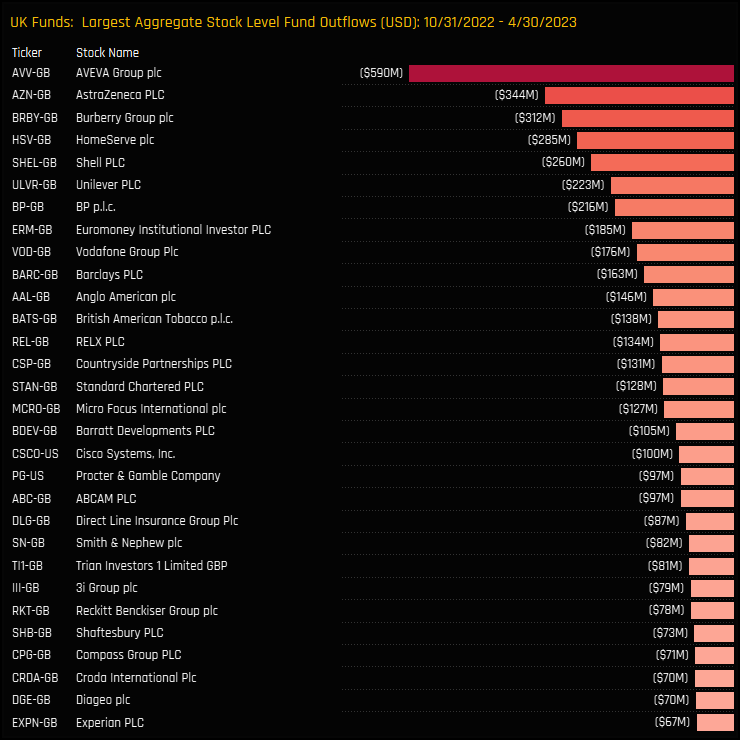
Largest Stock Outflows, $
The largest combined fund outflows on a stock level between 10/31/2022 and 04/30/2023.
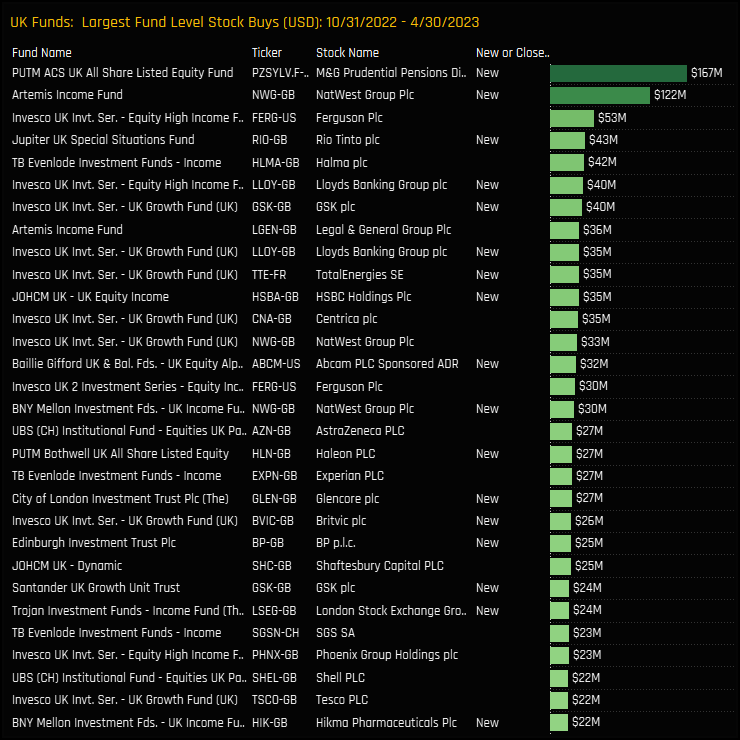
Largest Fund Level Stock Inflows, $
The largest fund level stock inflows between 10/31/2022 and 04/30/2023.
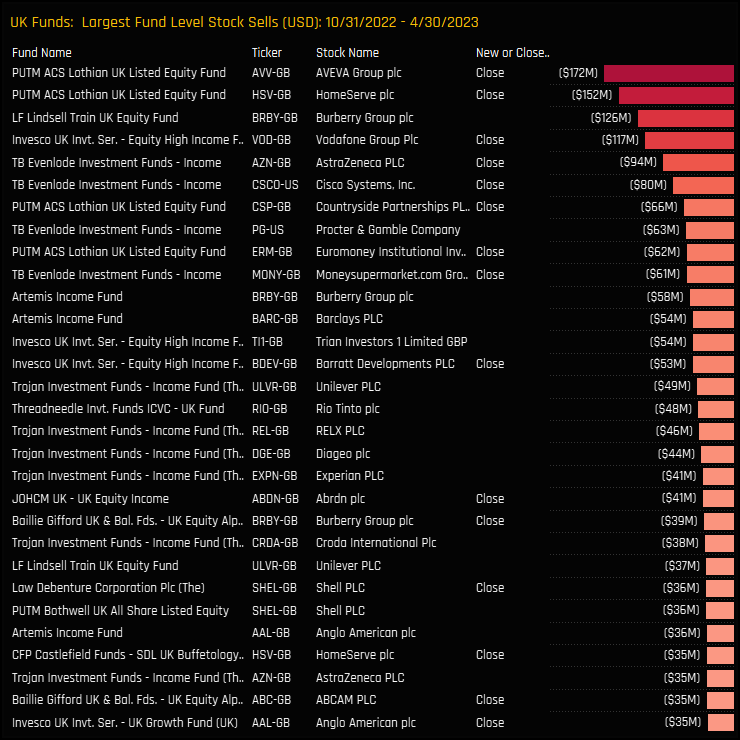
Largest Fund Level Stock Outflows, $
The largest fund level stock outflows between 10/31/2022 and 04/30/2023.
267 UK Equity Funds, AUM $184bn
UK Active Funds Ownership Report
To round off this month's UK research, please click on the link below for the full data report on UK active fund positioning
For more analysis, data or information on active investor positioning in your market, please get in touch with me on steven.holden@copleyfundresearch.com
Investor Positioning Report — Copley Fund Research Ltd · Last updated: July 2026 · Registered in England and Wales
1. Who we are
Copley Fund Research Ltd provides proprietary institutional fund intelligence to listed companies and investor relations professionals. These terms govern every purchase of an Investor Positioning Report. By completing a purchase you confirm you have read, understood, and agreed to these terms in full.
2. What you are purchasing
The Investor Positioning Report is a bespoke PDF report mapping the institutional fund universe around your stock. It covers current investors, past investors, competitor investors, and white space investors. Every report is built from scratch for the specific company ordered and is not a standardised or templated product.
3. Delivery and process
Following payment or invoice issuance, Copley Fund Research will contact you within one working day to agree your competitor set. Production begins once the competitor set is confirmed in writing. The completed report will be released to you within 48 hours of production starting, provided payment has been received in full; where payment is outstanding, the report will be withheld until payment clears. If the requested company falls outside our covered fund universes, or a competitor set cannot be agreed, Copley Fund Research will issue a full refund or cancel the outstanding invoice.
4. Competitor set agreement
The competitor set is agreed with you in writing prior to production, and the report is built to that agreed specification. Requests to amend the competitor set after delivery, based on a change of preference rather than an error, may be treated as a new order.
5. Refund policy
Because each report is produced individually for your company, orders are non-refundable once production has begun, except as set out in clauses 3 and 5a below. By purchasing, you agree not to dispute the charge with your card provider on the basis that the service was not as described, provided the report has been delivered to the agreed specification or corrected under clause 5a.
5a. Quality remedy
If a delivered report contains a material error caused by Copley Fund Research — for example, an incorrect company analysed, a competitor omitted from the agreed set, or content missing from the specification in clause 2 — Copley Fund Research will correct and redeliver the report at no additional charge, within a reasonable timeframe. This is your sole remedy for such errors.
6. Data and accuracy
All fund positioning data in the report reflects holdings as disclosed at the most recently available reporting date at the time of compilation. The timing of fund holdings disclosures is determined by regulatory requirements applicable to each fund and is outside the control of Copley Fund Research Ltd. This data may not reflect current fund positions. Copley Fund Research takes reasonable care to ensure accuracy but makes no warranty, express or implied, as to the completeness or current accuracy of the underlying data — though this does not affect the quality remedy in clause 5a for errors in how that data was analysed or presented. Past fund positioning is not indicative of future fund behaviour or investment decisions.
7. Not investment advice
The Investor Positioning Report is produced for investor relations intelligence purposes only. It does not constitute investment advice, financial advice, or a recommendation to buy, hold, or sell any security. The data reflects historical fund positioning and must not be relied upon as a prediction of future fund behaviour or investment decisions. Copley Fund Research Ltd is not authorised or regulated by the Financial Conduct Authority for the provision of investment advice.
8. Permitted use and confidentiality
The report is licensed for internal use by the purchasing organisation only. You may share it with employees and directors of your organisation. You may not: reproduce, redistribute, publish, or resell the report or any part of it; share it with any third party outside your organisation without prior written consent; use the fund or portfolio manager names contained in the report to approach those individuals on behalf of Copley Fund Research or in a manner that could damage Copley Fund Research's relationships with those funds; or use the data for any purpose other than your own investor relations strategy. The data, analysis, and methodology contained in the report are the intellectual property of Copley


