Positioning in the Banking industry group stalls after US Banking failures, but non-US sentiment is improving.
Time-Series & Industry Positioning
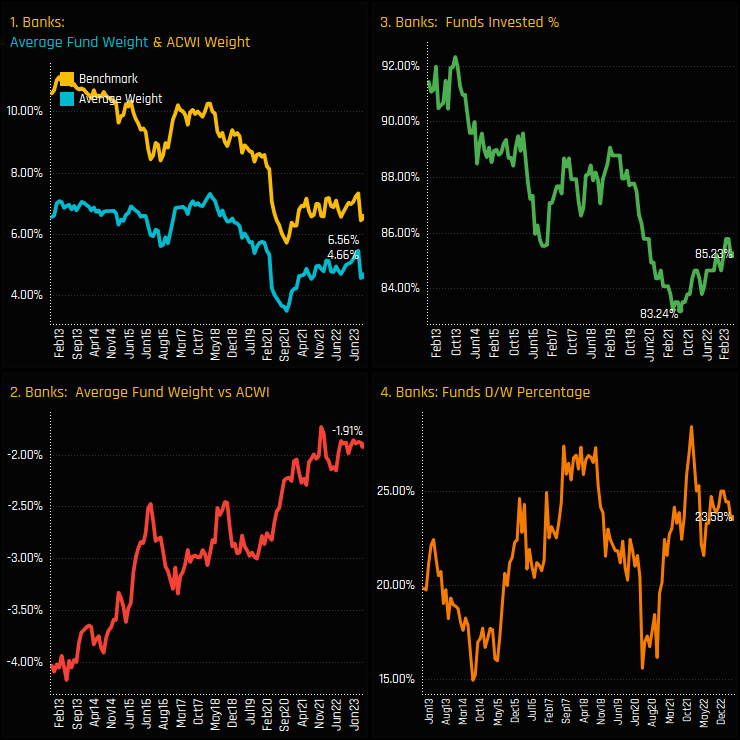
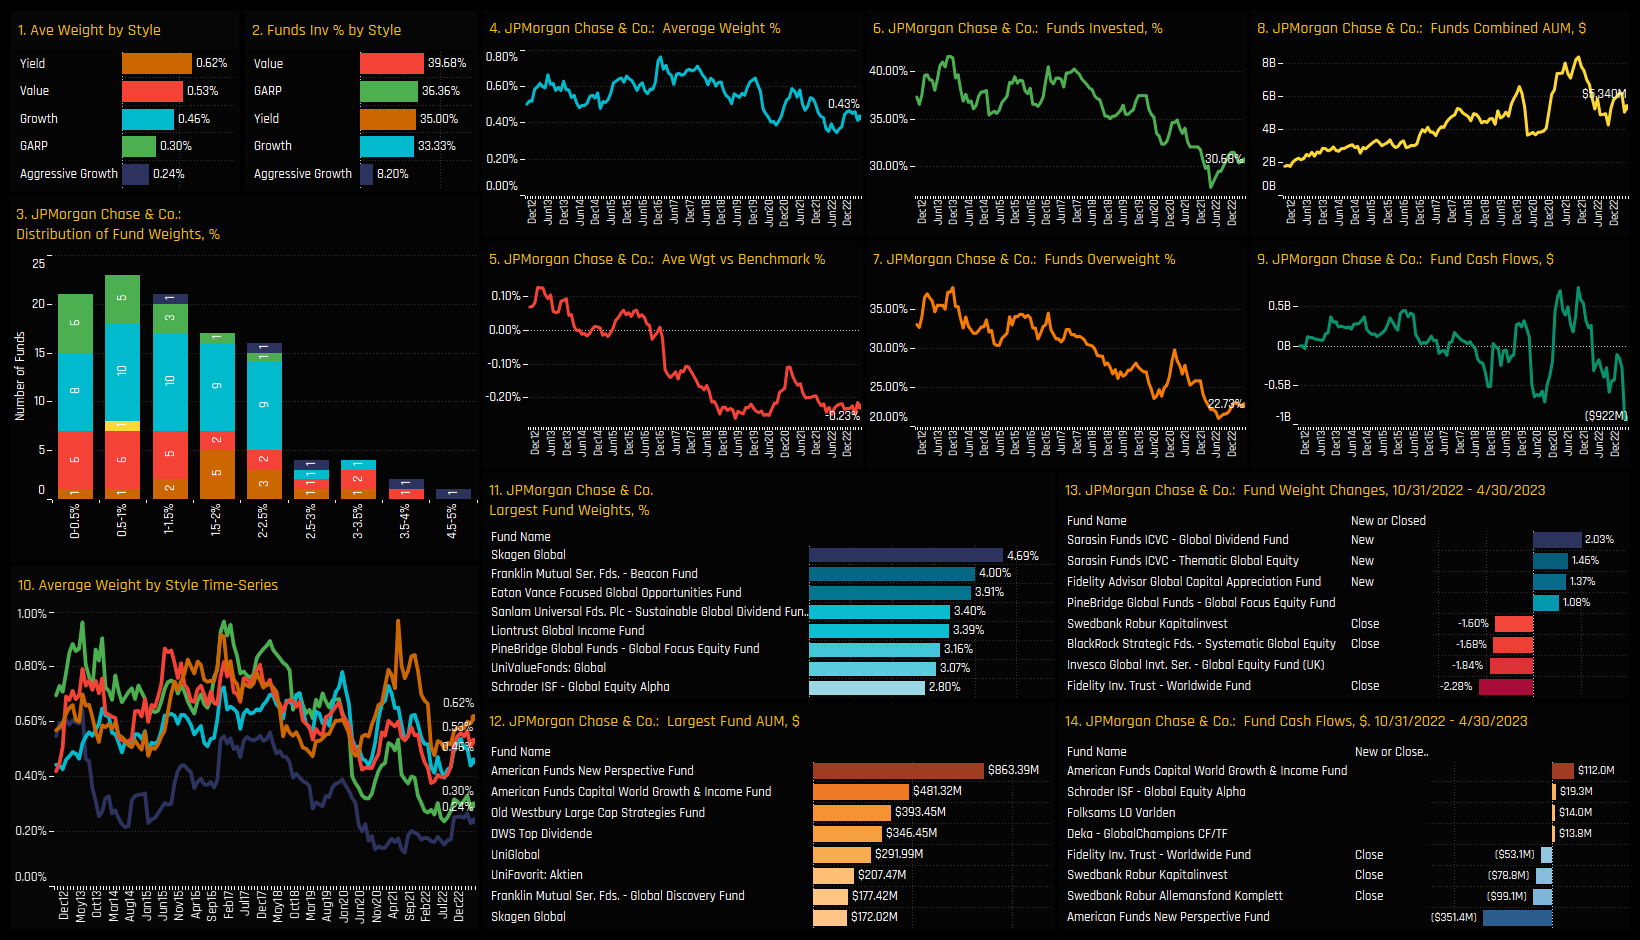
Among active Global equity funds, exposure to Banking stocks is at the lower end of the decade long range. Average weights across the 352 funds in our analysis stand at 4.66% (ch1), below the benchmark by -1.91% (ch2), with just 23.6% of funds positioned overweight the SPDRs MSCI ACWI ETF (ch4). In terms of outright ownership in chart 3, the percentage of funds with exposure to the Banking sector stands at 85.2%, up from the lows of 83.2% in mid-2021 but still at the lower end of the longer-term range.
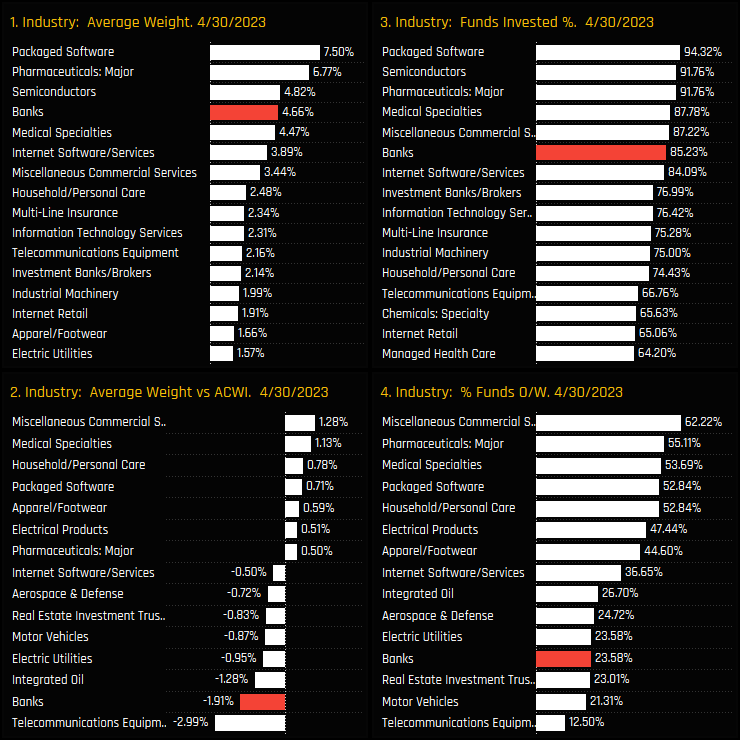
Banks are the 4th largest industry group on an average weight basis after Packaged Software, Major Pharmaceuticals and Semiconductors (ch1). Versus the SPDRs MSCI ACWI ETF (cash removed and weights adjusted), Banks are the 2nd largest industry level underweight after Telecommunication Equipment (mainly Apple), offset by overweights in Miscellaneous Commercial Services (Visa/Mastercard) and Medical Specialties (Thermo Fisher, EssilorLuxottica).
Industry Activity & Sentiment
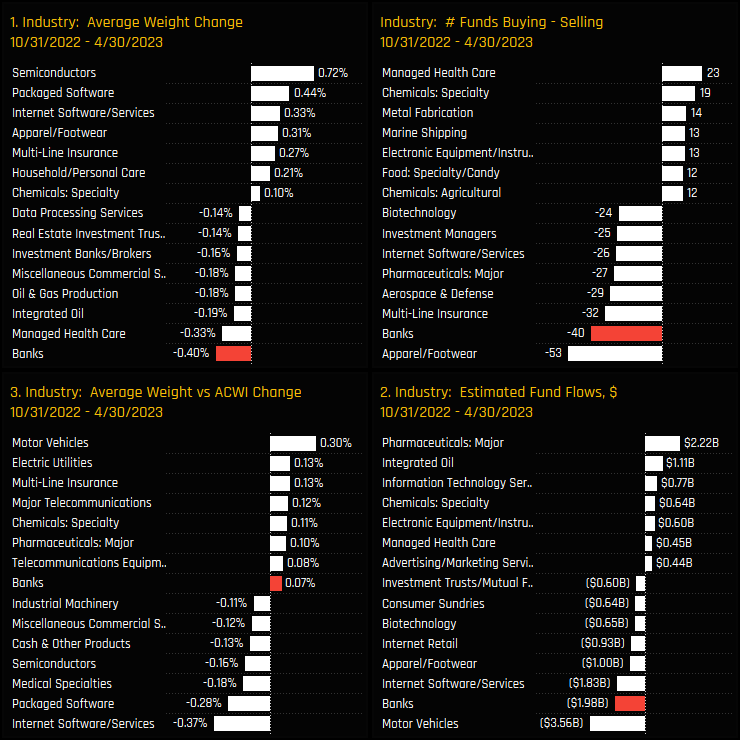
Industry level ownership changes between the filing dates of 10/31/2022 and 04/30/2023 are highlighted in the chart set below, and show a degree of active rotation away from the Banking industry group over the period. Banks experienced the largest drop in average weight of -0.4%, suffered fund outflows of $-1.98bn and had 40 more sellers than buyers over the period. The fall in average weights on the existing underweight position reduced the underweight by 0.07%.
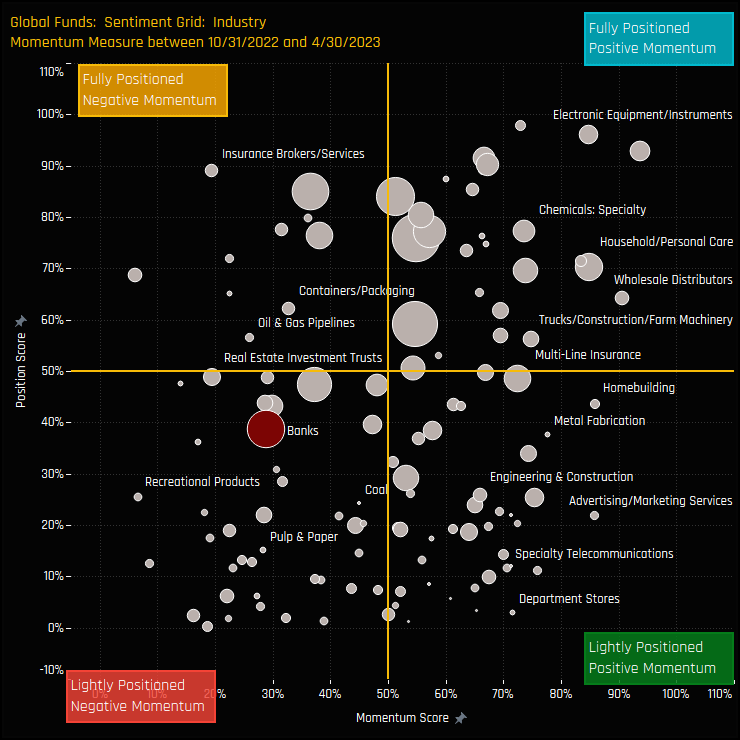
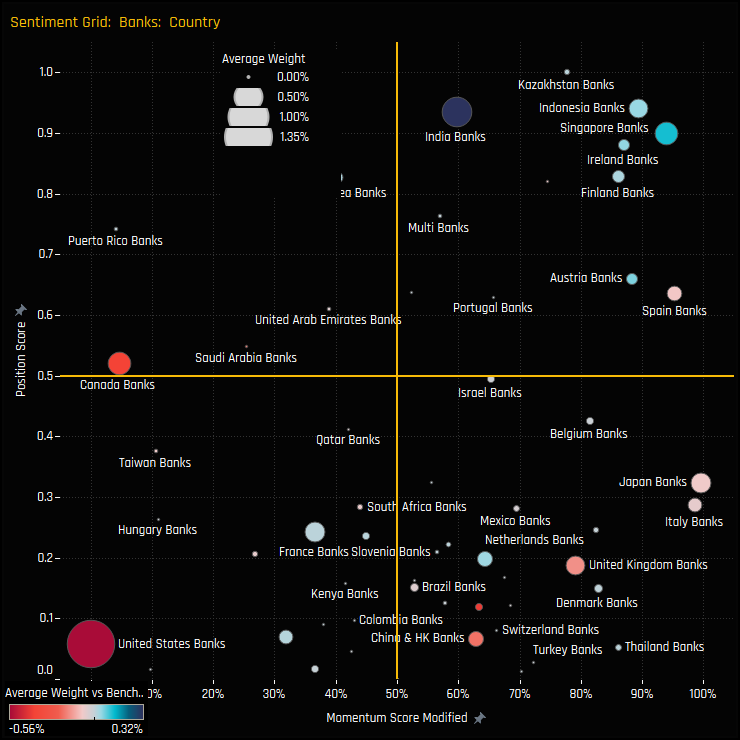
The sentiment grid below shows where current positioning in each Global industry group sits versus its own history going back to 2011 on a scale of 0-100% (y-axis), against a measure of fund activity for each industry between 10/31/2022 and 04/30/2023 (x-axis). Global Banks sit in the bottom-left quadrant, indicative of a combination of low positioning and outward rotation among managers.
Banks Country Exposure
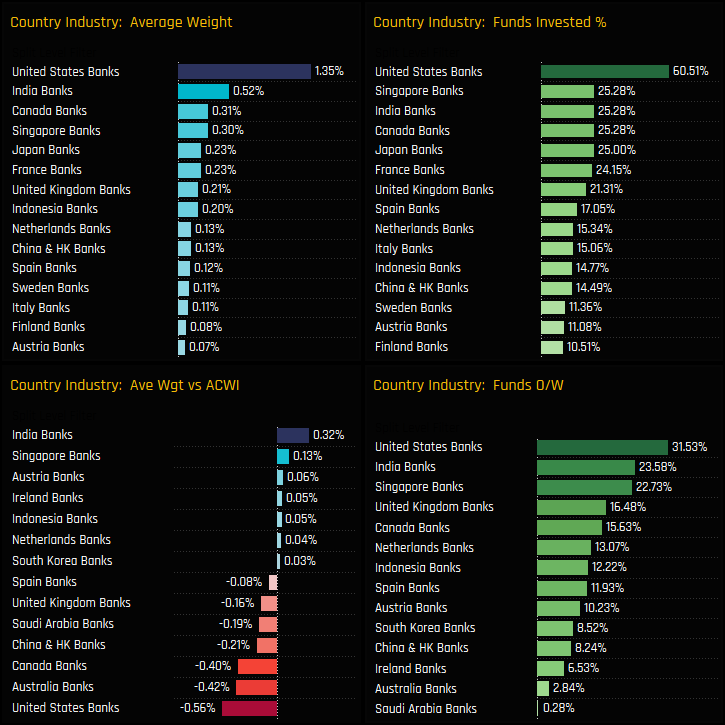
On a country level, United States Banks are the dominant holding, with average weights of 1.36% and a total of 60.5% of funds invested. It is also the largest net underweight at -0.56% below benchmark. Perhaps surprisingly, Indian Banks are the 2nd largest country exposure and the key overweight, followed by Singaporean Banks (see Singapore Banks: Breaking Out). Australia, Canada and China & HK contribute to the overall Banks underweight.
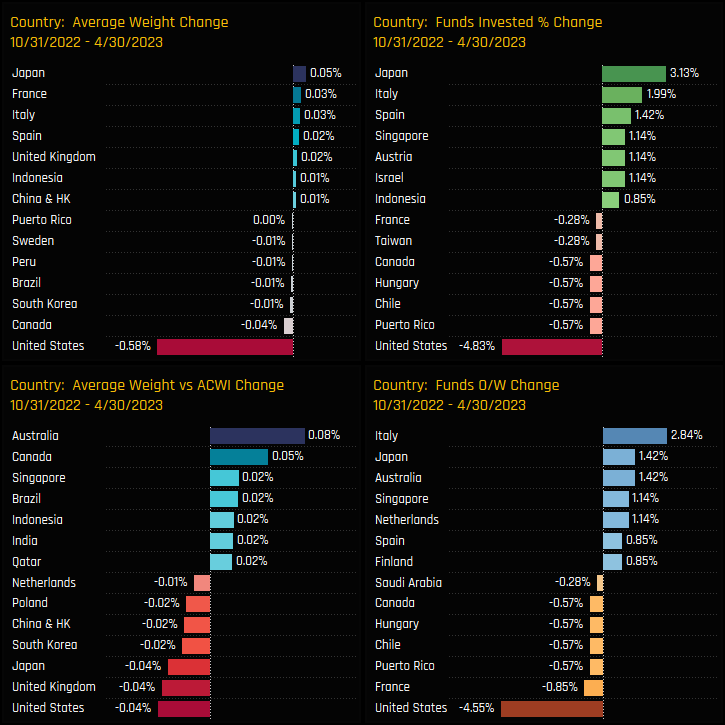
The key changes in Bank exposure by country are highlighted in the charts below. They clearly show the USA as the driver behind the overall reduction in Bank exposure, with average weights falling by -0.58%, 4.8% of funds closing exposure entirely and 4.6% moving to underweight. Increases in ownership were seen in Japan, Singapore and a host of European countries, though not enough to offset the decline in US Banks.
Fund Holdings & Activity
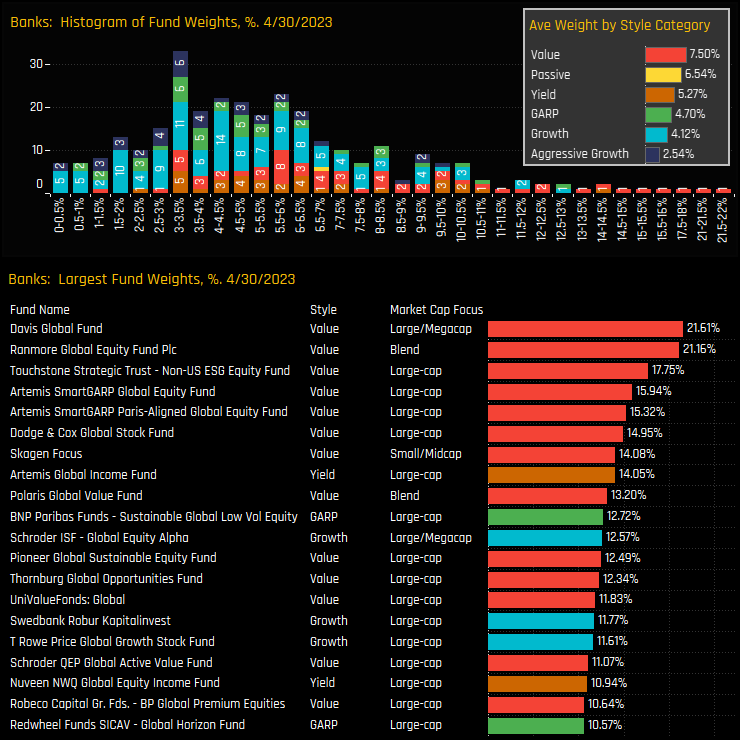
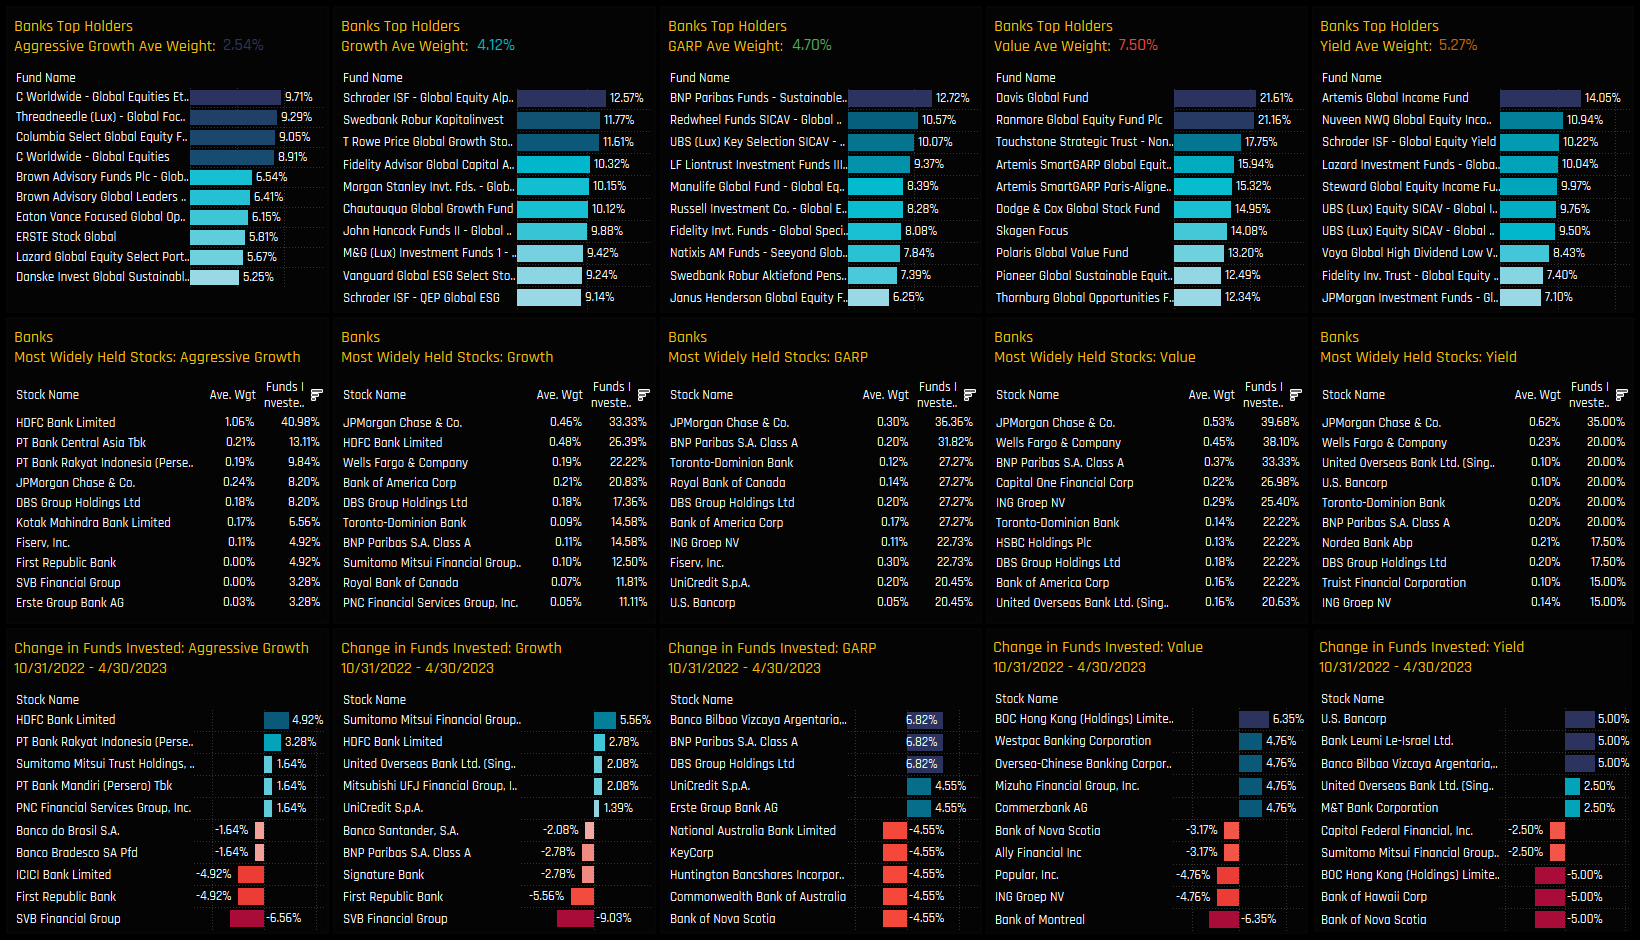
A histogram of fund holdings in the Banking industry group is shown in the top chart below and the major holders in the bottom chart. It highlights a concentration of fund weights at between 3% and 6.5%, but with an extended tail to the upside led by Davis Global (21.6%) and Ranmore Global Equity (21.2%). Value funds are better allocated than their Growth peers, occupying 8 of the largest 10 fund weights and with average allocations of 7.5% versus 4.1%. Aggressive Growth funds are almost an outlier, with low average fund weights of 2.5% and a higher percentage of managers avoiding the sector completely.
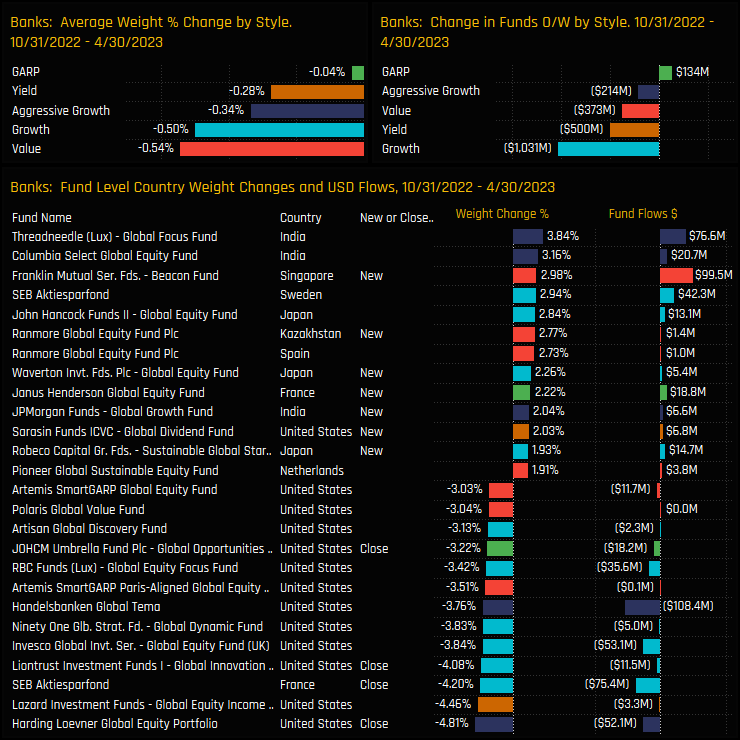
Between 10/31/2022 and 04/30/2023, average fund weights fell across all the Style groups, led by Value (-0.54%) and Growth (-0.5%), with net fund outflows in all but GARP. On a fund level, almost all of the largest weight decreases and closures were in US Banks, led by Harding Loevner Global Equity (-4.81%) and Lazard Global Equity Income (-4.46%). Increases were smaller in size and mainly in non-US countries, with increases in Indian Banks by Threadneedle Global Focus (+3.84%) and new positions in Singaporean Banks from Franklin Mutual Beacon (+2.98%).
Stock Holdings
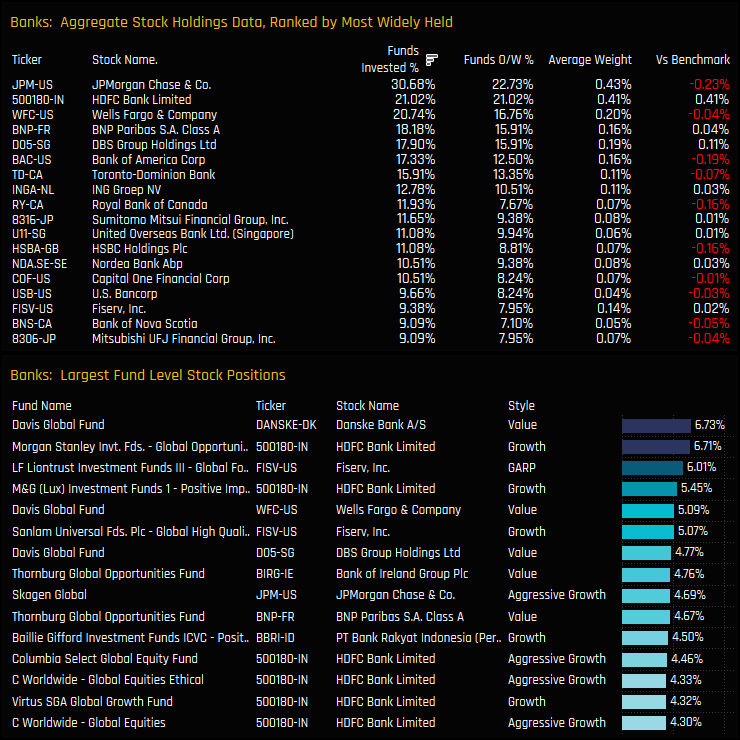
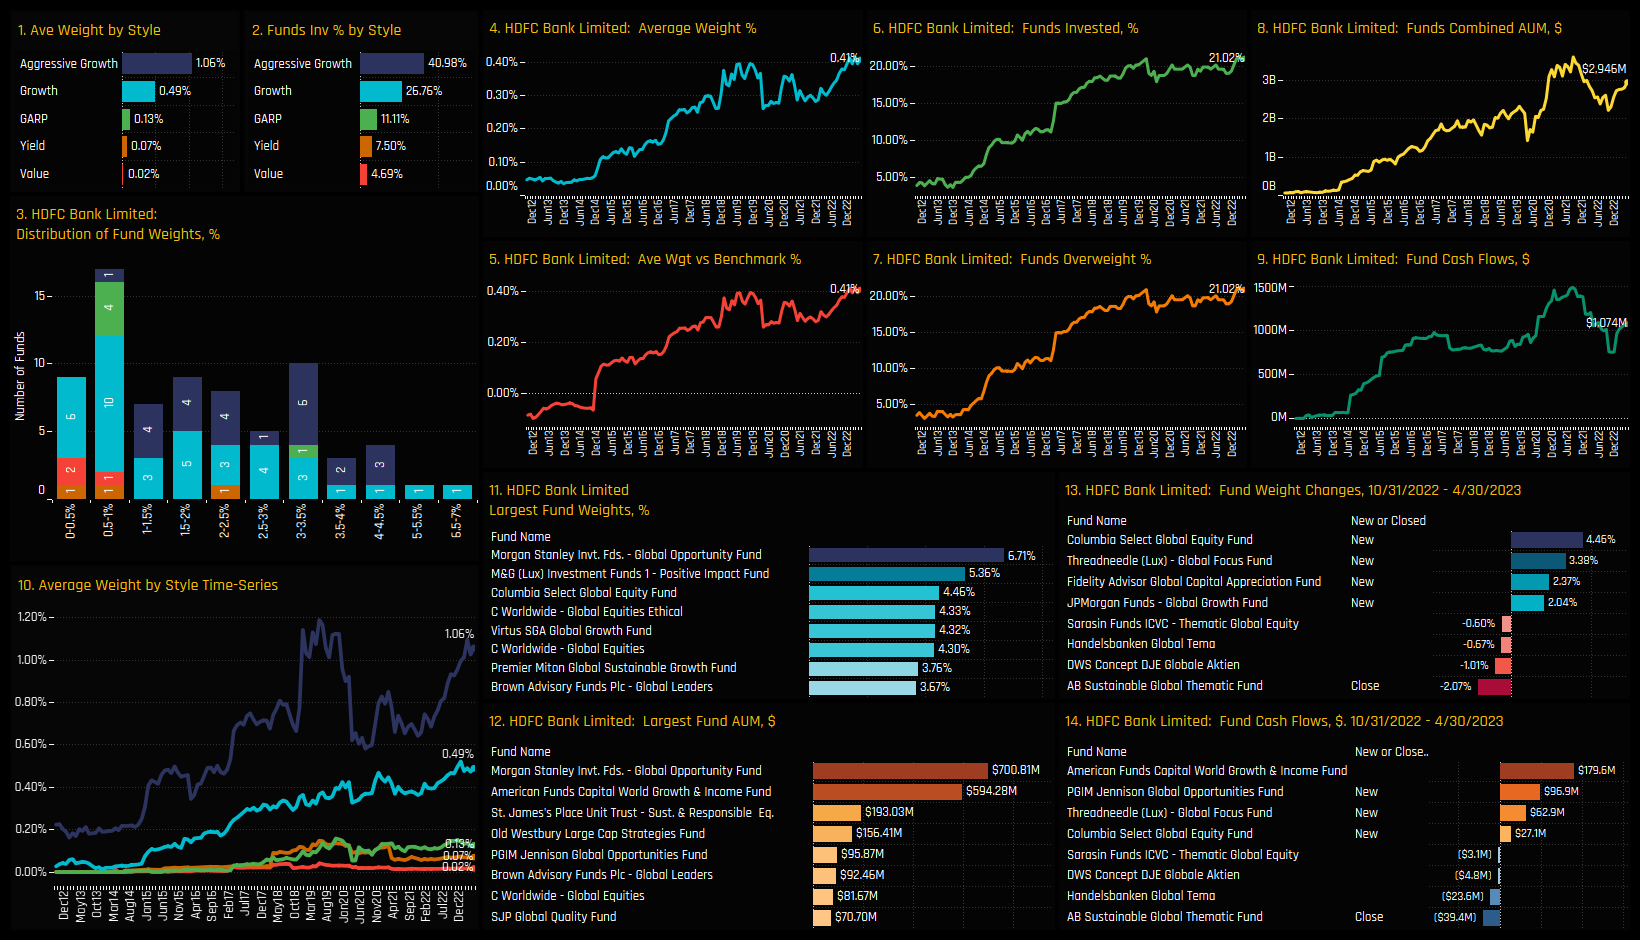
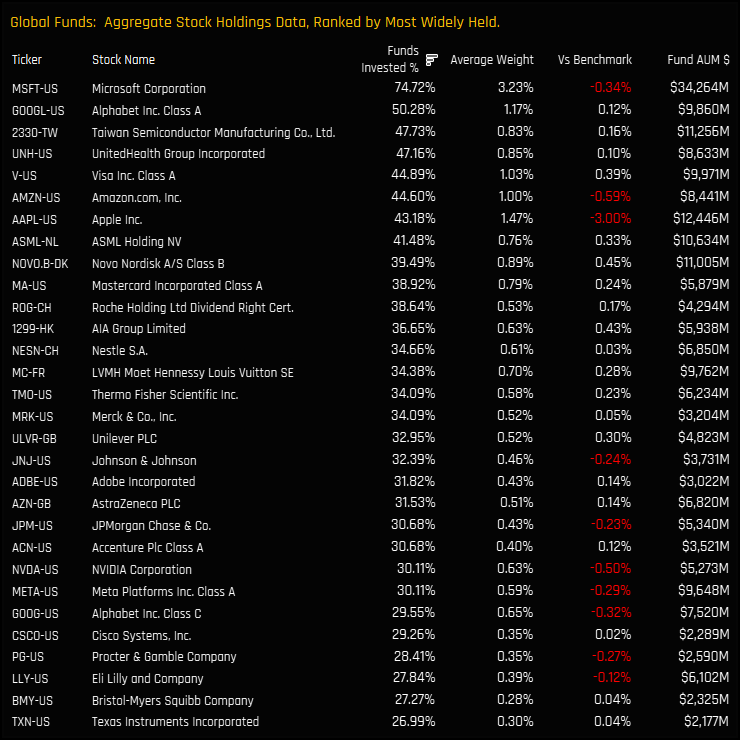
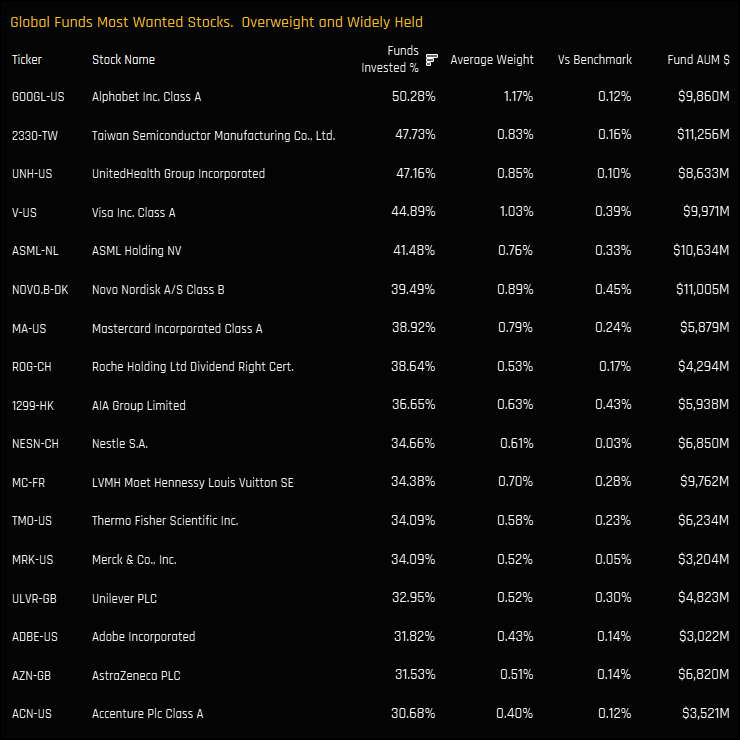
The most widely held company in the Banking sector is JP Morgan Chase, owned by 30.7% of funds at an average weight of 0.43%. HDFC Bank is held by fewer Global managers but at a similar average holding weight, reflective of some large individual positions from Morgan Stanley Global Opportunity (6.7%), M&G Positive Impact (5.5%) and Columbia Select Global Equity (4.5%), among others.
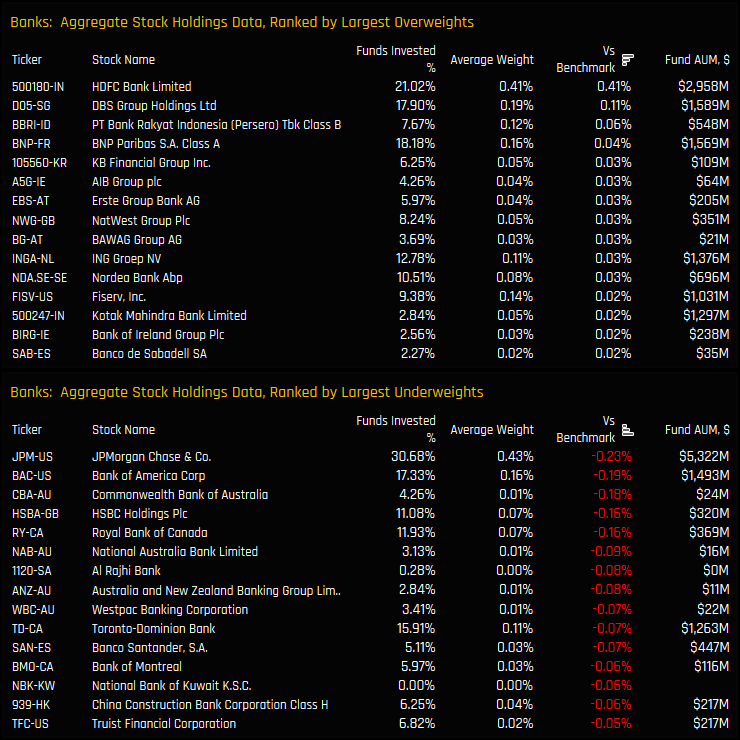
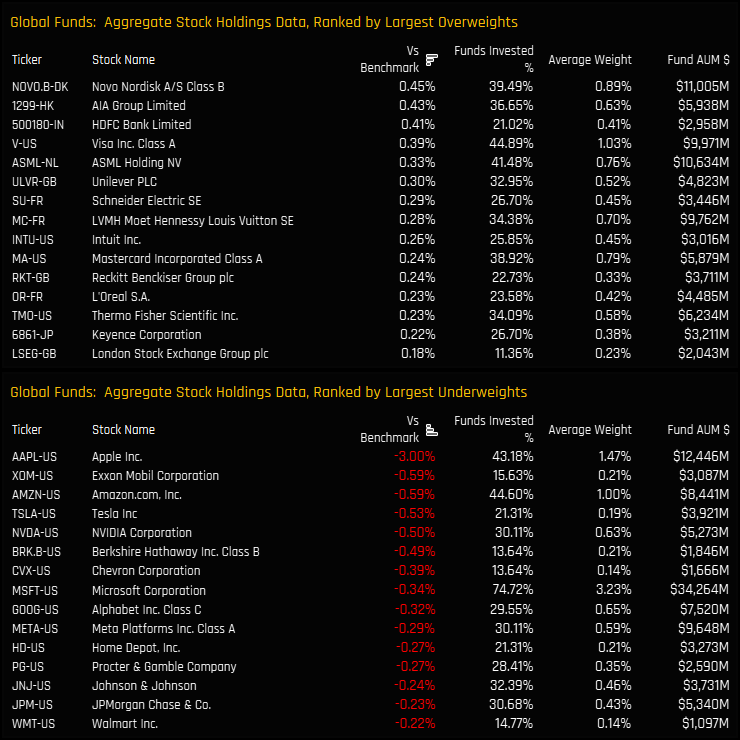
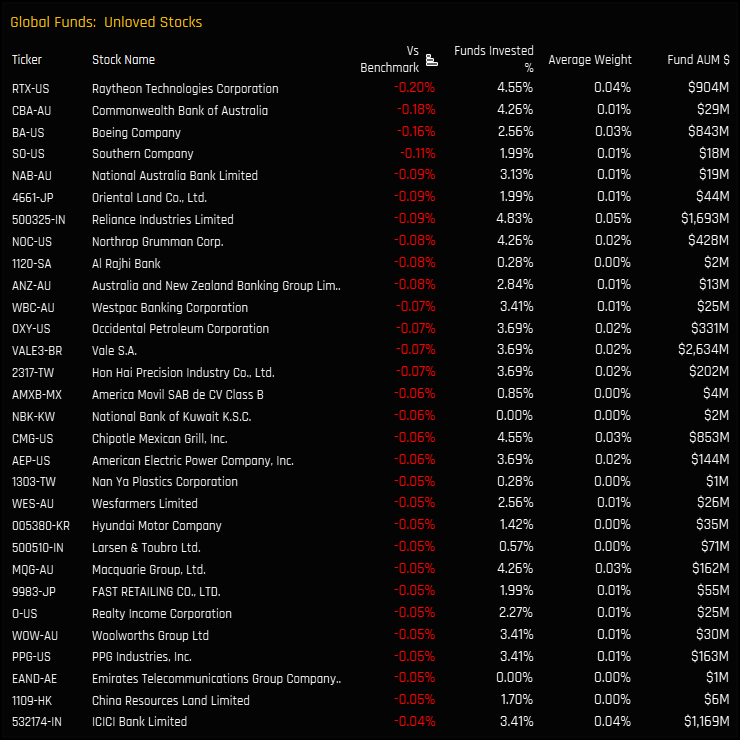
Stock overweights in the banking sector are few and far between, headed by out-of-benchmark holdings in HDFC Bank and overweights in DBS Group and PT Bank Rakyat. Underweights are prolific, with JP Morgan Chase and Bank of America leading the pack, followed by the almost universally avoided Commonwealth Bank of Australia, National Australia Bank and Al Rajhi Bank.
Stock Activity & US Bank Failures
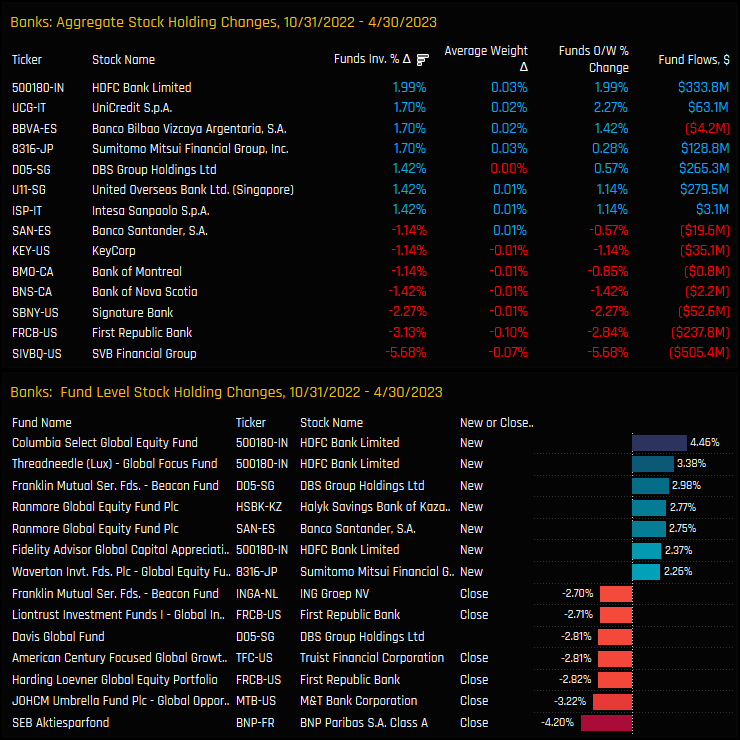
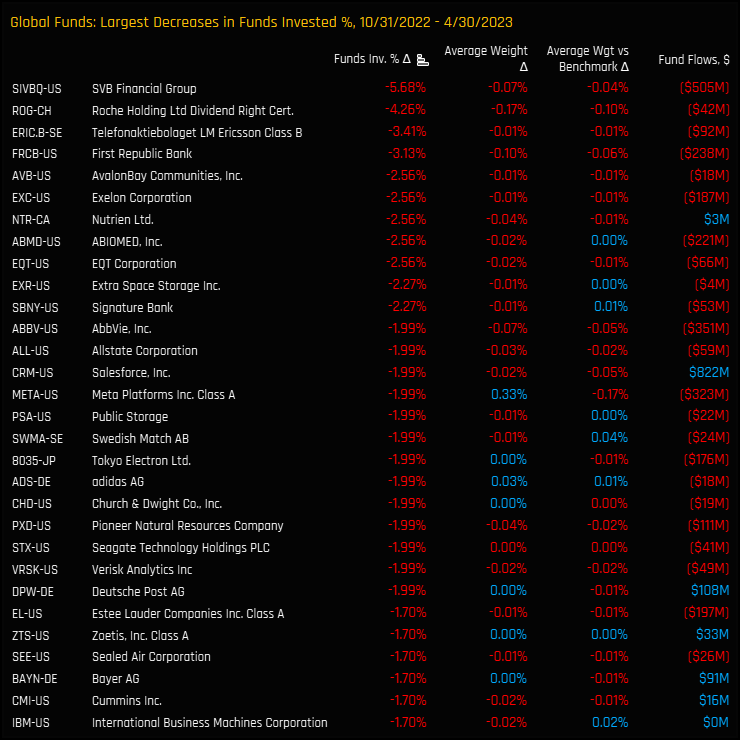
Between the period 10/31/2022 and 04/30/2023, HDFC Bank attracted a further 2% of the funds in our analysis to its ownership base, headed by new positions from Columbia Select Global Equity (+4.5%) and Threadneedle Global Focus (+3.4%). All of the main beneficiaries were in companies outside of the North American region. The ownership declines were led by the 3 collapsed US Banks of SVB Financial, First Republic and Signature Bank, alongside smaller closures in Bank of Nova Scotia and Bank of Montreal.
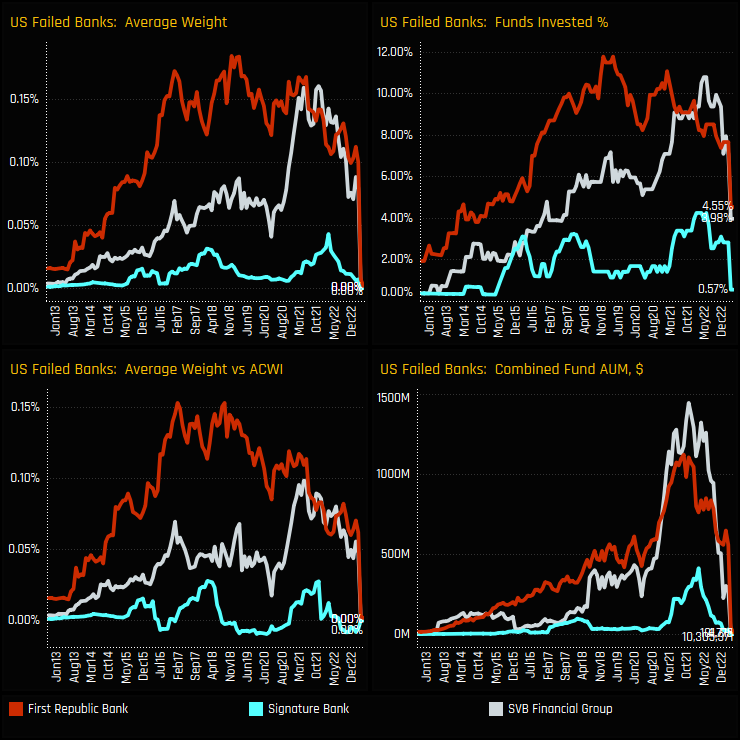
The time-series of ownership for the three failed banks of SVB, First Republic and Signature Bank are shown below. First Republic Bank and SVB Financial were the most widely held, with the percentage of funds invested peaking at 10%-12% between 2021 and 2022. Ownership levels started to decline well before their eventual collapse, with funds closing positions in all 3 companies throughout the course of 2022.
Stock Holdings by Style
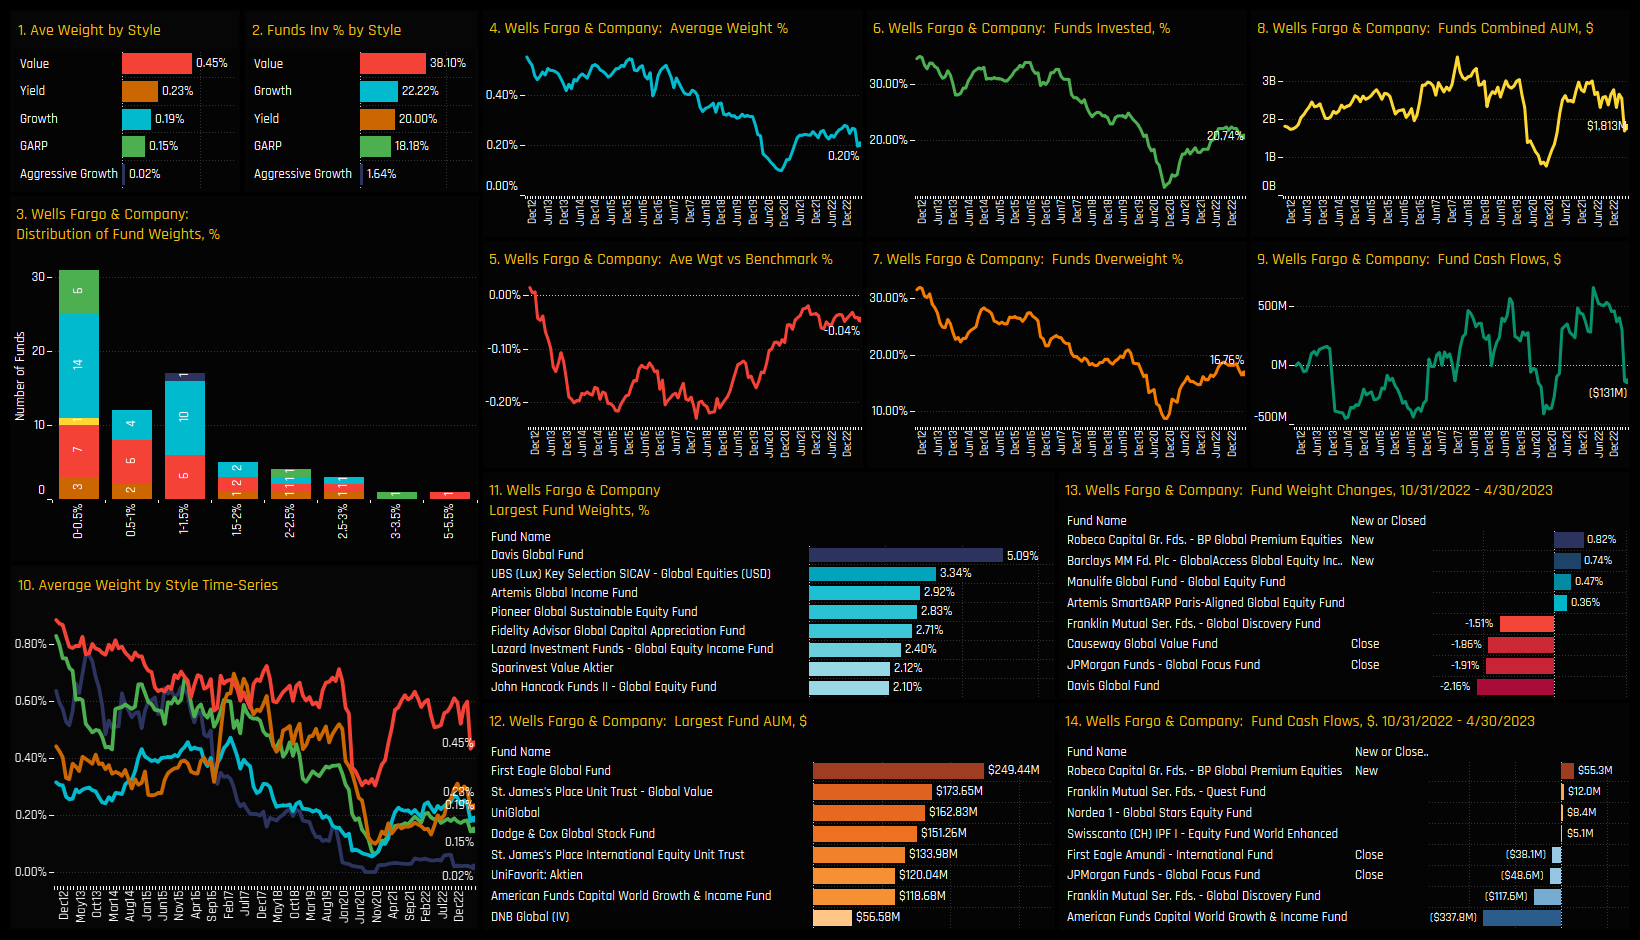
The chart dashboard below highlights the differing stock allocations among each Style group. JP Morgan Chase is the most widely held bank for all groups except for Aggressive Growth, who instead rely almost exclusively on HDFC Bank for their Bank exposure. Indeed, the growth in HDFC Bank ownership was driven by Growth and Aggressive Growth investors, as highlighted in the bottom row of charts. BNP Paribas and Wells Fargo are reasonably well held among Growth, GARP, Yield and Value funds.
Conclusions & Links
Fund exposure in the global banking sector remains at the lower end of the decade-long range. Despite a moderate uptick in ownership since the lows of 2021, more recent activity has seen something of a retreat, with Banks one of the worst performing industry groups over the last 6-months in terms of fund ownership.
Whilst US Banks are still the largest country exposure by a margin, the failure of SVB Financial, First Republic and Signature Bank has clearly effected sentiment. We can see this in the Grid opposite, with US Banks at the extreme bottom left hand corner of the Grid as positioning hits record lows and managers scale back holdings.
Outside of the US, thinks look a lot more promising. The Grid shows near record levels of positioning and strong momentum in Singaporean Banks, Indonesian Banks and Indian Banks. Elsewhere, Japanese Banks, Italian Banks and UK Banks are capturing inflows from a low base. In short, the Global Banking sector is a sub-set of the broader US to non-US rotation that we are seeing among active Global managers this year (see April’s research USA: Record Underweight as Shift to Europe Accelerates)
Scroll down for stock profiles on JP Morgan, Wells Fargo and HDFC Bank. Click on the links below for more detailed reports on the Global Banking industry group.
Global Managers move to their highest ever ownership levels in Dutch Equities
Time-Series & Country Positioning
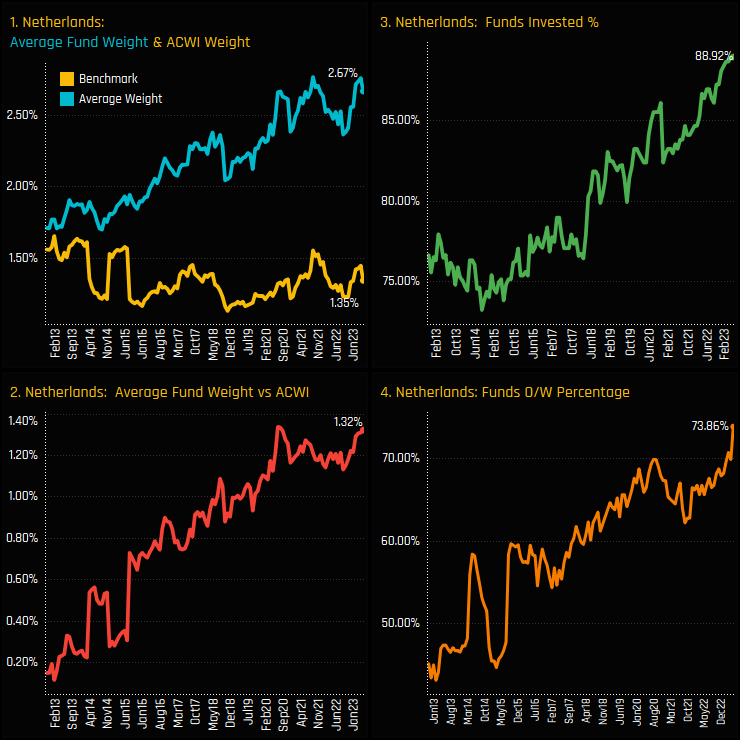
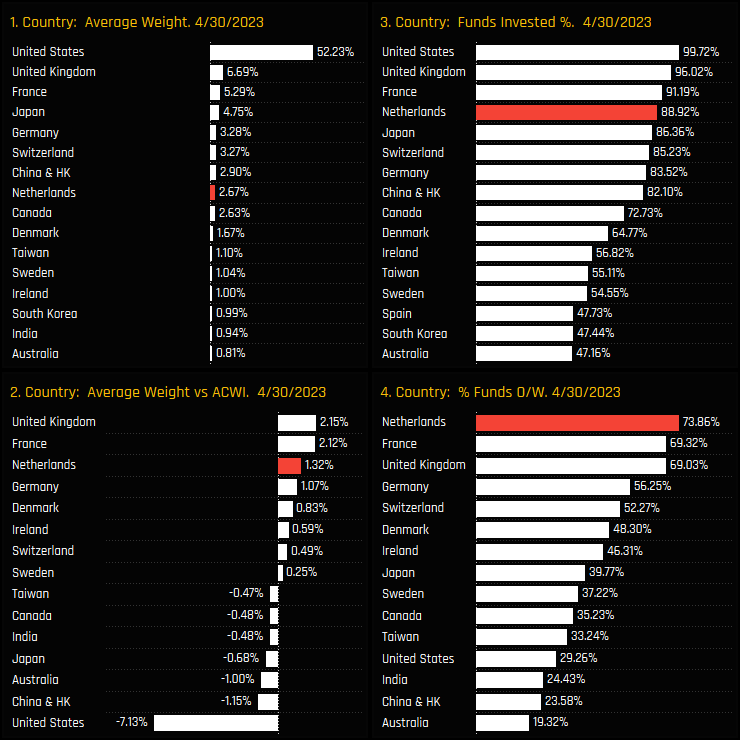
The rise of The Netherlands in active Global portfolios continues unabated. The percentage of Global funds who hold The Netherlands as a country exposure has risen to 88.9%, the highest on record (ch3). Active weights and benchmark weights have diverged over the last decade (ch1), with the SPDRs MSCI ACWI ETF stuck in a 1.1%-1.6% range whilst active weights have surged to 2.67%. As such, active Global funds are running an overweight of +1.32% (ch2), with a record 73.9% of funds positioned more bullishly than the benchmark.
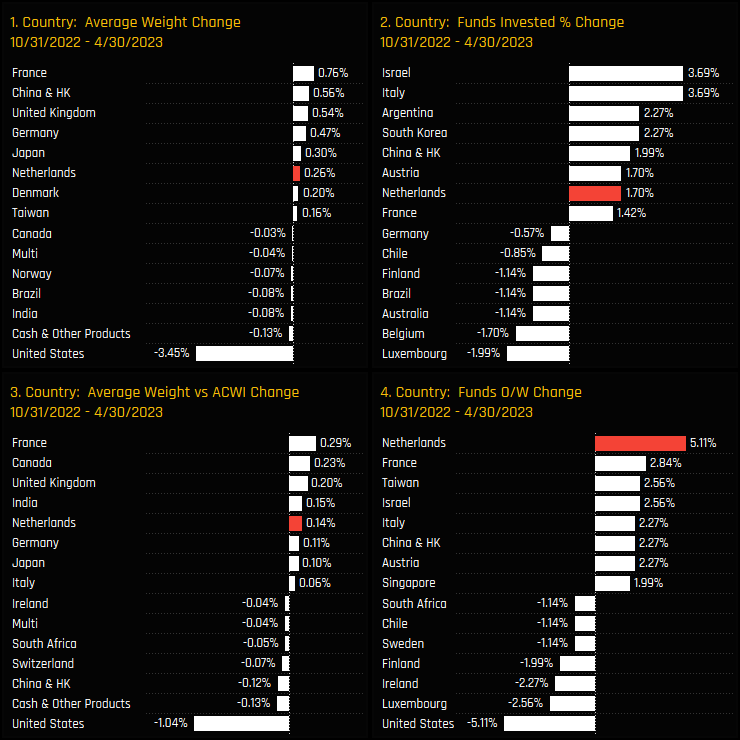
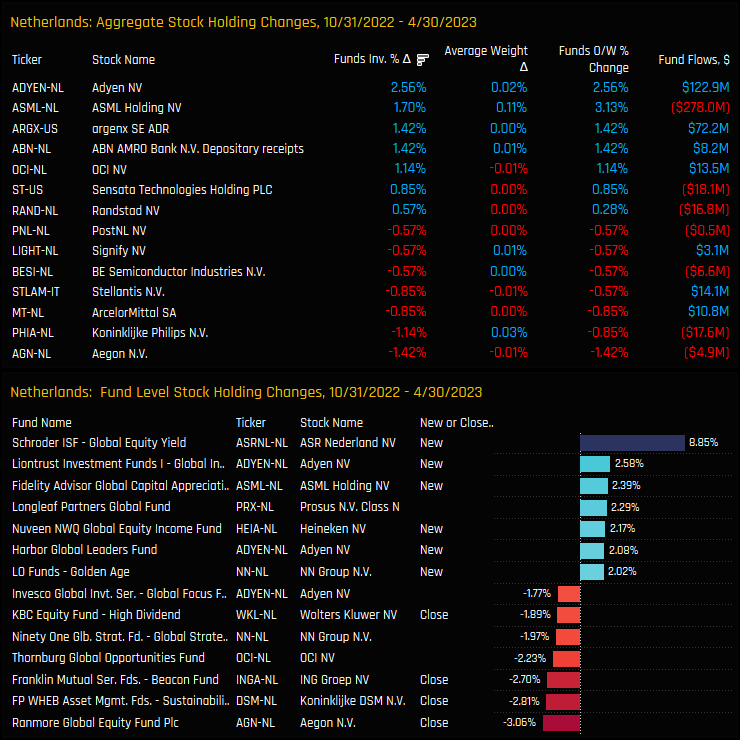
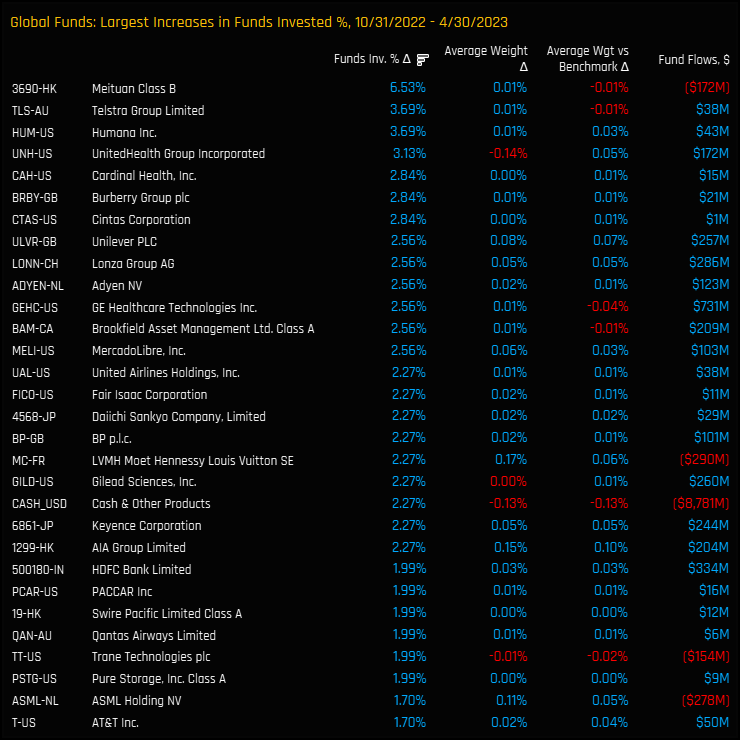
Over the last 6-months, The Netherlands has been a key beneficiary of a sizeable country reallocation among active Global managers. Against a significant scaling back of US allocations, The Netherlands saw all measures of fund ownership move higher. Average weights increased by +0.26% as a further +1.7% of funds added exposure and +5.1% moved to overweight, the highest increase among country peers.
Fund Activity & Holdings
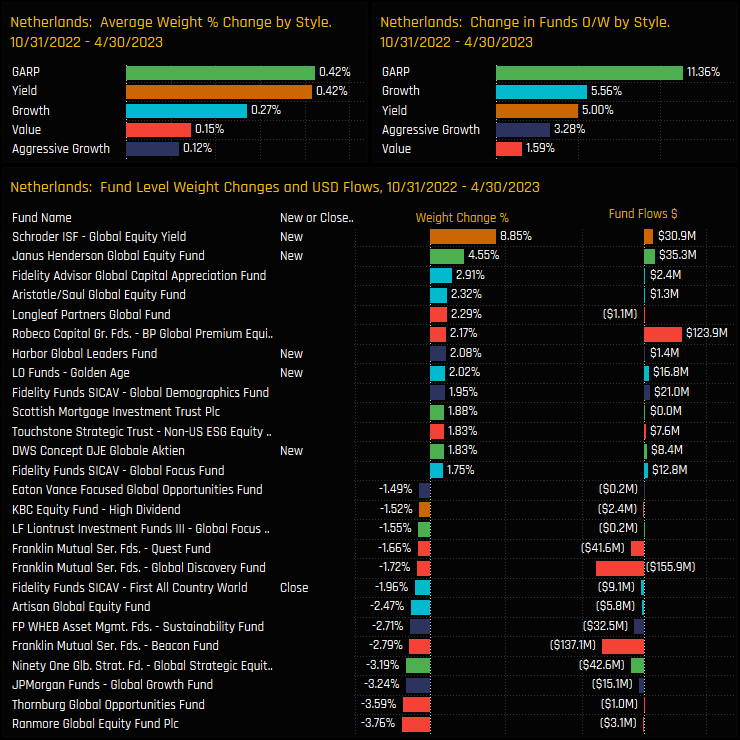
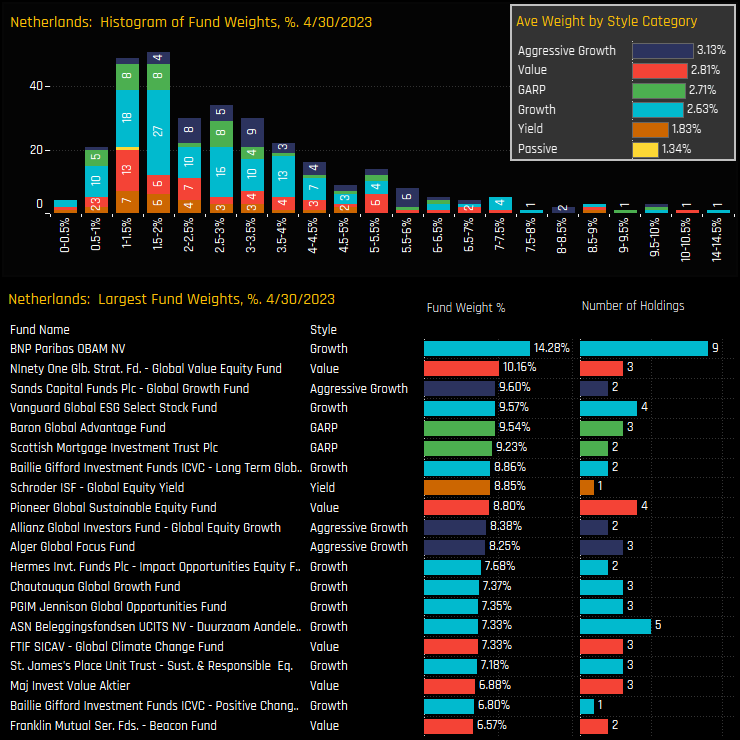
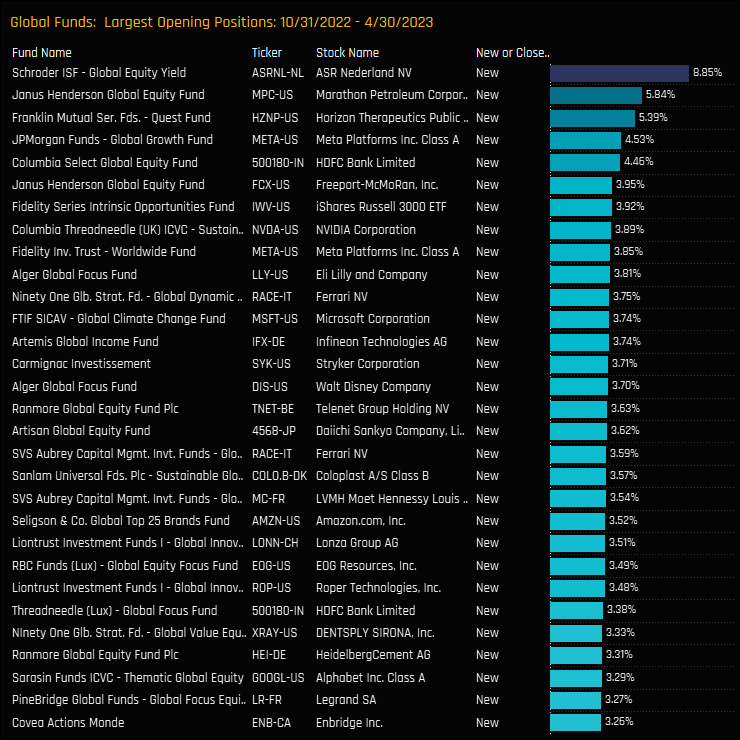
Broken down by Style, these increases were driven by funds at the GARP, Yield and Growth end of the spectrum, though all Style groups saw Netherlands exposure increase, as shown in the top charts below. On a fund level, new positions outnumber closures by a ratio of 5:2, with Schroders Global Equity Yield (+8.85%) and Janus Henderson Global Equity (+4.55%) leading the pack.
The most common holding weight in The Netherlands is between 1% and 5%, but the right-sided tail to the distribution extends to 14.3% for the BNP Paribas OBAM Fund. The Netherlands clearly has appeal across the Style spectrum, with Aggressive Growth and Value funds the largest allocators, though all Style groups are positioned overweight the benchmark SPDRs MSCI ACWI ETF, on average.
Stock Position & Activity
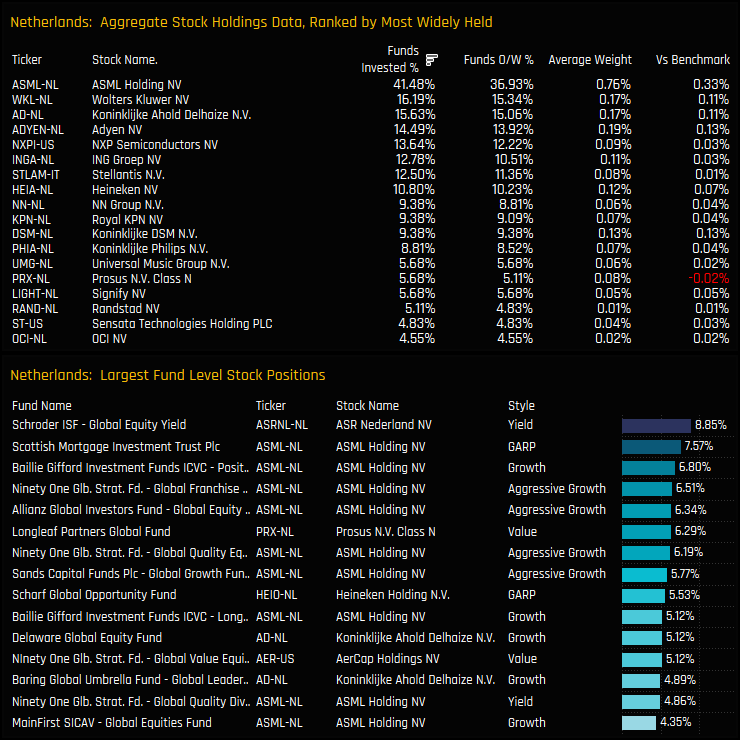
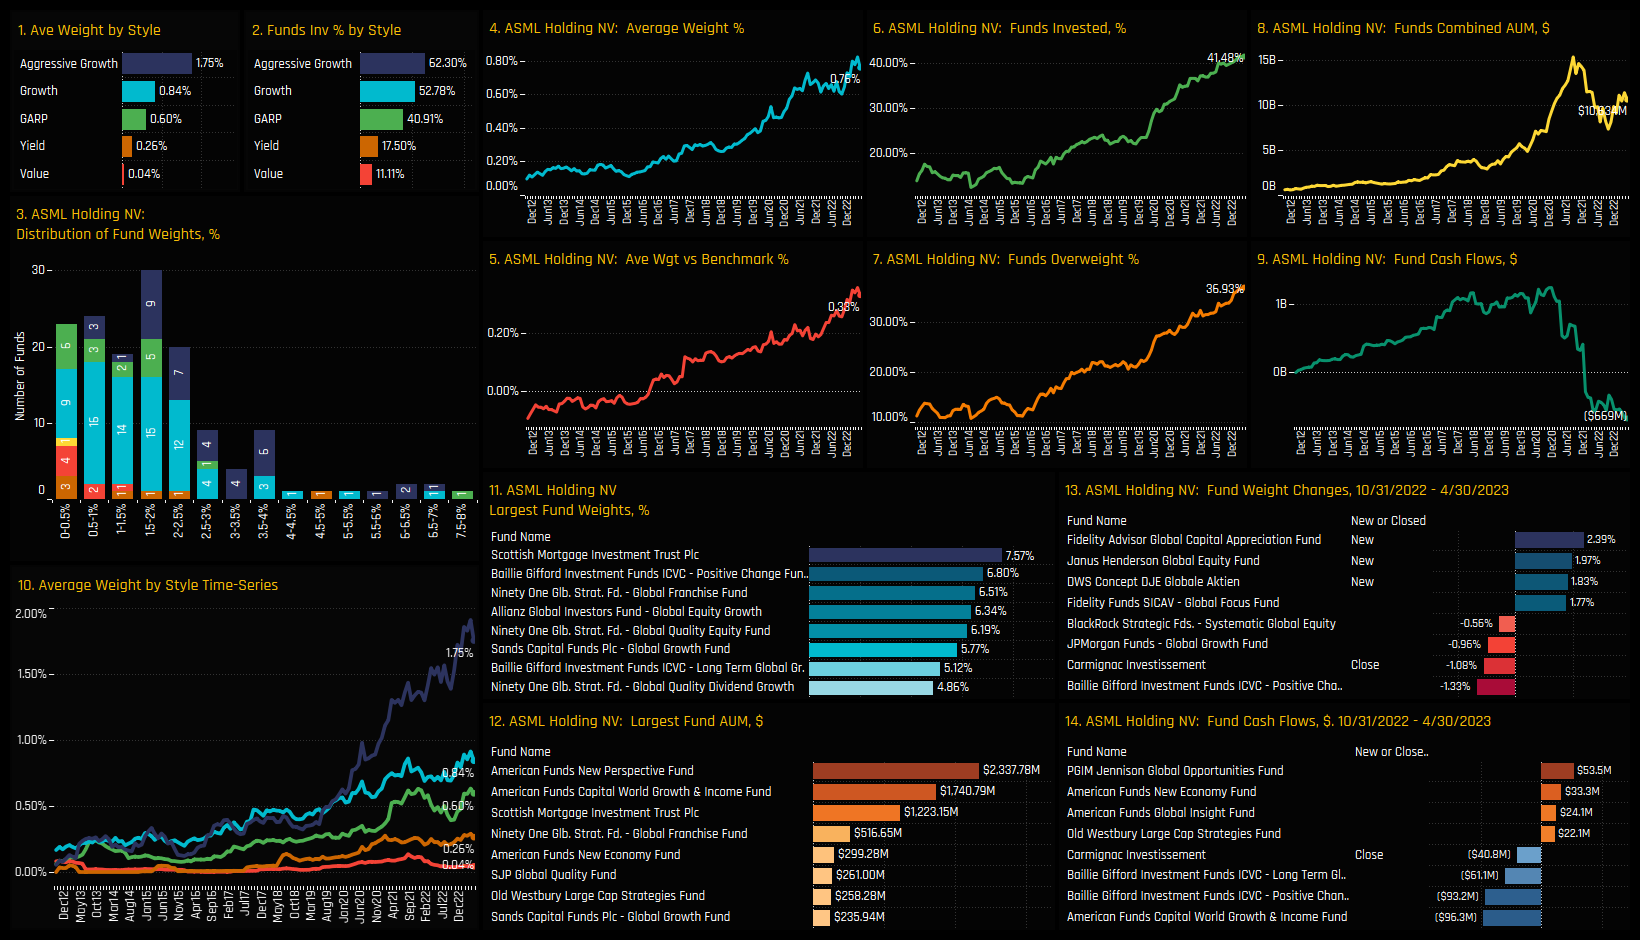
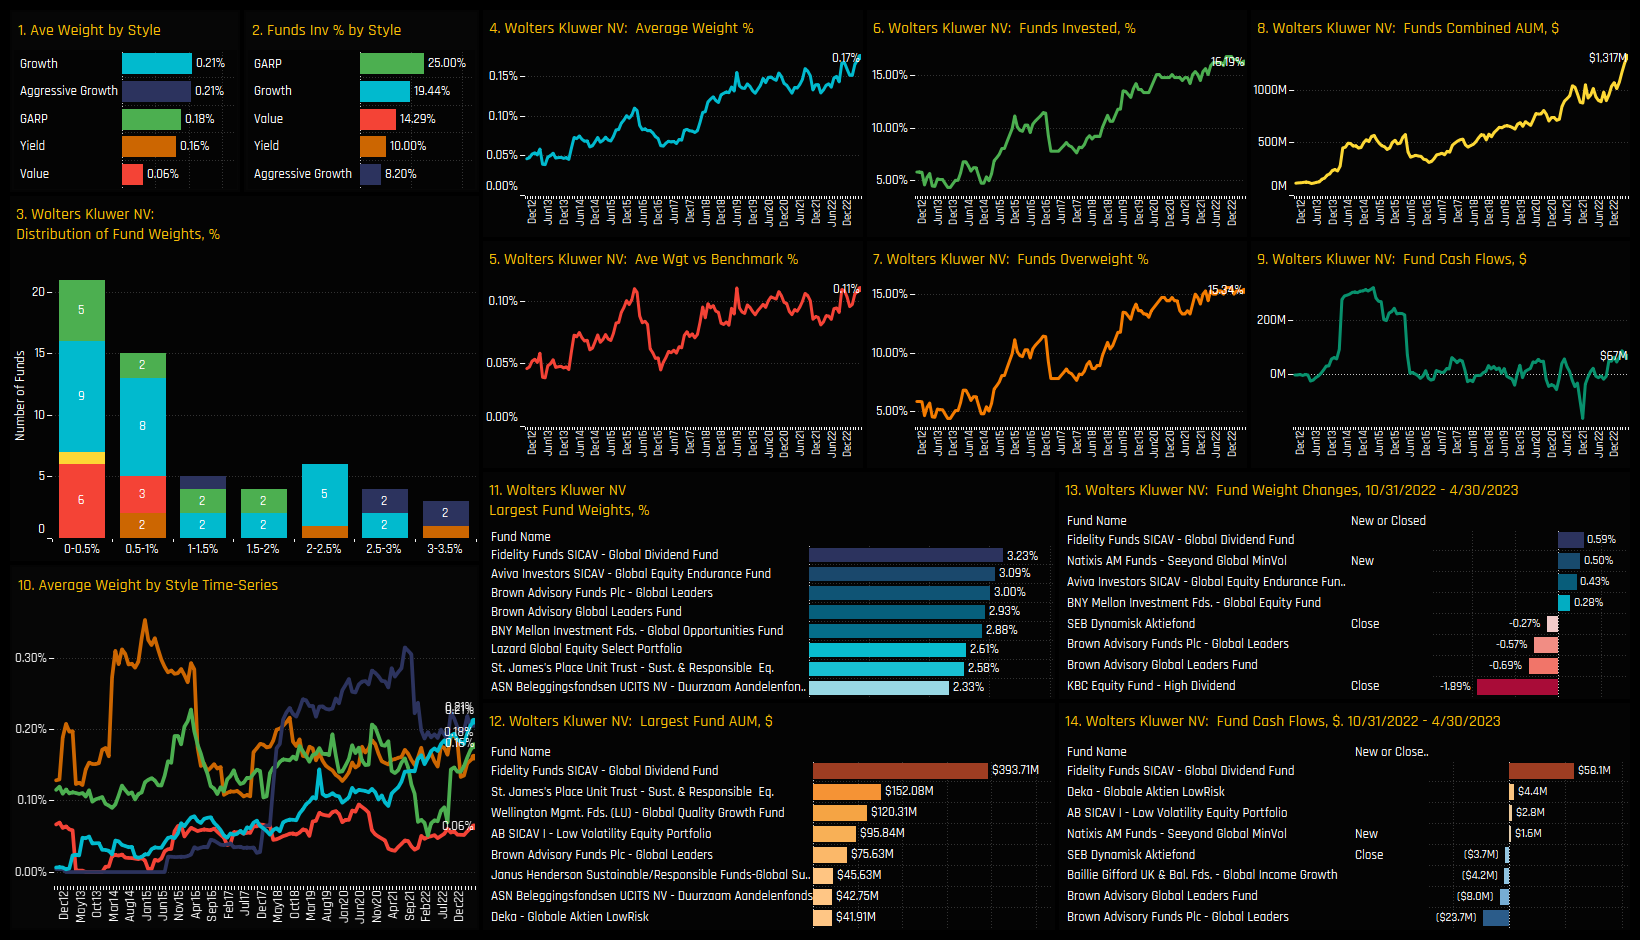
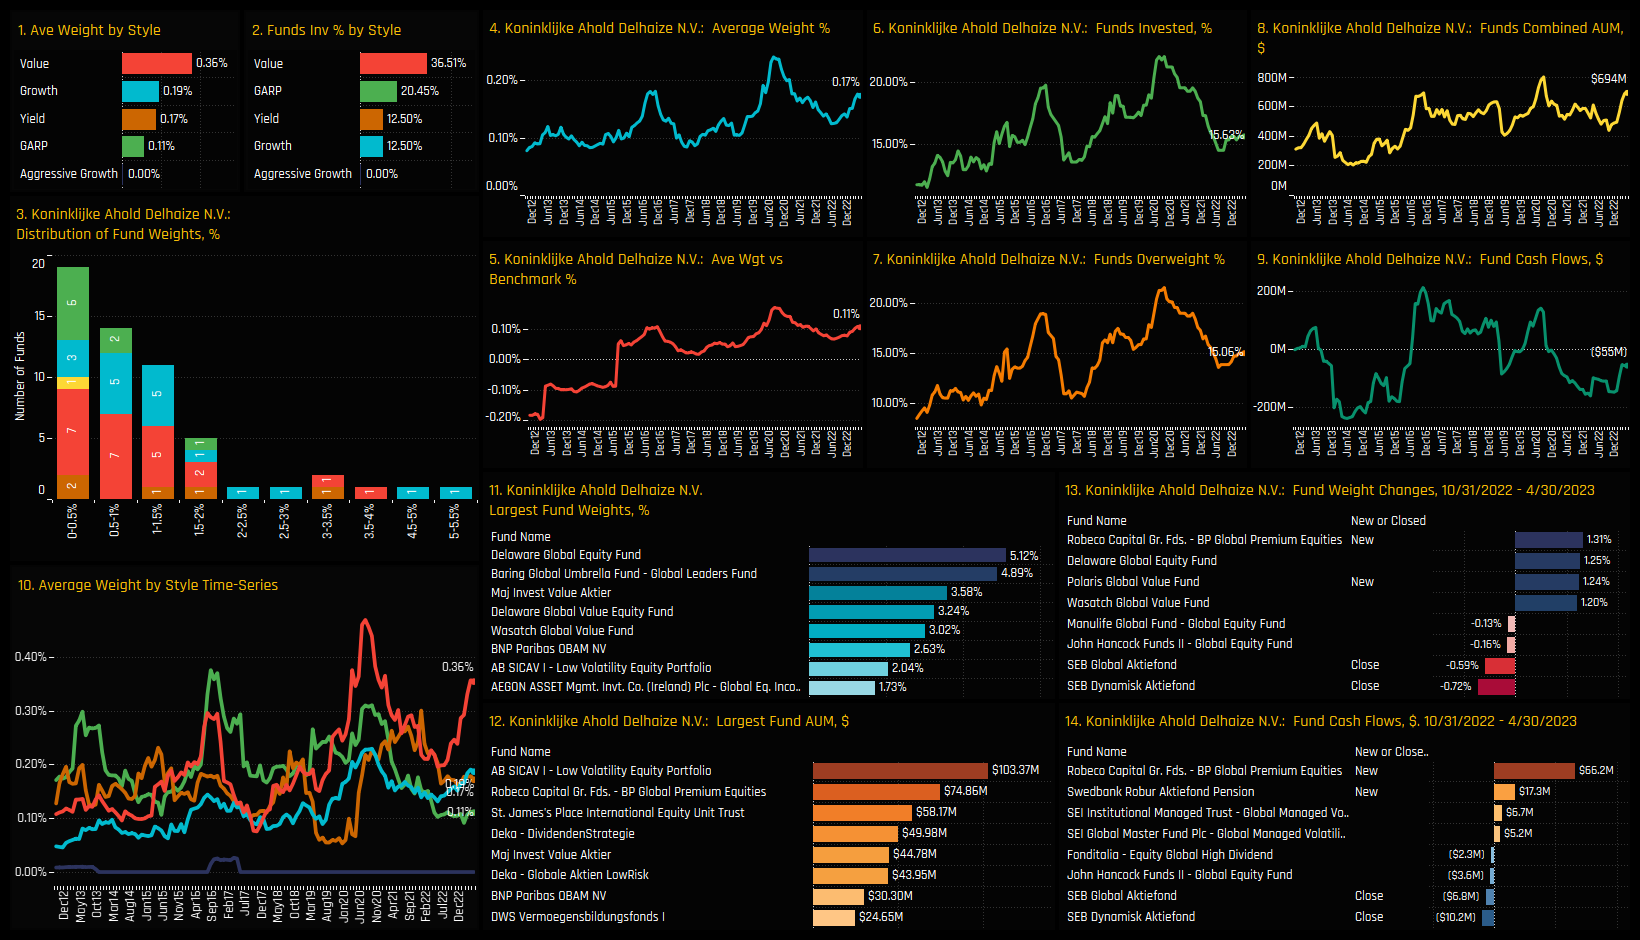
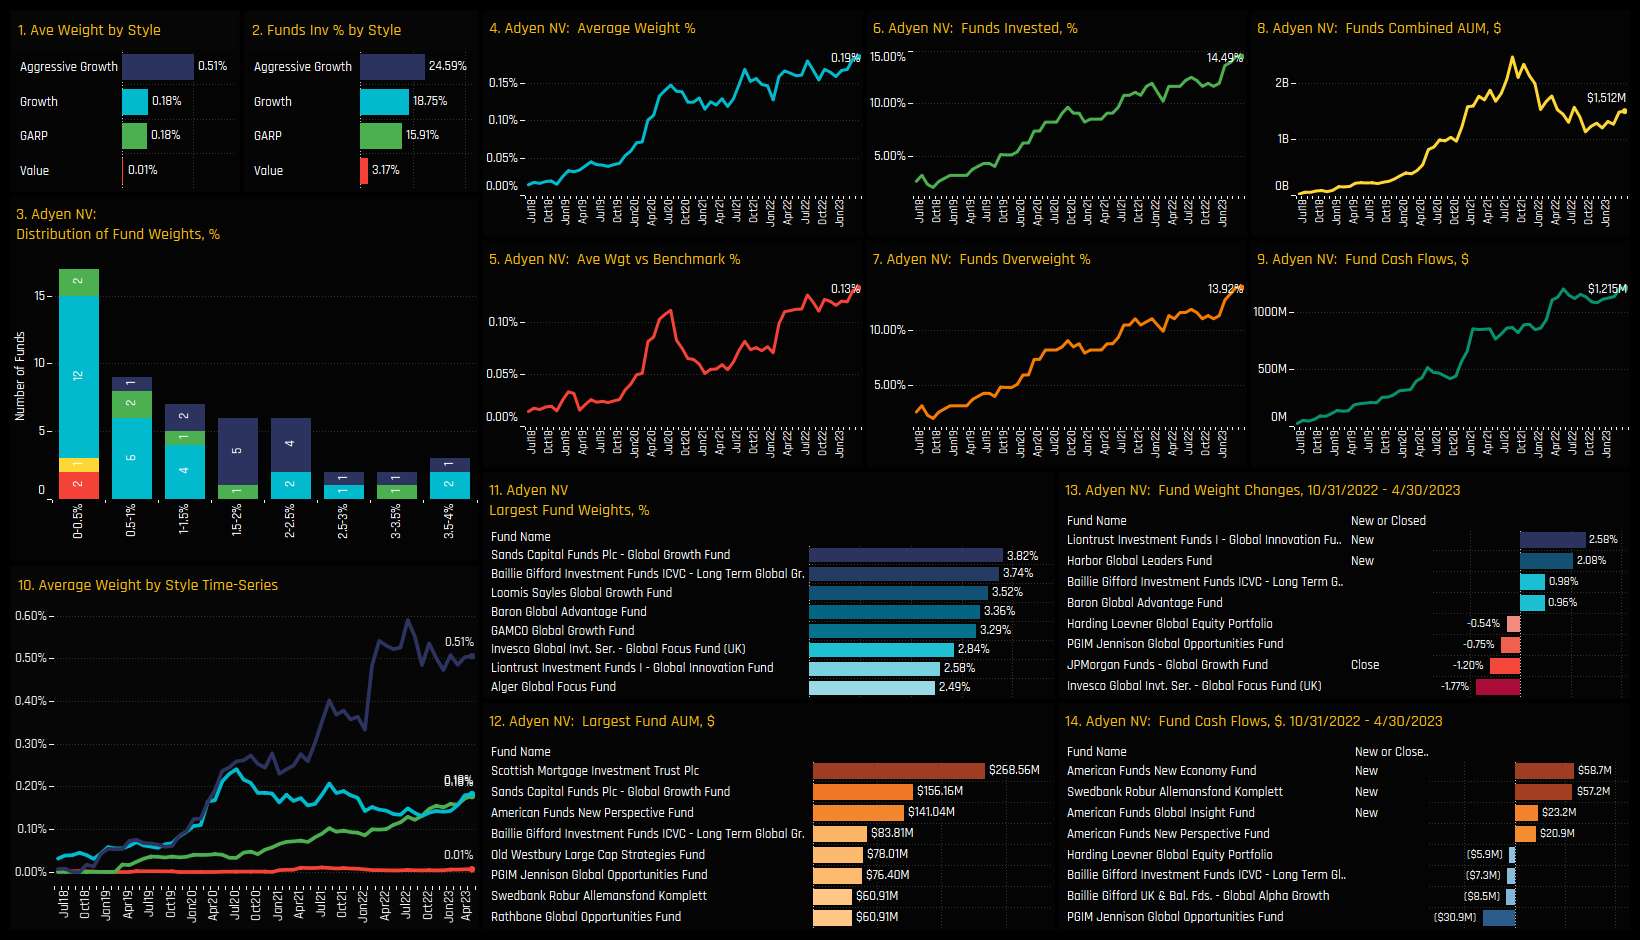
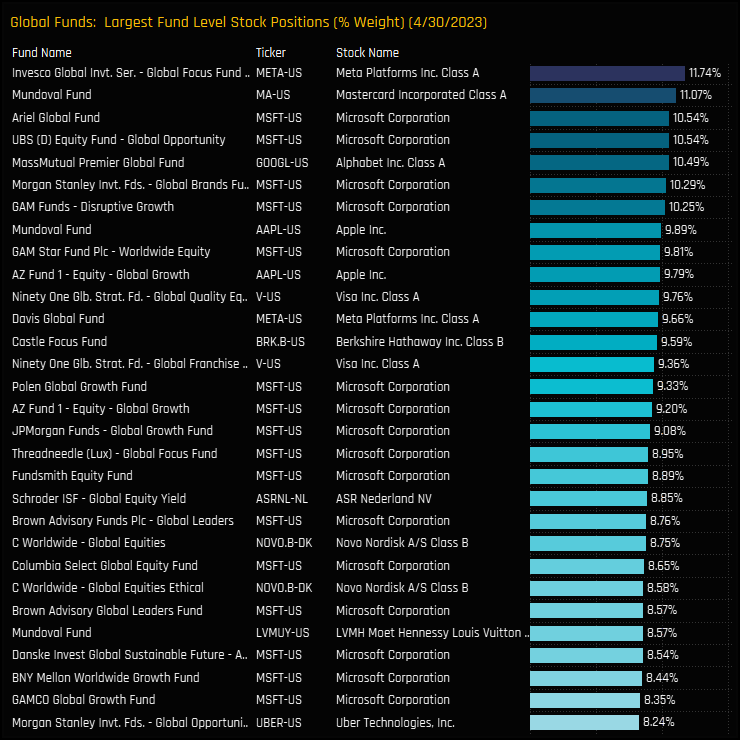
On a stock level, ASML Holdings is the dominant position by some distance, held by 41.5% of funds at an average weight of 0.76%, or overweight the benchmark by +0.33%. ASML also accounts for the bulk of the larger individual fund positions as shown in the bottom chart. We would group Wolters Kluwer, Koninklijke Ahold Delhaize and Adyen NV in a 2nd tier of stocks that share similar ownership profiles.
Stock activity over the last 6-months was skewed to the buyside, but not exclusively so. Ownership increases in Adyen NV and ASML Holding NV were the driving force behind the record Netherlands exposure, but managers scaled back holdings to both Aegon N.V and Koninklijke Philips. On a stock level, Schroders Global Equity Yield’s new position in ASR Nederland NV was the stand out.
Conclusions & Links
The net effect of these moves is to thrust The Netherlands up the pecking order of country allocations among active Global Equity funds, as shown in the chart set opposite. The Netherlands is now the 4th most widely held country allocation and the 3rd largest overweight versus the SPDRs MSCI ACWI ETF. Indeed, no other country has as many funds positioned overweight as The Netherlands, with 73.9% of managers positioned for benchmark outperformance.
On a stock level, there is decent depth to the investment picture. ASML Holdings is the dominant holding by a margin, but it only accounts for 28.5% of the total Netherland weight. A long list of 2nd and 3rd tier of companies, led by Wolters Kluwers, Koninklijke Ahold Delhaize and Adyen prove that this isn’t a one company opportunity.
Global funds should be aware that peer group positioning and benchmark positioning have diverged in recent years. Whatever your Style, to be underweight The Netherlands today puts you in the clear minority.
Scroll down for stock profiles on ASML Holdings, Wolters Kluwers, Koninklijke Ahold Delhaize and Adyen. Click on the link below for an extended data report on Netherlands positioning among active Global funds.
For more analysis, data or information on active investor positioning in your market, please get in touch with me on steven.holden@copleyfundresearch.com
Investor Positioning Report — Copley Fund Research Ltd · Last updated: July 2026 · Registered in England and Wales
1. Who we are
Copley Fund Research Ltd provides proprietary institutional fund intelligence to listed companies and investor relations professionals. These terms govern every purchase of an Investor Positioning Report. By completing a purchase you confirm you have read, understood, and agreed to these terms in full.
2. What you are purchasing
The Investor Positioning Report is a bespoke PDF report mapping the institutional fund universe around your stock. It covers current investors, past investors, competitor investors, and white space investors. Every report is built from scratch for the specific company ordered and is not a standardised or templated product.
3. Delivery and process
Following payment or invoice issuance, Copley Fund Research will contact you within one working day to agree your competitor set. Production begins once the competitor set is confirmed in writing. The completed report will be released to you within 48 hours of production starting, provided payment has been received in full; where payment is outstanding, the report will be withheld until payment clears. If the requested company falls outside our covered fund universes, or a competitor set cannot be agreed, Copley Fund Research will issue a full refund or cancel the outstanding invoice.
4. Competitor set agreement
The competitor set is agreed with you in writing prior to production, and the report is built to that agreed specification. Requests to amend the competitor set after delivery, based on a change of preference rather than an error, may be treated as a new order.
5. Refund policy
Because each report is produced individually for your company, orders are non-refundable once production has begun, except as set out in clauses 3 and 5a below. By purchasing, you agree not to dispute the charge with your card provider on the basis that the service was not as described, provided the report has been delivered to the agreed specification or corrected under clause 5a.
5a. Quality remedy
If a delivered report contains a material error caused by Copley Fund Research — for example, an incorrect company analysed, a competitor omitted from the agreed set, or content missing from the specification in clause 2 — Copley Fund Research will correct and redeliver the report at no additional charge, within a reasonable timeframe. This is your sole remedy for such errors.
6. Data and accuracy
All fund positioning data in the report reflects holdings as disclosed at the most recently available reporting date at the time of compilation. The timing of fund holdings disclosures is determined by regulatory requirements applicable to each fund and is outside the control of Copley Fund Research Ltd. This data may not reflect current fund positions. Copley Fund Research takes reasonable care to ensure accuracy but makes no warranty, express or implied, as to the completeness or current accuracy of the underlying data — though this does not affect the quality remedy in clause 5a for errors in how that data was analysed or presented. Past fund positioning is not indicative of future fund behaviour or investment decisions.
7. Not investment advice
The Investor Positioning Report is produced for investor relations intelligence purposes only. It does not constitute investment advice, financial advice, or a recommendation to buy, hold, or sell any security. The data reflects historical fund positioning and must not be relied upon as a prediction of future fund behaviour or investment decisions. Copley Fund Research Ltd is not authorised or regulated by the Financial Conduct Authority for the provision of investment advice.
8. Permitted use and confidentiality
The report is licensed for internal use by the purchasing organisation only. You may share it with employees and directors of your organisation. You may not: reproduce, redistribute, publish, or resell the report or any part of it; share it with any third party outside your organisation without prior written consent; use the fund or portfolio manager names contained in the report to approach those individuals on behalf of Copley Fund Research or in a manner that could damage Copley Fund Research's relationships with those funds; or use the data for any purpose other than your own investor relations strategy. The data, analysis, and methodology contained in the report are the intellectual property of Copley


