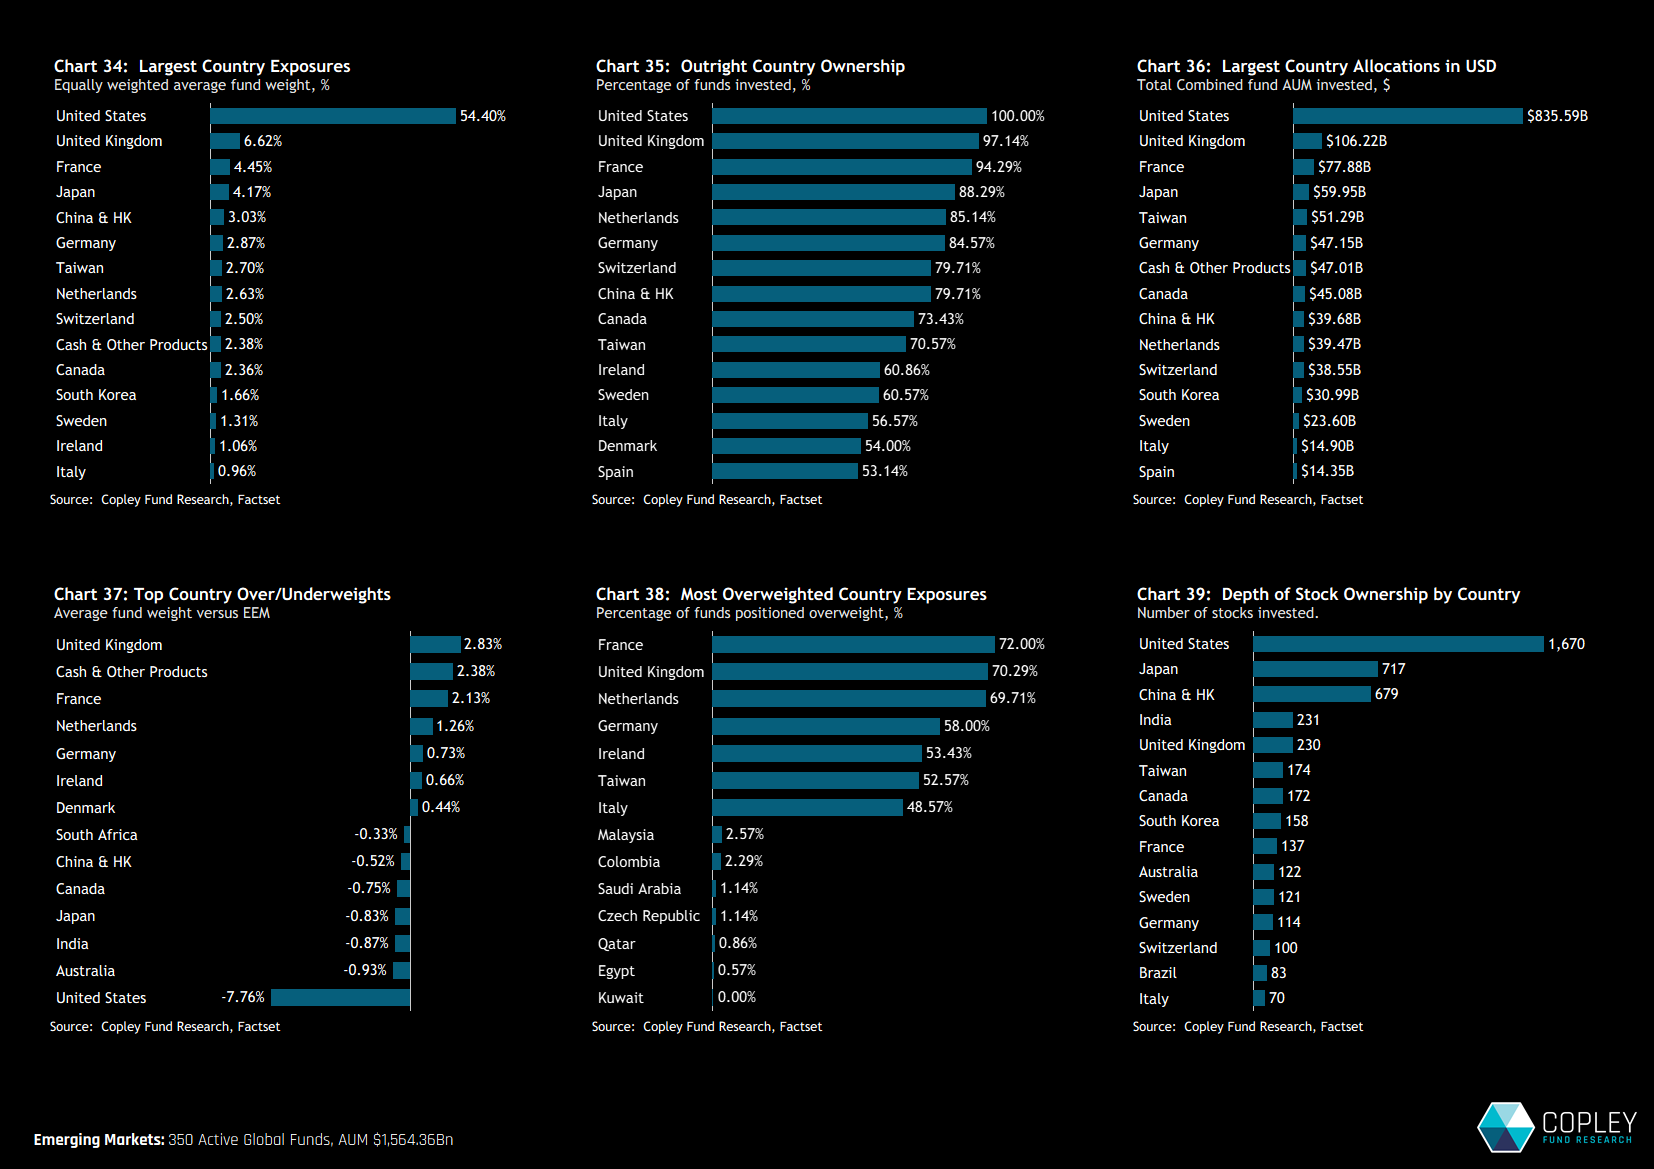
Global active positioning remains structurally concentrated in North America and Developed Europe, but 2025 saw a clear rotation at the margin. Managers remain meaningfully underweight the US despite its 54% average allocation, reallocating capital selectively toward Asia’s largest markets — particularly Taiwan, China and South Korea — while India and Indonesia have lost conviction.
Europe continues to command structural active backing, with 82% of funds overweight despite flat absolute allocations. At the sub-regional level, global portfolios remain a two-horse race: North America and DM Europe account for over 80% of total capital, while EM exposure remains concentrated in the “Big Four.”
Sector positioning is stable but concentrated. Technology dominates at 27% of the average portfolio, followed by Financials and Industrials. Energy remains the clearest consensus underweight. Long-term trends show structural divergence in Technology and Industrials, with Industrials now at record exposure.
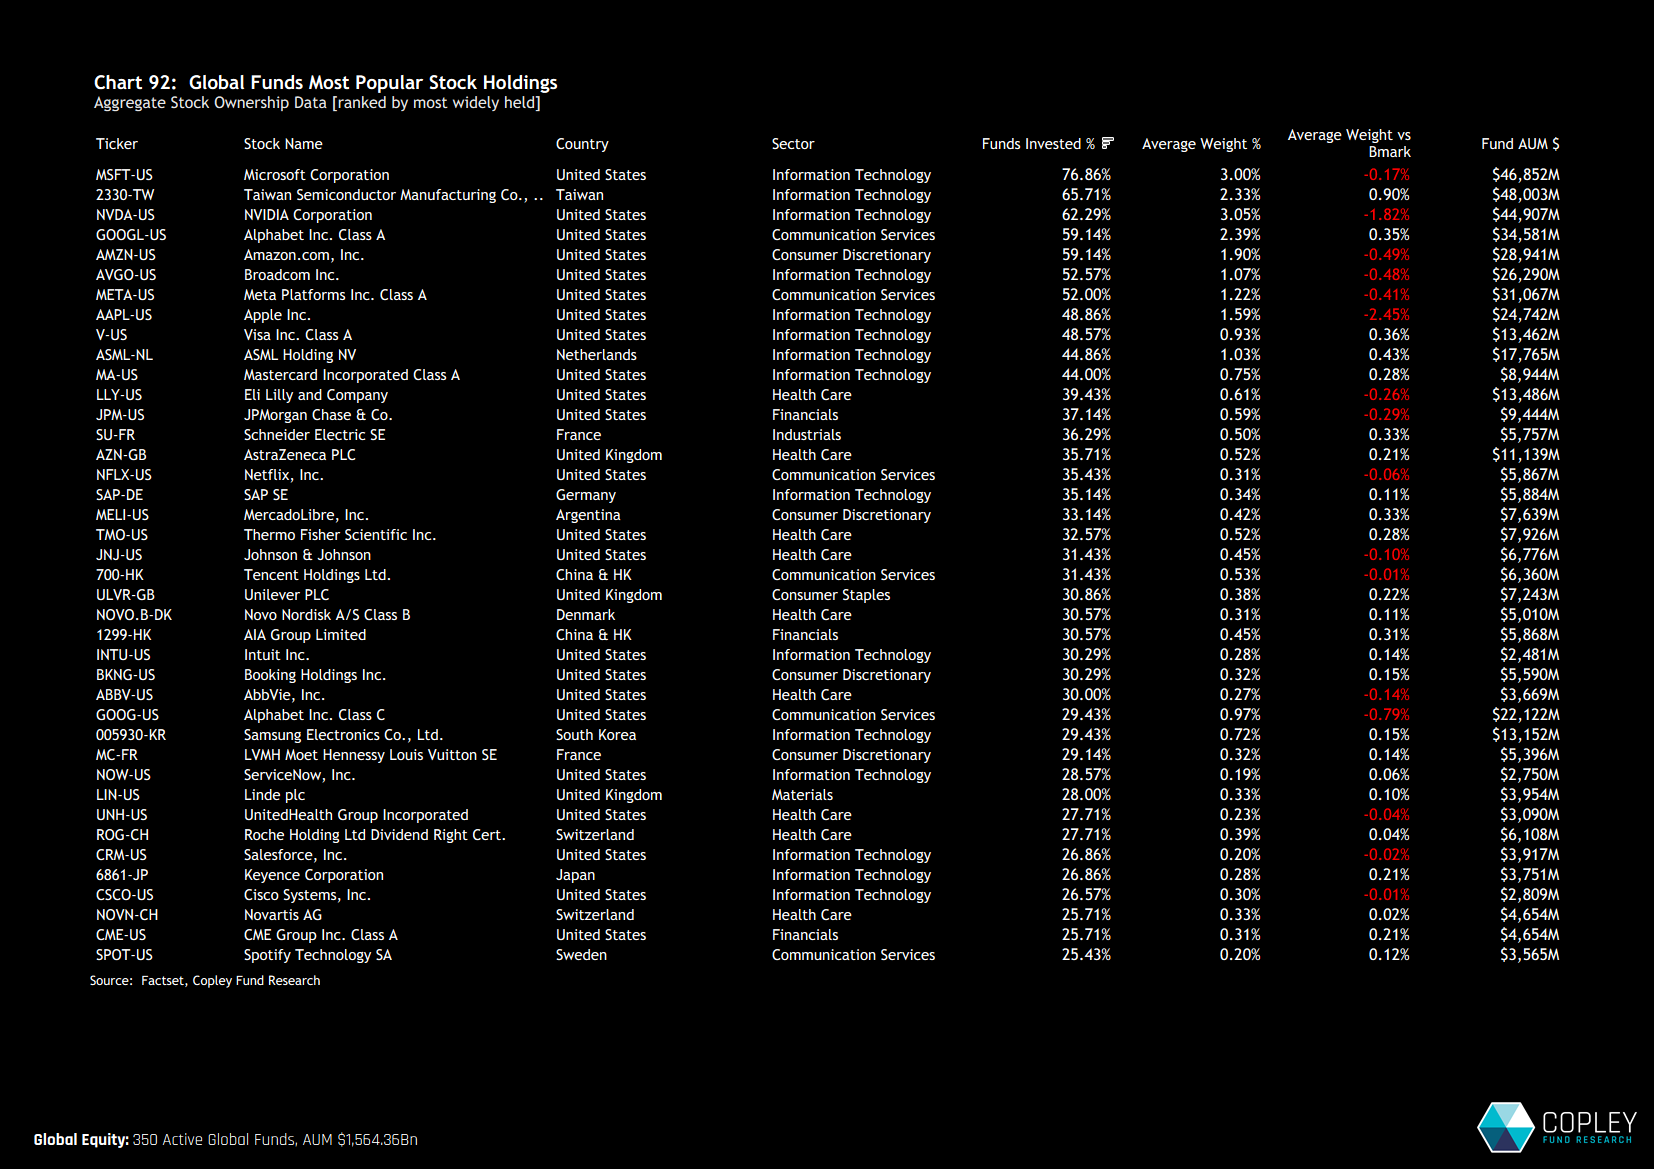
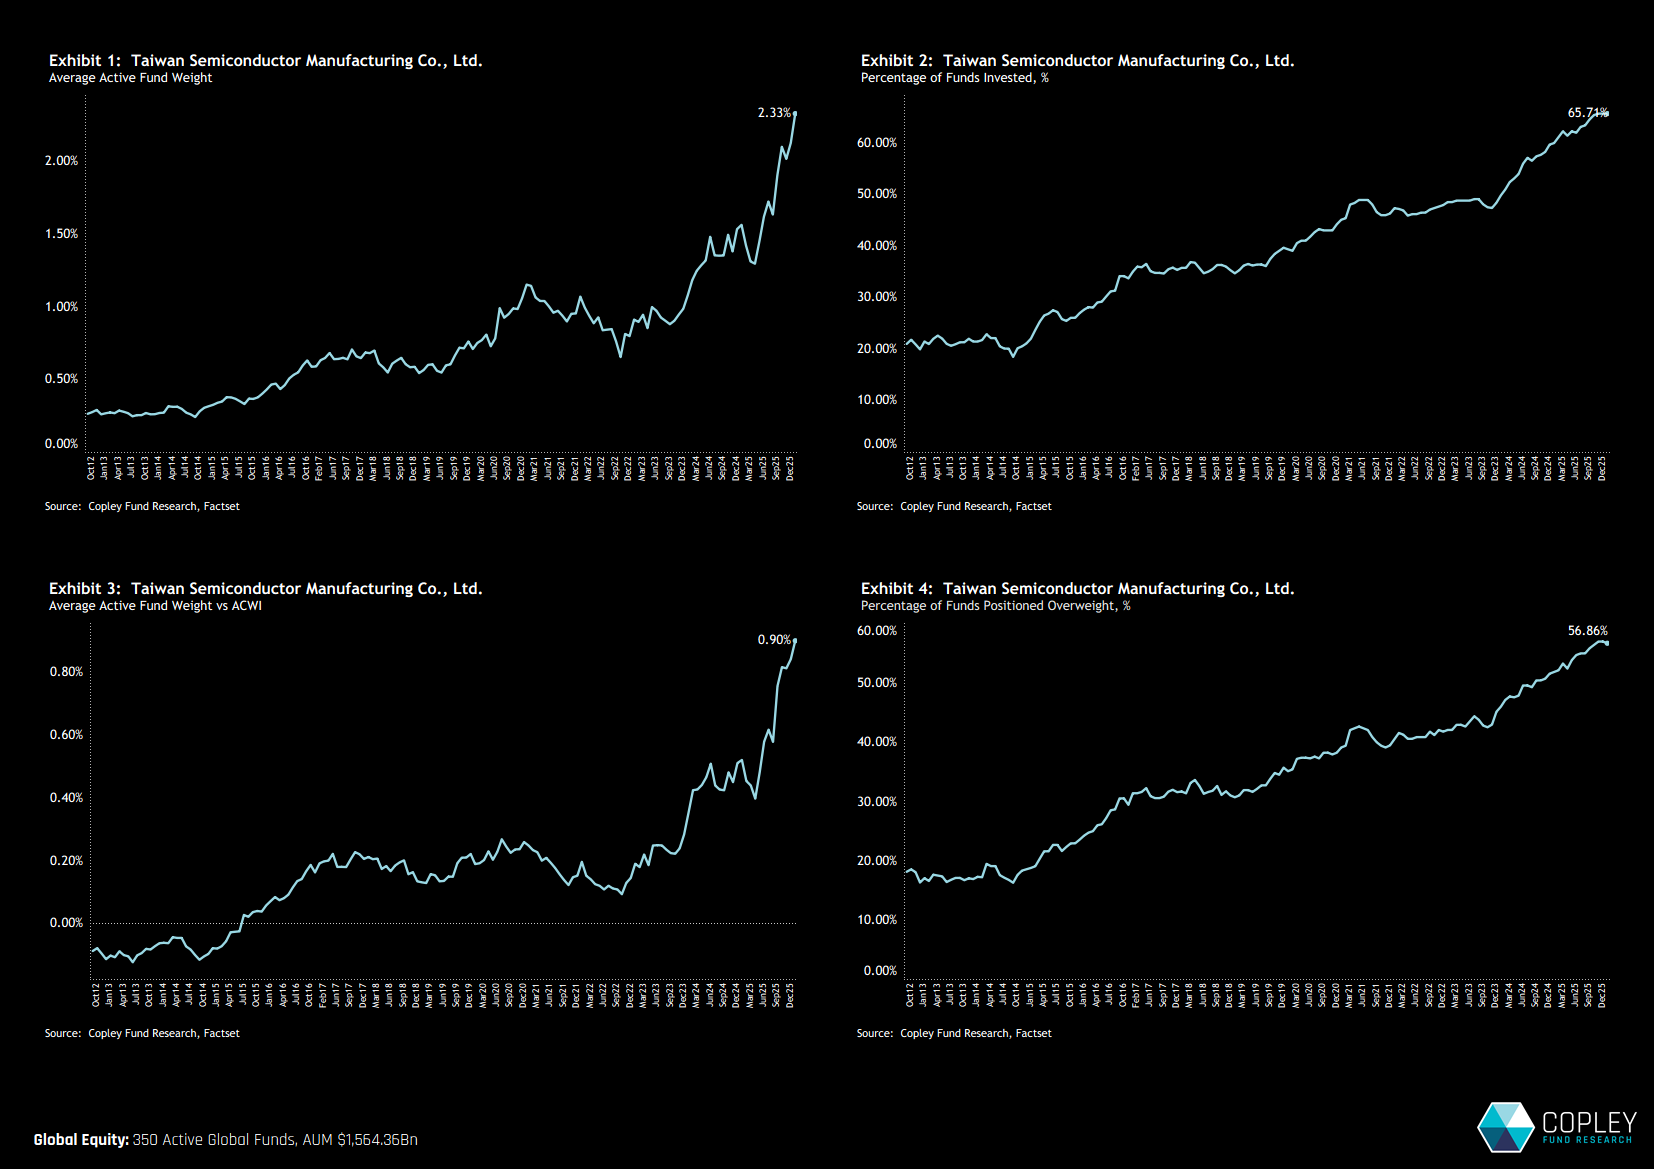
At the stock level, conviction is increasingly concentrated in Technology, with eight of the eleven most widely held stocks in the Technology sector. TSMC is the defining positioning story: ownership has surged to a record 65.7% of funds at a +0.9% overweight, making it the second most widely held stock in global active portfolios.
Regionally, flows reinforce this concentration. Broadcom, Siemens Energy and Tencent lead ownership gains, while legacy defensive and healthcare names — including Novo Nordisk and UnitedHealth — have seen sharp reductions. Across regions, capital is consolidating into a narrower set of perceived structural winners.
Entering 2026, global active portfolios are characterised by persistent US underweights, renewed but selective engagement with Asia’s largest economies, record exposure to Industrials, and increasingly concentrated conviction in mega-cap technology leaders.
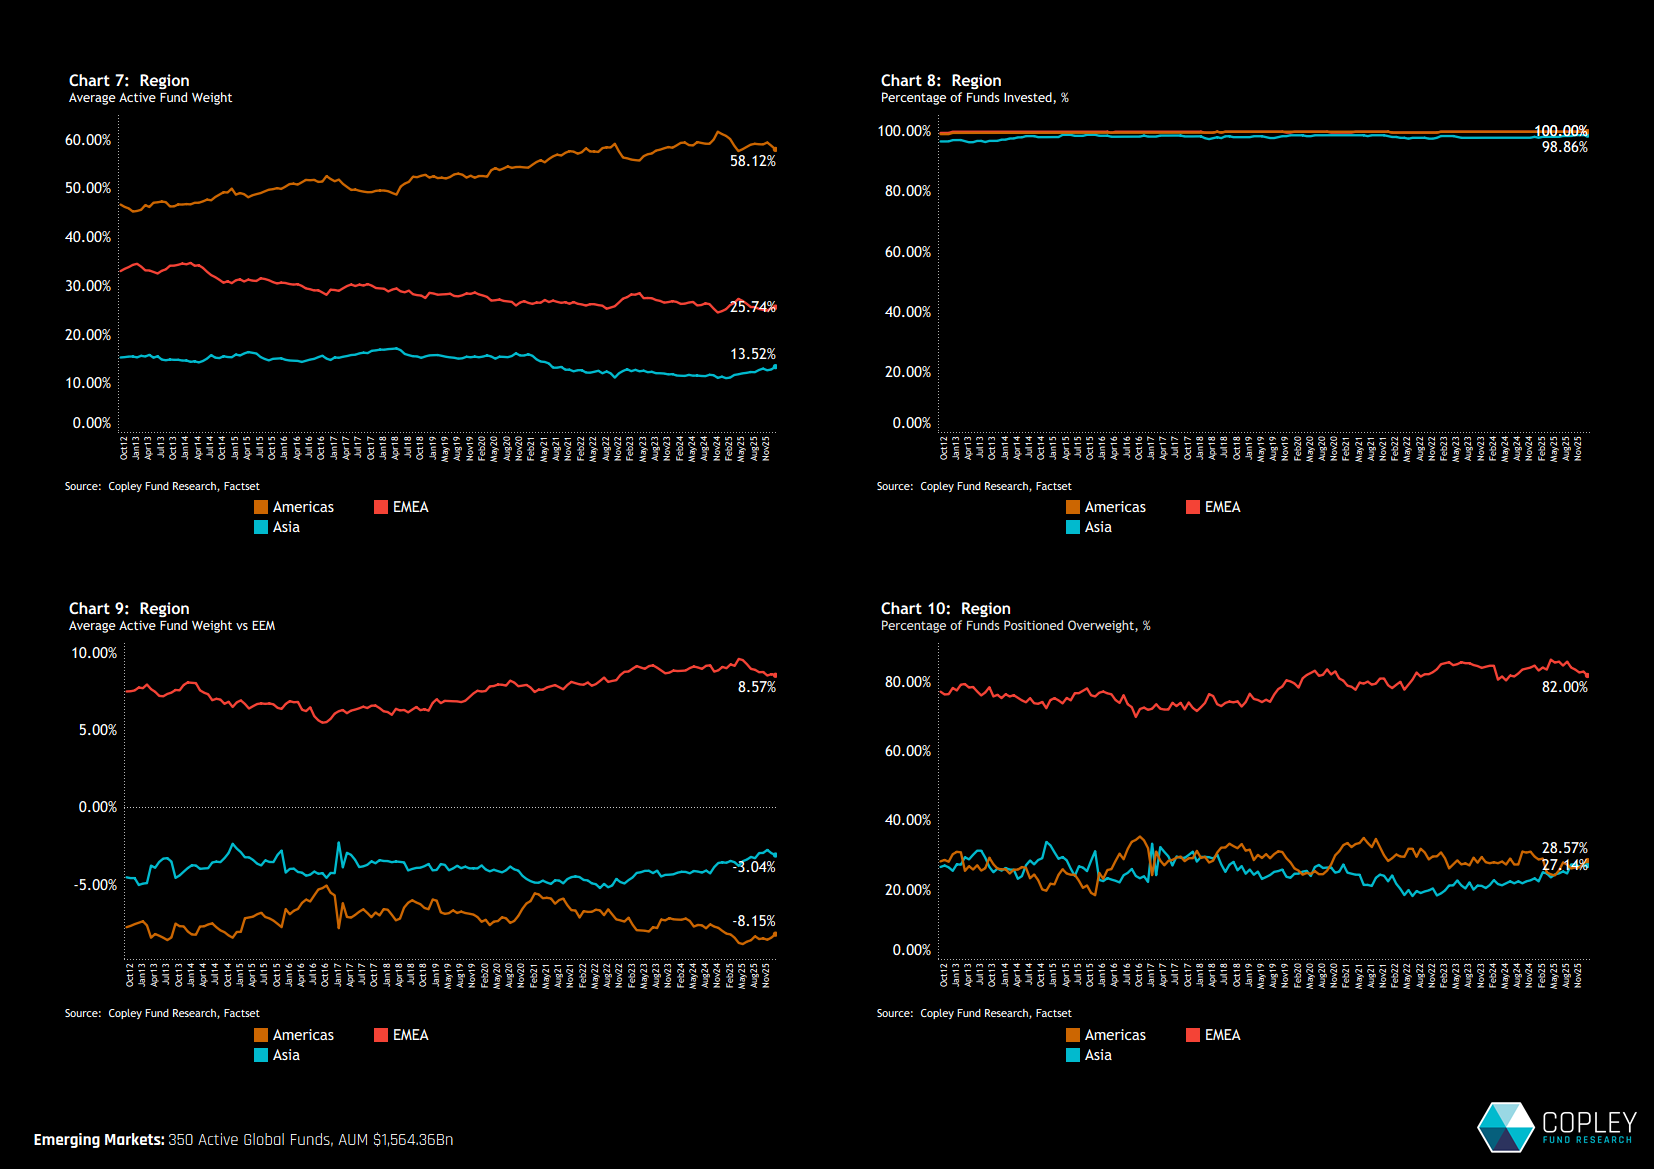
Regional Positioning Long-term regional positioning among global active managers remains broadly intact. North America continues to dominate allocations in absolute terms; however managers persistently run a meaningful underweight relative to the SPDR ACWI ETF. Asia remains the smallest regional allocation overall, although exposure has gradually increased over the past 24 months. That said, a similar proportion of funds remain underweight Asia as is the case with North America, suggesting managers are selectively adding exposure rather than expressing broad regional conviction.
European allocations, meanwhile, have struggled to gain meaningful traction. Absolute allocations have flatlined, while overweight positioning has moderated from prior highs. However, it is still clear that within actively managed global portfolios, Europe commands a structurally larger share of capital than it does in the benchmark. Notably, 82% of funds are positioned overweight relative to the index — reinforcing Europe’s continued importance as an active opportunity set.
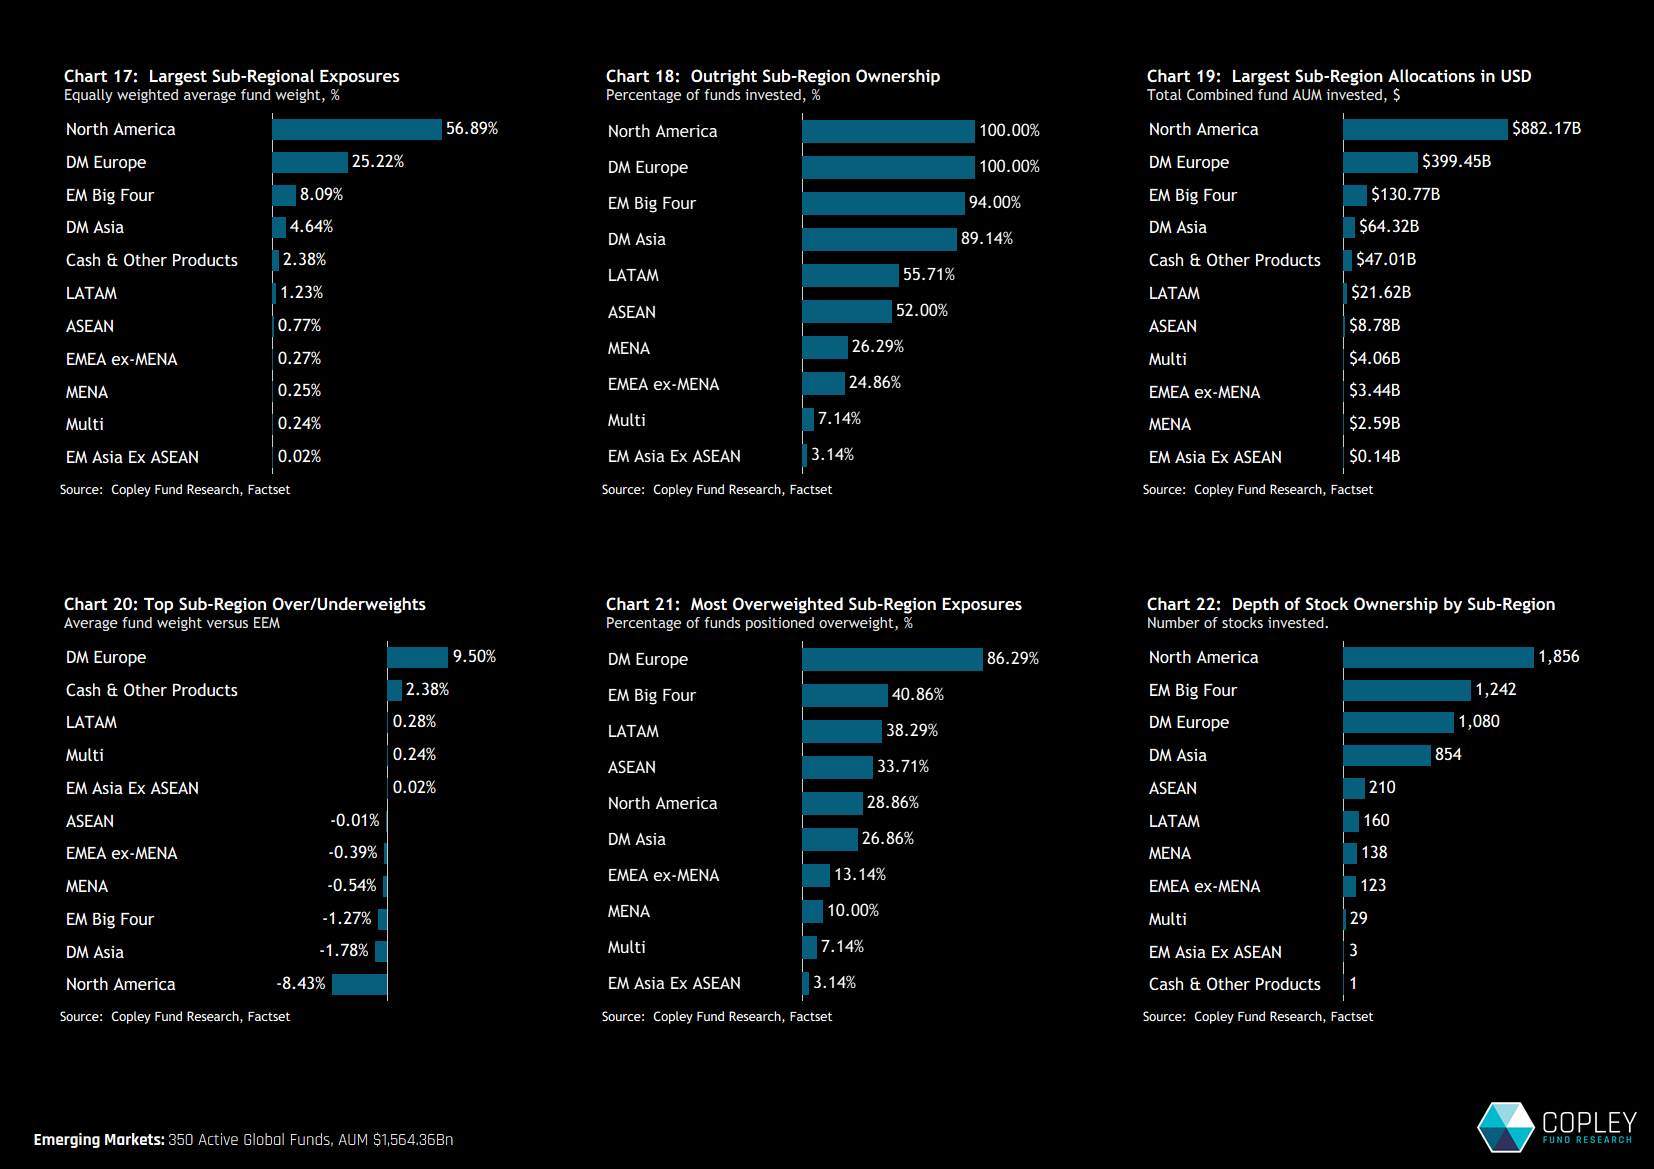
Sub-Region Snapshot Breaking this down further, global fund exposure remains a two-horse race, with North America and Developed Market Europe accounting for 82.1% of total allocations. Within Emerging Markets, the “big four” — China, South Korea, Taiwan and India — dominate positioning, each with average weights of 8.1%.
At the sub-regional level, active positioning shows a clear underweight to North America, offset by a similar overweight to DM Europe. Both DM and EM Asia are held underweight, offsetting net cash balances of 2.38%. In terms of outright ownership, EM breadth remains limited: just 56% of funds hold LATAM exposure, 52% ASEAN and 25% MENA.
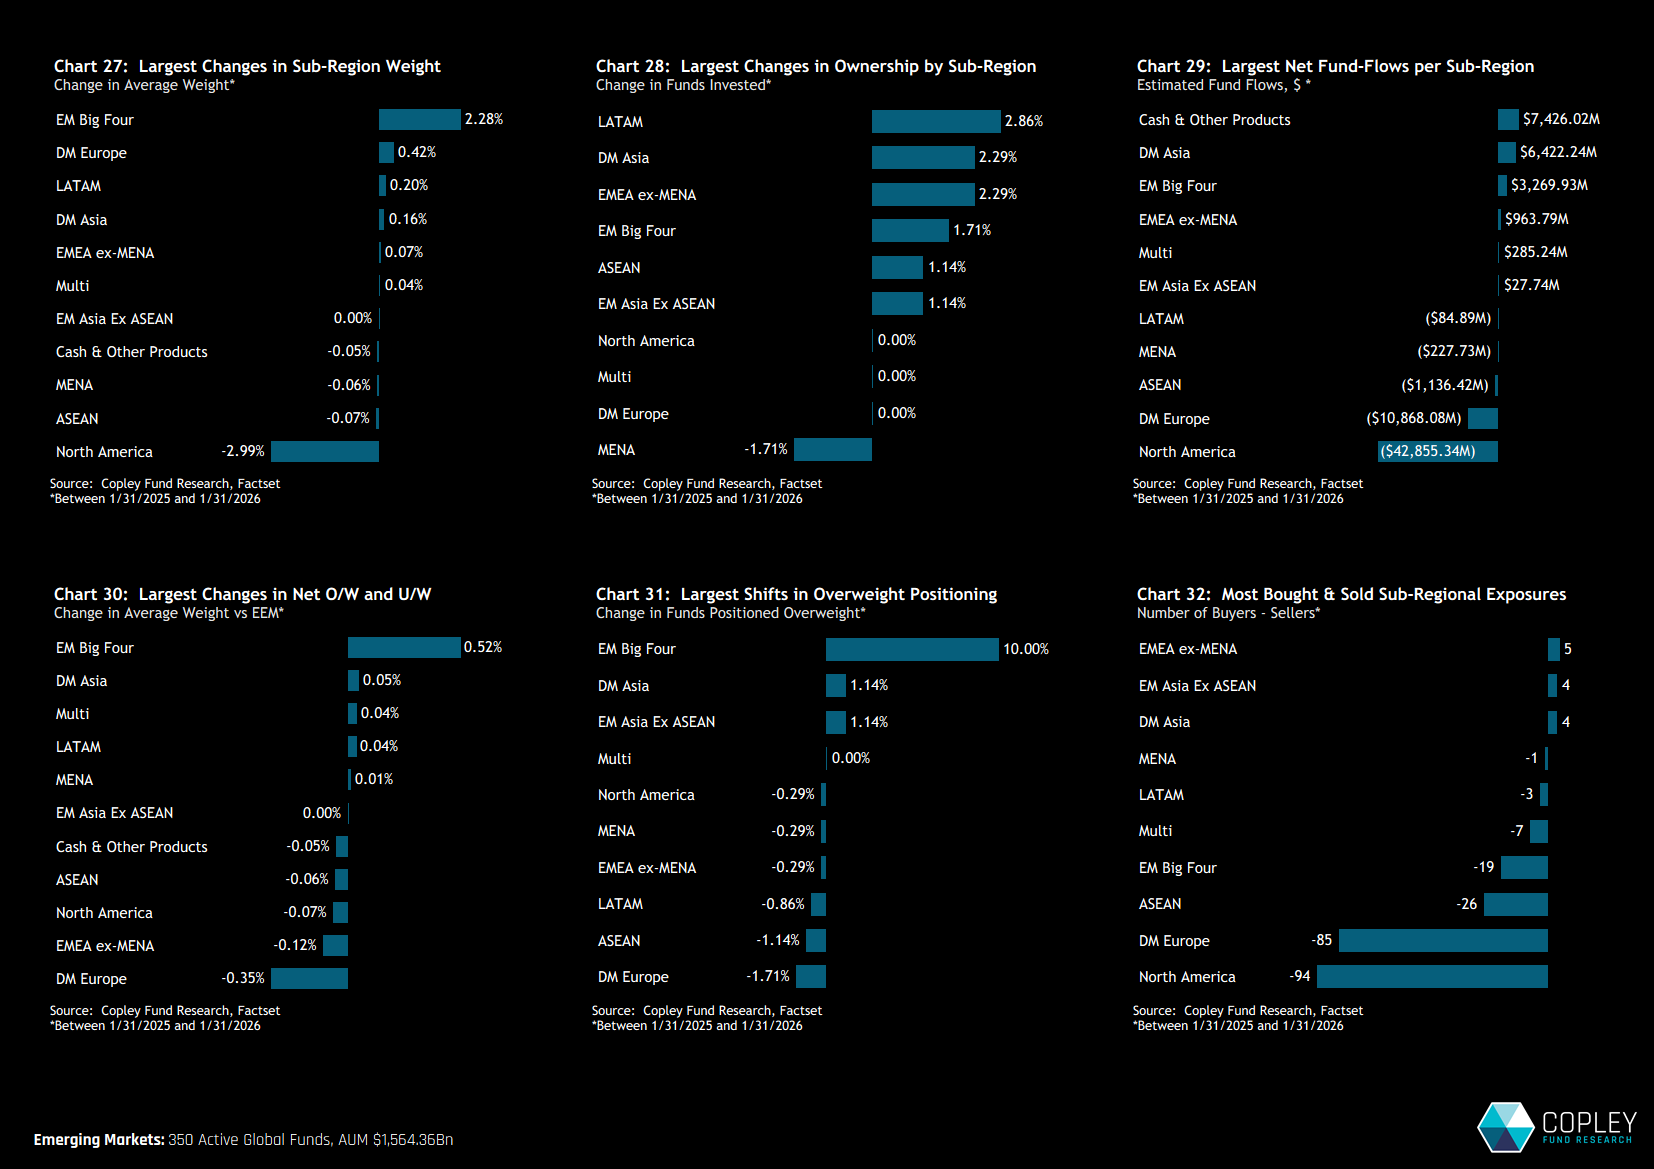
Sub-Region Rotation Aggregate positioning shifted meaningfully over the past 12 months. Chart 27 highlights changes in average weights between 01/31/2025 and 01/31/2026, showing a clear rotation in exposure from North America toward EM’s Big Four. While price action has inevitably contributed, the active component of this move is evident.
Across the EM Big Four, most ownership measures strengthened: 10% of funds moved to overweight, net fund inflows totalled $3.2bn, and 1.7% of funds initiated new positions.
Country Positioning The US remains the dominant allocation, with an average weight of 54.4%. All funds are invested, representing $835bn of AUM across 1,670 companies. Despite active managers running a significant underweight of 7.76%, there remains a clear market-cap bias in allocations, with US equities accounting for more than half of assets in most global portfolios.
The UK and France are the key areas of active backing. They rank as the second and third largest allocations and are the most widely overweighted countries globally. The largest country overweights are concentrated in developed Europe, while Australia, India and Japan stand out as the primary underweights alongside the USA.
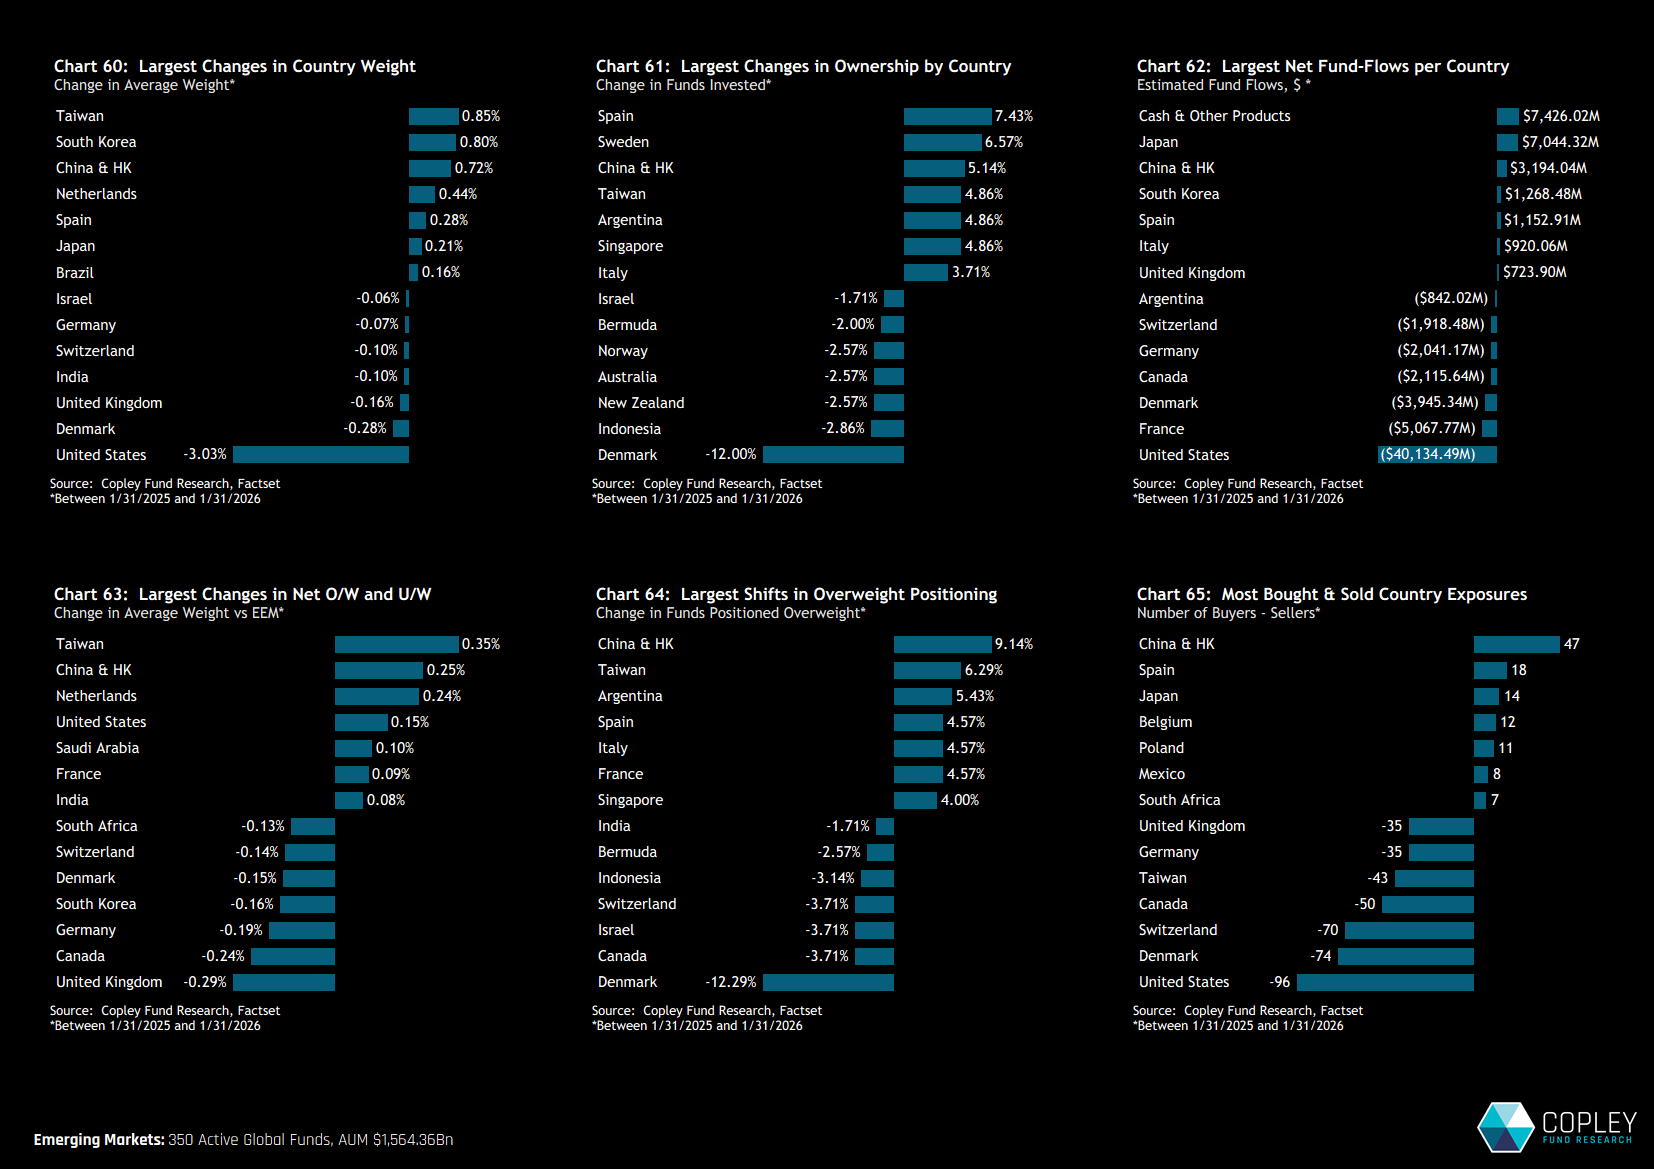
Country Rotation Country-level rotation over the past 12 months was led by a pronounced increase in exposure to Taiwan, South Korea and China & HK. Each recorded similar gains in average weight, with a combined 2.37% increase, offset by a 3% reduction in US allocations.
The shift toward EM’s three largest country exposures appears targeted in parts. 5.1% of funds initiated China exposure and 4.9% opened positions in Taiwan. South Korea’s increase appears more price-driven, with limited evidence of active repositioning. Taken together, the move represents a clear attempt to address low absolute allocations to Asia’s major economies. India, by contrast, fared less well, with declining exposure and moderate signs of active outward rotation.
Elsewhere, 7.4% of funds initiated exposure to Spain and 6.6% to Sweden. Denmark saw full exits from 12% of funds, while Indonesia experienced a deterioration in ownership, consistent with trends observed across the broader Global EM fund universe.
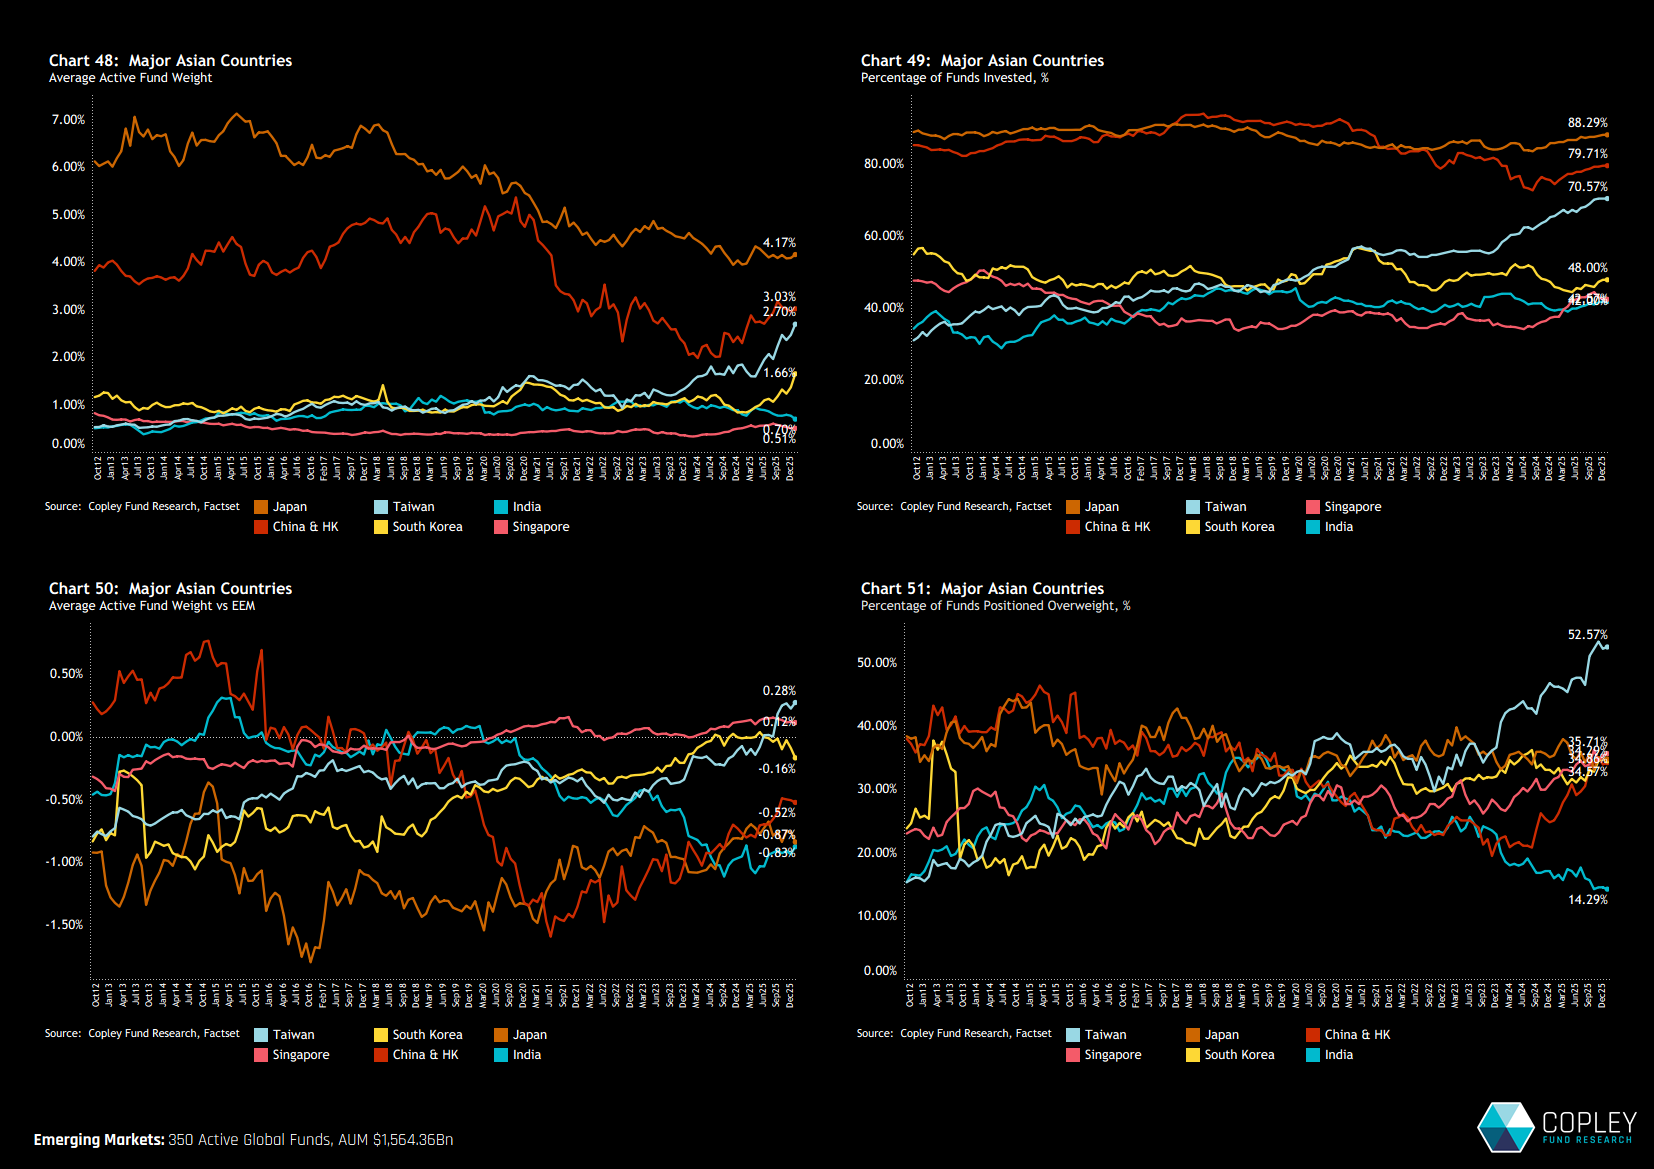
Asia Long-Term Dynamics The trajectory of Global fund ownership across Asia’s major economies is shown in the four charts below. The recovery is most pronounced in Taiwan, where average weights, funds invested, overweights and the percentage of funds overweight have all reached record highs — positioning has never been more bullish. China is also showing encouraging signs of recovery. All ownership measures have moved higher, although they remain below historical peaks.
South Korea lacks the same level of conviction. Absolute weights have risen, but without a comparable improvement in active positioning metrics. India has weakened materially. Just 14% of the 360 funds in our analysis are positioned ahead of the ACWI weight of 1.55%. Japan appears more stable. The declines seen between 2018 and 2022 have stabilised, with small but sustained increases in funds invested. However, there is little evidence yet of a decisive shift toward a more bullish stance.
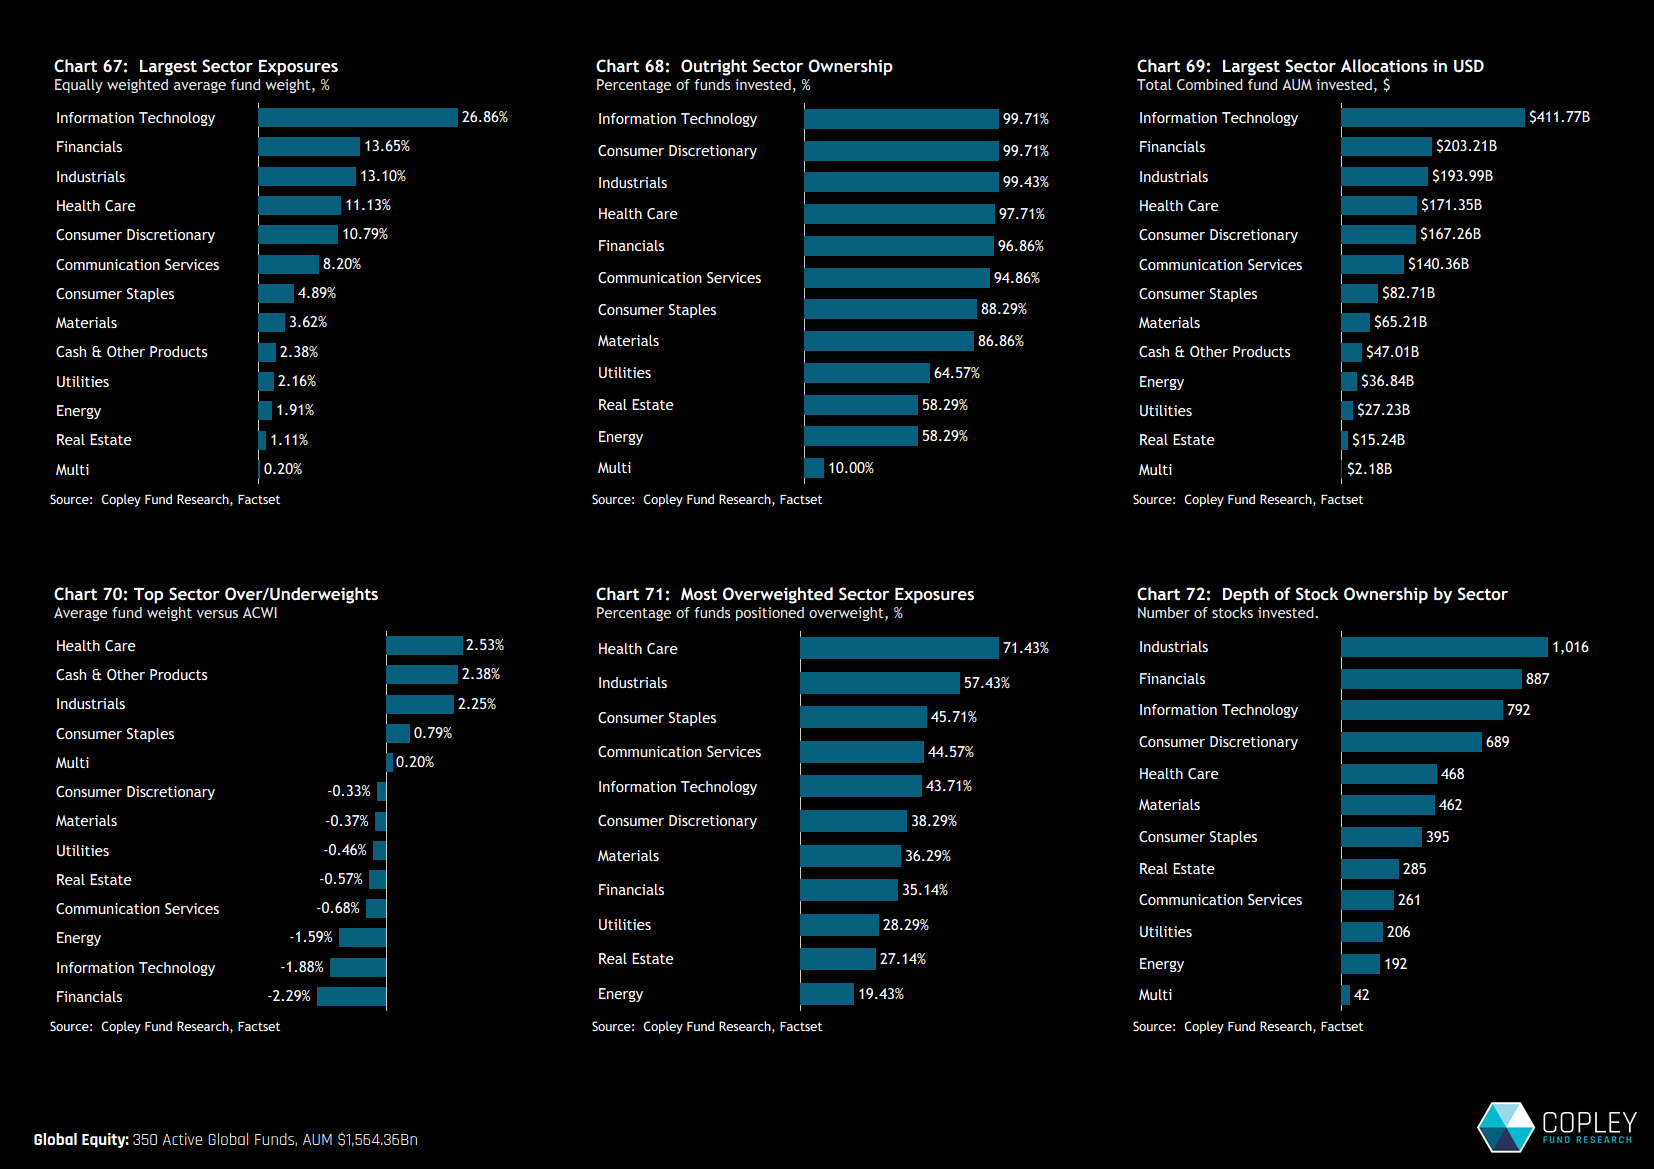
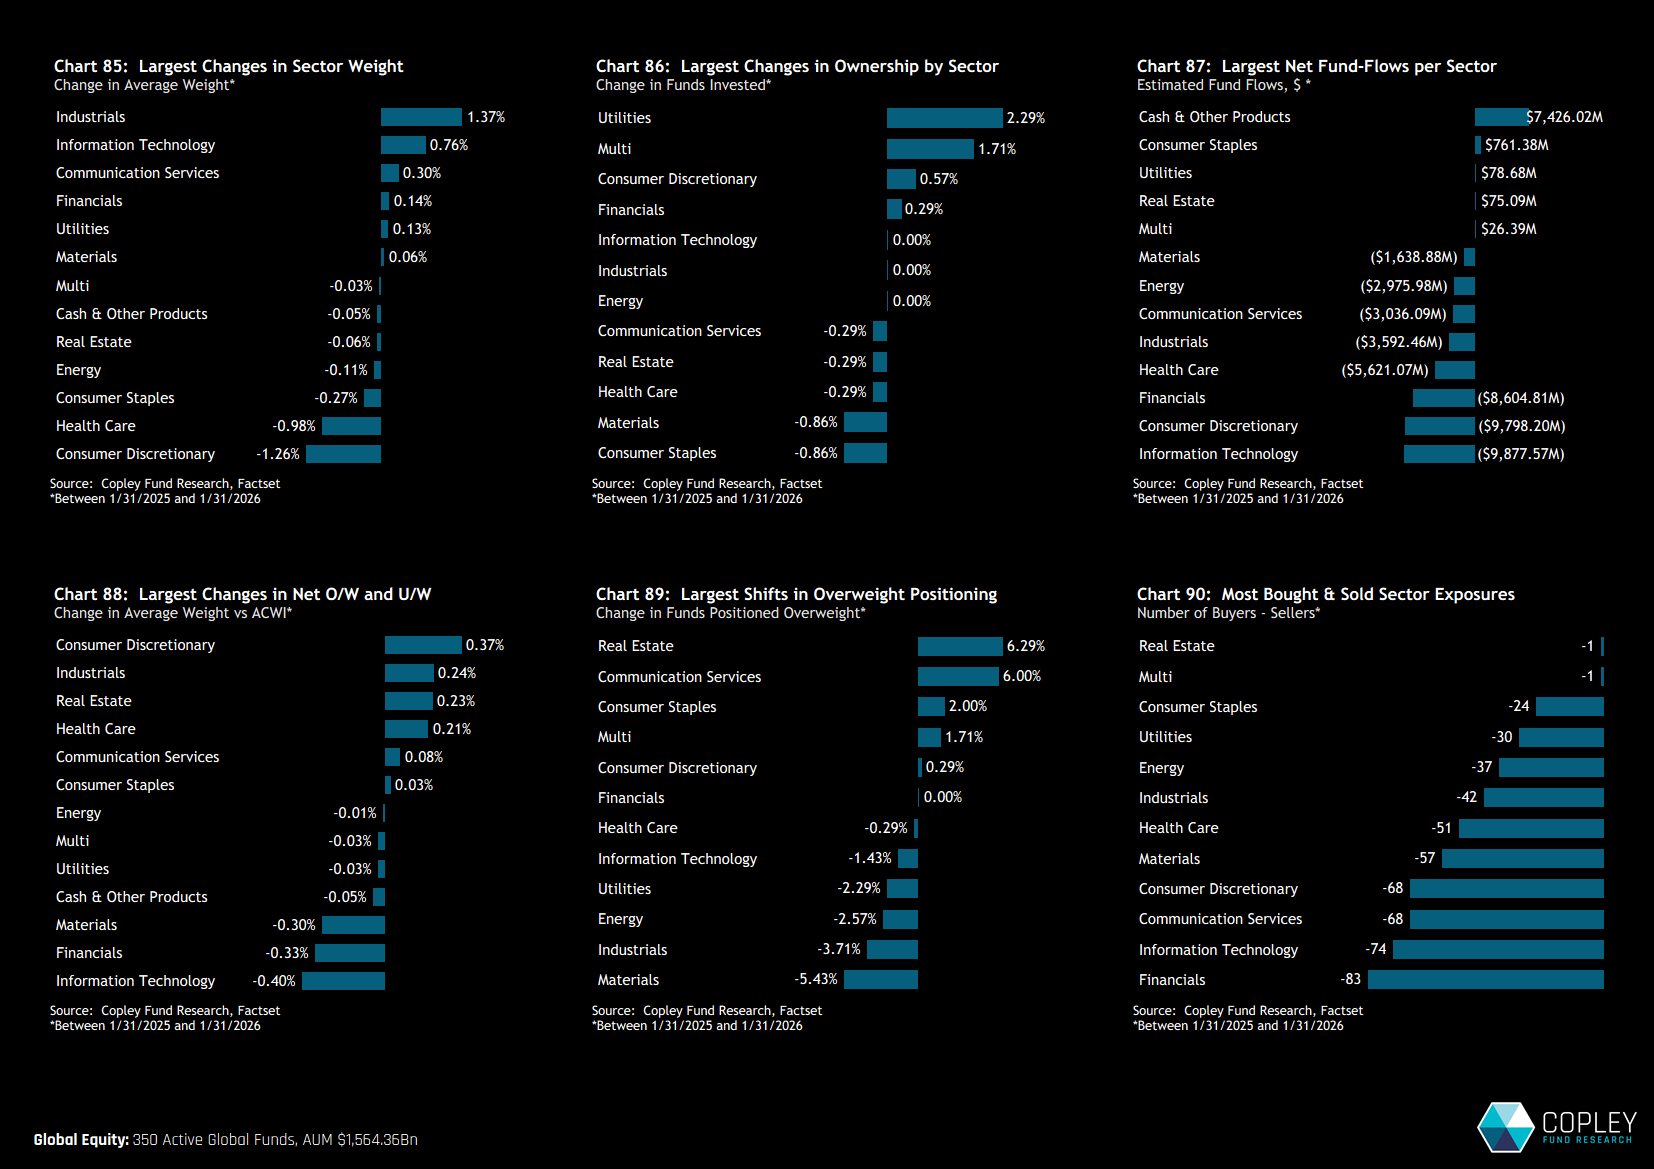
Sector Positioning Information Technology remains the dominant sector allocation, accounting for 26.86% of the average global fund. Financials and Industrials follow, each with just over 13%, completing the top three exposures.
Benchmark-relative positioning is far narrower than at the country level. The largest overweights are in Health Care and Industrials, at just over 2% above benchmark, offset by underweights in Financials, Technology and Energy of between 1.5% and 2.3%. Energy remains the clearest consensus underweight, with just over 80% of funds positioned below the ACWI index weight.
Sector Rotation. Sector exposures among Global strategies shifted modestly over the past 12 months, with no moves large enough to materially alter overall positioning. Industrials recorded the largest net increase in average weight, alongside Technology, while reductions were concentrated in Consumer Discretionary and Health Care.
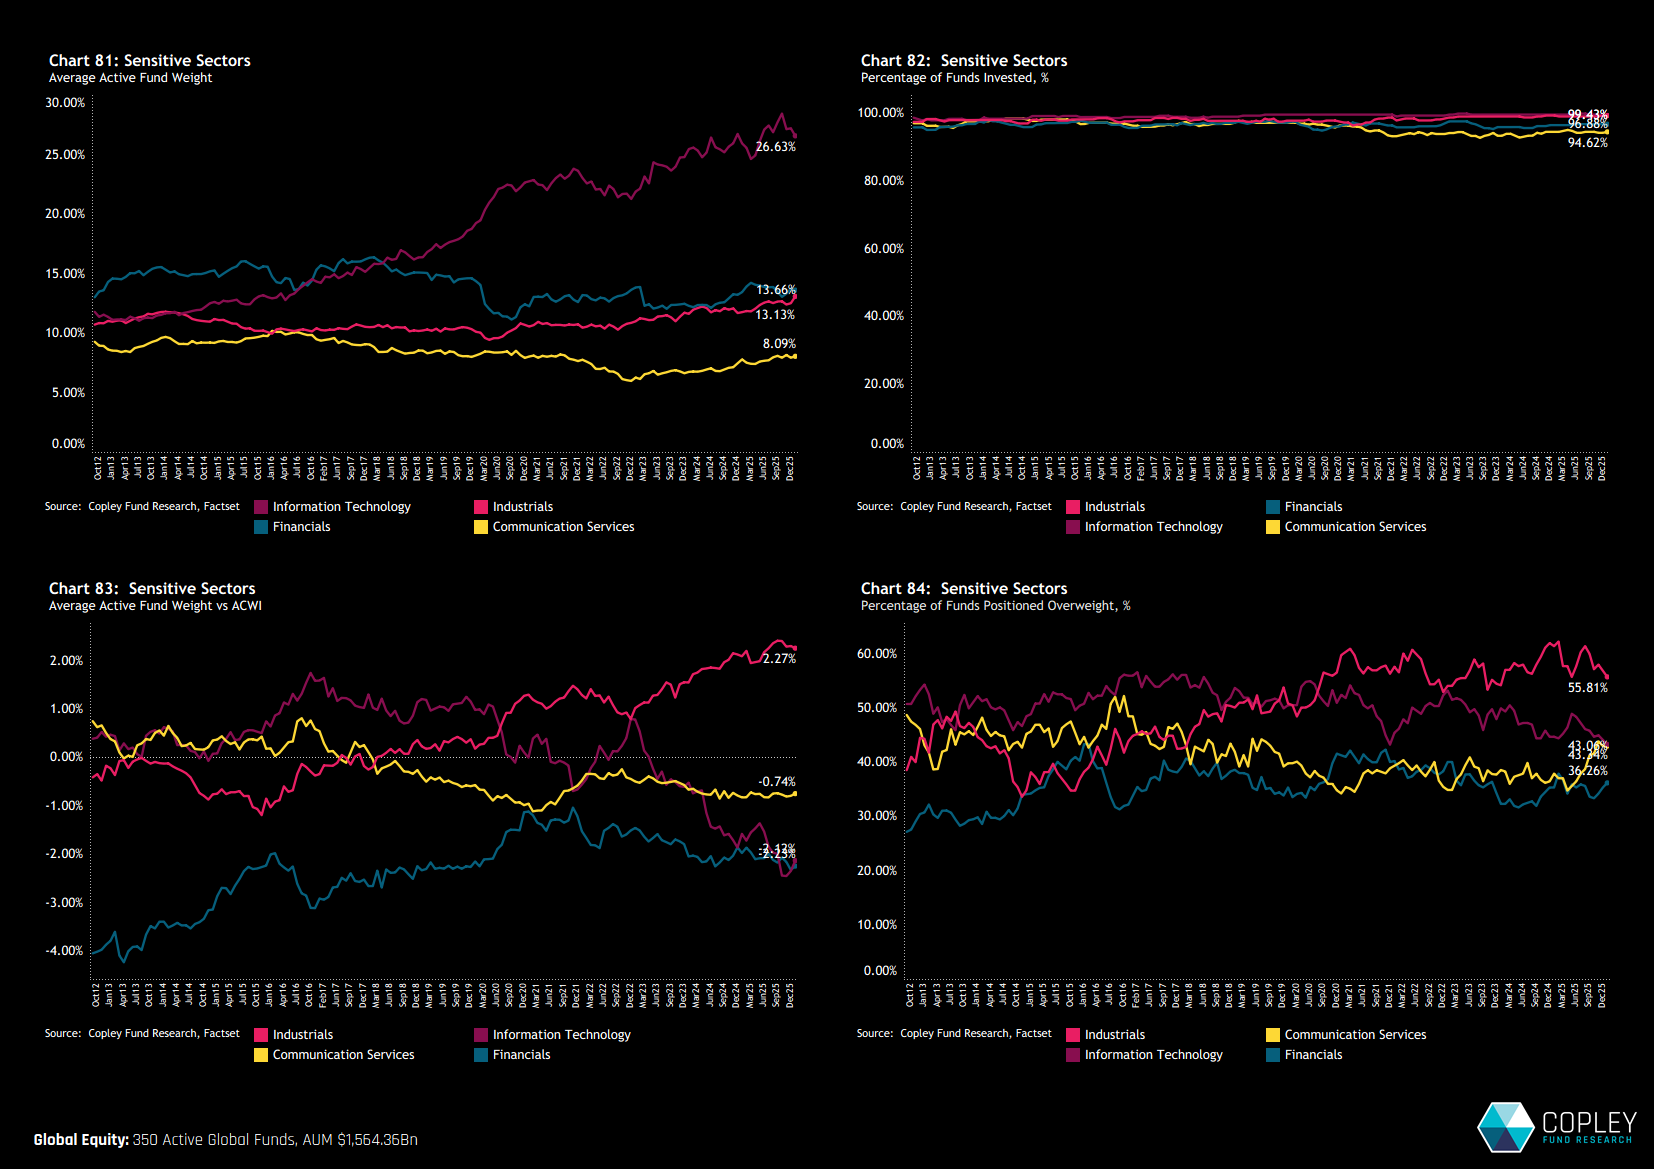
Sensitive Sectors – Long-Term Trends We highlight the four ‘sensitive’ sectors to illustrate how Technology has clearly diverged from the group over the past decade. Industrials also stand out, with record average exposure of 13.1% and a move to fresh highs in the benchmark overweight.
Stock Positioning Technology continues to dominate, accounting for 8 of the 11 most widely held stocks across global active portfolios. Microsoft remains by far the most widely owned, appearing in 77% of funds, with an average weight of 3% — broadly in line with the benchmark. TSMC is held by slightly more funds than NVIDIA, although NVIDIA carries the highest average weight globally at 3.05%.
From a benchmark-relative perspective, Apple, NVIDIA and Tesla are the key underweights, funding overweights in names such as TSMC, ASML and Visa.
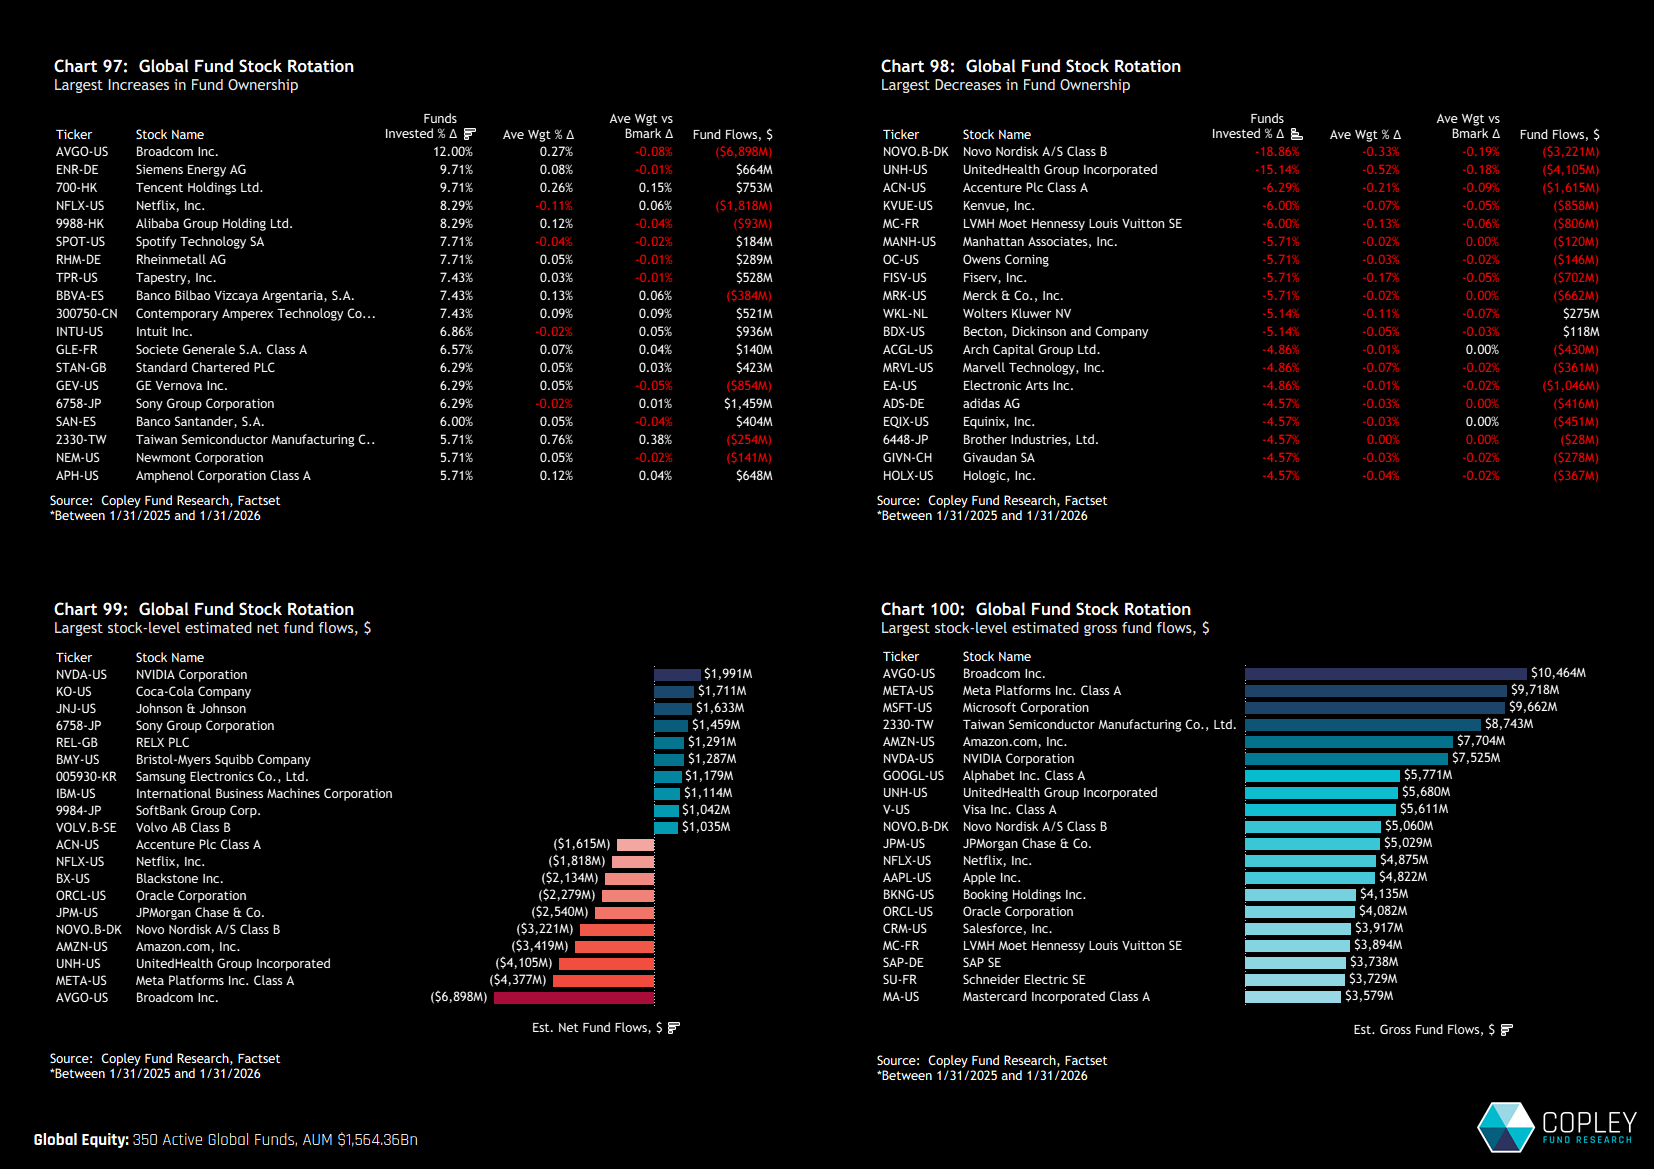
Stock Rotation There have been several notable shifts in ownership among global companies over the past 12 months. Broadcom leads the gains, attracting investment from an additional 12% of funds. Siemens Energy and Tencent Holdings follow, each seeing ownership increase by 9.7%. There were also meaningful increases in fellow Chinese large caps, including Alibaba Group Holding and Contemporary Amperex Technology.
On the negative side, Novo Nordisk and UnitedHealth Group saw the most significant declines, with ownership falling by 19.3% and 15.6% of funds respectively.
TSMC – Setting New Records TSMC ownership across Global funds has surged to a record high, with 65.7% of managers now holding the stock at an average +0.9% overweight versus ACWI — an extraordinary build that has propelled it to the second most widely owned company in the global active universe.
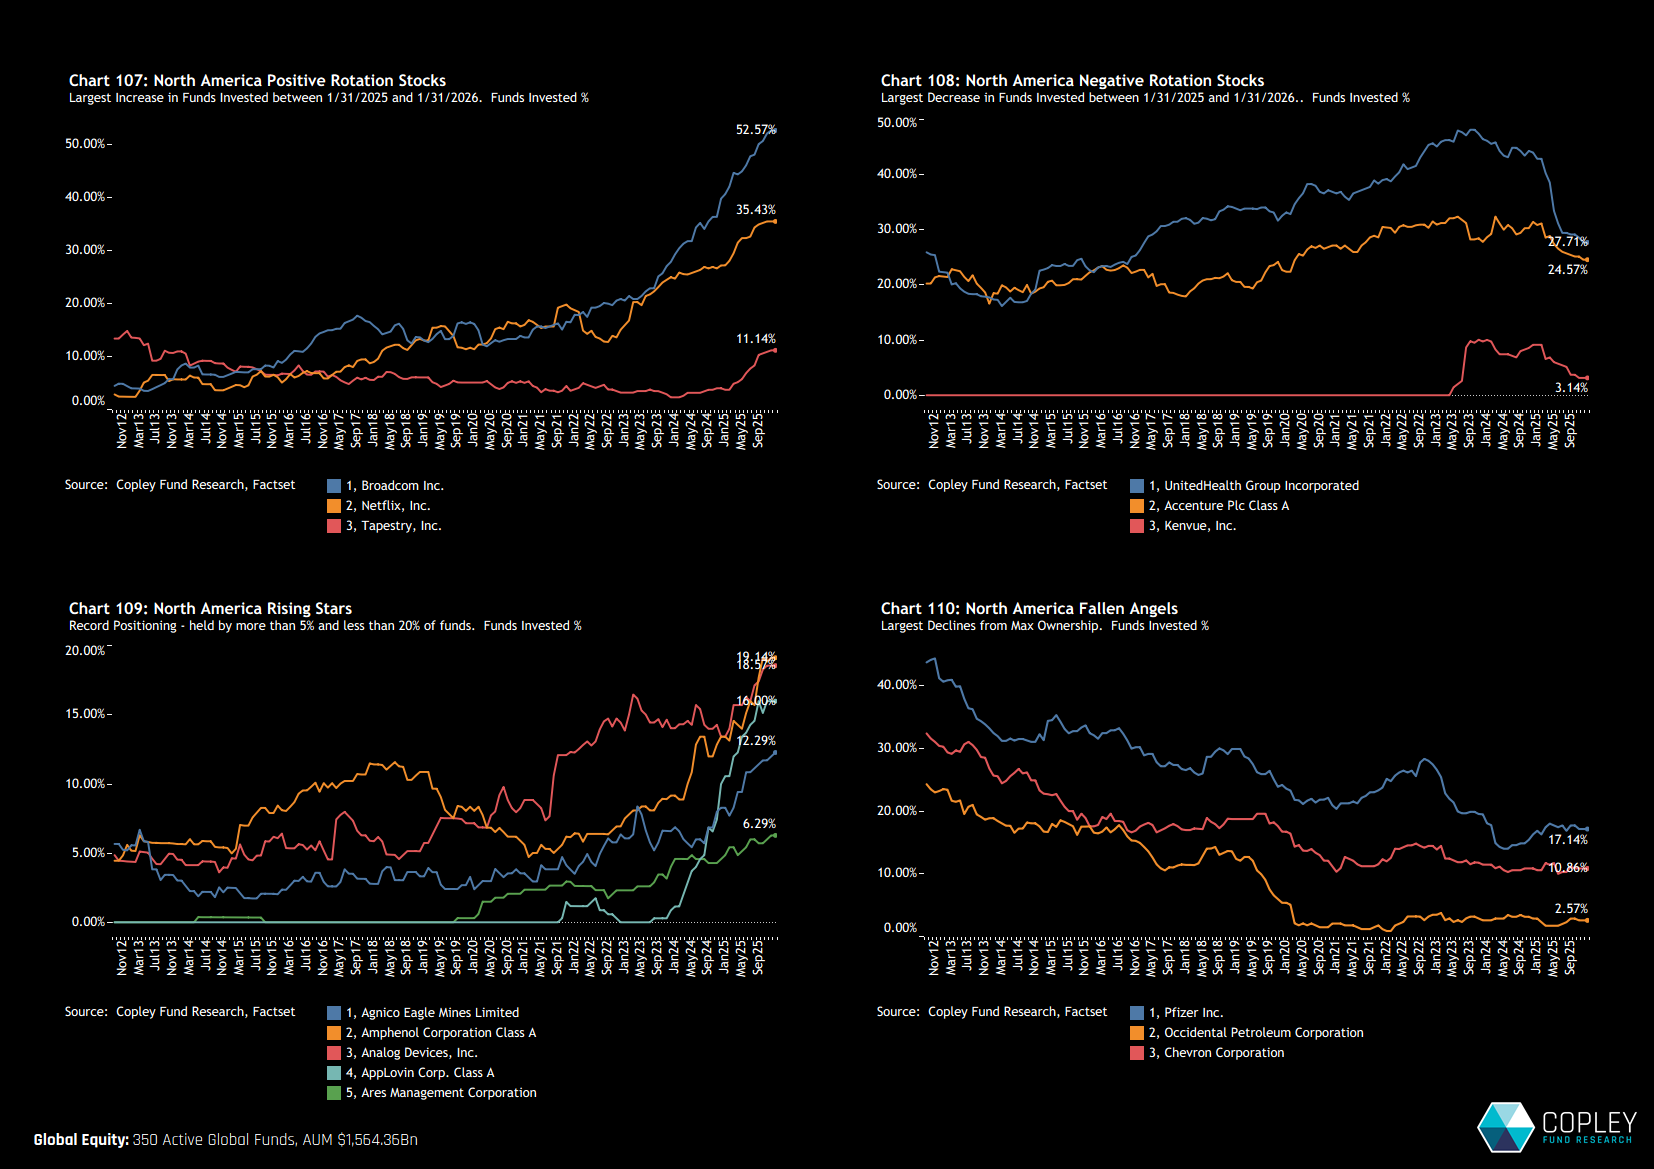
North America – Stock Trends Across North America we highlight 14 stocks driving the positioning narrative. Chart 107 shows the three largest ownership increases in 2025, with Broadcom, Netflix and Tapestry ending the month at all-time highs. Chart 108 captures the most significant reductions. Chart 109 flags emerging names pushing toward the top of their historical ownership ranges but still held by fewer than 20% of managers, with AppLovin and Amphenol standing out for particularly strong investment growth.
At the same time, former core holdings of Global portfolios — Pfizer, Occidental Petroleum and Chevron — have fallen from historically high ownership levels to near record lows (Chart 110).
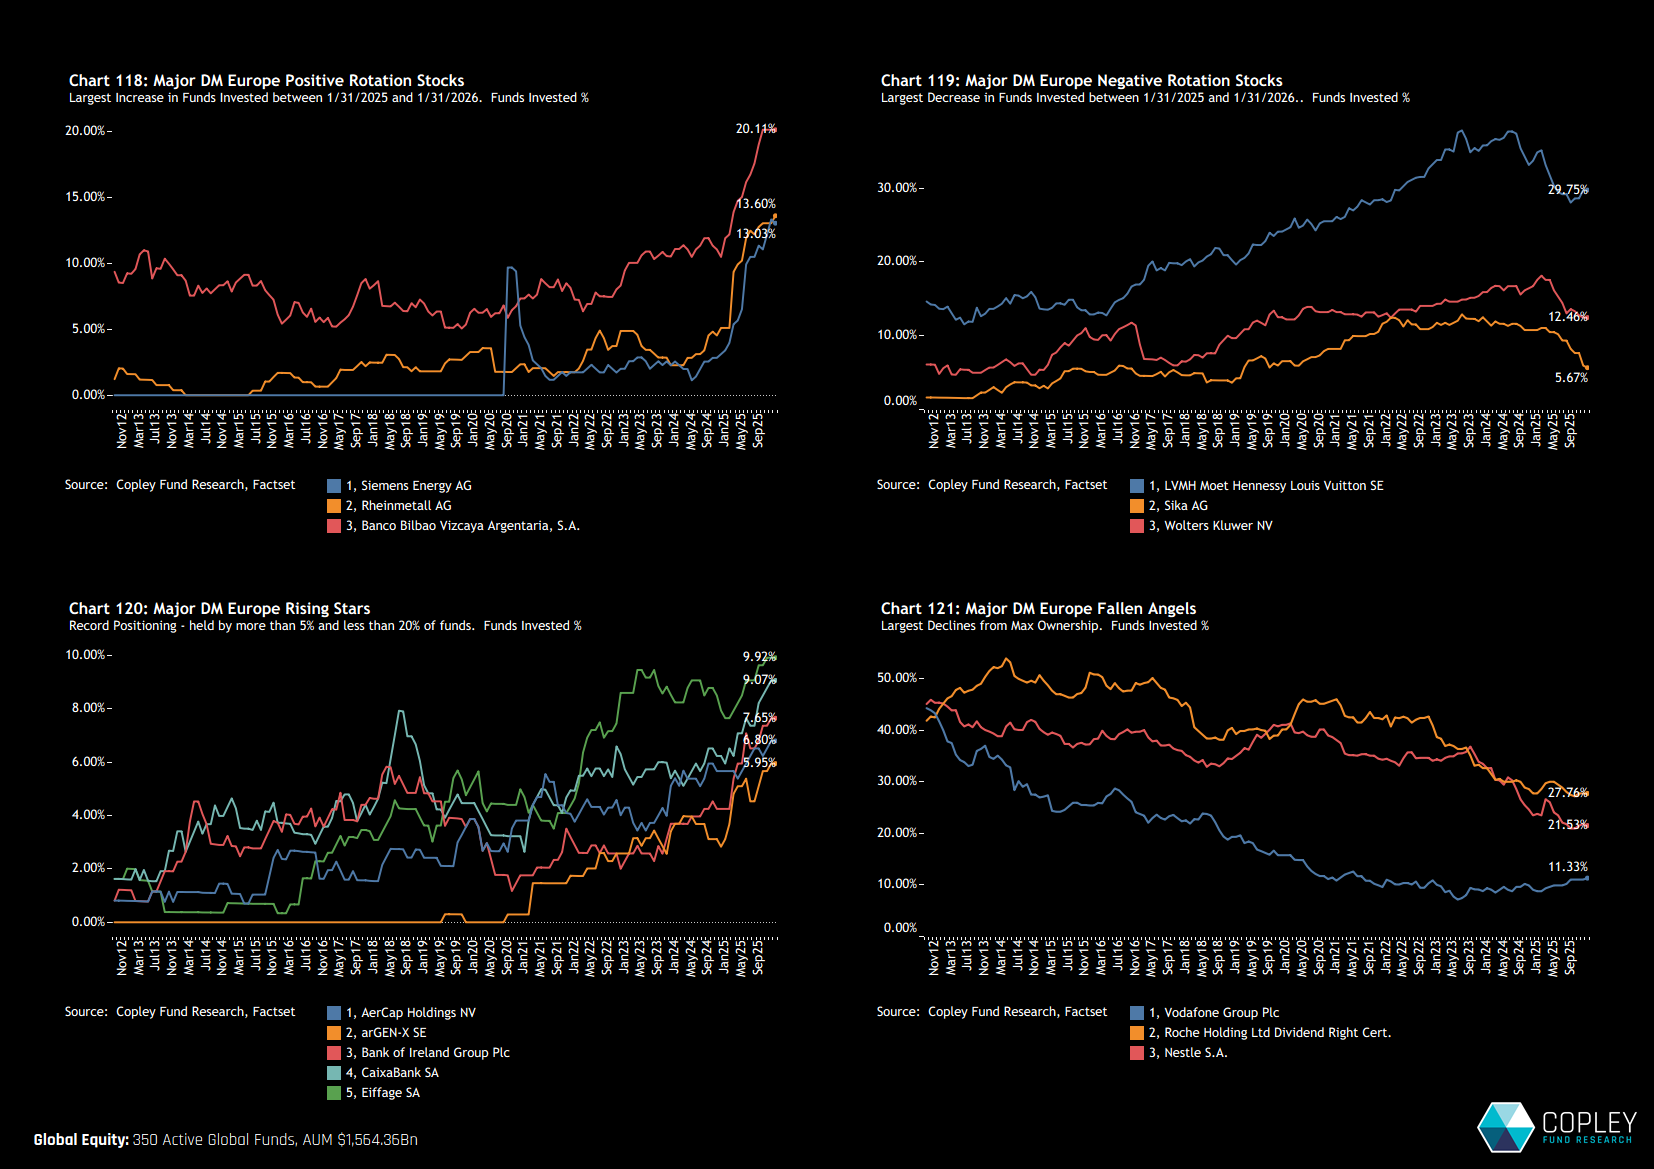
Europe – Stock Trends In Europe, positioning is becoming more polarised. Siemens, Rheinmetall and BBVA have surged to record ownership levels, while LVMH, Sika and Wolters Kluwer have seen meaningful investor exits (Charts 118–119).
Beneath the surface, five stocks are steadily building an investor base. Each remains owned by fewer than 10% of managers, but all have shown consistent ownership growth over the past 12 months, including AerCap Holdings, CaixaBank and Bank of Ireland (Chart 120).
At the other end of the spectrum, Chart 121 highlights the three largest ownership declines since 2012. Nestlé and Roche have fallen sharply to new lows, while Vodafone has stabilised only after years of sustained erosion.
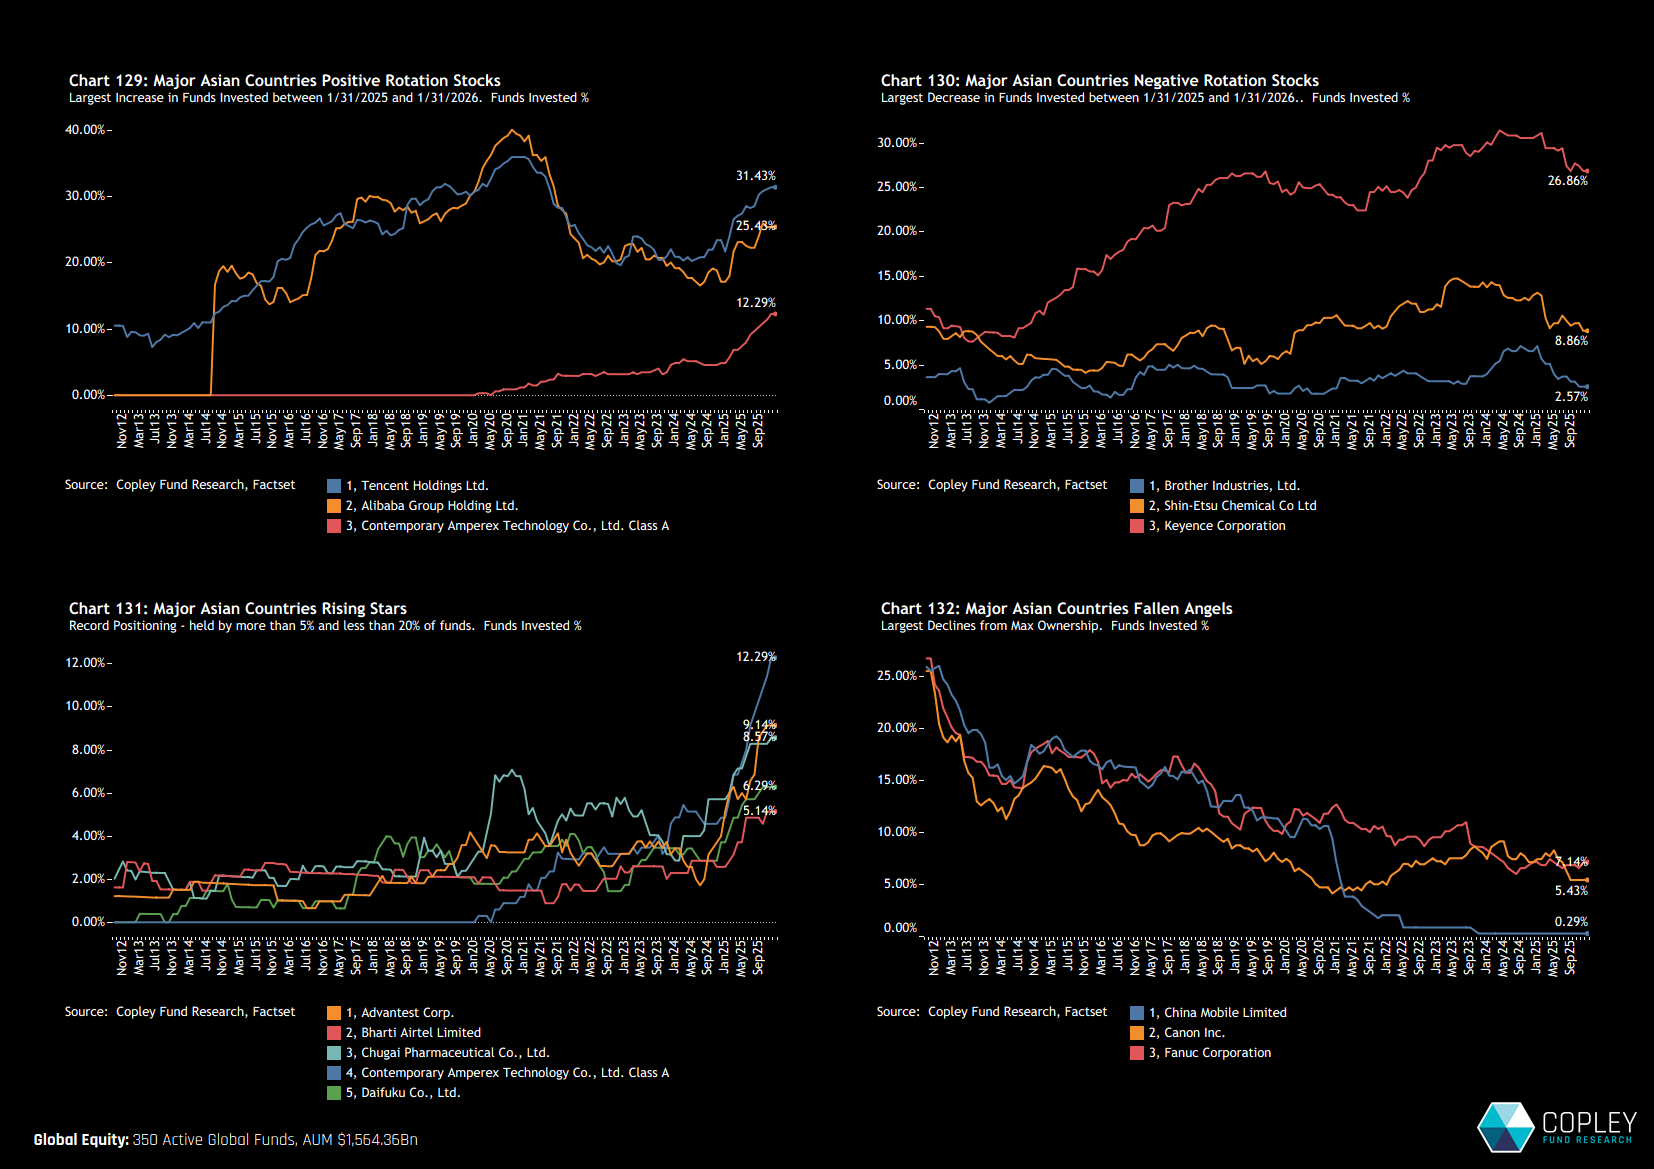
Asia – Stock Trends Across Asia, the strongest ownership gains over the past 12 months have come from China & Hong Kong. Tencent, Alibaba and CATL have attracted sustained Global investor confidence, notable given the typically concentrated exposure managers run within EM markets. These gains have been offset by declines in Japan, where Brother Industries, Shin-Etsu and Keyence have all seen ownership fall over the year.
Emerging interest is building in names such as Advantest, Chugai Pharmaceutical and Daifuku, while exposure to China Mobile, Canon and Fanuc continues to erode, with ownership in each trending toward negligible levels.