MENA’s Next Phase: Structural Adoption and the Rise of Regional Anchors

Global Emerging Markets

February 25th 2026

Executive Summary

MENA’s role in active EM portfolios has entered a new phase. The region is no longer a niche allocation, yet it remains one of the largest structural underweights in the asset class — a gap driven less by active underweighting and more by incomplete adoption.

Participation has risen sharply since the 2019 index inclusions, but the pace of capital allocation is now slowing. Ownership is at a record highs in historical terms, yet penetration remains incomplete, with nearly one-quarter of funds still holding no exposurem and with meaningful dispersion between a small group of high-conviction allocators and a long tail of low-weight positions.

Beneath the aggregate numbers, capital is becoming increasingly concentrated. Ownership gains are being driven by a narrow set of countries and an even narrower group of stocks that are rapidly moving into the core EM universe, while large parts of the opportunity set remain early in their institutional adoption cycle. At the same time, the first signs of internal rotation are emerging as managers recycle capital between regional leaders and new entrants.

This report examines:

  • why the MENA underweight persists despite record participation
  • where conviction is actually building at the fund and country level
  • which companies are becoming core EM holdings

    Keep scrolling for our extended commentary, or click on the PDF link above for the full Market Intelligence Report for the MENA region.

Regional Positioning
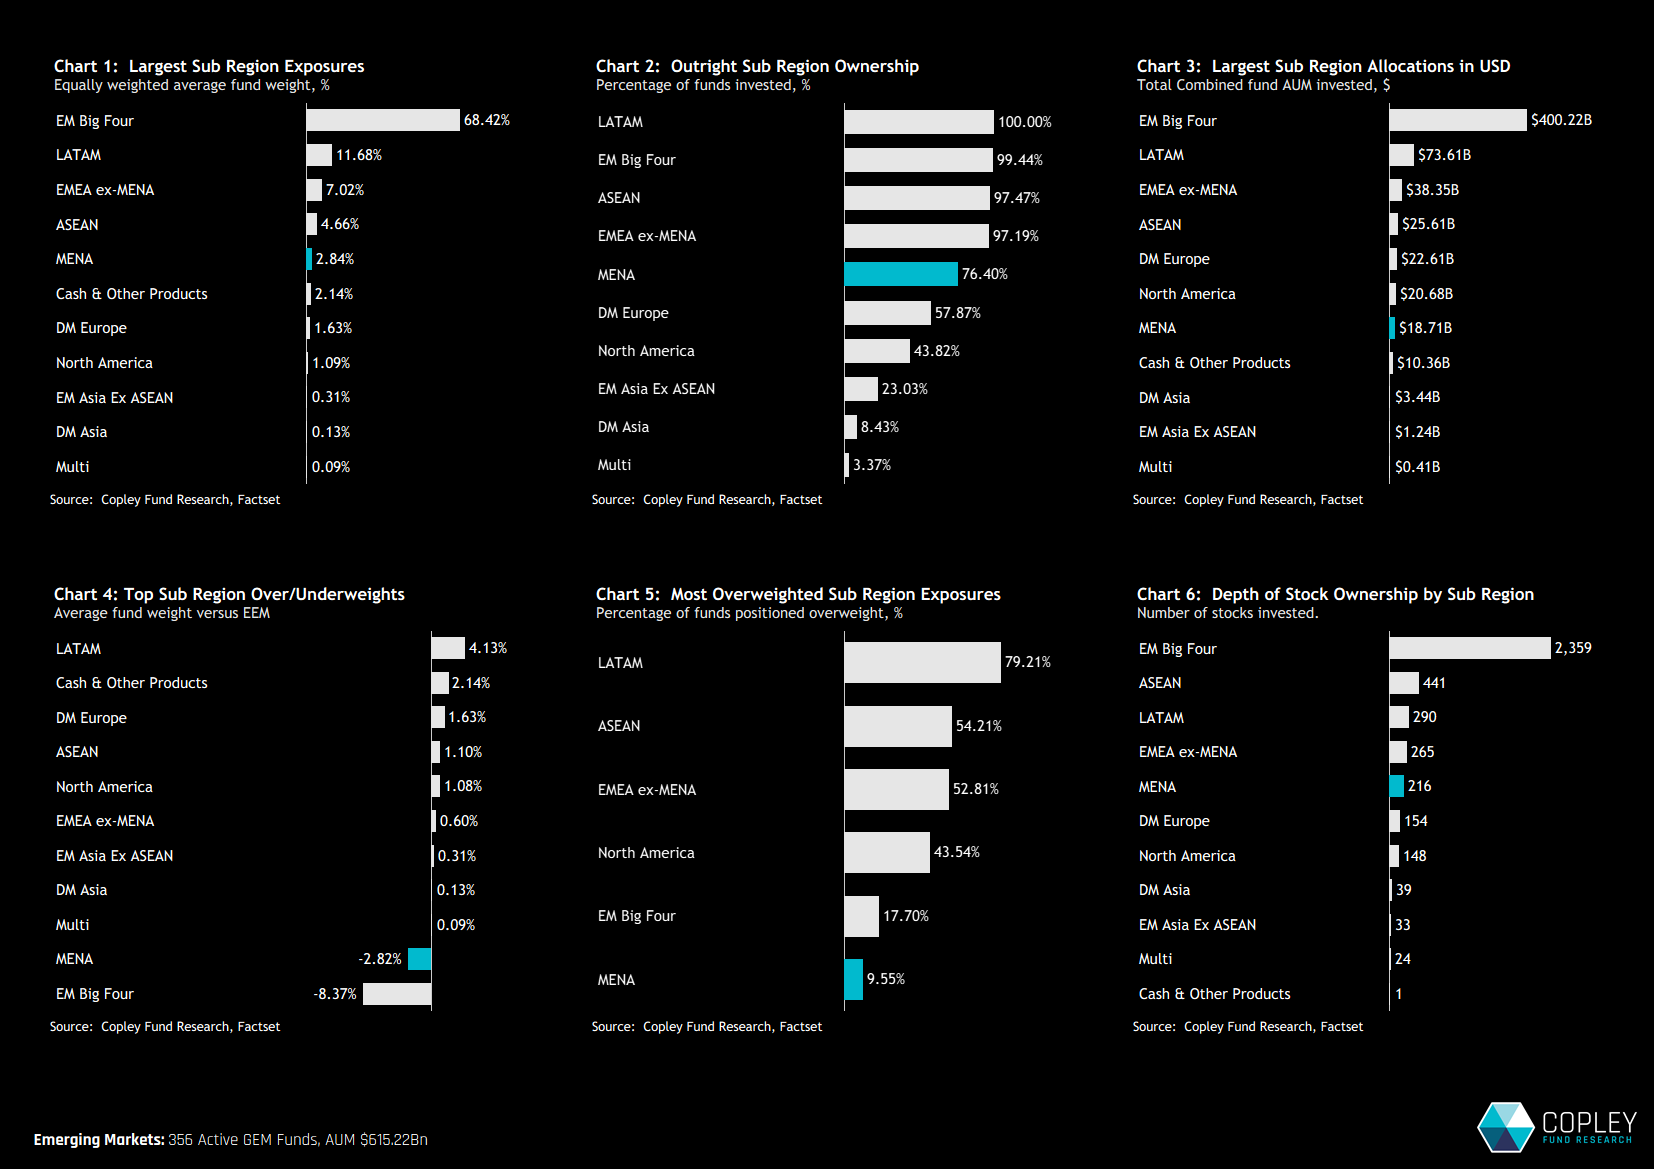
The MENA region is currently the fifth-largest sub-regional allocation among active EM managers, with an average weight of 2.84% (Chart 1), well below the EM index weight of 5.66%. This makes MENA the second-largest regional underweight after the EM “Big Four” — China, India, Taiwan and South Korea (Chart 4).

Unlike the structural underweight to the Big Four, the MENA gap is largely driven by non-participation: 23.6% of funds in our analysis hold zero exposure (Chart 2). These zero allocations are a key reason why aggregate MENA positioning remains materially below benchmark.

Time-Series Analysis
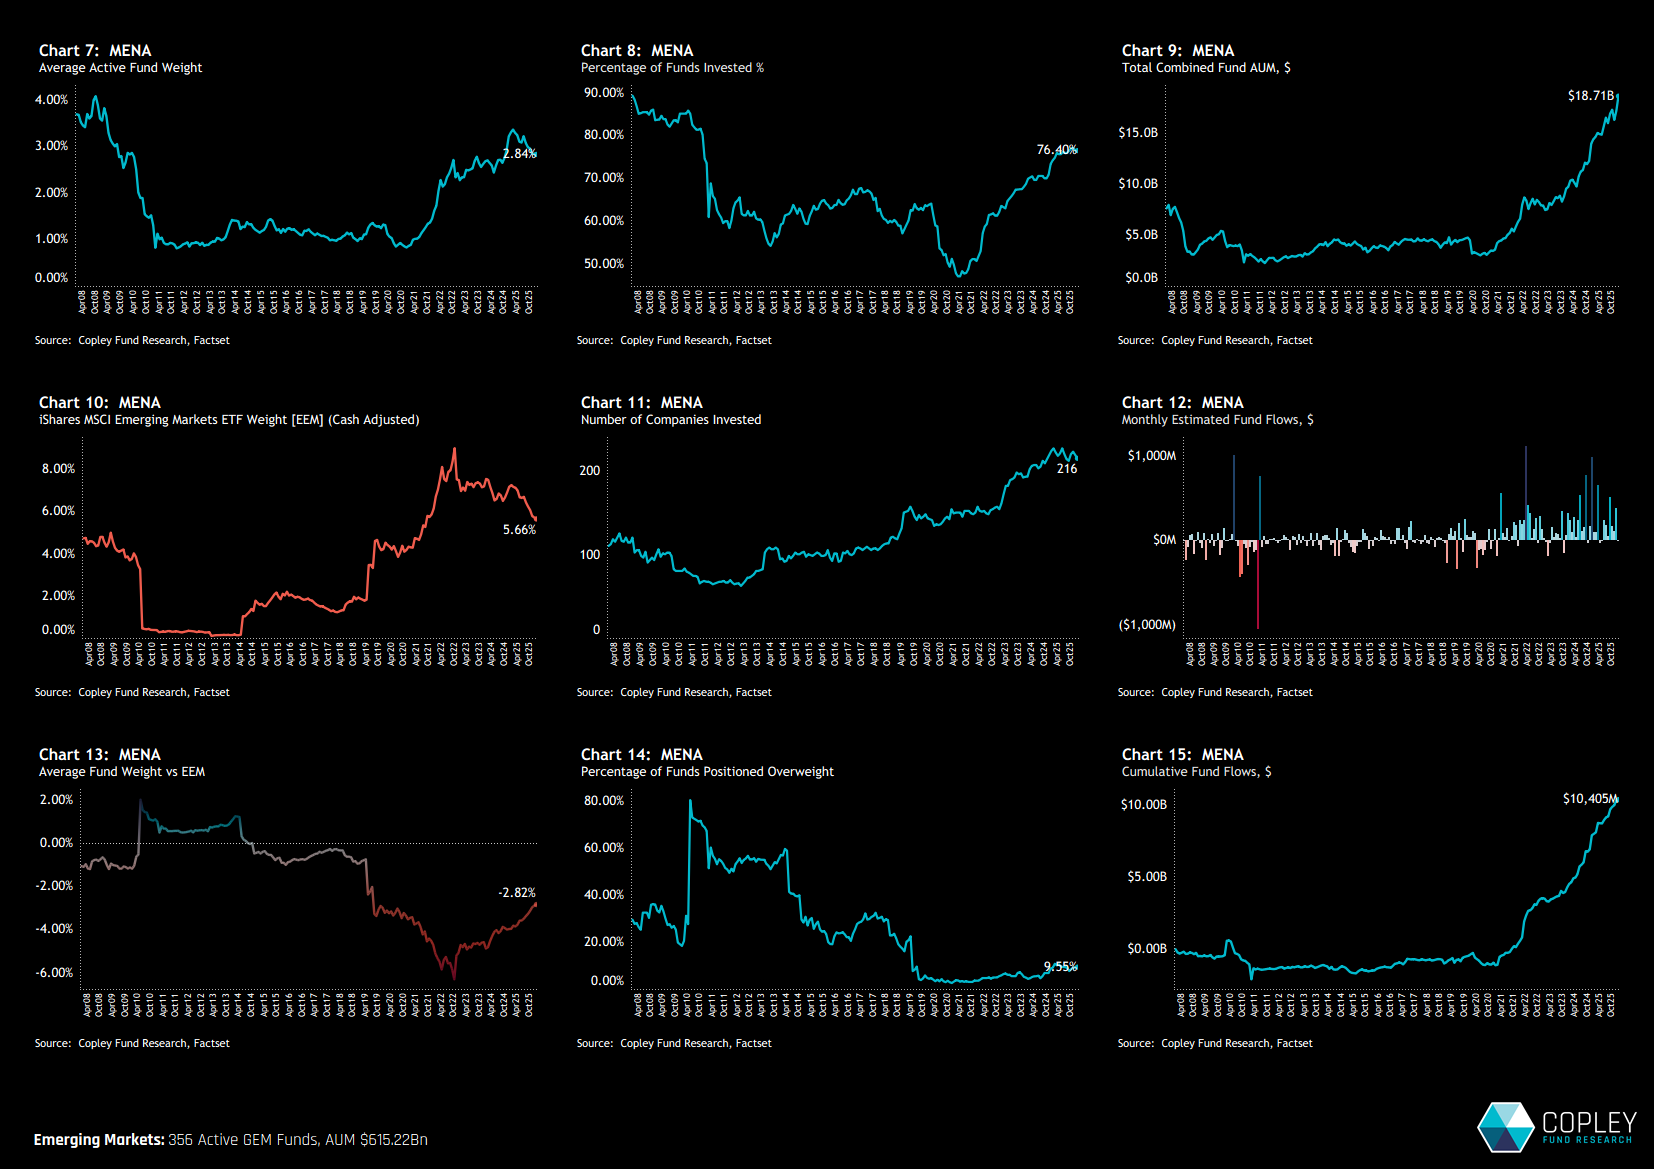
The progression of MENA ownership among GEM funds is shown in the charts below. It reflects a steady rise in exposure, particularly following the major index inclusions in 2019.  Chart 8 shows the percentage of funds invested in MENA increasing from 47% in early 2021 to 76.4% today, alongside a corresponding rise in average fund weights (Chart 7).

That said, momentum has clearly stalled. Chart 10 shows the decline in MENA’s index weight, driven by relative underperformance, which has slowed the pace of allocation growth. Despite this, active managers have continued to add exposure through the drawdown. The net result is a narrowing aggregate underweight (Chart 13), now at its smallest level since July 2019.

Fund-Level Positioning
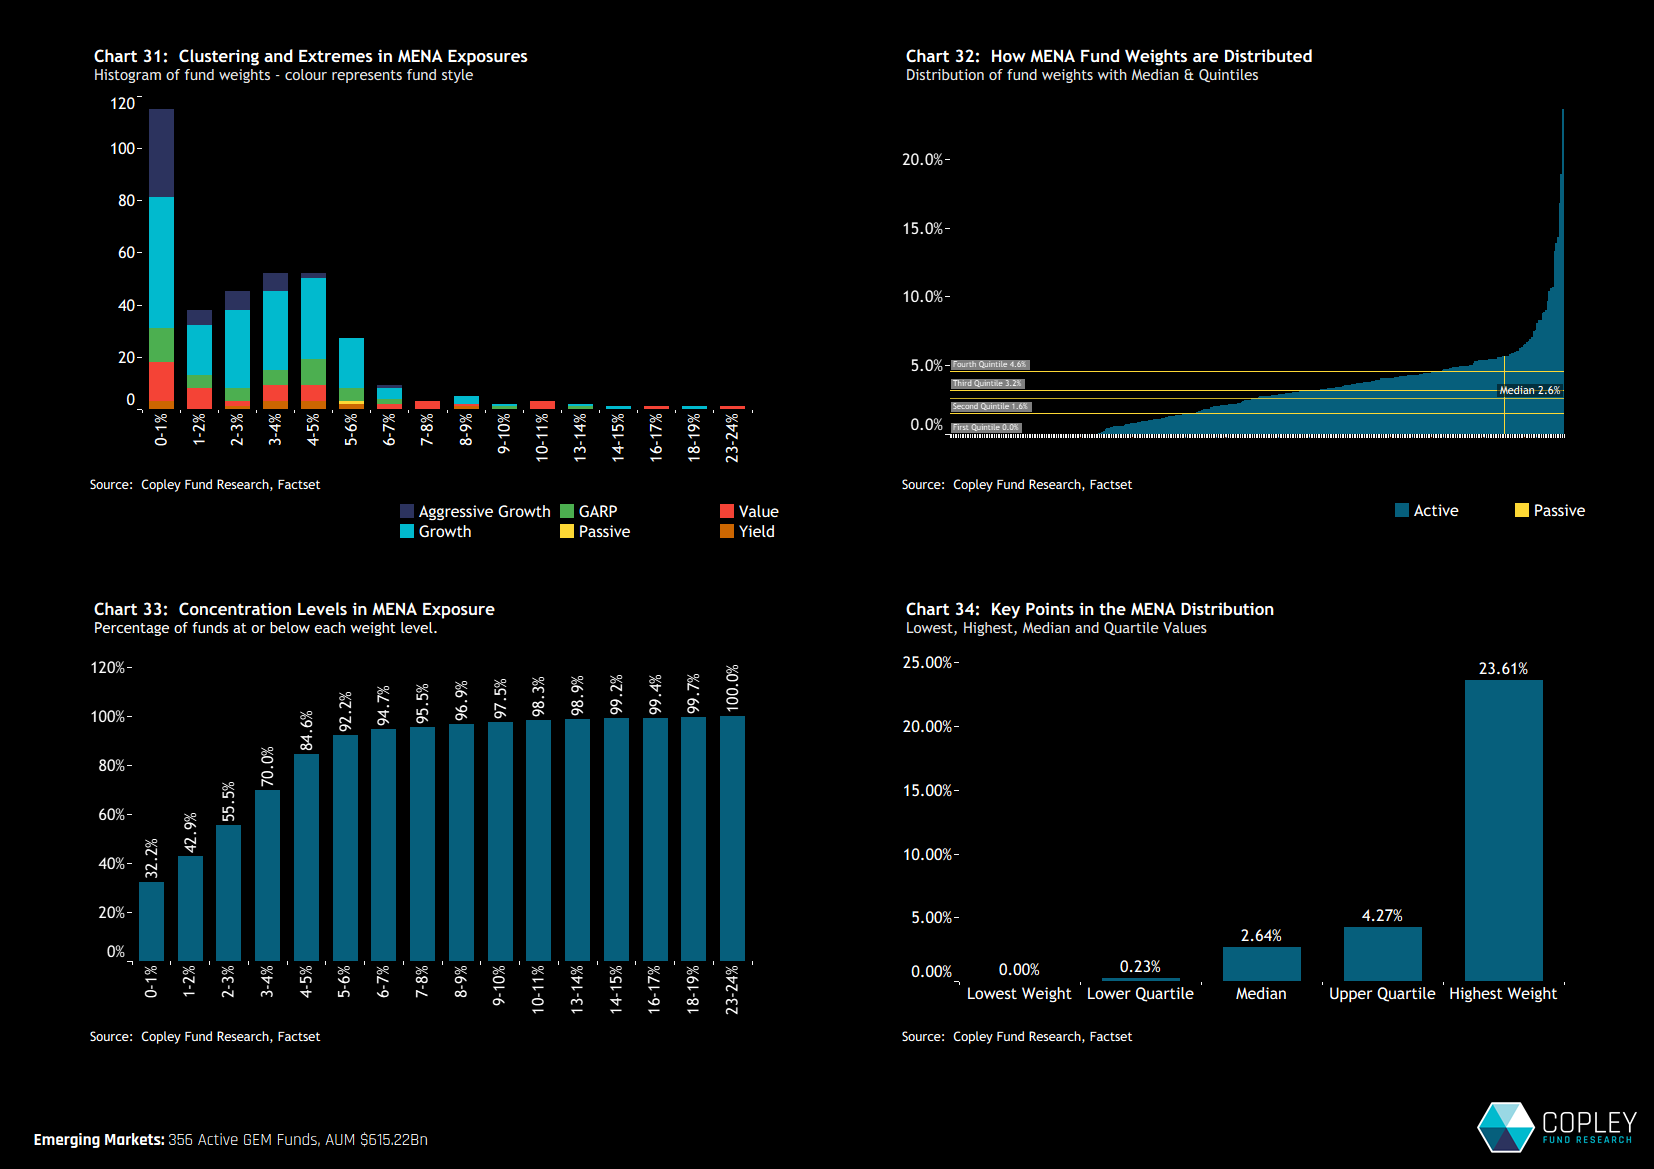
The histogram of fund weights in the MENA region highlights how concentrated positioning remains at the low end of the spectrum (Chart 31). The most common allocation band is 0–1%, which includes funds with zero exposure and reinforces how recently the region has moved into mainstream portfolios.

Even among invested managers, allocations are generally modest – 92% of funds hold less than 6% and the upper quartile of allocations sits at just 4.27%. In other words, even the more committed managers are typically running mid-single-digit exposure rather than benchmark-level weights.

That said, there is a meaningful long tail to the upside. A smaller cohort of high-conviction allocators is positioned north of 10%, with some funds allocating more than 20%. This dispersion underlines that while MENA is broadly owned, it is not yet broadly embraced at scale — conviction remains concentrated in a limited group of managers.

Country Positioning
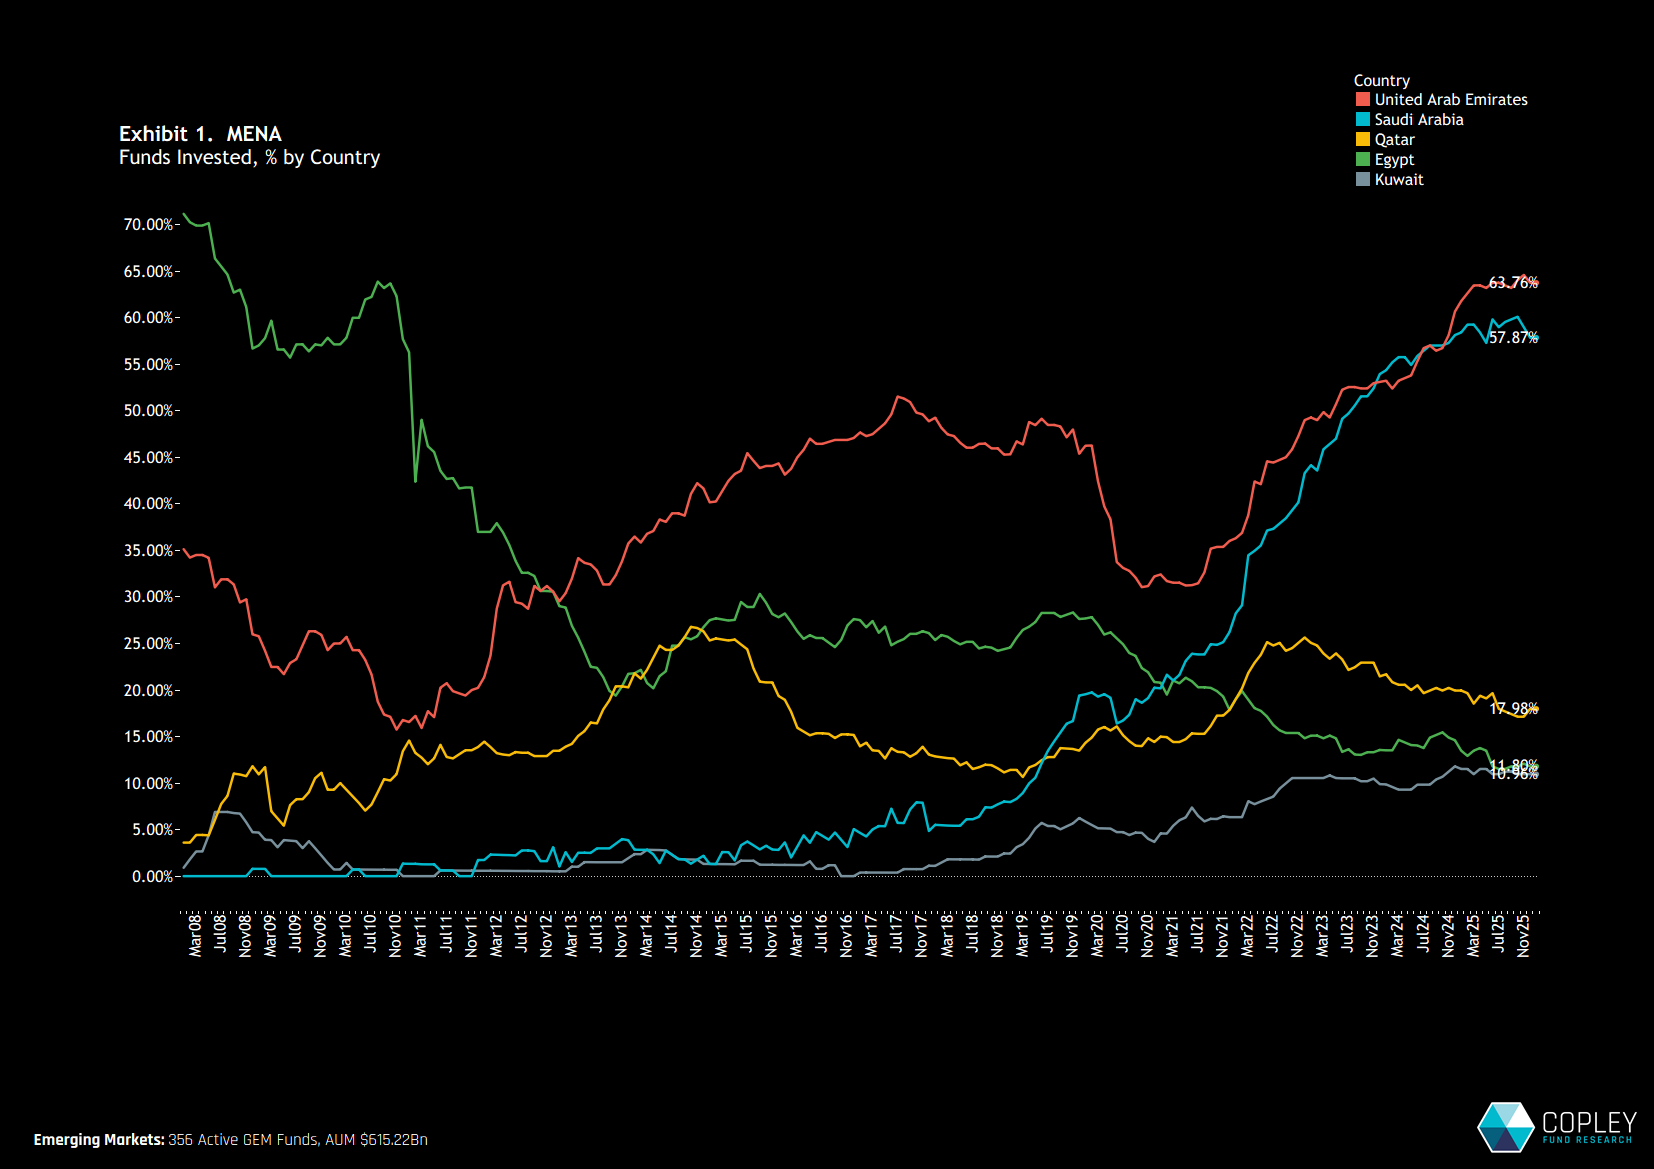
At the country level, MENA investment growth has been driven almost entirely by Saudi Arabia and the United Arab Emirates. Both markets have seen sustained increases in ownership since early 2020, with participation rising broadly in tandem over the subsequent years. While momentum has eased recently, the UAE overtook Saudi Arabia in outright ownership at the end of 2024 and remains ahead today, held by 63.8% of funds versus 57.9% for Saudi.

Elsewhere, adoption has been far more limited. Qatar has seen a gradual decline in ownership since 2022, while Kuwait has largely flatlined as capital has concentrated in the larger, more liquid Saudi and UAE markets. Egypt is now held by a shrinking cohort of EM strategies.

Stock Positioning
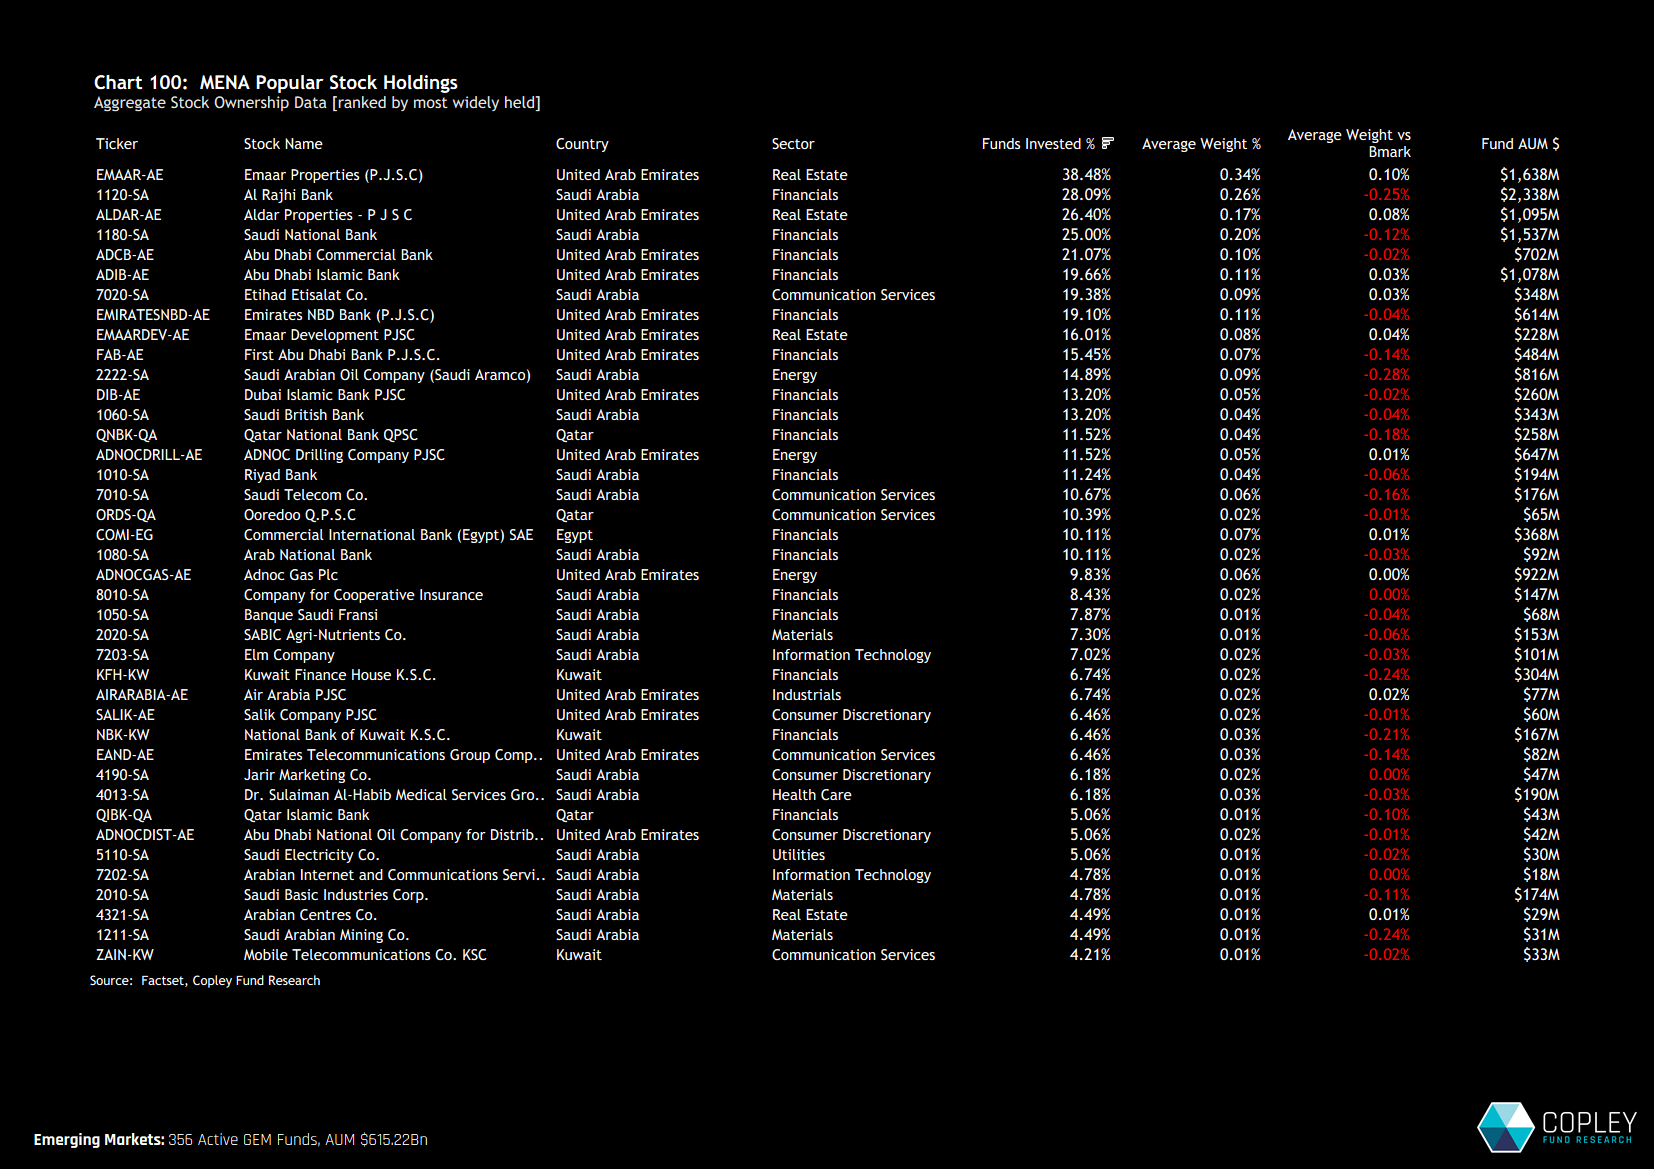
As the market matures and investment levels increase, a clear hierarchy is emerging. A small group of regional leaders has established itself, while a broader second tier is beginning to gain traction.  The top four stocks by ownership now stand out as the regional anchors, led by Emaar Properties, which is owned by 38% of EM managers and ranks among the 30 most widely held stocks globally.

Emaar Properties and Aldar Properties are also the two largest aggregate overweight positions. In contrast, the majority of the MENA universe is held below index weight. The most notable underweights include Saudi Aramco, Al Rajhi Bank and Kuwait Finance House.

Stock Rotation
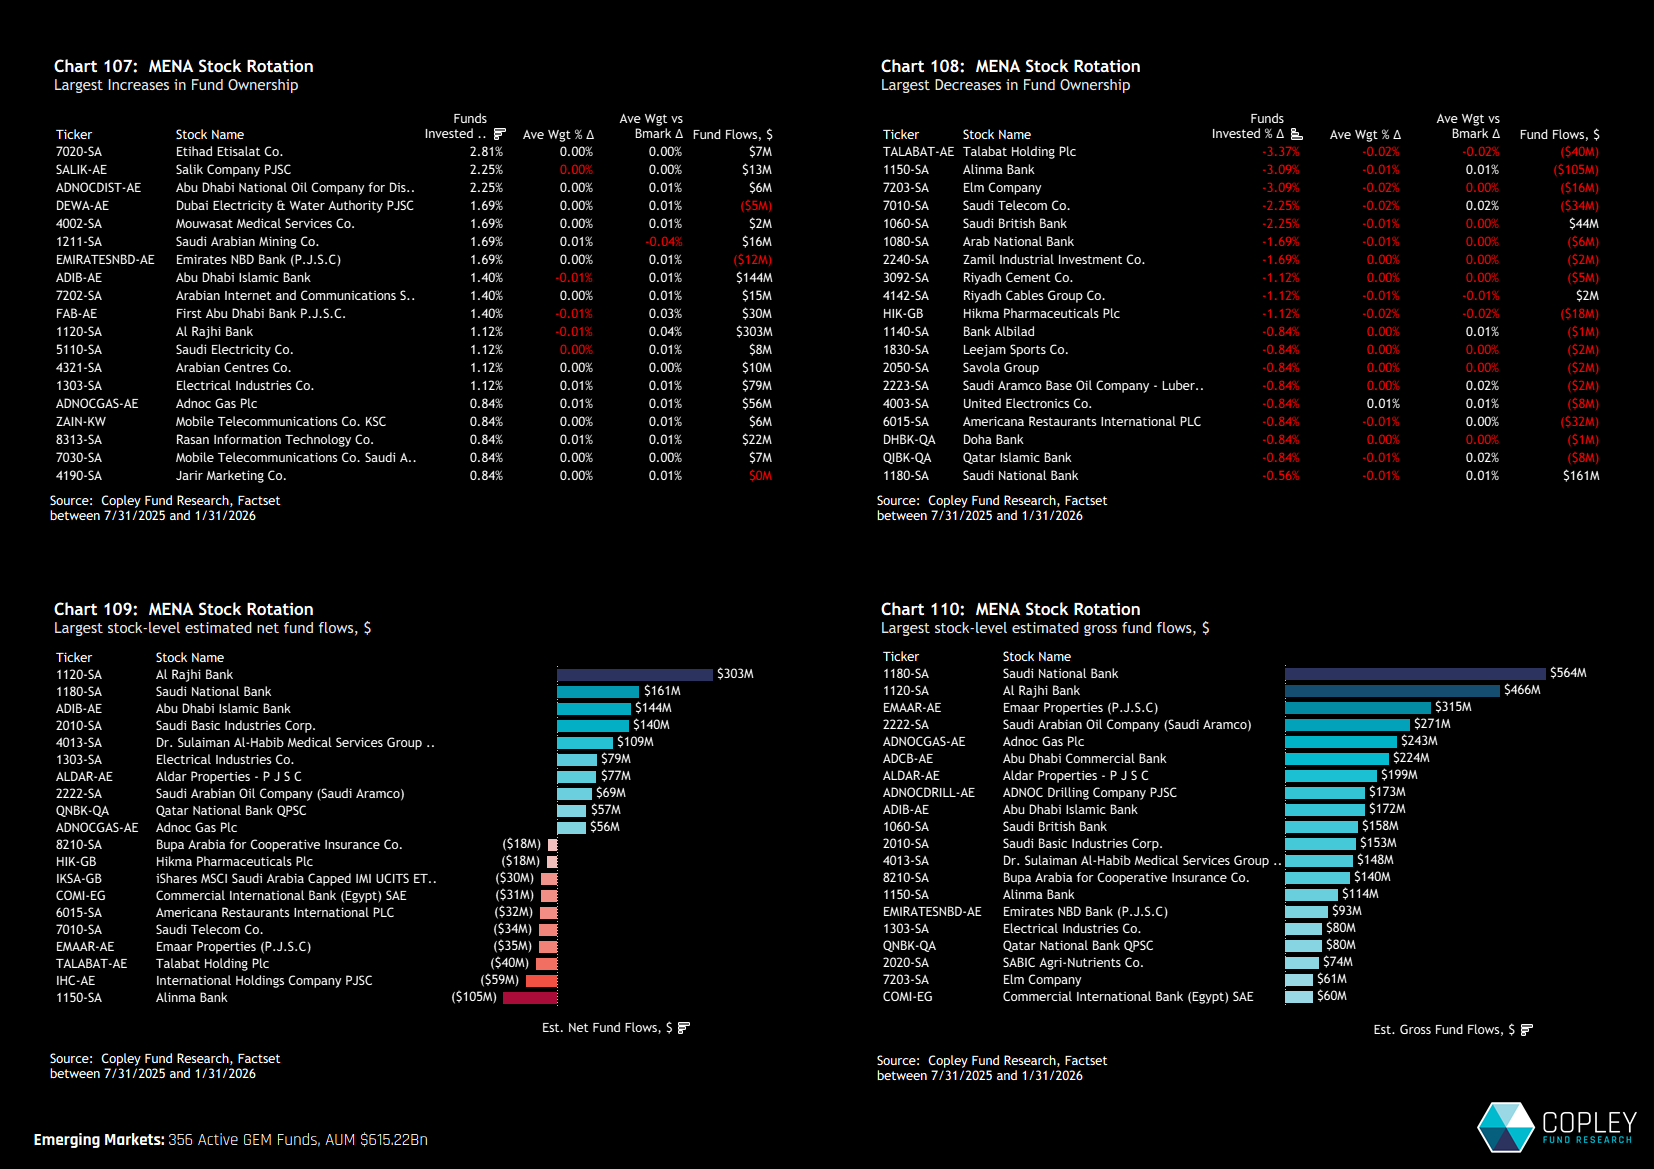
Stock-level activity over the past six months shows managers actively recalibrating exposure as opportunities within the region evolve. On the positive side, a net 2.8% of funds initiated positions in Etihad Etisalat, while 2.25% opened new holdings in both Salik Company and Abu Dhabi National Oil Company.

Conversely, Talabat Holding saw net closures from 3.4% of funds in our universe, with 3.1% closing positions in both Elinma Bank and Elm Company. From a flow perspective, the superior liquidity of Al Rajhi Bank and Saudi National Bank is evident in both net and gross fund flow metrics.

Stock Ownership Evolution
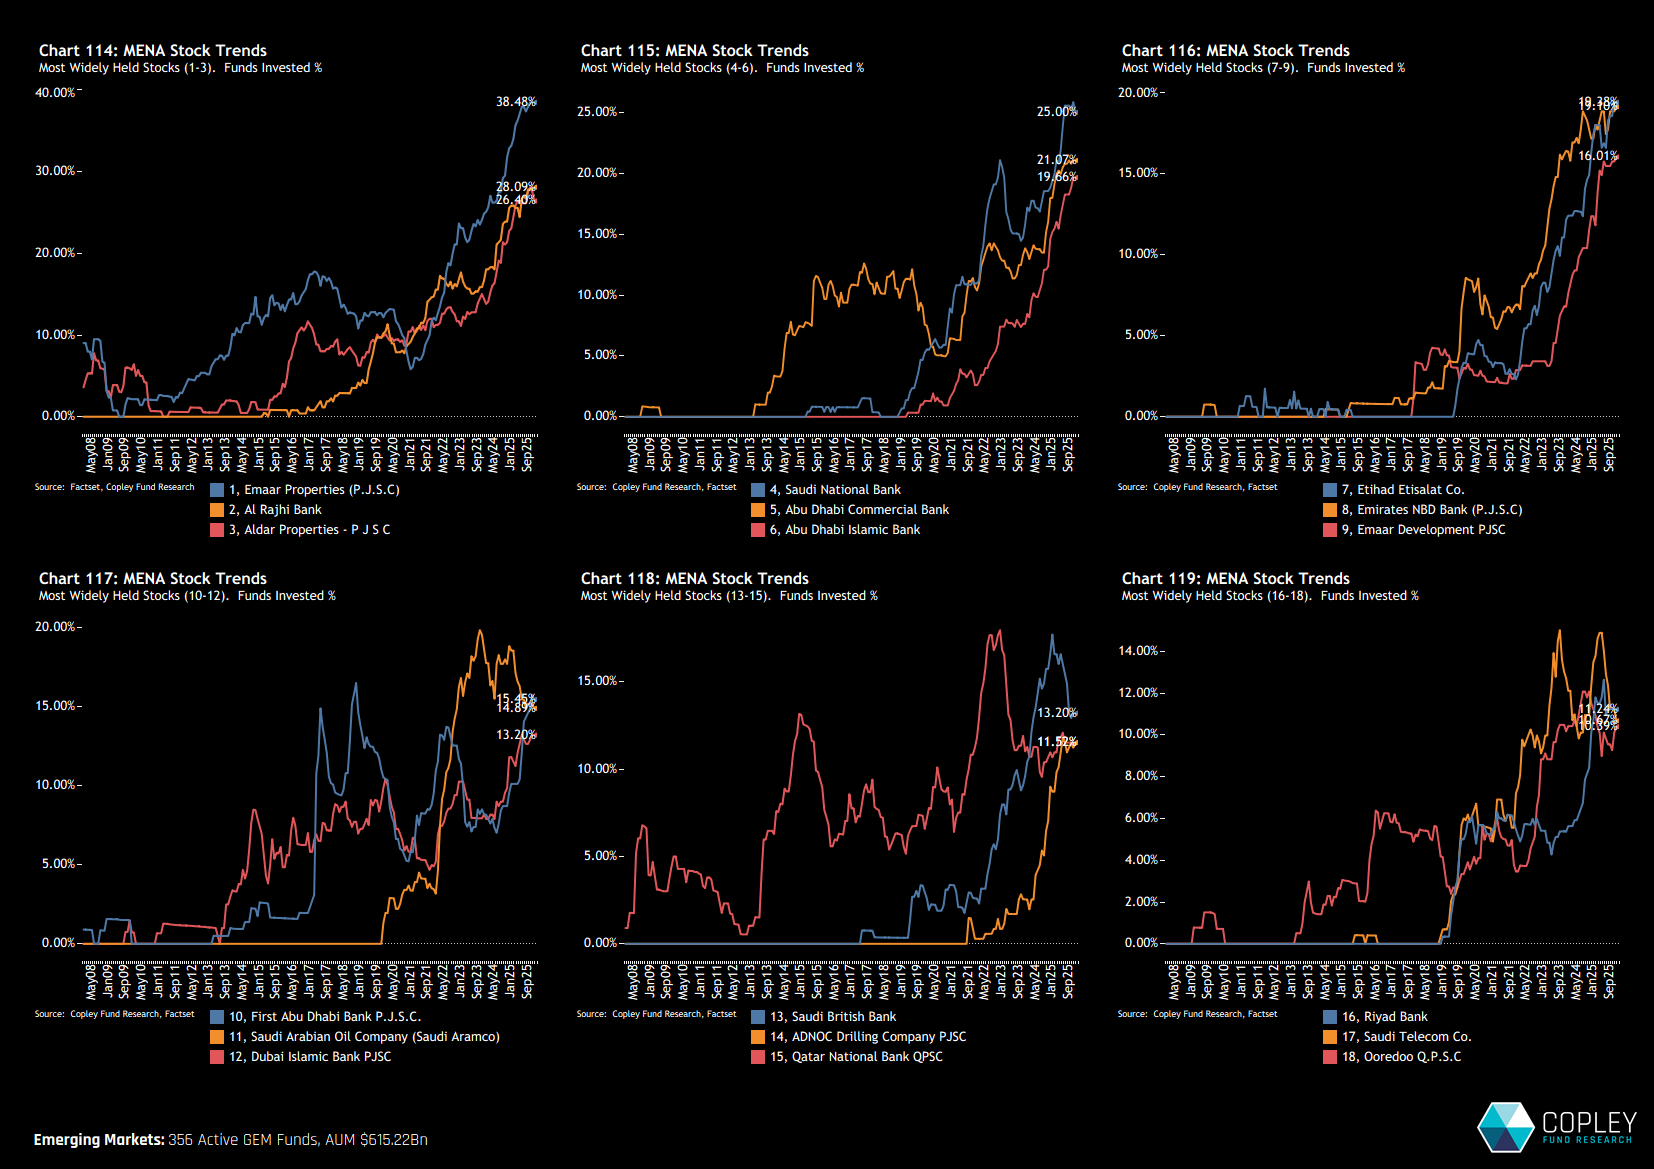
The charts below show the time series of the percentage of funds invested in each of the 18 most widely owned MENA companies. Charts 114–116 illustrate how aggressively ownership has risen in the leading names, all of which are now at record levels of fund participation.

Beyond the top nine, positioning has been more selective. After earlier periods of accumulation, several stocks have seen consolidation. Saudi Aramco, for example, has experienced net closures, alongside Saudi British Bank and Saudi Telecom, as managers rotate capital elsewhere within the region and broader EM universe.

Stocks to Watch
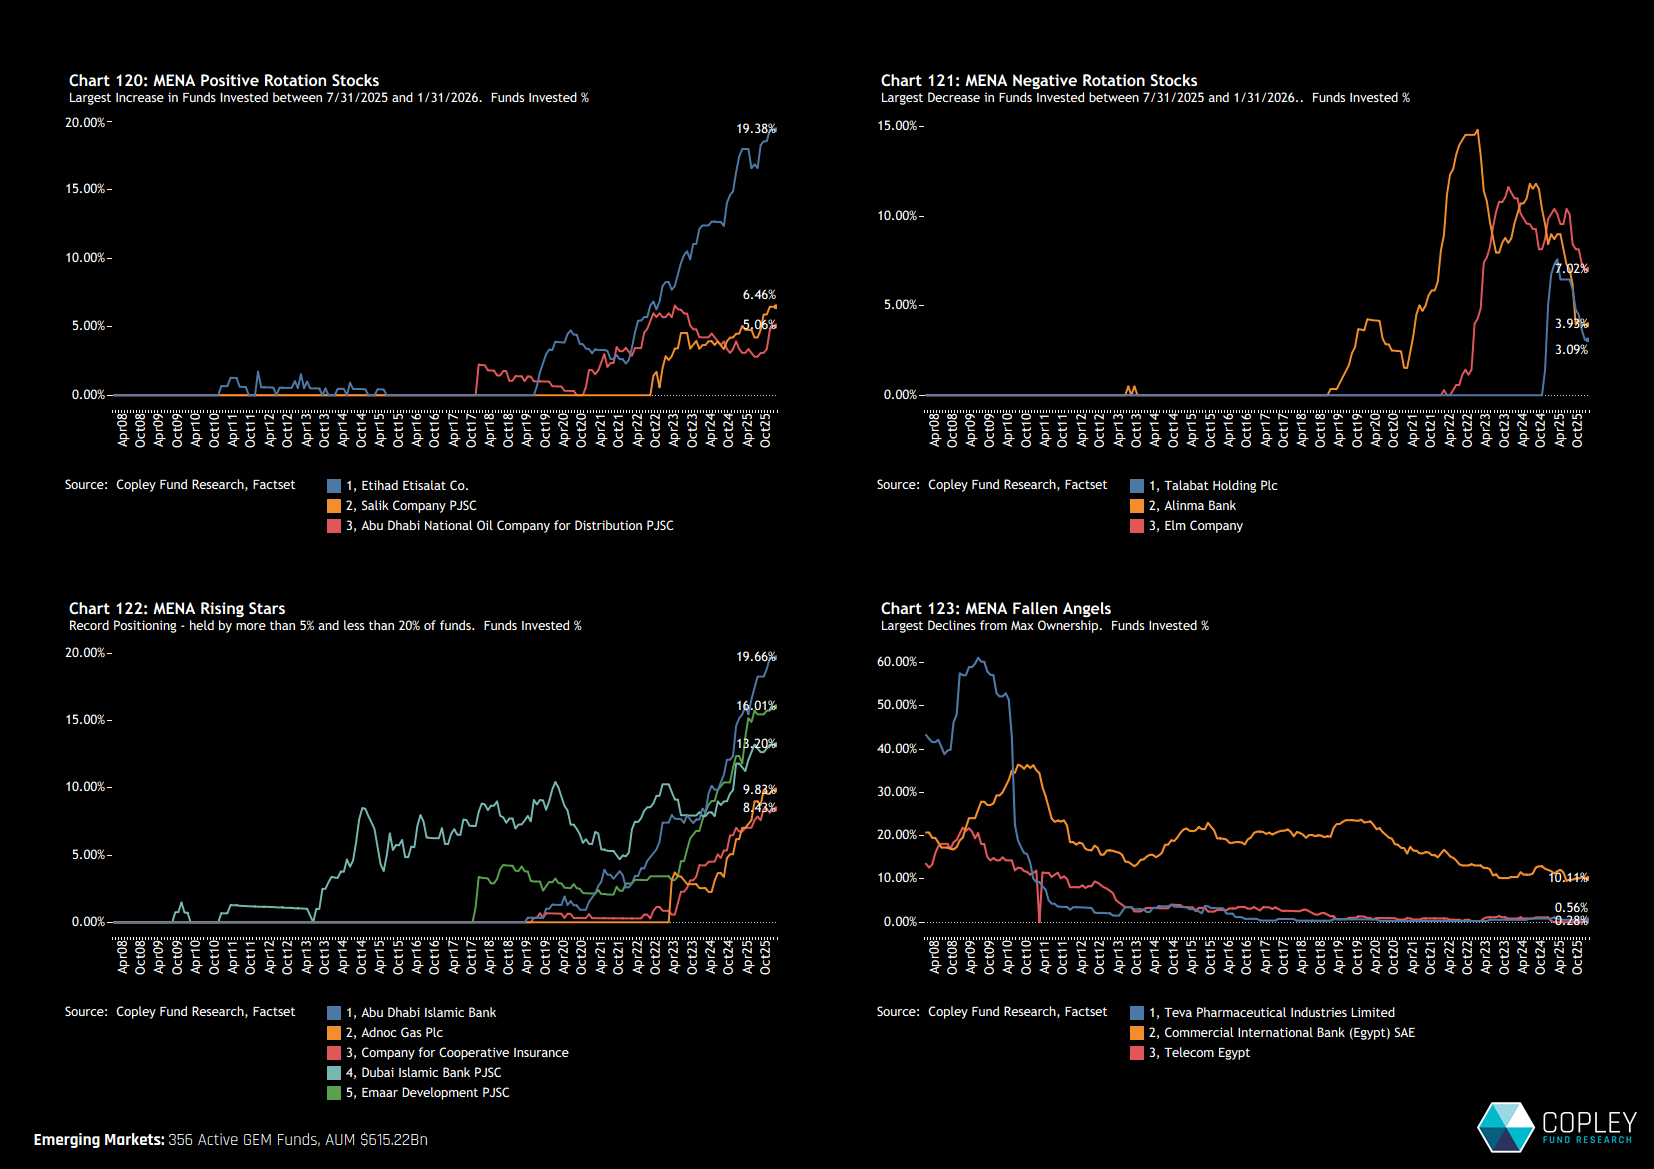
Chart 120 highlights the three companies seeing the largest increases in ownership over the past six months. Salik Company and Abu Dhabi National Oil Company remain in the early stages of their ownership journey, while Etihad Etisalat continues to push to new highs, moving firmly into the top tier of regional holdings.

Chart 121 illustrates how quickly capital can rotate when more compelling opportunities emerge. Talabat Holding, Alinma Bank and Elm Company have all seen ownership reverse following earlier periods of adoption.

Chart 122 identifies companies at record ownership levels but still held by fewer than 20% of managers. Names such as Abu Dhabi Islamic Bank and Adnoc Gas remain early in their institutional adoption cycle, yet momentum is clearly building among active EM managers.

Finally, Chart 123 highlights three Egyptian companies that were once more prominent in EM portfolios but where ownership has now drifted back toward historical lows.

Terms and Conditions

Investor Positioning Report — Copley Fund Research Ltd  ·  Last updated: July 2026  ·  Registered in England and Wales

1. Who we are

Copley Fund Research Ltd provides proprietary institutional fund intelligence to listed companies and investor relations professionals. These terms govern every purchase of an Investor Positioning Report. By completing a purchase you confirm you have read, understood, and agreed to these terms in full.

2. What you are purchasing

The Investor Positioning Report is a bespoke PDF report mapping the institutional fund universe around your stock. It covers current investors, past investors, competitor investors, and white space investors. Every report is built from scratch for the specific company ordered and is not a standardised or templated product.

3. Delivery and process

Following payment or invoice issuance, Copley Fund Research will contact you within one working day to agree your competitor set. Production begins once the competitor set is confirmed in writing. The completed report will be released to you within 48 hours of production starting, provided payment has been received in full; where payment is outstanding, the report will be withheld until payment clears. If the requested company falls outside our covered fund universes, or a competitor set cannot be agreed, Copley Fund Research will issue a full refund or cancel the outstanding invoice.

4. Competitor set agreement

The competitor set is agreed with you in writing prior to production, and the report is built to that agreed specification. Requests to amend the competitor set after delivery, based on a change of preference rather than an error, may be treated as a new order.

5. Refund policy

Because each report is produced individually for your company, orders are non-refundable once production has begun, except as set out in clauses 3 and 5a below. By purchasing, you agree not to dispute the charge with your card provider on the basis that the service was not as described, provided the report has been delivered to the agreed specification or corrected under clause 5a.

5a. Quality remedy

If a delivered report contains a material error caused by Copley Fund Research — for example, an incorrect company analysed, a competitor omitted from the agreed set, or content missing from the specification in clause 2 — Copley Fund Research will correct and redeliver the report at no additional charge, within a reasonable timeframe. This is your sole remedy for such errors.

6. Data and accuracy

All fund positioning data in the report reflects holdings as disclosed at the most recently available reporting date at the time of compilation. The timing of fund holdings disclosures is determined by regulatory requirements applicable to each fund and is outside the control of Copley Fund Research Ltd. This data may not reflect current fund positions. Copley Fund Research takes reasonable care to ensure accuracy but makes no warranty, express or implied, as to the completeness or current accuracy of the underlying data — though this does not affect the quality remedy in clause 5a for errors in how that data was analysed or presented. Past fund positioning is not indicative of future fund behaviour or investment decisions.

7. Not investment advice

The Investor Positioning Report is produced for investor relations intelligence purposes only. It does not constitute investment advice, financial advice, or a recommendation to buy, hold, or sell any security. The data reflects historical fund positioning and must not be relied upon as a prediction of future fund behaviour or investment decisions. Copley Fund Research Ltd is not authorised or regulated by the Financial Conduct Authority for the provision of investment advice.

8. Permitted use and confidentiality

The report is licensed for internal use by the purchasing organisation only. You may share it with employees and directors of your organisation. You may not: reproduce, redistribute, publish, or resell the report or any part of it; share it with any third party outside your organisation without prior written consent; use the fund or portfolio manager names contained in the report to approach those individuals on behalf of Copley Fund Research or in a manner that could damage Copley Fund Research's relationships with those funds; or use the data for any purpose other than your own investor relations strategy. The data, analysis, and methodology contained in the report are the intellectual property of Copley