Reassessing Turkey: EM Fund Managers Show Signs of Sentiment Shift

361 emerging market Funds, AUM $400bn

Reassessing Turkey: EM Fund Managers Show Signs of Sentiment Shift

• After a decade-long bear market in investor positioning, GEM managers are beginning to show tentative signs of a sentiment shift towards Turkey.
• Positive fund flows and numerous new positions over the past six months highlight Turkey as a primary beneficiary of recent country rotation.
• This rotation is notably reflected in strategic positioning within stocks such as BIM Birlesik, Akbank, and Mavi Giyim Sanayi.
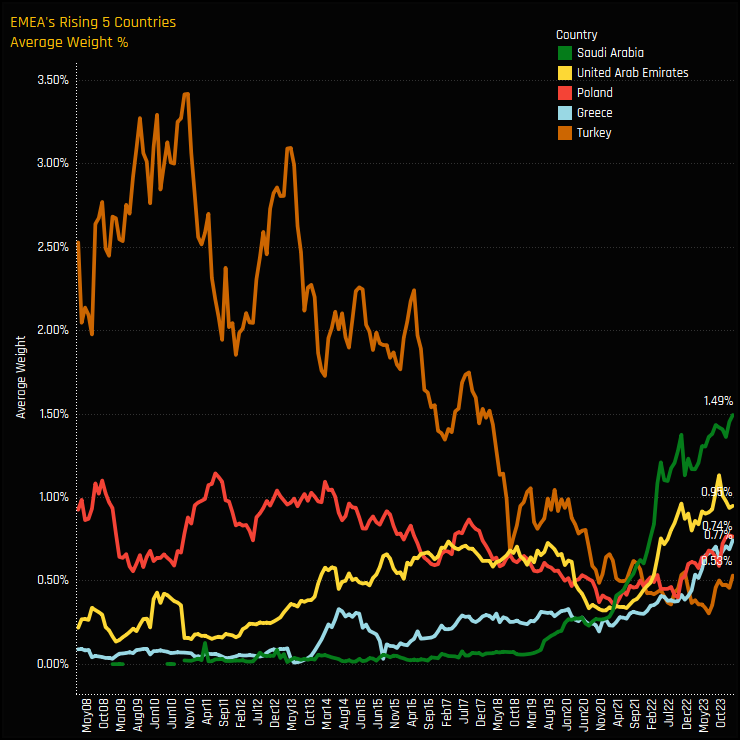
• Turkey joins Saudi Arabia, Poland, UAE and Greece as EMEA countries befitting from rotation, yet Turkey remains the lowest allocation of the group.
• The blend of cautious optimism, relatively low current allocations, and a solid history of investment by emerging market managers points to Turkey's potential for further growth.

Time-Series and Country Activity

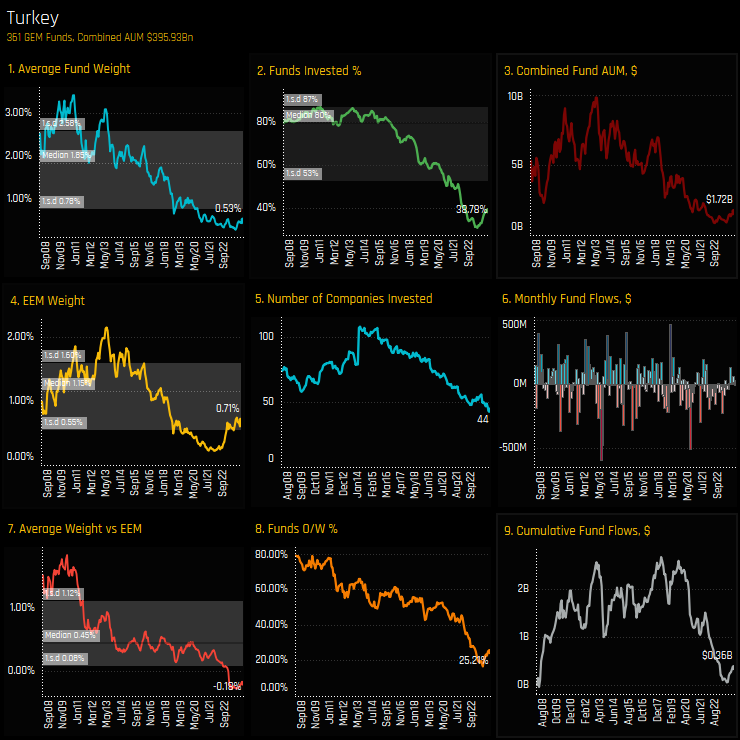
Active Emerging Market funds are showing renewed interest in the Turkey investment case. This follows on from a decade long decline in investor positioning, as evidenced by declining in average fund weights (ch1), the percentage of funds invested (ch2), the number of funds overweight (ch8), and combined fund AUM (ch3) over the past decade. However, current data indicates a notable shift, marking the first instance of a reversal in this long-standing trend. Since late 2023, most ownership metrics have experienced an upward movement from their previous lows.

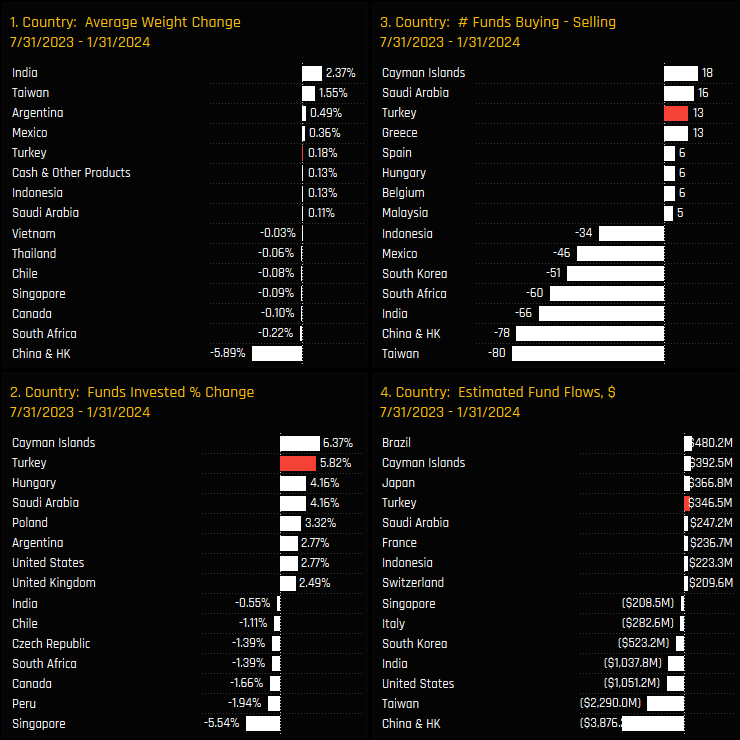
Between July 31, 2023, and January 31, 2024, our analysis reveals a reasonable shift in fund positioning across countries, with a marked active rotation towards Turkey. This adjustment is reflected through an increase in average weight of +0.18%, a rise in the percentage of funds invested by +5.8%, positive fund flows of $347 million, and a greater number of buyers than sellers. These indicators, some of the most pronounced among global Emerging Market peers, highlight the proactive nature of the rebalance. This active shift towards Turkey stands in contrast to the clear outward rotation observed in several of the larger Asian nations.

Country Sentiment & Positioning

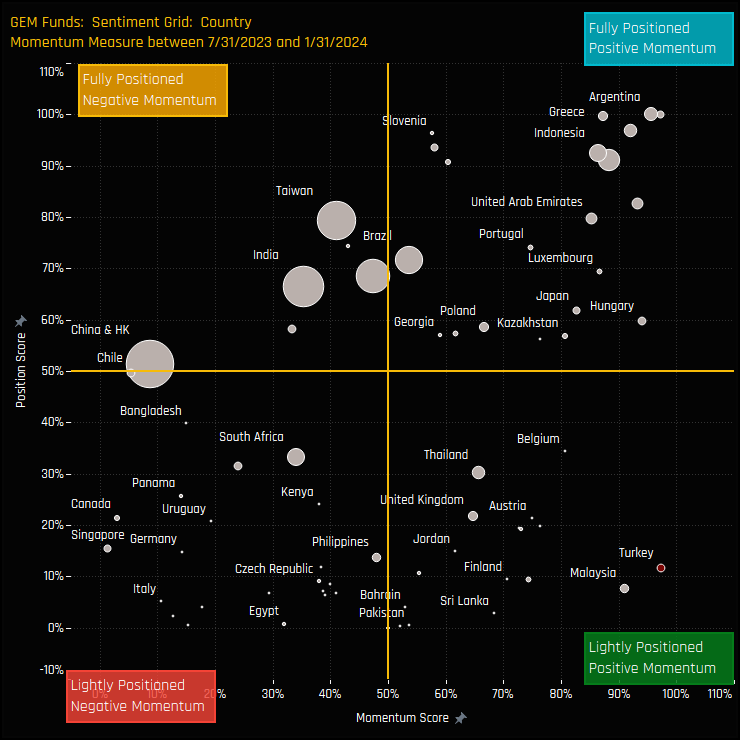
The Sentiment Grid below visualizes the relationship between current fund positioning, long-term fund positioning and shorter-term fund manager activity for all countries in the GEM fund universe. The Y-axis indicates the ‘Position Score,’ reflecting current positioning against historical data since 2008 on a 0-100% scale. The X-axis measures the ‘Momentum Score,’ tracking fund manager activity from July 31, 2023, to January 31, 2024, on a scale from 0% (most negative) to 100% (most positive). Turkey’s placement in the bottom right quadrant highlights both its historically low positioning and the recent uptick in manager sentiment.

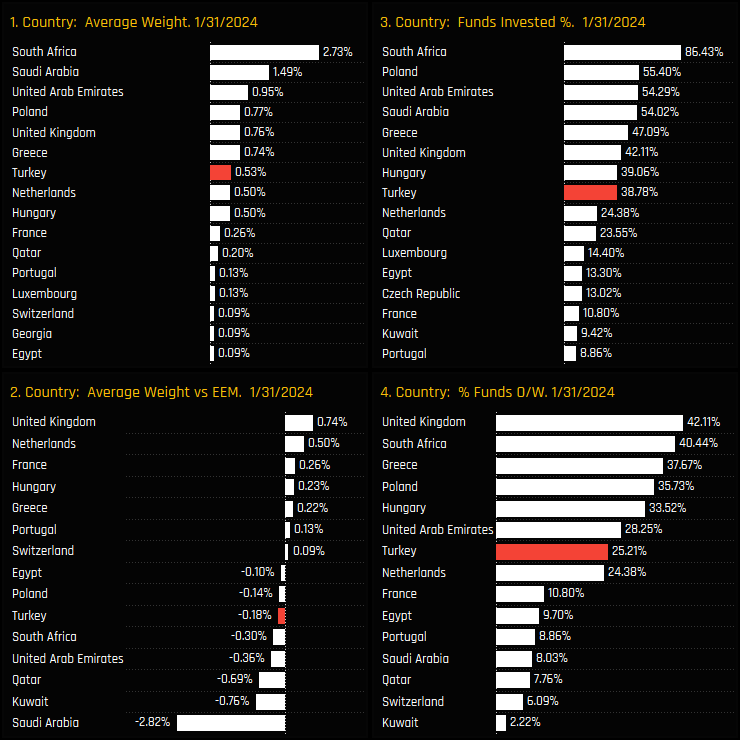
In absolute terms, and focusing just on the EMEA nations, Turkey stands as the 7th largest country weight among peers and the 8th most widely held.  Compared to the benchmark, Turkey is the 6th largest underweight, following the major MENA countries and South Africa, with active EM managers favoring overweights in DM-listed companies from the UK, Netherlands, and France. Simply put, Turkey has moved down the investment priority list, becoming a severely under-represented market in recent years.

Fund Positioning & Activity

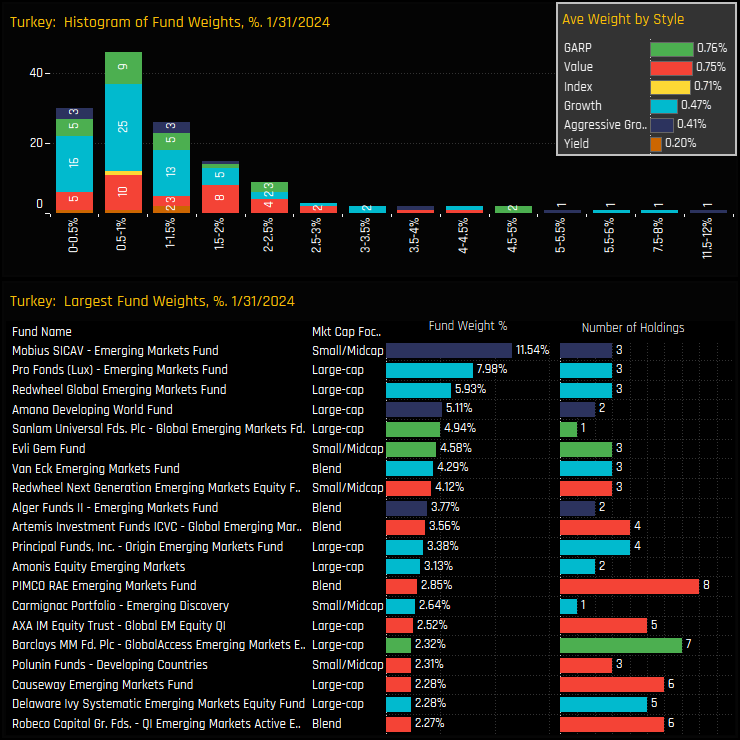
Among the 38.8% of funds that have exposure to Turkey, most maintain positions at weights below 2.5%.  The long tail to the upside is capped out by the 11.5% weight in Turkey by the Mobius Emerging Markets Fund, part of a number of Small/Midcap strategies that have an outsized stake in the Turkish market.  From a Style perspective, Value and Garp funds are more heavily positioned than their Growth peers.

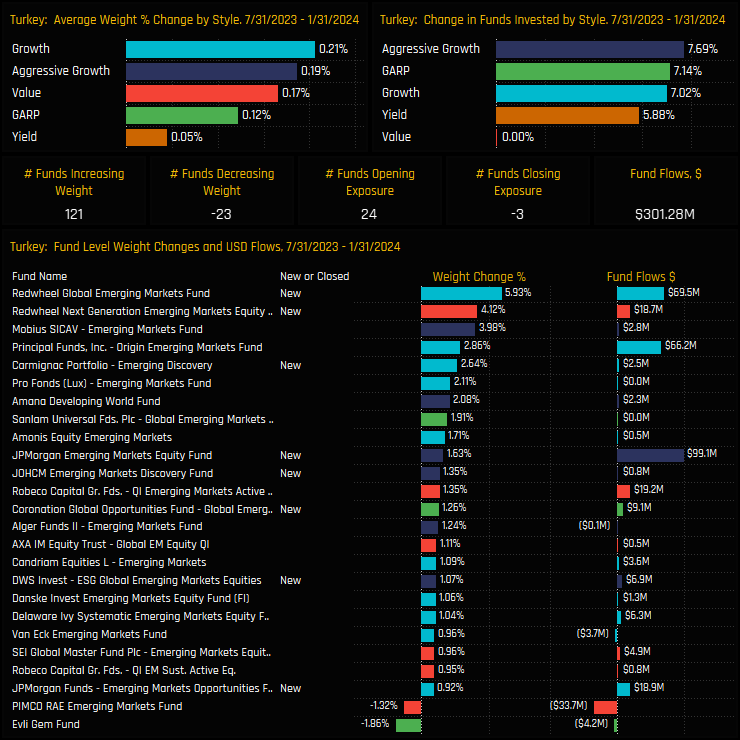
Over the last six months, the trends at the fund level have aligned with broader country-level shifts. A total of 121 funds increased their Turkish weights, compared to just 23 that decreased them, and 24 funds initiated new positions against only 3 closures. Redwheel’s significant new investments in Turkey across its Emerging Market funds highlight a notable shift in country level positioning.  All Style groups saw allocations increase over the period.

Stock Positioning & Activity

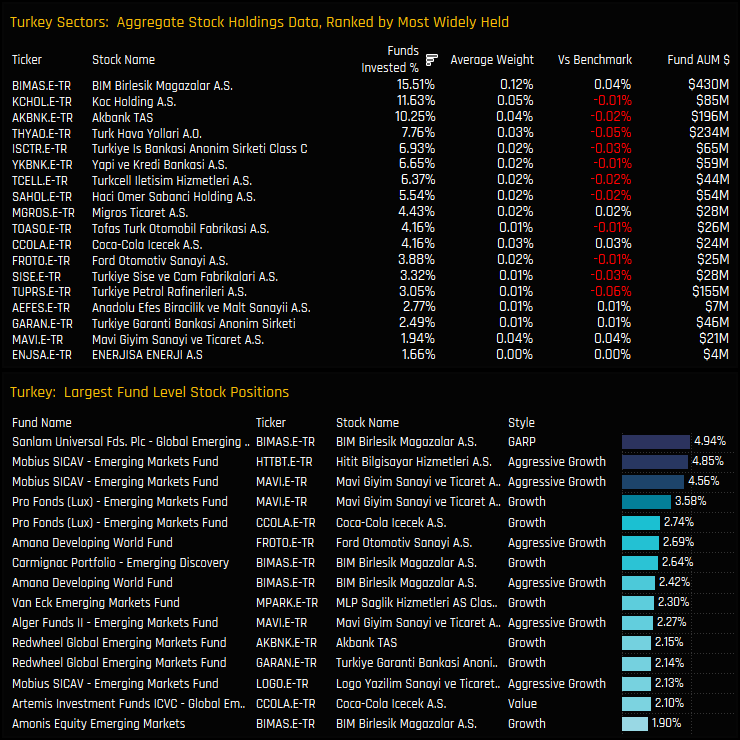
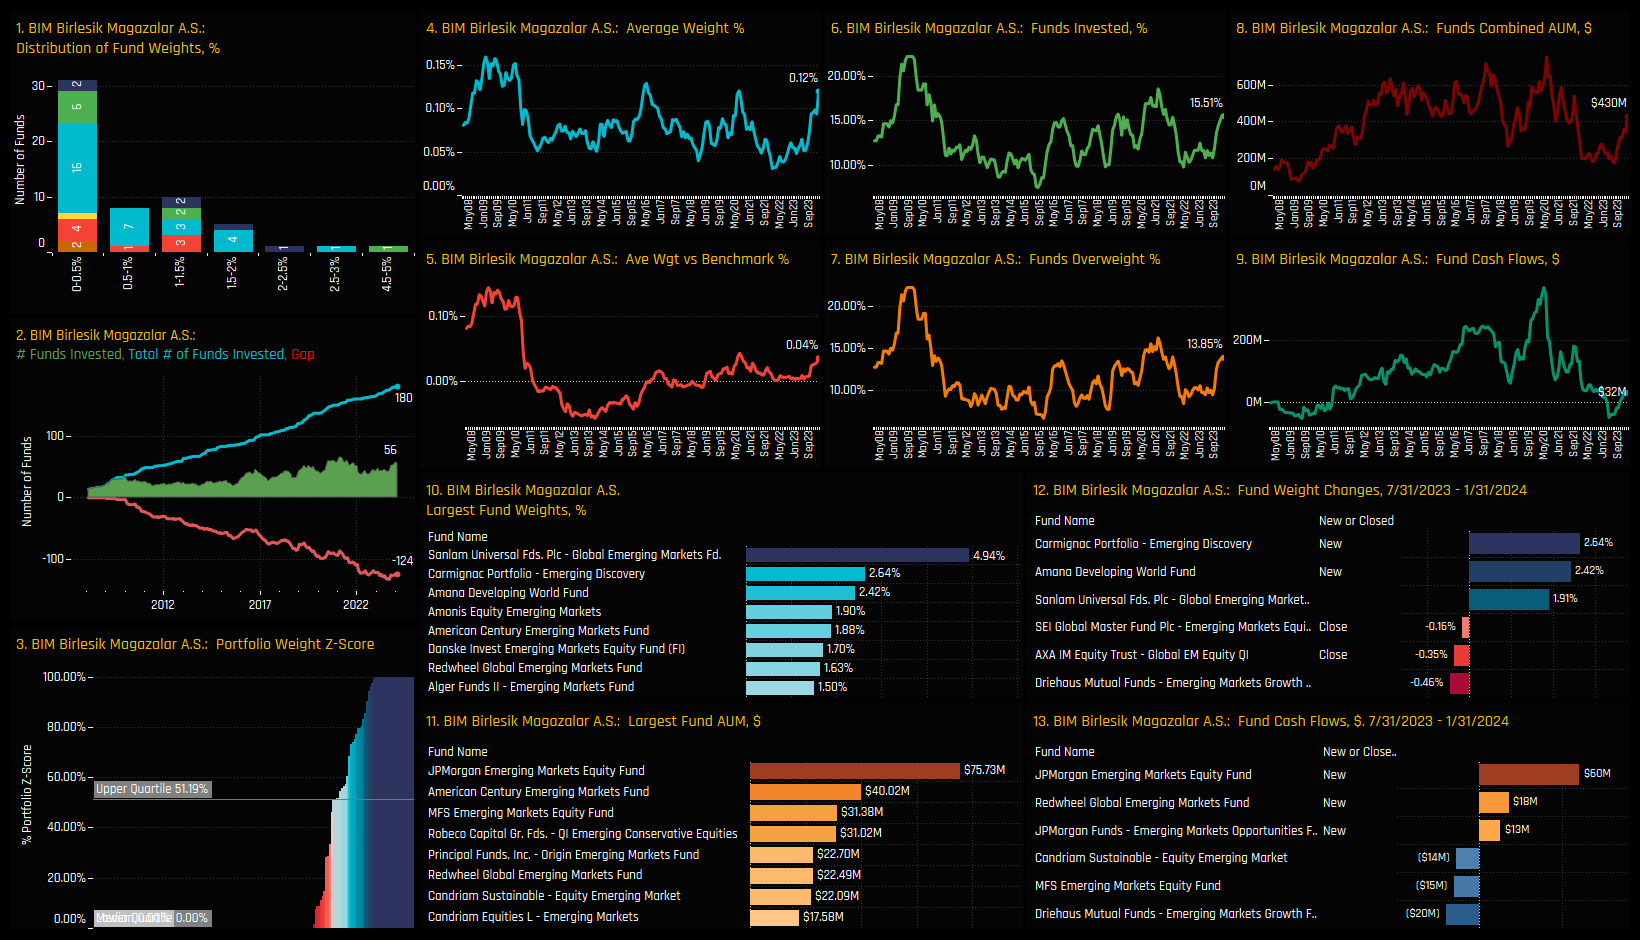
Considering the current limited engagement with the Turkish market, it’s unsurprising that stock positioning is light. BIM Birlesik emerges as the most popular stock, held by 15.5% of funds with an average weight of 0.12%. Only Koc Holding and Akbank surpass the threshold of being held by over 10% of funds in our analysis. On the fund level, as detailed in the lower chart, BIM Birlesik registers among the more substantial positions for funds like Sanlam, Carmignac, and Amana. Other notable holdings include Mavi Giyim Sanayi (held by Mobius and Pro-Fonds) and Coca-Cola Icecek (held by Pro Fonds and Artemis).

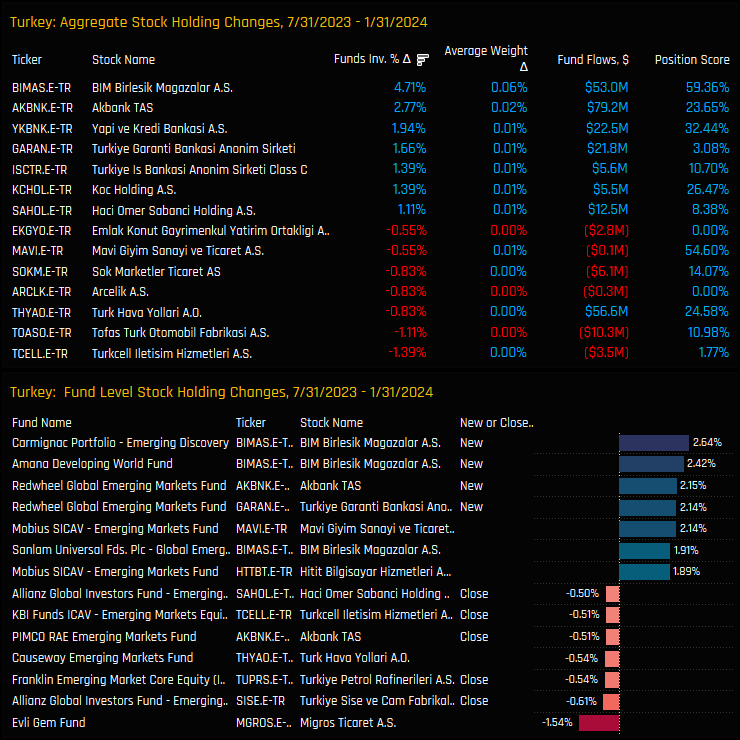
An analysis of stock-level activity over the past six months reveals the companies behind the positive shift in Turkish investor positioning. BIM Birlesik and Akbank led the way, with the percentage of funds invested increasing by +4.7% and +2.8%, respectively. Conversely, Turkcell Iletisim and Tofas Turk Otomobil experienced declines in ownership, albeit to a lesser degree.  At the fund level, notable moves include Carmignac and Amana initiating positions in BIM Birlesik, along with Redwheel opening positions in Akbank and Garanti Bank.

Stock Level Sentiment

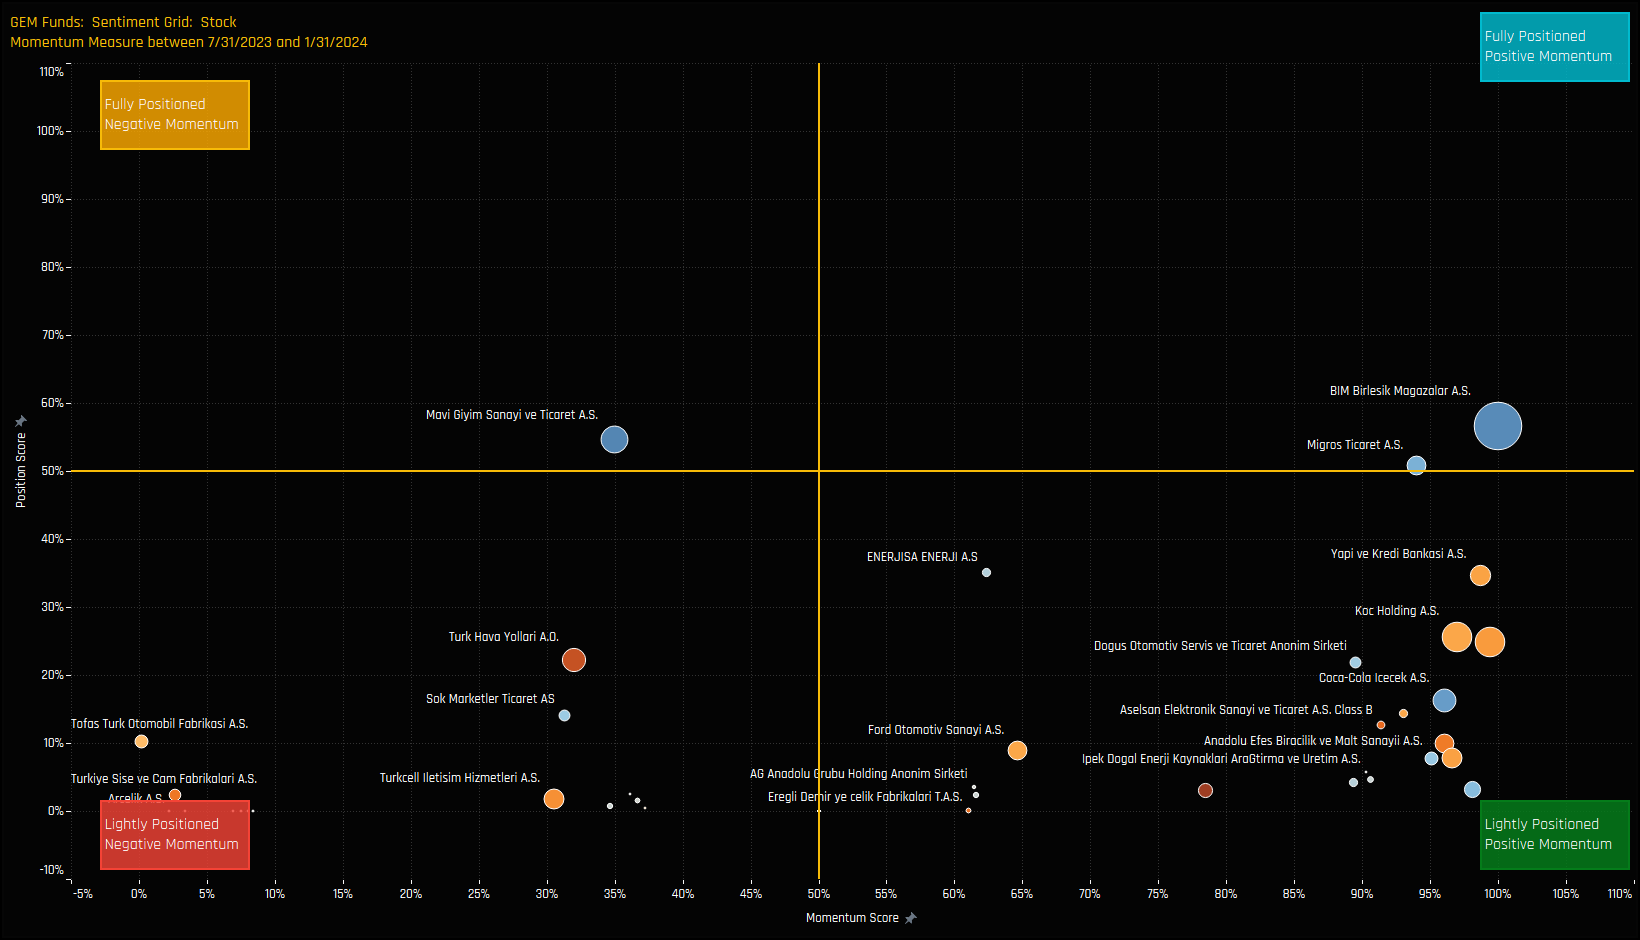
The Sentiment Grid below shows where positioning and momentum stand for all Turkish stocks in our universe.  Again, the Y-axis shows the ‘Position Score’, a measure of current positioning in each stock compared to its own history going back to 2008 on a scale of 0-100%. It takes in to account the percentage of funds invested in each stock and the average fund weight versus history. The higher the number, the more heavily a company is owned by active EM managers compared to its own history.

The X-Axis displays the ‘Momentum Score,’ which measures fund manager activity for each stock from July 31, 2023, to January 31, 2024, on a scale from 0% (maximum negative activity) to 100% (maximum positive activity). This score reflects changes in the percentage of funds invested and shifts in average weight. The majority of stocks are clustered in the bottom half of the Grid, and most are on the right hand side.  Investors are engaging with Turkish companies again after a long period of abstinence.  Scroll down for a more detailed profile of top holding, BIM Birlesik.

Stock Profile: BIM Birlesik

The Small/Midcap Tilt

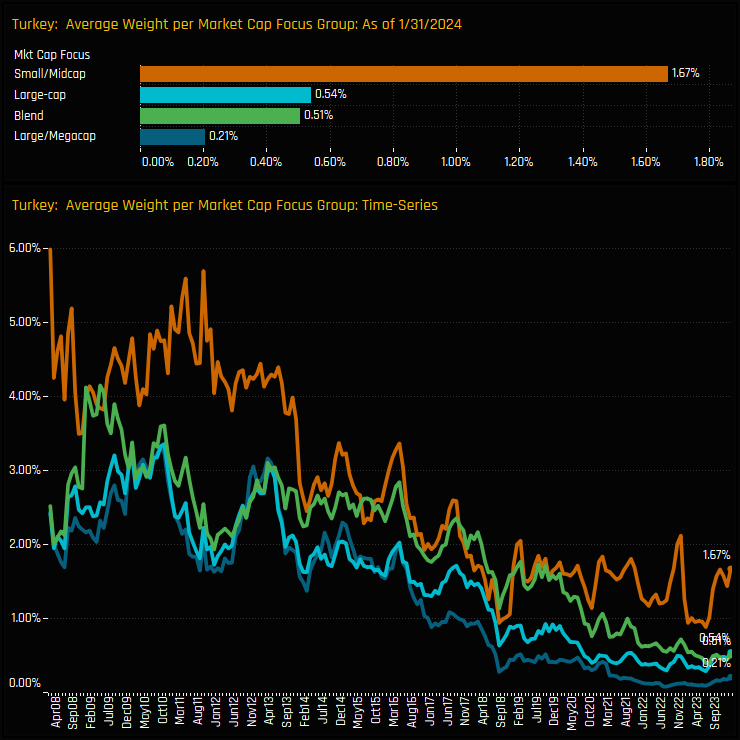
As highlighted above, a significant number of the leading investors in Turkey are classified as Small/Midcap funds. These funds allocate at least 60% of their portfolios to companies with a market capitalization below $10 billion. Within our universe of 361 funds, there are 18 that fit this classification. The charts below illustrate that these funds maintain a substantially higher allocation to Turkey compared to their larger-cap counterparts.

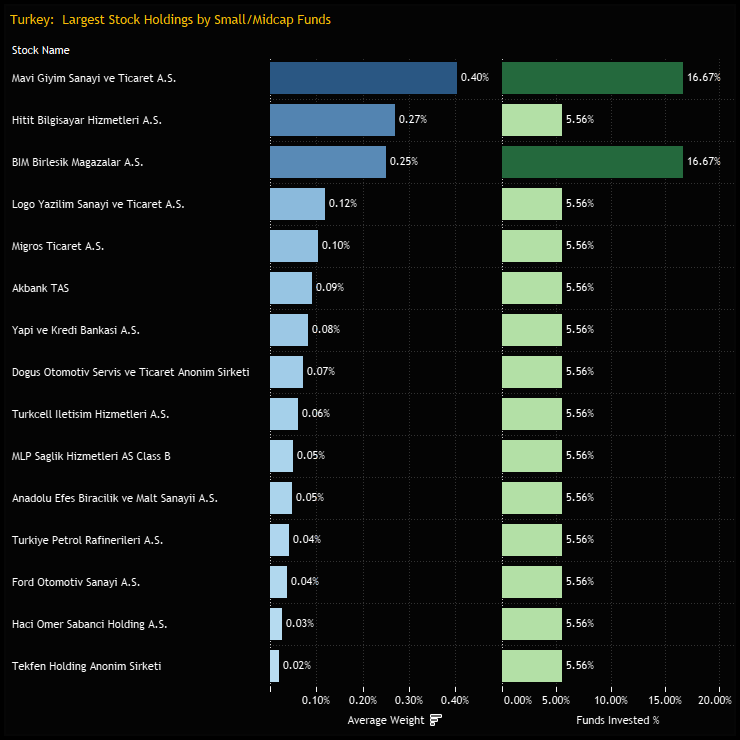
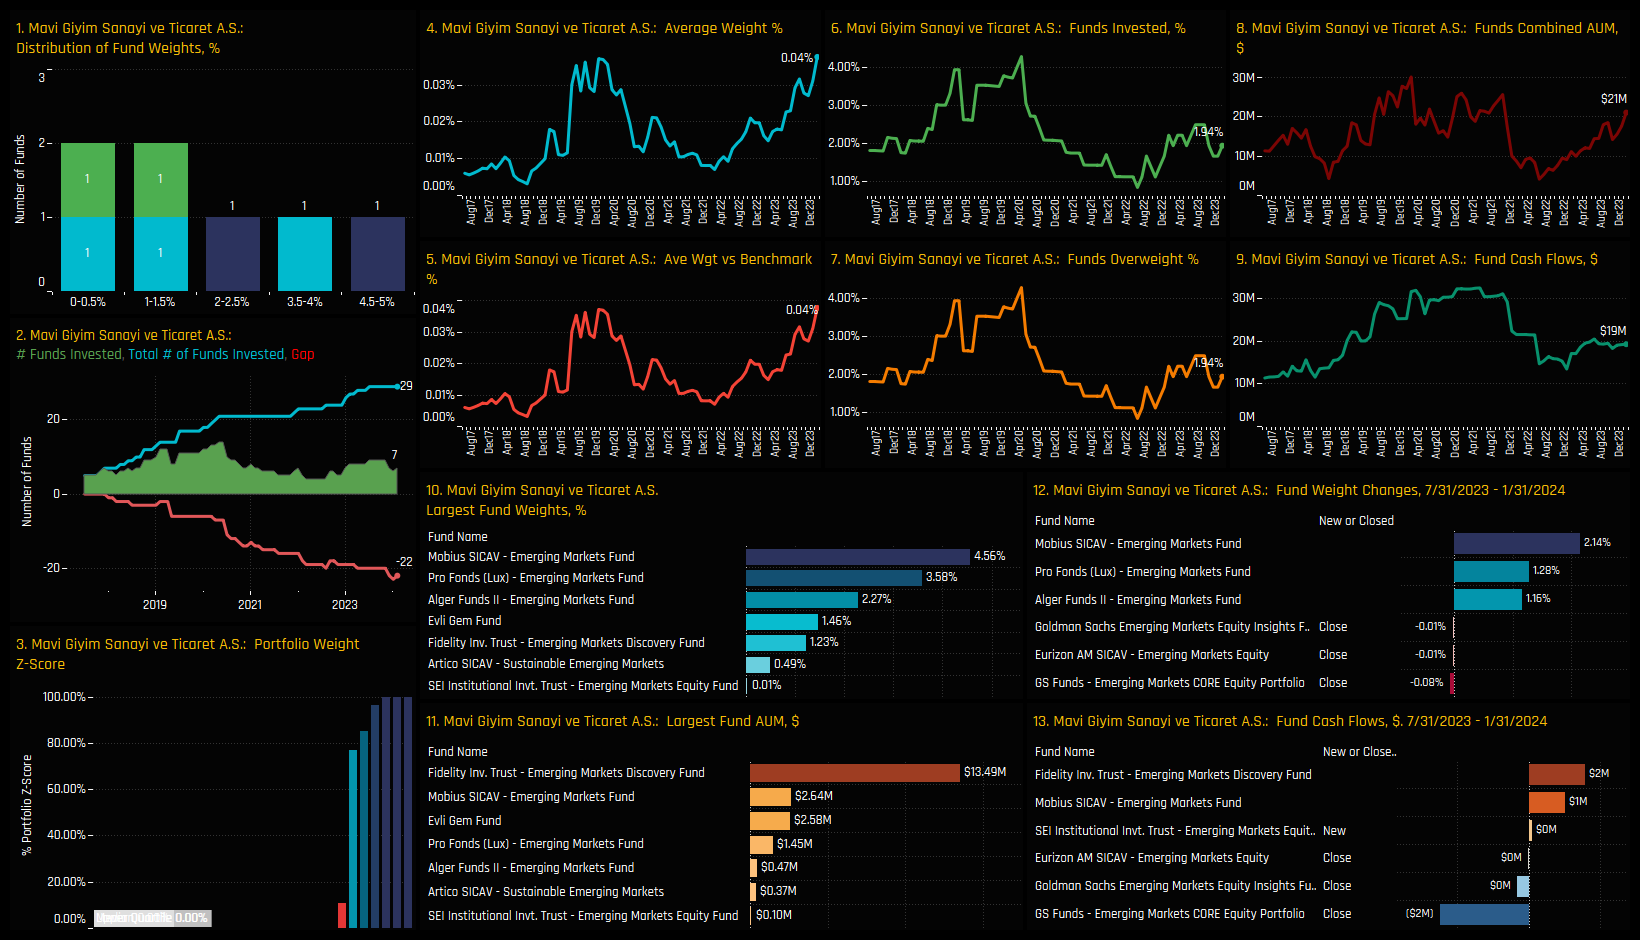
These Small/Midcap funds collectively invest in just 15 Turkish companies. The chart below details the percentage of these funds invested in each company and their average holding weight. BIM Birlesik and Mavi Giyim Sanayi emerge as the preferred stocks among these funds. We’ve provided a profile for Mavi Giyim Sanayi below, illustrating the holding trends across the entire dataset of 361 funds in our analysis.

Stock Profile: Mavi Giyim Sanayi

Gap Analysis

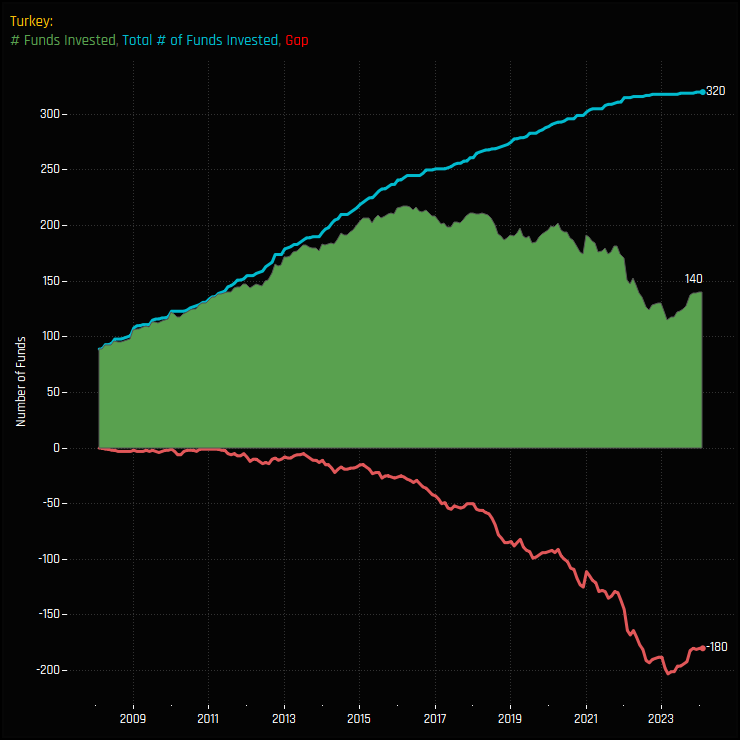
The Turkish investment narrative highlights two main points: firstly, a shift towards positive investor activity, and secondly, that current investment levels remain near historic lows. The two charts below provide additional context on these low investment levels. The first chart displays the total number of funds (out of 361) that have ever held a Turkish position (blue line), the number of funds invested at any one time (green line), and the difference, as indicated by the red line. Essentially, of the funds with a history of investing in Turkey, 180 are not currently invested.

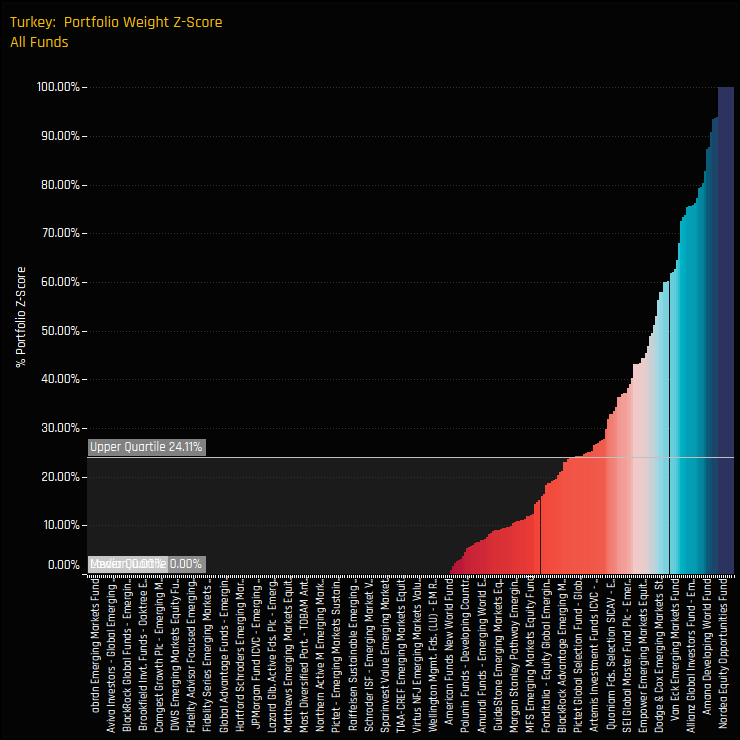
The chart below calculates the Z-Score for current fund weights in Turkey against all historical monthly observations since 2008, or since the fund’s inception. A Z-Score of 100% indicates the highest recorded weight, while a score of 0% marks the lowest. The chart  reveals that 75% of funds have a Z-Score below 24.1%.  Most funds are either not invested in Turkey or maintain minimal exposure relative to their historical positions.  However, a select few funds are more bullishly positioned, with exposure levels nearing their maximum. Further details on these funds can be found in the PDF (page 20), accessible via the link at the end of the report.

Conclusions

Sentiment towards the Turkish market has taken a notable shift in recent months.  Our data points to a cautious yet growing appetite to increase allocations, particularly among Small/Midcap funds, and reflected in the investment patterns of stocks like BIM Birlesik, Akbank and Mavi Giyim Sanayi, which have emerged as strategic holdings.

Turkey joins a list of 5 countries in the EMEA region that are following a path of investment growth.  The chart opposite shows the average fund weights for Saudi Arabia, Poland, UAE, Turkey, and Greece over time — with Turkey participating in the upward trend, yet even with the recent reversal in fortunes remains the lowest allocation of the group.

The combination of cautious optimism, low current allocations, and a significant track record of investment by emerging market managers suggests potential for further growth in Turkey. With increased scrutiny on some of the larger EM country allocations, notably China, Turkey is once again gaining attention as a compelling alternative within the Global EM landscape. 

The emphasis for active managers remains on careful engagement and selective exposure, ensuring that Turkey’s promising investment opportunities are weighed against its inherent macroeconomic uncertainties.

For more analysis, data or information on active investor positioning in your market, please get in touch with me on steven.holden@copleyfundresearch.com


Terms and Conditions

Investor Positioning Report — Copley Fund Research Ltd  ·  Last updated: July 2026  ·  Registered in England and Wales

1. Who we are

Copley Fund Research Ltd provides proprietary institutional fund intelligence to listed companies and investor relations professionals. These terms govern every purchase of an Investor Positioning Report. By completing a purchase you confirm you have read, understood, and agreed to these terms in full.

2. What you are purchasing

The Investor Positioning Report is a bespoke PDF report mapping the institutional fund universe around your stock. It covers current investors, past investors, competitor investors, and white space investors. Every report is built from scratch for the specific company ordered and is not a standardised or templated product.

3. Delivery and process

Following payment or invoice issuance, Copley Fund Research will contact you within one working day to agree your competitor set. Production begins once the competitor set is confirmed in writing. The completed report will be released to you within 48 hours of production starting, provided payment has been received in full; where payment is outstanding, the report will be withheld until payment clears. If the requested company falls outside our covered fund universes, or a competitor set cannot be agreed, Copley Fund Research will issue a full refund or cancel the outstanding invoice.

4. Competitor set agreement

The competitor set is agreed with you in writing prior to production, and the report is built to that agreed specification. Requests to amend the competitor set after delivery, based on a change of preference rather than an error, may be treated as a new order.

5. Refund policy

Because each report is produced individually for your company, orders are non-refundable once production has begun, except as set out in clauses 3 and 5a below. By purchasing, you agree not to dispute the charge with your card provider on the basis that the service was not as described, provided the report has been delivered to the agreed specification or corrected under clause 5a.

5a. Quality remedy

If a delivered report contains a material error caused by Copley Fund Research — for example, an incorrect company analysed, a competitor omitted from the agreed set, or content missing from the specification in clause 2 — Copley Fund Research will correct and redeliver the report at no additional charge, within a reasonable timeframe. This is your sole remedy for such errors.

6. Data and accuracy

All fund positioning data in the report reflects holdings as disclosed at the most recently available reporting date at the time of compilation. The timing of fund holdings disclosures is determined by regulatory requirements applicable to each fund and is outside the control of Copley Fund Research Ltd. This data may not reflect current fund positions. Copley Fund Research takes reasonable care to ensure accuracy but makes no warranty, express or implied, as to the completeness or current accuracy of the underlying data — though this does not affect the quality remedy in clause 5a for errors in how that data was analysed or presented. Past fund positioning is not indicative of future fund behaviour or investment decisions.

7. Not investment advice

The Investor Positioning Report is produced for investor relations intelligence purposes only. It does not constitute investment advice, financial advice, or a recommendation to buy, hold, or sell any security. The data reflects historical fund positioning and must not be relied upon as a prediction of future fund behaviour or investment decisions. Copley Fund Research Ltd is not authorised or regulated by the Financial Conduct Authority for the provision of investment advice.

8. Permitted use and confidentiality

The report is licensed for internal use by the purchasing organisation only. You may share it with employees and directors of your organisation. You may not: reproduce, redistribute, publish, or resell the report or any part of it; share it with any third party outside your organisation without prior written consent; use the fund or portfolio manager names contained in the report to approach those individuals on behalf of Copley Fund Research or in a manner that could damage Copley Fund Research's relationships with those funds; or use the data for any purpose other than your own investor relations strategy. The data, analysis, and methodology contained in the report are the intellectual property of Copley