• LATAM Momentum: MercadoLibre leads regional allocations higher.
• Consumer Staples: Allocations fall to lowest levels on record, but optimism remains.
• China: Darkest before the Dawn? Sentiment plunges to new depths.
• Salesforce Hits New Highs: Strong rotation drives Salesforce up the Tech rankings.
• The latest stock activity data for Global equity funds over the last 6-months.
340 Global Equity Funds, AUM $1tr
LATAM Momentum
MercadoLibre leads regional allocations higher.
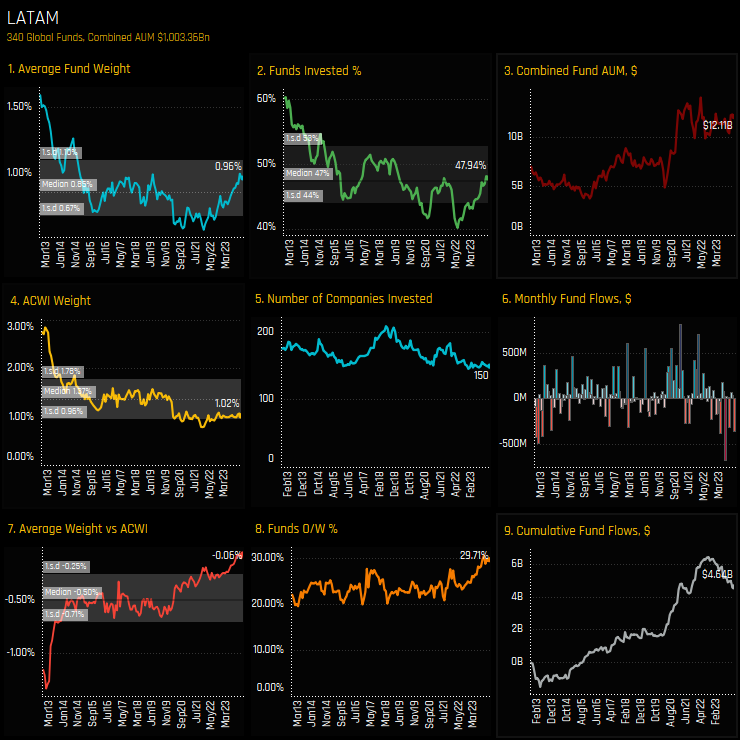
LATAM allocations are on the rise among active Global Equity funds. The chart set below illustrates the progression of LATAM allocations and ownership since 2012. After flatlining for much of the period 2014-2022, a strong increase in average fund weights (ch1), the percentage of funds invested (ch2) and the percent positioned overweight (ch8) has occurred over the last 2-years. This is against a static trend for the benchmark iShares MSCI ACWI ETF.
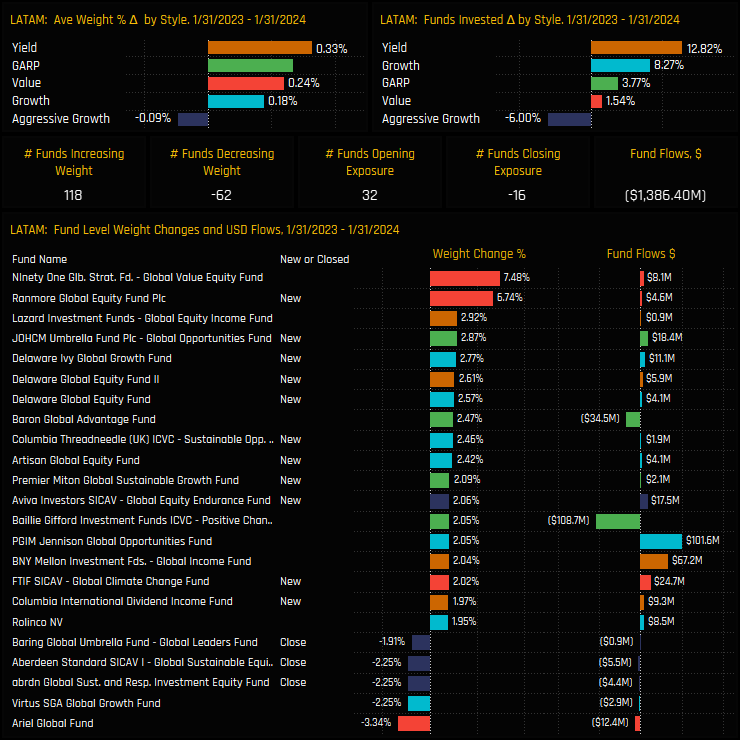
Chart set 2 below details the fund activity driving this trend. In the past six months, 32 funds have initiated new LATAM positions, while 16 have exited, with Yield managers showing a particular appetite for new exposure. Notable increases in allocations include Ninety One Global Value (up 7.5%) and Ranmore Global Equity (up 6.7%), with smaller contributions from Lazard, Delaware, and JOHCM offsetting the exits by growth-focused funds from Barings and Aberdeen.
1. Time Series Analysis
2. Fund Activity
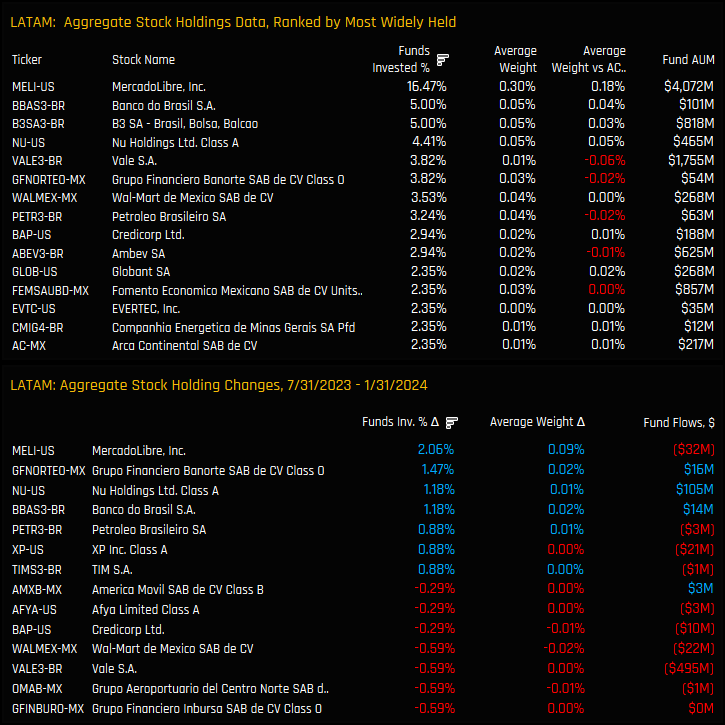
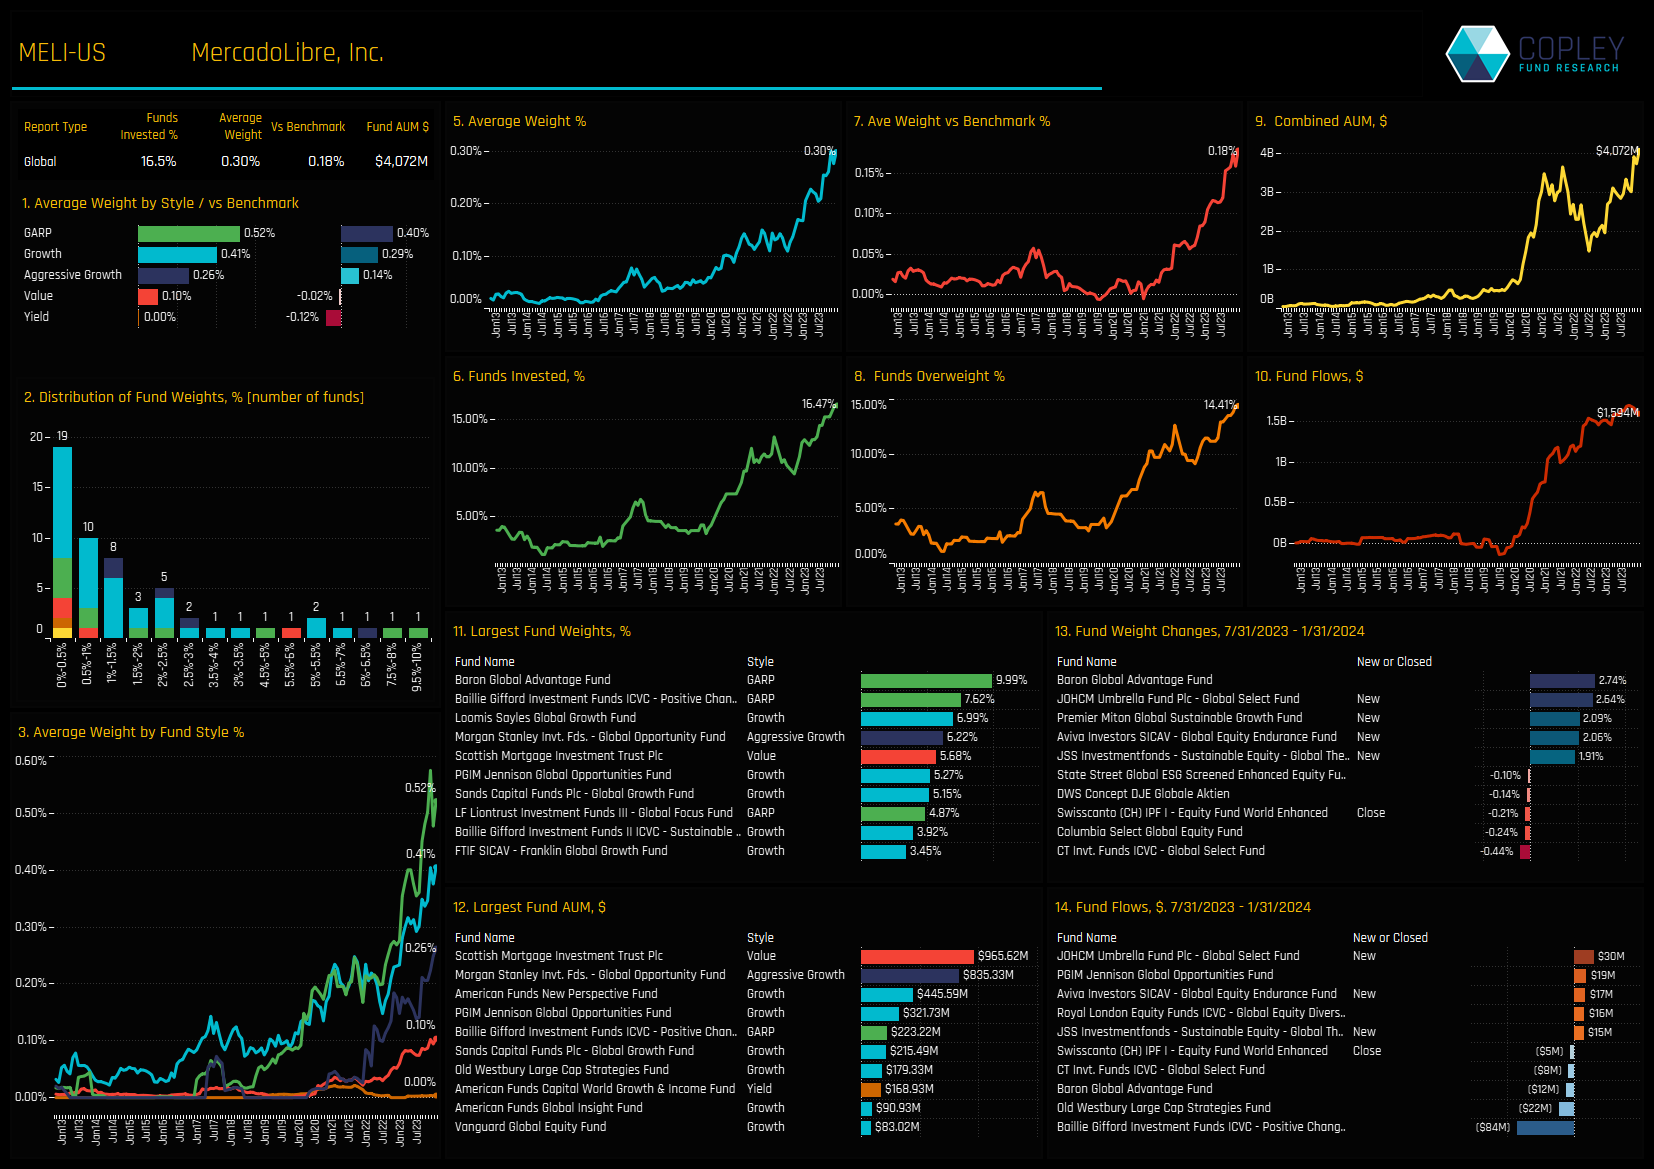
Chart set 3 shows the stock level holdings that underpin the current 0.96% allocation. MercadoLibre is the conviction holding in the region, held by 16.5% of Global equity funds at an average weight of 0.3%. After this, holdings are thin on the ground, with just 5% holding Banco do Brasil and B3 SA. Stock activity over the last 6-months has favoured MercadoLibre, with a further 2% of funds adding to exposure, but marginal closures were captured across a number of stocks such as Vale S.A and Wal-Mart de Mexico.
Despite these signs of growing interest in the region, LATAM’s share in global investment portfolios remains minimal. The concentration of investments predominantly in MercadoLibre, along with the fact that a majority of Global funds opt not to invest in the region at all, indicates that there is considerable ground to cover before LATAM investments significantly influence overall asset class performance.
Please click on the link below for a comprehensive data pack on LATAM positioning among Global funds. Scroll down for a more detailed profile of MercadoLibre
Allocations fall to lowest levels on record, but optimism remains.
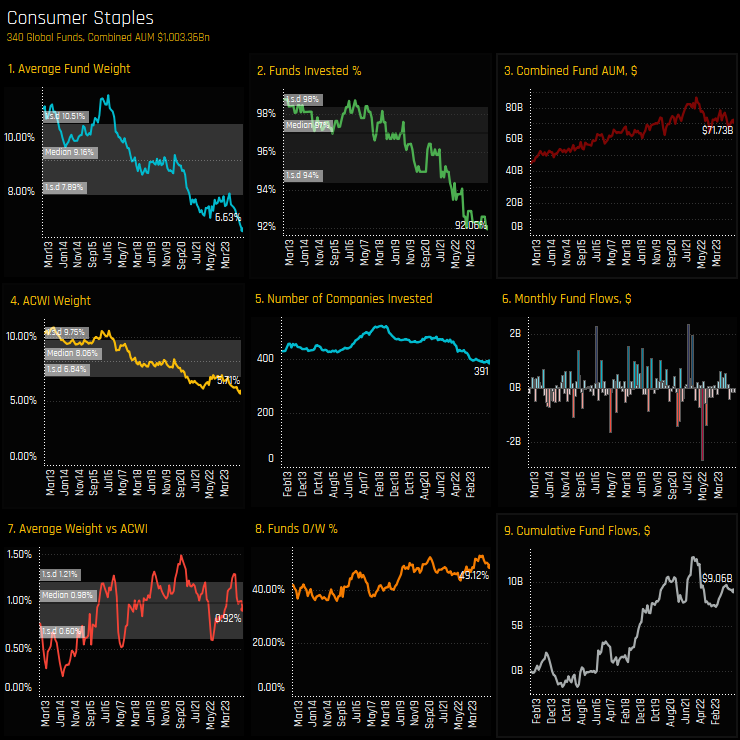
Global equity funds are running their lowest allocation to the Consumer Staples sector since our records begin in 2012. The chart set below documents the decline, with average active fund weights (ch1) and benchmark weights (ch4) falling to new lows over the past year, suggesting that price has been a key driver of the decline. However, the fact that overweights have reduced (ch7) and the percentage of funds invested is at new lows (ch2) infers there has been an active element to the recent moves.
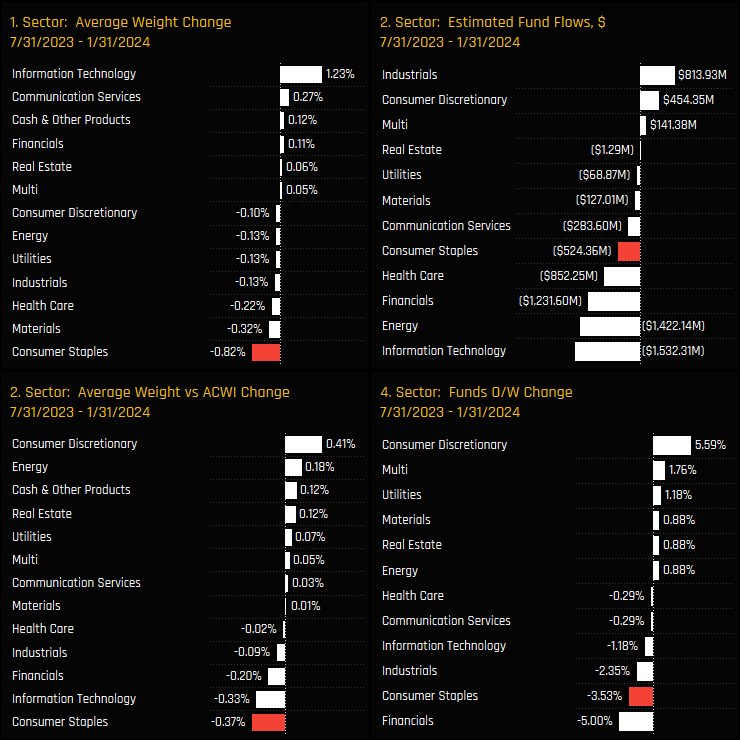
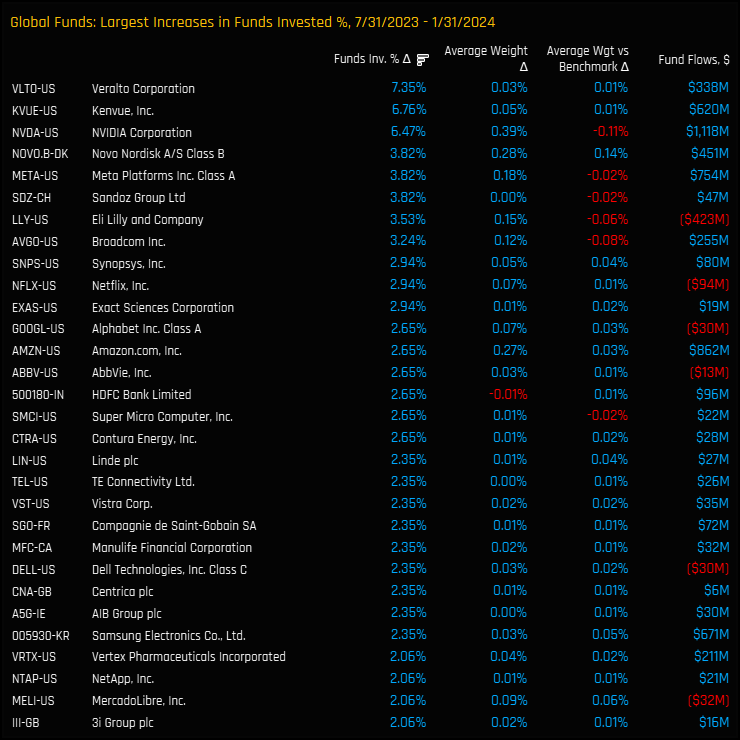
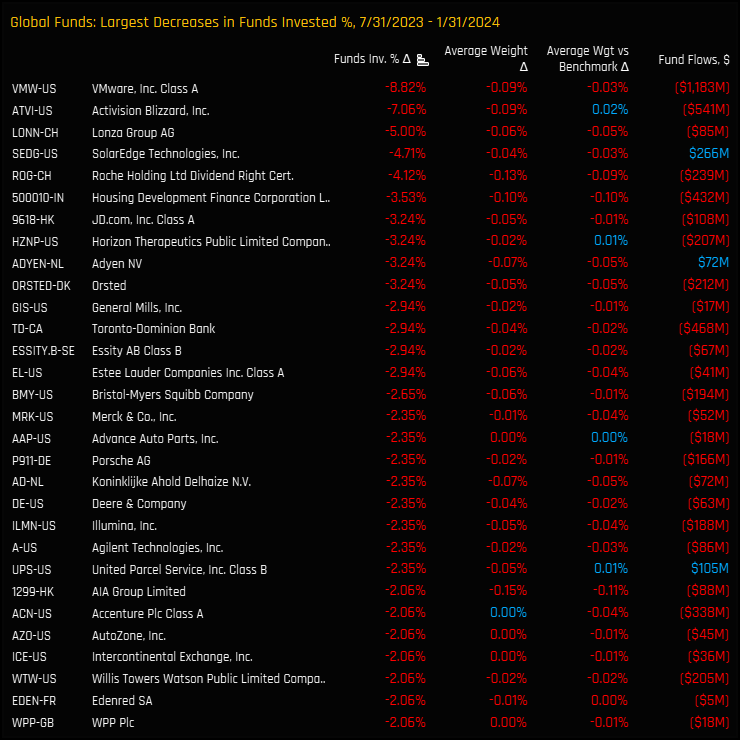
Chart set 6 below shows the changes in sector exposure and ownership between 07/31/2023 and 01/31/2024. The drop in Consumer Staples weights of -0.83% was the highest among sector peers, as Global funds instead saw Technology weights rise by +1.23% over the period. With $6bn in net fund outflows for the asset class, most sectors saw net selling activity, but evidence there was an active part to the rotation can be seen in the -3.5% of funds switching from an overweight to an underweight over the period, but this is far from a full scale exodus.
5. Time Series Analysis
6. Sector Rotation
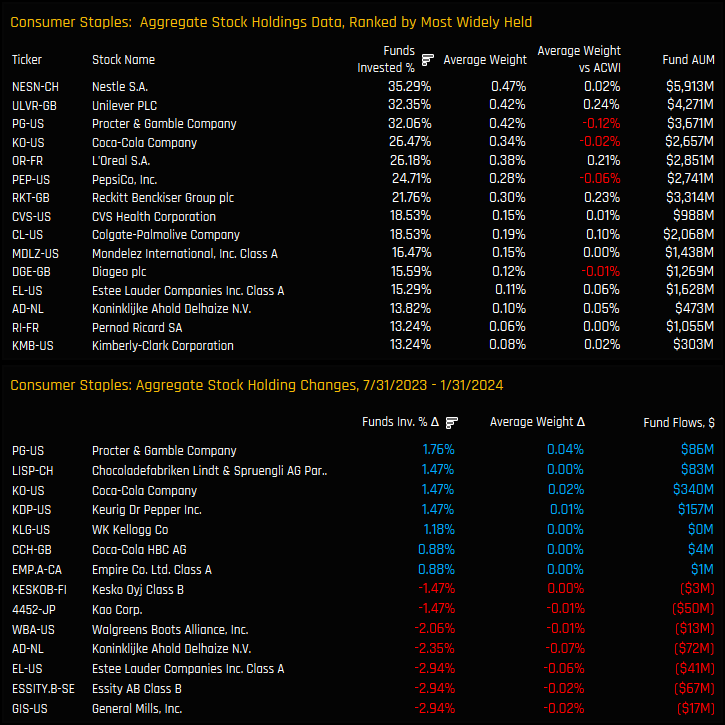
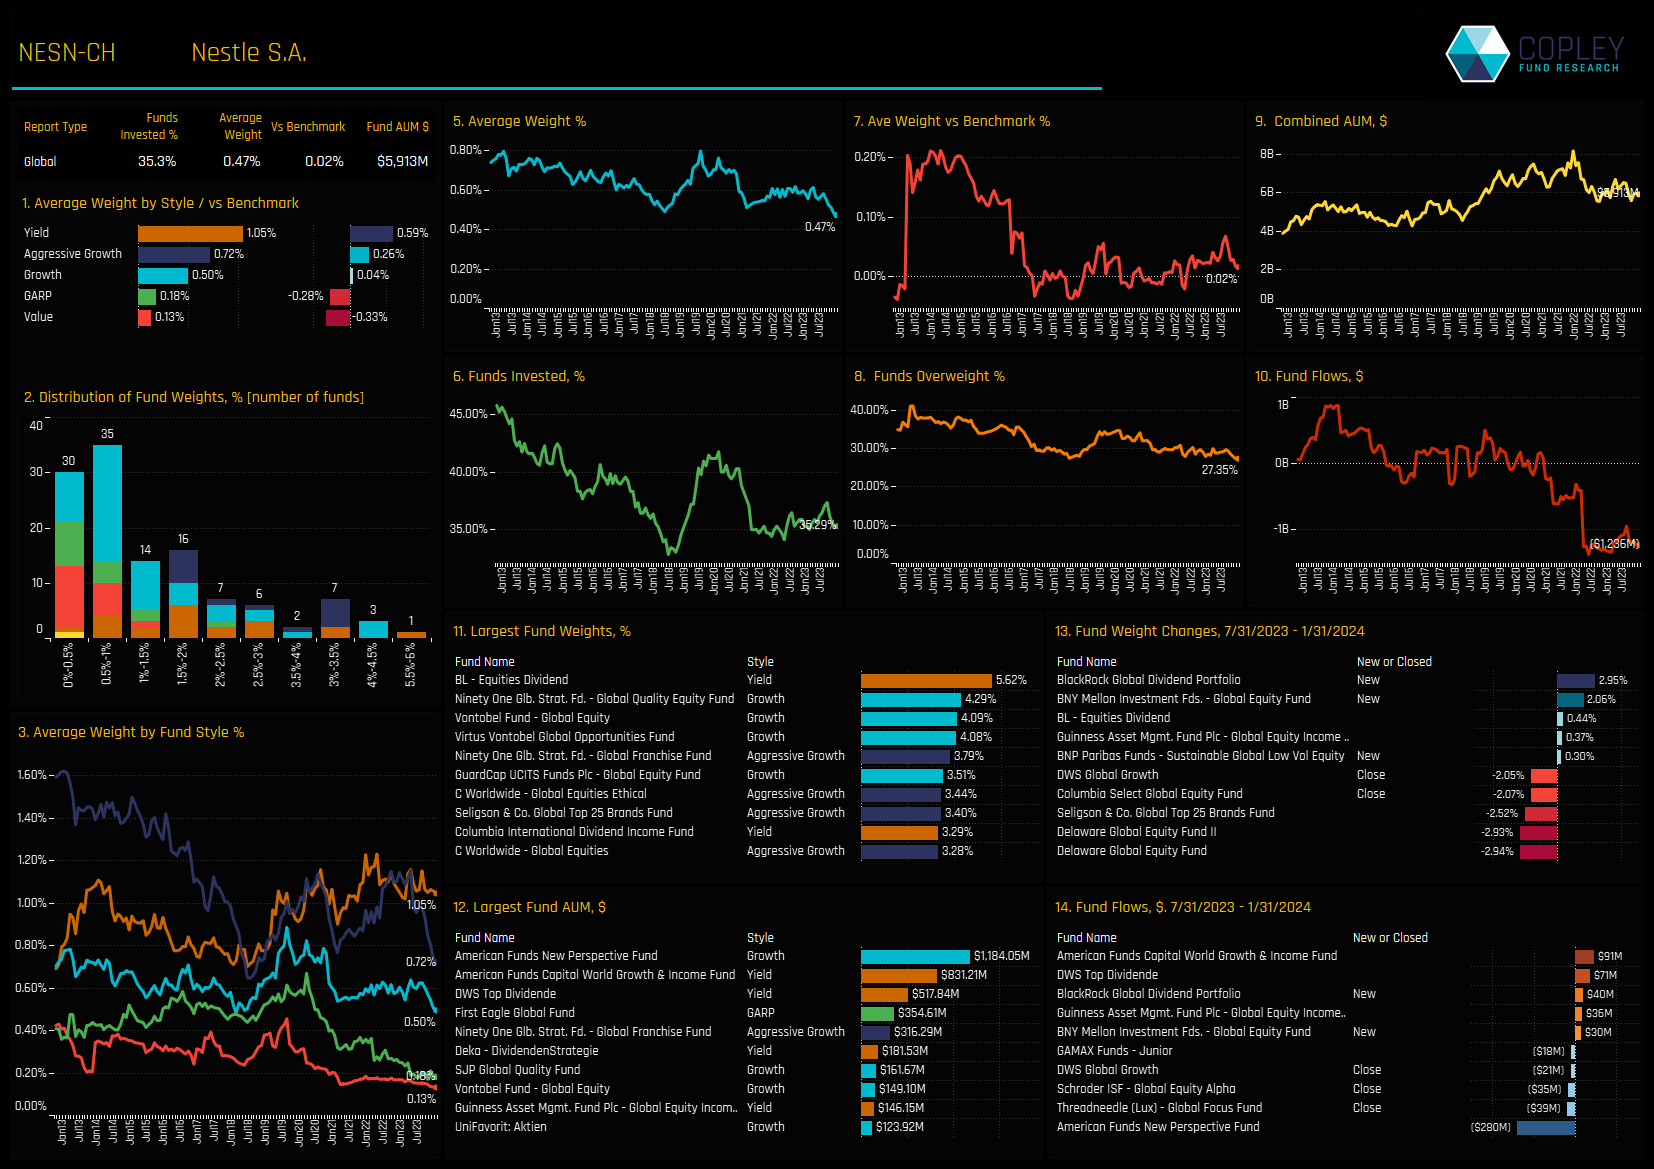
Chart set 7 shows the stock level holdings that underpin the current 6.6% allocation, and the stocks that have driven allocations lower. The trio of Nestle S.A, Unilever PLC and Proctor & Gamble Company are the dominant stock positions, all held by around a third of funds and at similar average weights. Stock activity was skewed to the sell-side, but not exclusively so. Decreases in ownership in General Mills, Essity and Estee Lauder Companies were partially offset by increases in Proctor & Gamble, Coca-Cola Company and Keurig Dr Pepper.
This selective activity, coupled with the fact that funds are still net overweight, suggests that despite the overall reduction in sector allocations, fund managers remain selectively positive.
Please click on the link below for a comprehensive data pack on Consumer Staples positioning among Global funds. Scroll down for an analysis of Stock Sentiment within the Consumer Staples sector, and a more detailed profile of Nestle S.A.
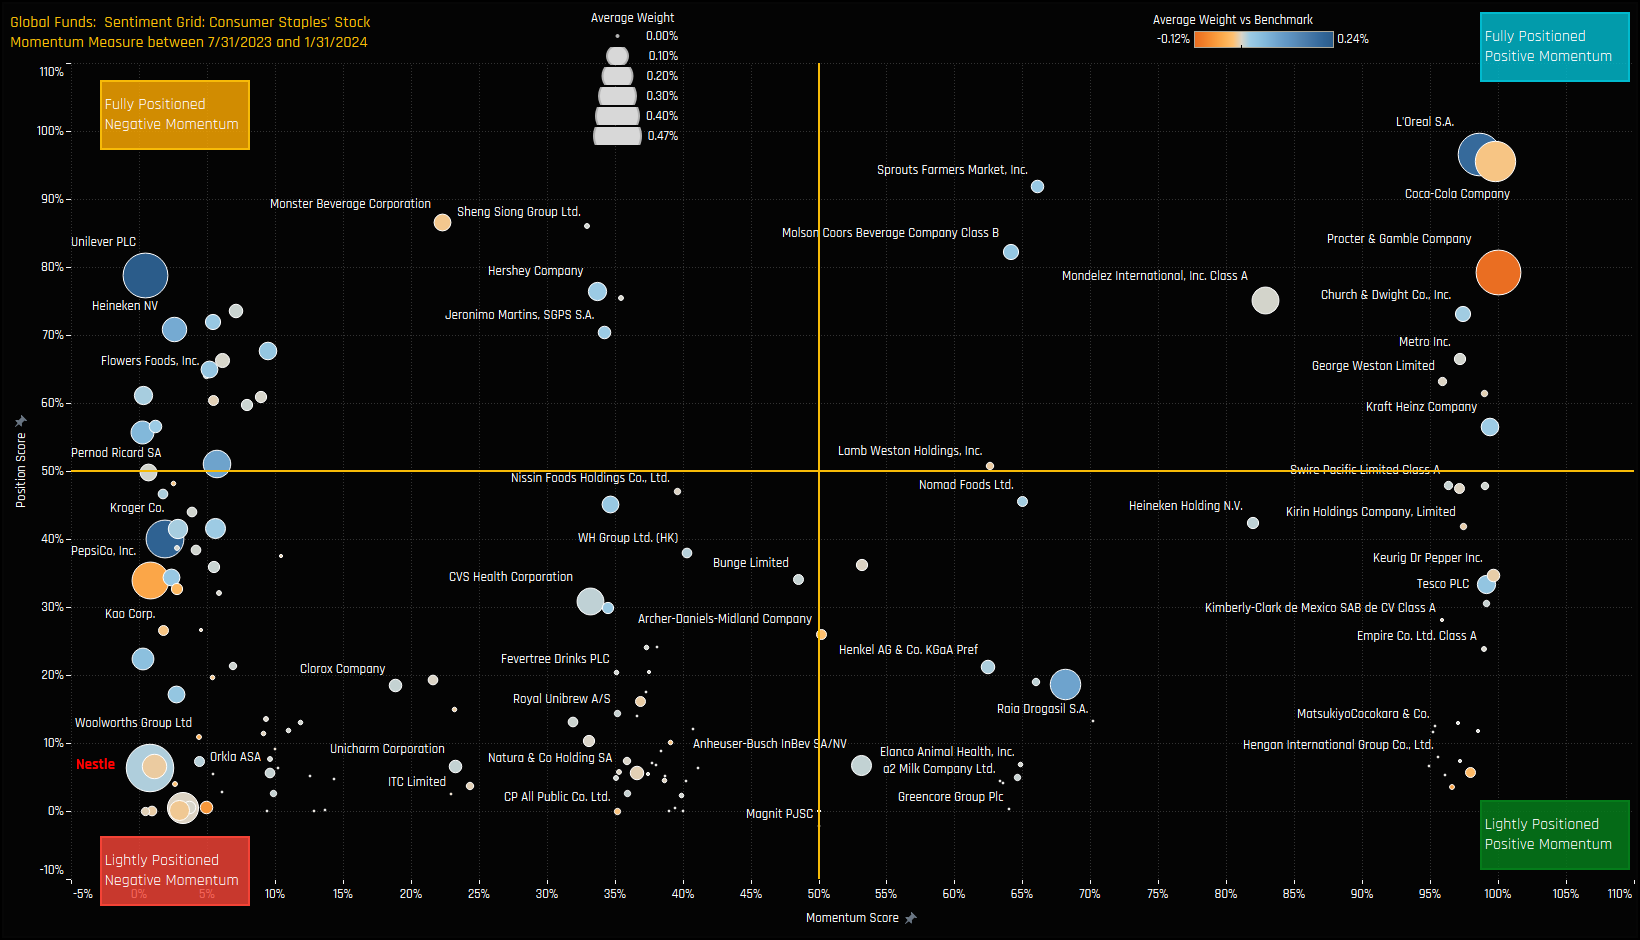
The Sentiment Grid below shows where positioning and momentum stand for all stocks in the Consumer Staples sector. The Y-axis shows the ‘Position Score’, a measure of current positioning in each stock compared to its own history going back to 2012 on a scale of 0-100%. It takes in to account the percentage of funds invested in each stock and the average fund weight versus history. The higher the number, the more heavily a company is owned by active EM managers compared to its own history. The X-Axis displays the ‘Momentum Score,’ which measures fund manager activity for each stock from July 31, 2023, to January 31, 2024, on a scale from 0% (maximum negative activity) to 100% (maximum positive activity). This score reflects changes in the percentage of funds invested and shifts in average weight.
The chart serves to highlight the split in sentiment across the different companies in the ‘Staples universe. Stocks such as LÓreal, Coca-Cola Company and Procter & Gamble are near maximum levels of exposure whilst still experiencing net increases in ownership, hence their position in the top-right hand quadrant. Unilever and Pernod Ricard are in the top-left quadrant, indicative of strong positioning yet selling from the managers in our analysis. Stocks seeing buying from a low base include Tesco PLC, Keurig Dr Pepper and Kraft Heinz Company. But Nestle S.A is perhaps the standout, a well owned stock that is in the far bottom-left corner of the Grid, with ownership levels continuing to fall as exposure levels move to all-time lows. Scroll down for a more detailed profile on Nestle S.A
9. Stock Profile: Nestle S.A.
340 Global Equity Funds, AUM $1tr
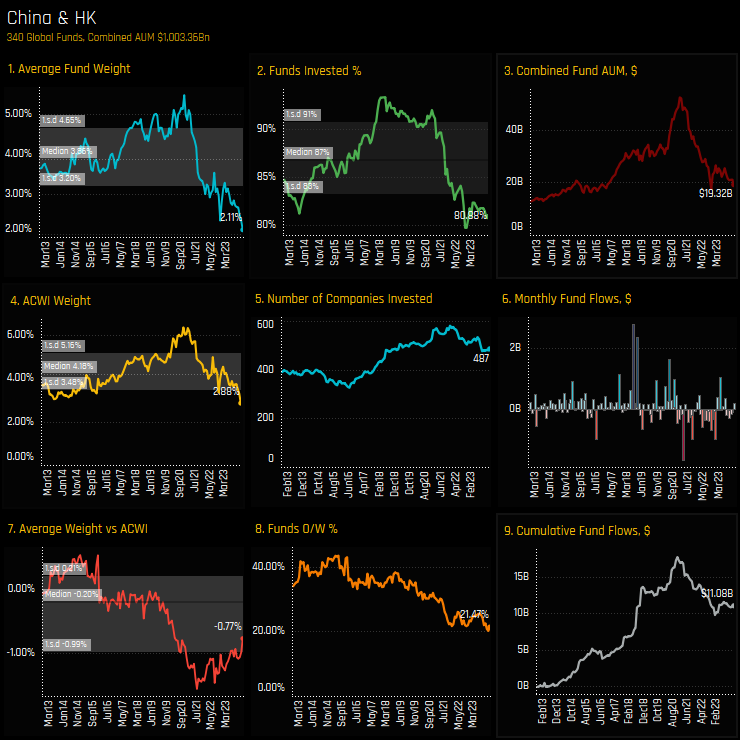
China: Darkest before the Dawn?
Chinese equity ownership by Global equity funds has reached an all-time low. Average allocations to China & HK stocks now stand at just 2.11% (ch1), with only 21.47% of funds positioned ahead of the SPDRs MSCI ACWI ETF (ch8). Among the 340 Global funds in our analysis, 19.2% exclude China & HK entirely (ch2), and the number of invested companies has decreased from 600 to 487 (ch5).
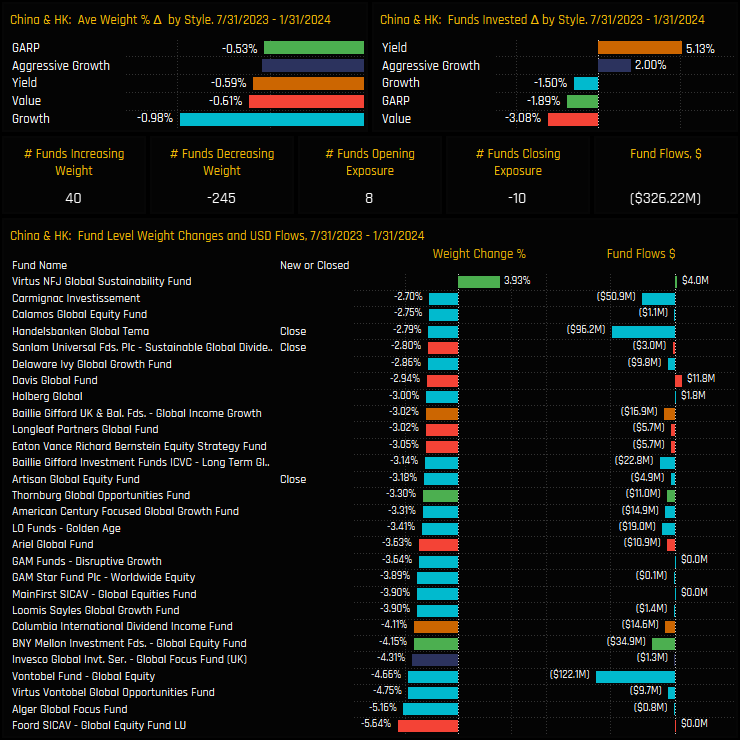
Chart set 11 below details the fund activity driving this trend. In the past six months, 245 funds have seen their China & HK weights decline, with just 40 increasing weights. But within these figures there are some positive signals. Though 10 funds closed exposure over the period, 8 opened new exposure. On a Style basis, the percentage of funds invested in China & HK fell for Value, GARP and Growth funds, but increased for Aggressive Growth and Yield managers.
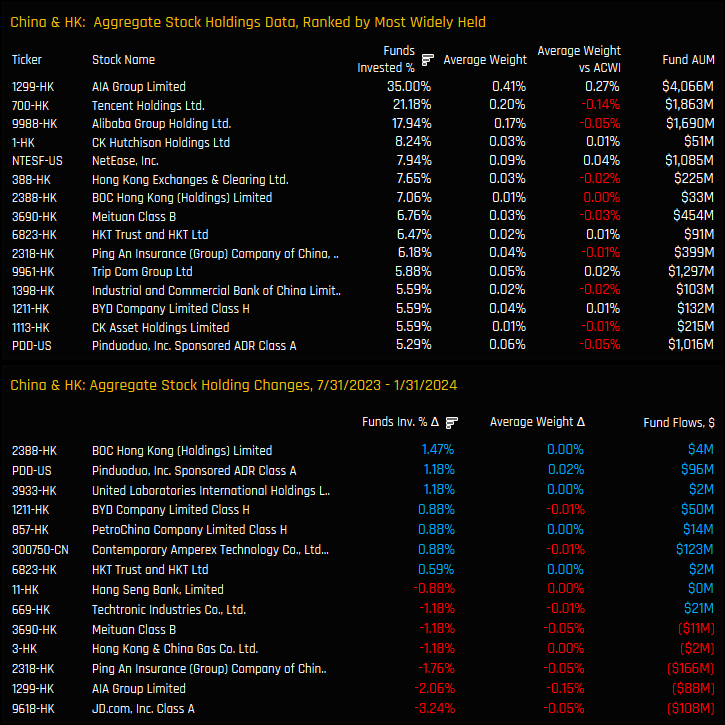
Chart set 12 documents the stock holdings picture for China & HK equities. Investment concentration in China & HK equities, notably in Tencent, AIA Group, and Alibaba Group, highlights a significant reliance on a few key stocks. Combined they account for 37% of the total China & HK allocation, with no other stock owned by more than 9% of funds. Activity has leaned towards the sell-side, particularly in JD.Com, AIA Group, and Ping An Insurance, but selected funds have upped their stakes in BOC Hong Kong and Pinduoduo Inc.
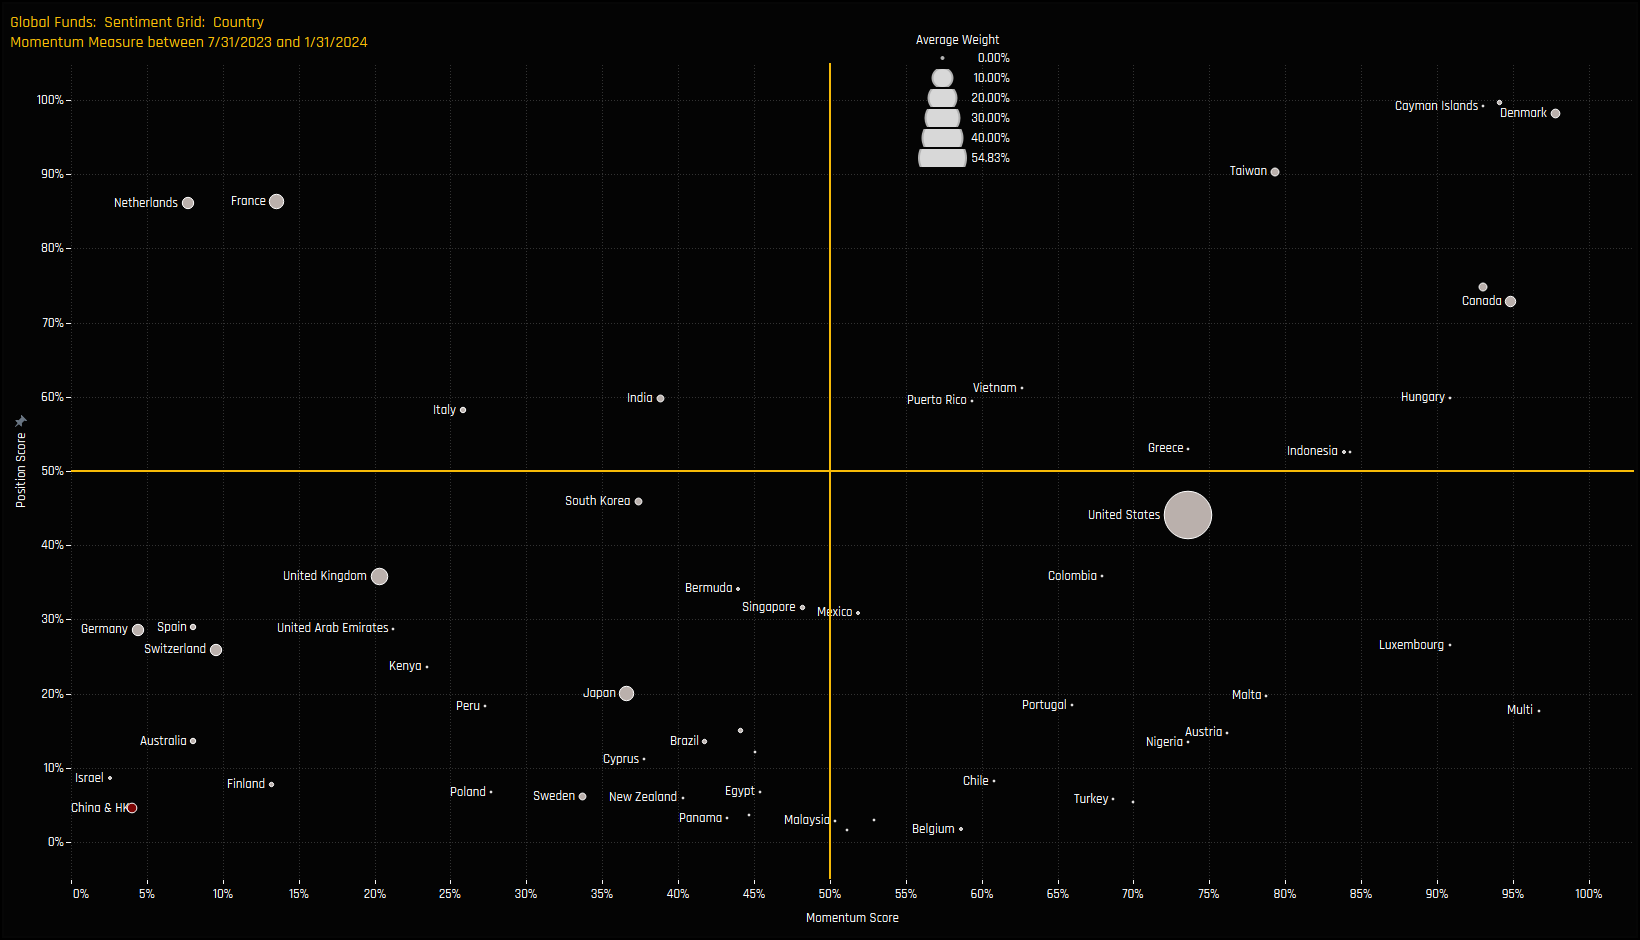
Chart 13 below shows the Sentiment Grid for all countries in the Global investible universe. China’s position in the far far bottom left corner is indicative of where sentiment is for China right now. Record low positioning, continued underperformance and net selling among managers has pushed China to new grounds. Considering the adage ‘it’s always darkest before the dawn,’ the current positioning set up in China & HK could hardly be darker, signaling a potential pivotal moment for investors.
The Sentiment Grid below shows where positioning and momentum stand for all countries in the Global investible universe. The Y-axis shows the ‘Position Score’, a measure of current positioning in each country compared to its own history going back to 2012 on a scale of 0-100%. It takes in to account the percentage of funds invested in each country, the percentage overweight and the average fund weight versus history. The higher the number, the more heavily a country is owned by active EM managers compared to its own history.
The X-Axis displays the ‘Momentum Score,’ which measures fund manager activity for each country from July 31, 2023, to January 31, 2024, on a scale from 0% (maximum negative activity) to 100% (maximum positive activity). This score reflects changes in the percentage of funds invested, the percentage positioned overweight the benchmark and shifts in average weight.
340 Global Equity Funds, AUM $1tr
Salesforce Hits New Highs
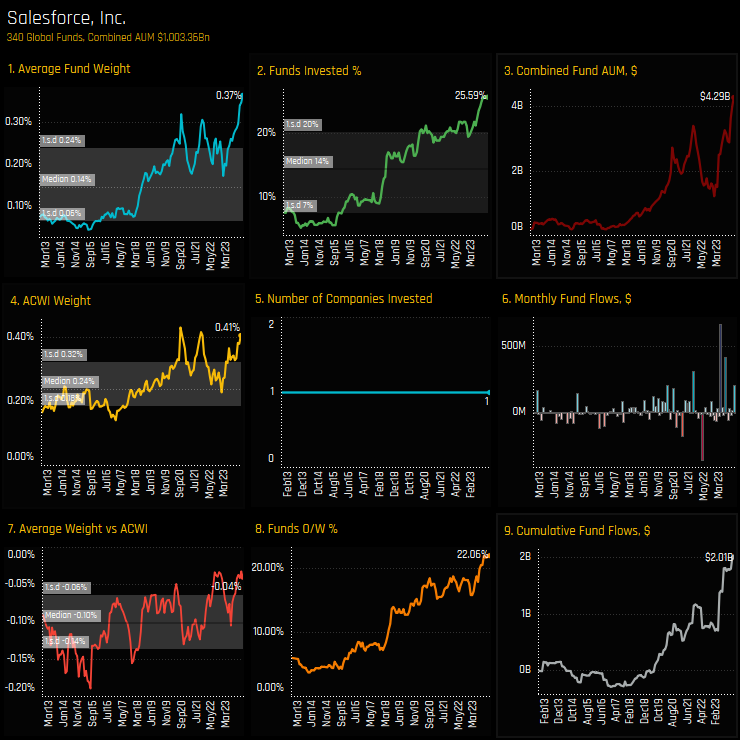
Global equity fund ownership in Salesforce, Inc has soared to new highs. Record average fund weights of 0.37% have been driven higher by an increasing number of funds buying in to the stock. With $1.2 billion in fund inflows over the last year, a record 25.6% of the funds in our analysis now own Salesforce, Inc., representing a combined invested AUM of $4.3 billion.
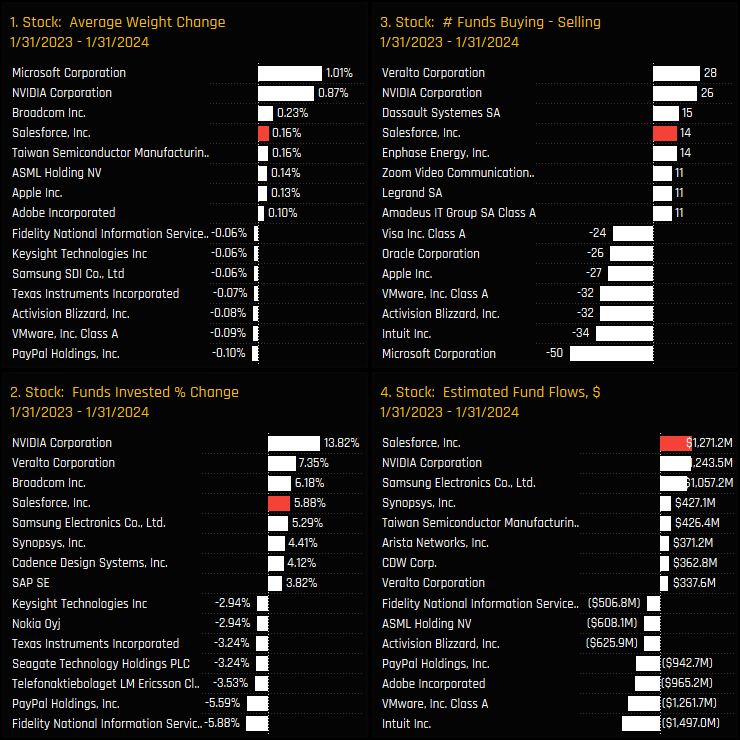
Chart set 15 below details the changes in stock exposure and ownership for companies in the Information Technology sector over the last 12 months. Salesforce, Inc has been a key beneficiary of rotation, with positive fund flows, an increase in funds invested, an increase in average fund weight and an excess of buyers over sellers.
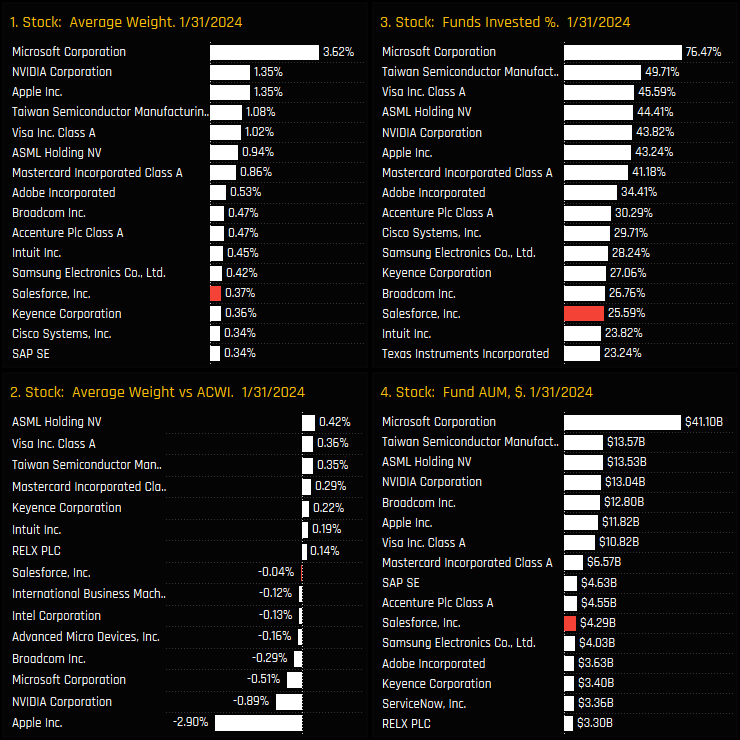
Chart set 16 captures the latest ownership and exposure data for companies in the Technology sector. Salesforce, Inc has climbed up the ranks over the past 12-months, rising to the 14th most widely held company in the sector. This rise not only demonstrates Salesforce’s growing appeal but also suggests room for further investment growth, given its position relative to sector leaders.
Please click on the link below for a comprehensive data pack on Salesforce, Inc positioning among Global funds.
For more analysis, data or information on active investor positioning in your market, please get in touch with me on steven.holden@copleyfundresearch.com
Investor Positioning Report — Copley Fund Research Ltd · Last updated: July 2026 · Registered in England and Wales
1. Who we are
Copley Fund Research Ltd provides proprietary institutional fund intelligence to listed companies and investor relations professionals. These terms govern every purchase of an Investor Positioning Report. By completing a purchase you confirm you have read, understood, and agreed to these terms in full.
2. What you are purchasing
The Investor Positioning Report is a bespoke PDF report mapping the institutional fund universe around your stock. It covers current investors, past investors, competitor investors, and white space investors. Every report is built from scratch for the specific company ordered and is not a standardised or templated product.
3. Delivery and process
Following payment or invoice issuance, Copley Fund Research will contact you within one working day to agree your competitor set. Production begins once the competitor set is confirmed in writing. The completed report will be released to you within 48 hours of production starting, provided payment has been received in full; where payment is outstanding, the report will be withheld until payment clears. If the requested company falls outside our covered fund universes, or a competitor set cannot be agreed, Copley Fund Research will issue a full refund or cancel the outstanding invoice.
4. Competitor set agreement
The competitor set is agreed with you in writing prior to production, and the report is built to that agreed specification. Requests to amend the competitor set after delivery, based on a change of preference rather than an error, may be treated as a new order.
5. Refund policy
Because each report is produced individually for your company, orders are non-refundable once production has begun, except as set out in clauses 3 and 5a below. By purchasing, you agree not to dispute the charge with your card provider on the basis that the service was not as described, provided the report has been delivered to the agreed specification or corrected under clause 5a.
5a. Quality remedy
If a delivered report contains a material error caused by Copley Fund Research — for example, an incorrect company analysed, a competitor omitted from the agreed set, or content missing from the specification in clause 2 — Copley Fund Research will correct and redeliver the report at no additional charge, within a reasonable timeframe. This is your sole remedy for such errors.
6. Data and accuracy
All fund positioning data in the report reflects holdings as disclosed at the most recently available reporting date at the time of compilation. The timing of fund holdings disclosures is determined by regulatory requirements applicable to each fund and is outside the control of Copley Fund Research Ltd. This data may not reflect current fund positions. Copley Fund Research takes reasonable care to ensure accuracy but makes no warranty, express or implied, as to the completeness or current accuracy of the underlying data — though this does not affect the quality remedy in clause 5a for errors in how that data was analysed or presented. Past fund positioning is not indicative of future fund behaviour or investment decisions.
7. Not investment advice
The Investor Positioning Report is produced for investor relations intelligence purposes only. It does not constitute investment advice, financial advice, or a recommendation to buy, hold, or sell any security. The data reflects historical fund positioning and must not be relied upon as a prediction of future fund behaviour or investment decisions. Copley Fund Research Ltd is not authorised or regulated by the Financial Conduct Authority for the provision of investment advice.
8. Permitted use and confidentiality
The report is licensed for internal use by the purchasing organisation only. You may share it with employees and directors of your organisation. You may not: reproduce, redistribute, publish, or resell the report or any part of it; share it with any third party outside your organisation without prior written consent; use the fund or portfolio manager names contained in the report to approach those individuals on behalf of Copley Fund Research or in a manner that could damage Copley Fund Research's relationships with those funds; or use the data for any purpose other than your own investor relations strategy. The data, analysis, and methodology contained in the report are the intellectual property of Copley


