In this issue:
Global Real Estate: New Lows
China & HK: Underowned?
Investment Banks/Brokers: Continued Momentum
Vodafone: Going..Going....
359 Active Global Funds, AUM $947bn
Global Real Estate: New Lows
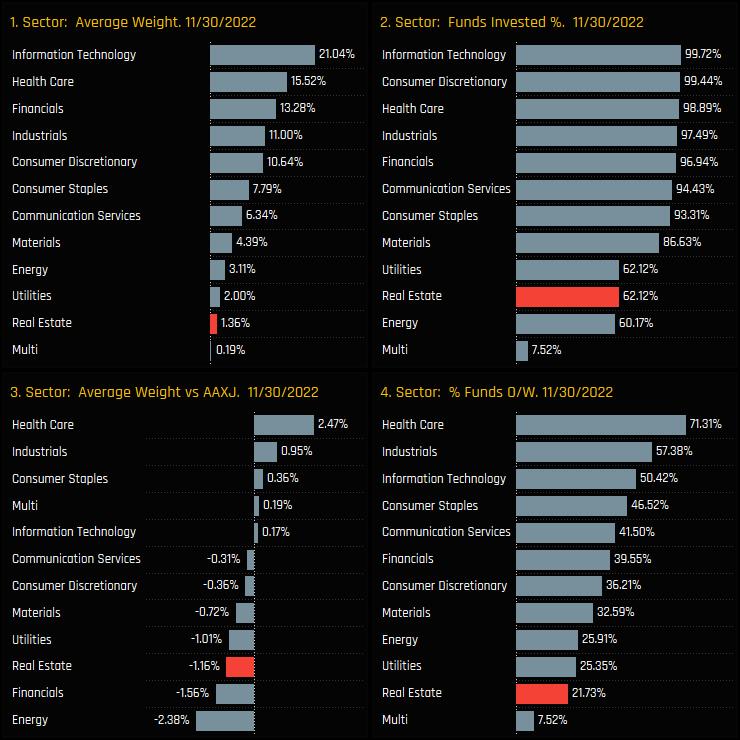
Ownership levels in the Global Real Estate sector have hit new lows. Average weights among active Global funds peaked in late 2019 at 2.1%, but a heavy drop through 2020 and a further leg down in 2022 has pushed that figure to 1.36% (ch1), with a record low of 62.1% of funds invested (ch3). With just 21.7% of funds positioned overweight the SPDRs MSCI ACWI ETF (ch4) at an average -1.16% below benchmark (ch2), the majority of active Global managers are positioned for the future underperformance of the Real Estate sector.
Versus sector peers, Real Estate is now the lowest sector allocation by some distance (ch1) and the 3rd largest underweight after Energy and Financials (ch3). Real Estate shares a similar ownership profile to both Energy and Utilities, with all three held by significantly less funds than peers, as chart 2 highlights. Active managers are more comfortable avoiding these sectors in their entirety, whilst sectors such as Technology, Consumer Discretionary and Health Care are much closer to full ownership.
Fund Holdings & Style Analysis
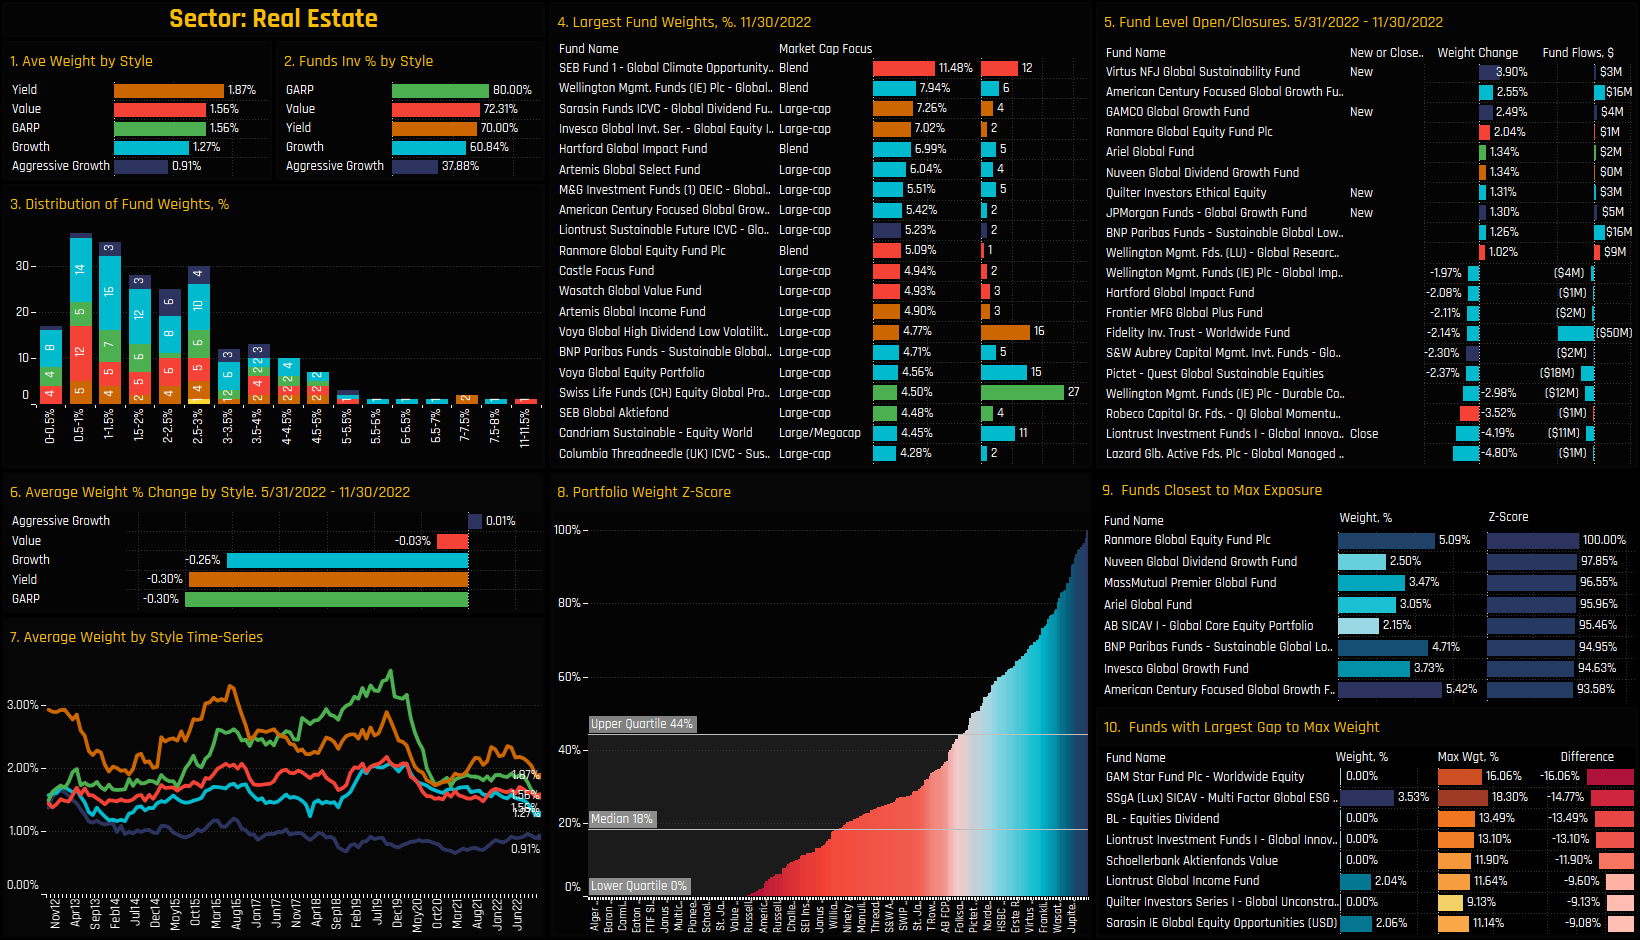
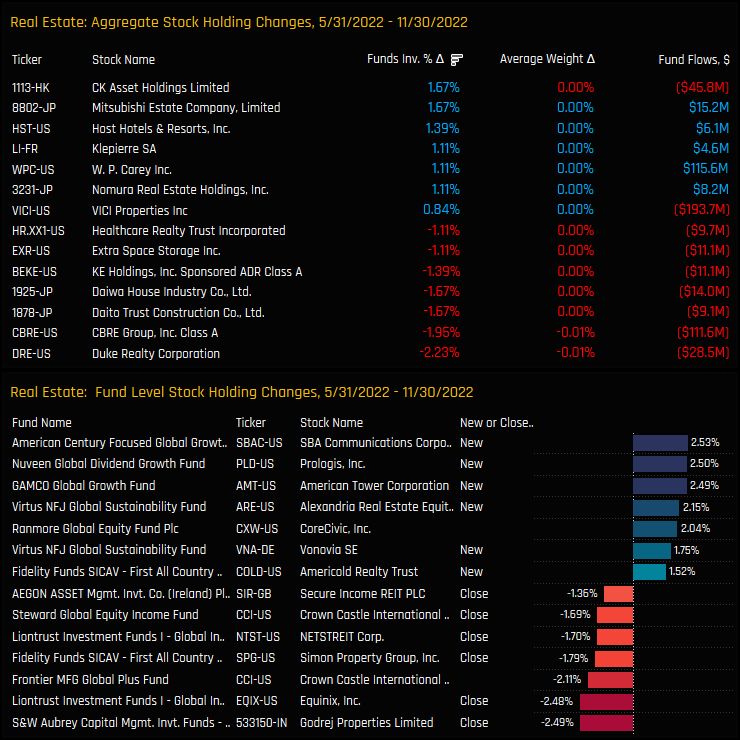
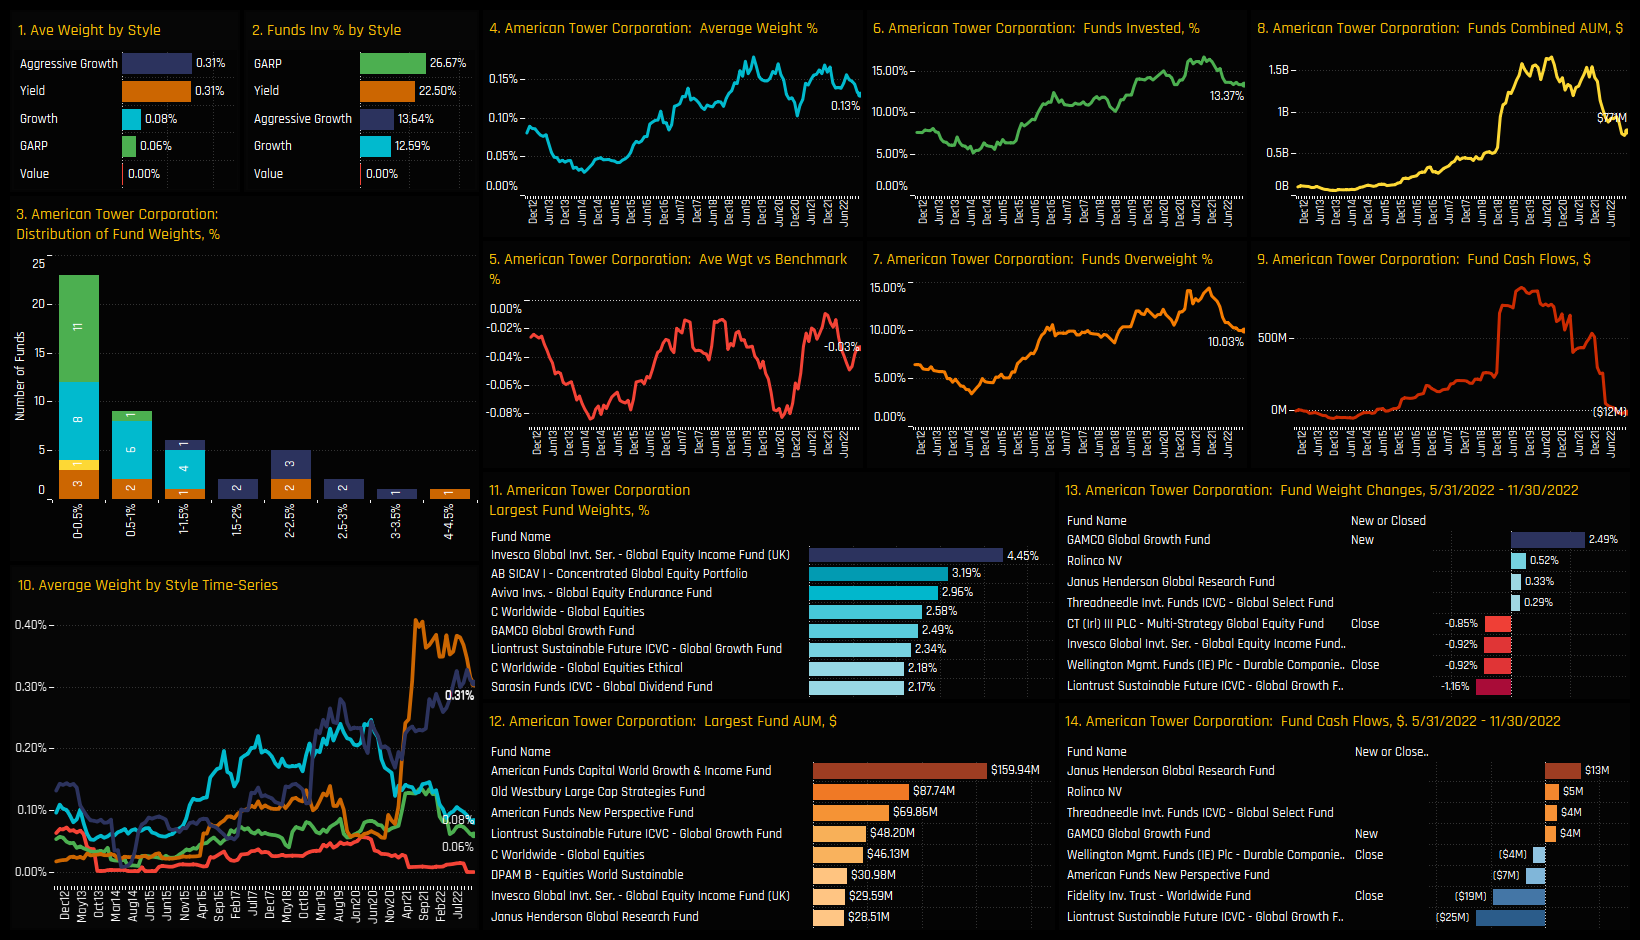
The charts below provide granular detail on the make-up of Real Estate positioning among Global active funds. Real Estate allocations are correlated to Style, with Yield and Value funds more heavily invested than their Growth peers (ch1&2). Among holders, the majority of funds hold less than a 3% weight, with a decent right-sided skew led by SEB Global Climate Opportunity (11.5%), Wellington Global Impact (7.94%) and Sarasin Global Dividend (7.26%). Fund activity between 05/31/2022 and 11/30/2022 is skewed to the sell-side, but new positions from Virtus Global Sustainability (+3.9%) and GAMCO Global Growth (+2.5%) highlight an appetite from selected investors to re-engage with the sector in the face of record low ownership.
Chart 8 shows the portfolio Z-Score for the Real Estate Sector for each fund in our analysis. Each bar represents a fund, with a score of 100% indicating today’s weight is the highest on record for that fund, and 0% the lowest. A Median Z-Score of just 18% again highlights just how low Real Estate allocations are for each fund in our analysis, compared to their own history. Going against the grain are funds such as Ranmore Global Equity and Nuveen Global Dividend Growth, with both towards their highest ever allocation in the Real Estate Sector (ch9).
Country Analysis
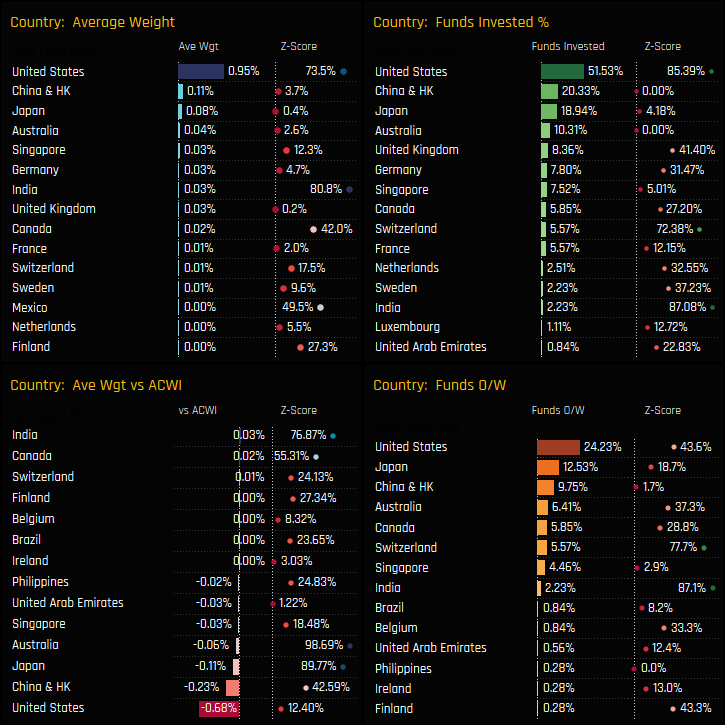
Country allocations within the Real Estate sector are dominated by the USA, with smaller contributions from China & HK and Japan (ch1). The Z-Score of each metric below highlights the low ownership levels in most countries bar the USA. Versus the benchmark, the USA is the largest underweight, followed by China & HK and Japan (ch3).
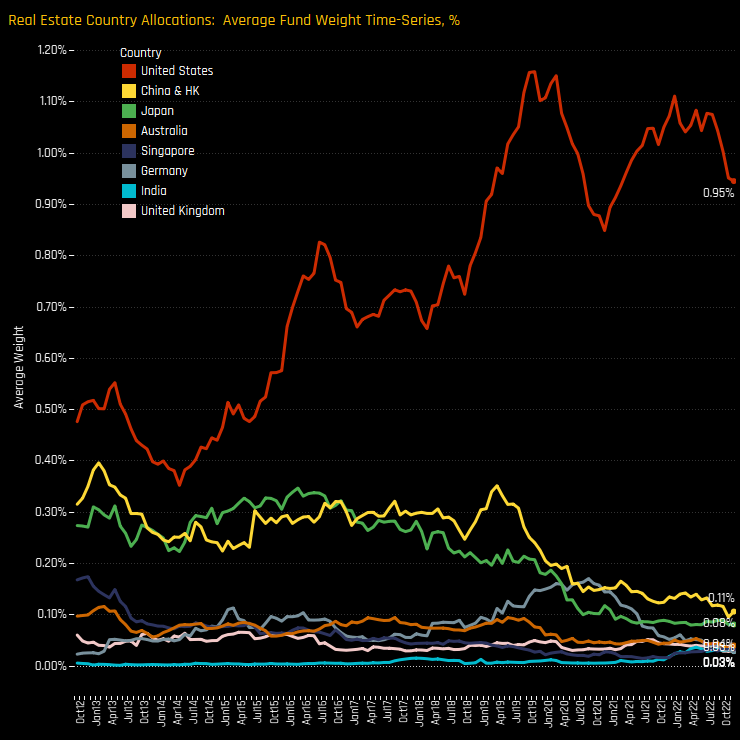
The time-series of average country weights within the Real Estate sector highlights the strong divergence between the USA, China & HK and Japan over the last decade. Since 2012 when allocations were more closely aligned, US Real Estate has seen strong growth whilst China & HK and Japan have dwindled to almost nothing.
Stock Holdings & Activity
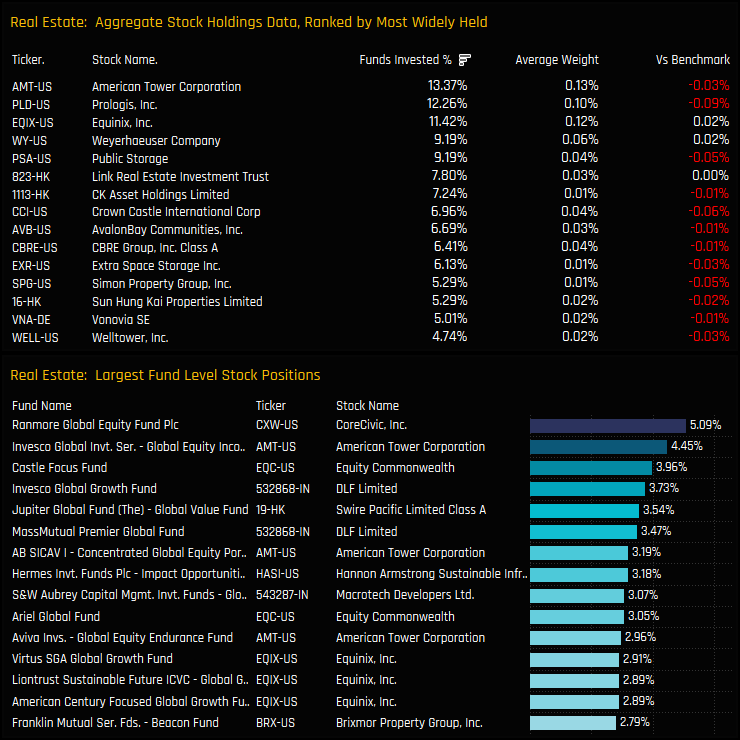
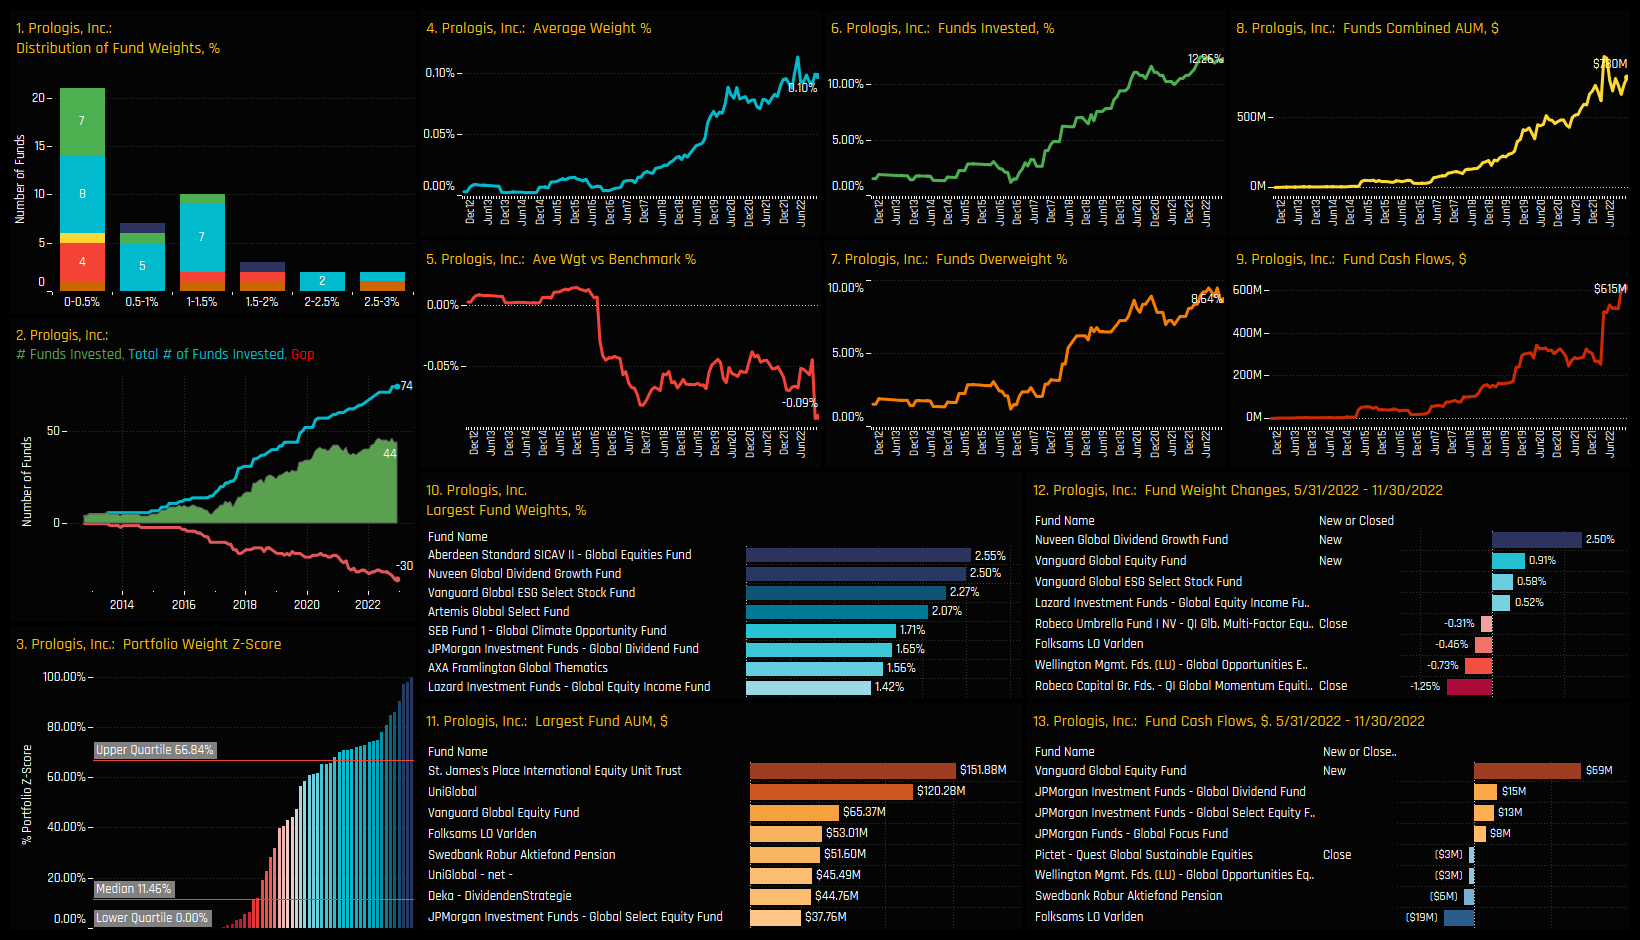
Only 3 stocks within the Real Estate sector have found investment from more than 10% of the funds in our Global analysis. They are led by American Tower Corporation, owned by 13.4% of funds at an average weight of 0.13%, Prologis Inc (12.3%) and Equinix Inc (11.4%). On an individual fund level, Ranmore Global Equity’s 5.09% position in Correction Corporation of America is the largest holding, with only 10 Real Estate stock positions held above 3%. It’s a picture of low conviction across most of the stock spectrum.
Changes in stock ownership over the last 6-months have been balanced, but with a moderate skew to the sell-side. Ownership levels fell in Duke Realty Corporation, CBRE Group and Daito Trust Construction but increased in CK Asset Holdings, Mitsubishi Estate Company and Host Hotels & Resorts. The larger opening and closing positions were spread across a wide spectrum of names with little obvious pattern.
Conclusions & Data Report
Clearly, Global managers can find very little to get excited about within the Real Estate sector. Average weights and the percentage of funds invested are close to all-time lows, with active managers comfortable running underweights and many choosing to avoid the sector entirely.
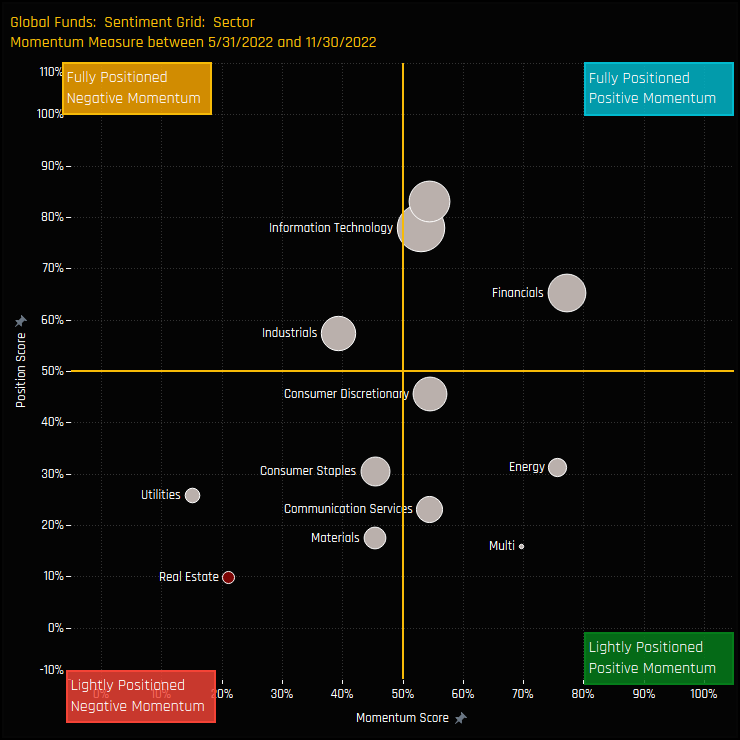
The sentiment grid to the right shows where current positioning in each sector sits versus its own history going back to 2012 on a scale of 0-100% (y-axis), against a measure of fund activity for each sector between 05/31/2022 and 11/30/2022 (x-axis). Real Estate is almost an outlier in the bottom-left quadrant, with record low positioning and negative momentum among managers.
When positioning is this one sided, it creates an more obvious opportunity to profit from the anti-consensus view. With 79% of funds positioned underweight, those that can find reason to go against the grain will stand a higher chance of generating relative outperformance versus their active and passive peers.
Please click on the link below for an extended data report on the Real Estate sector among Global active equity funds. Scroll down for ownership profiles on American Tower Corporation and Prologis Inc. and for more analysis on Global fund positioning.
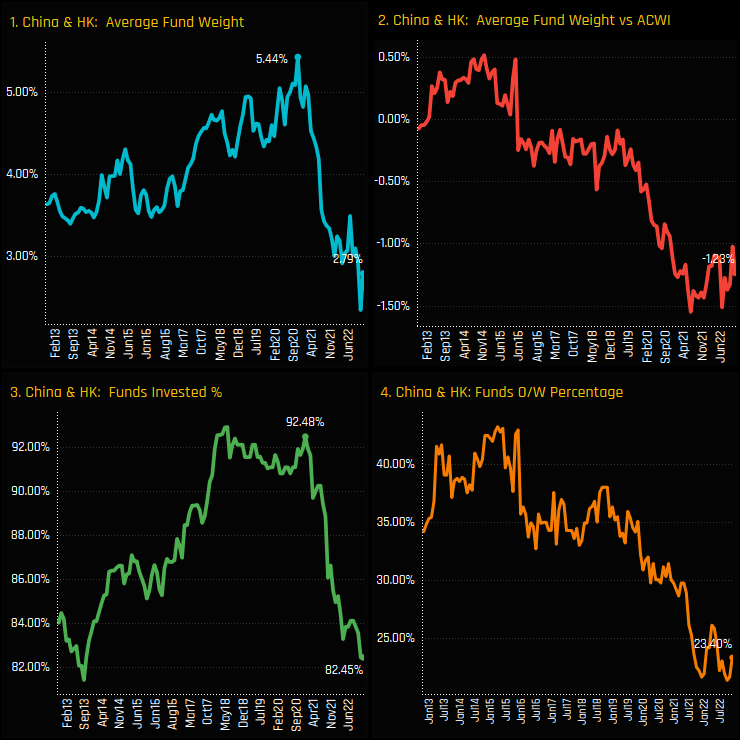
Allocations in China & HK among Global funds have taken a huge move lower since the highs of late 2020. Average weights have fallen from a peak of 5.44% in October 2020 to 2.79% today, with the percentage of funds exposed to China & HK falling from 92.5% to 82.5% over the same period. Relative to benchmark, active Global managers have been running an underweight since 2015, with today underweight (-1.23%) and the percentage of funds who are overweight (23.4%) at the lower end of the long-term range.
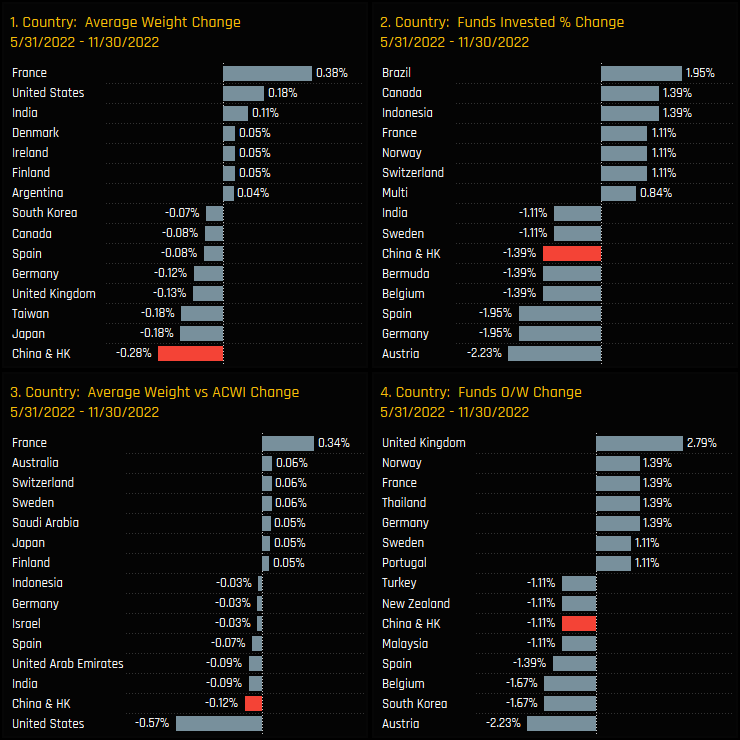
Aggregate ownership changes over the last 6-months highlight a continued rotation out of China & HK, with average weights falling the most of any country over the period (-0.28%) and all other measures of ownership tracking lower. France was the standout beneficiary of this rotation, with absolute and relative ownership measures moving higher over the same period.
Country & Sector Positioning
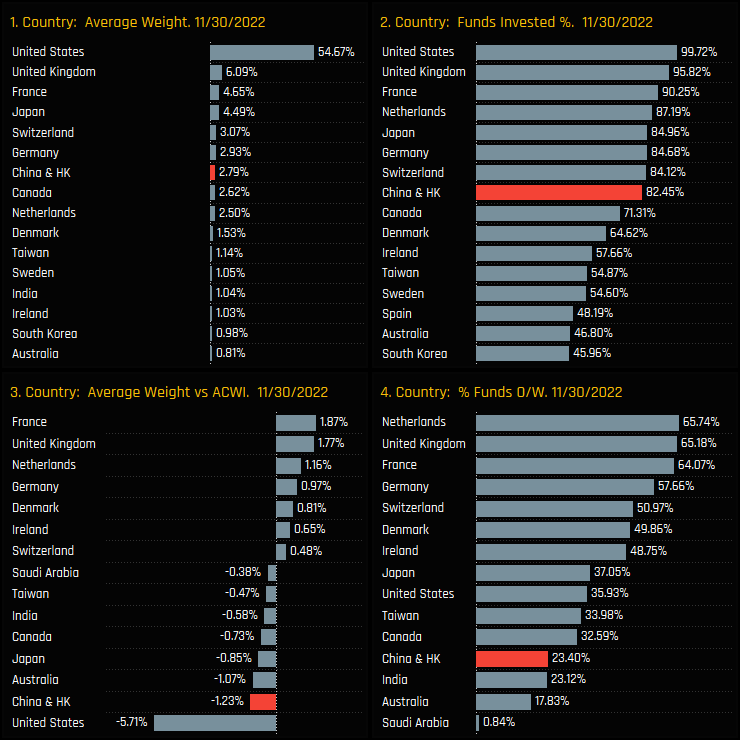
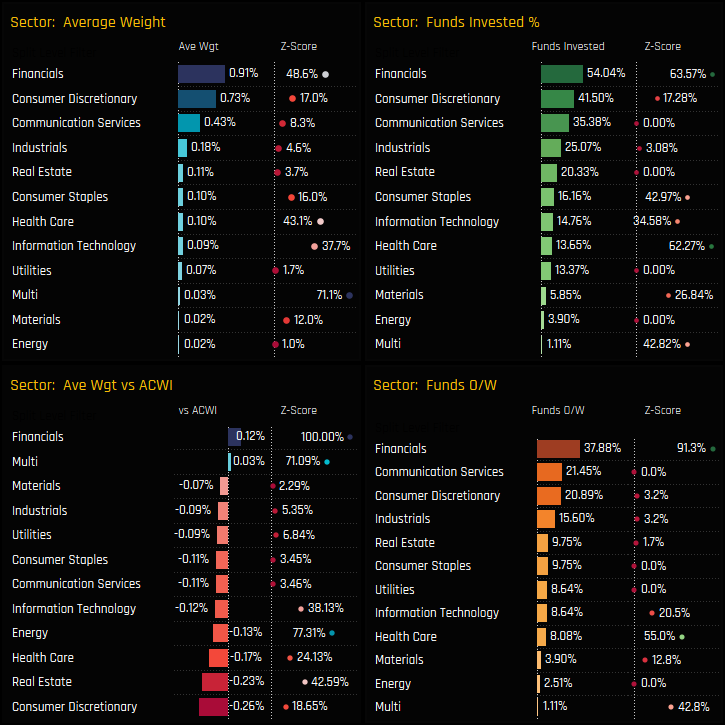
This leaves China & HK as something of a minnow in the scheme of Country exposure across the 359 Global funds in our analysis. It is the 7th largest country weight and the 8th most widely held, in addition to being the 2nd largest country underweight. Within Asia, Japan has taken the lead as the key exposure, whilst Global funds prefer European countries as their main overweight positions.
Breaking down China & HK exposure by sector further highlights to lack of overall positioning. Only 54% of managers hold any exposure to China’s Financial sector and just 16% to the Consumer Staples sector. It’s a picture of low ownership across the board. The low Z-Scores across most measures of ownership reflect rock-bottom levels of exposure compared to history for most of China & HK’s key sectors.
Fund Holdings & Style Analysis
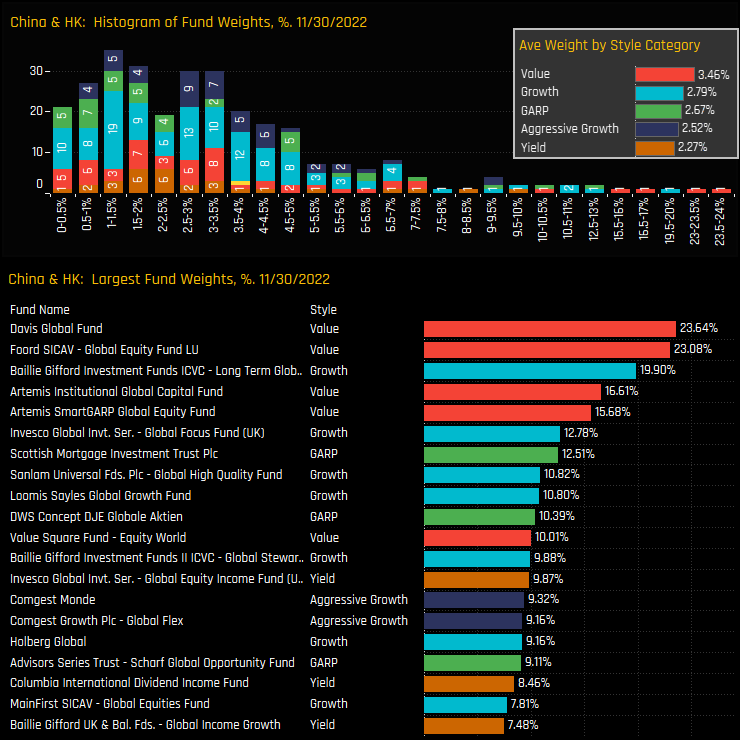
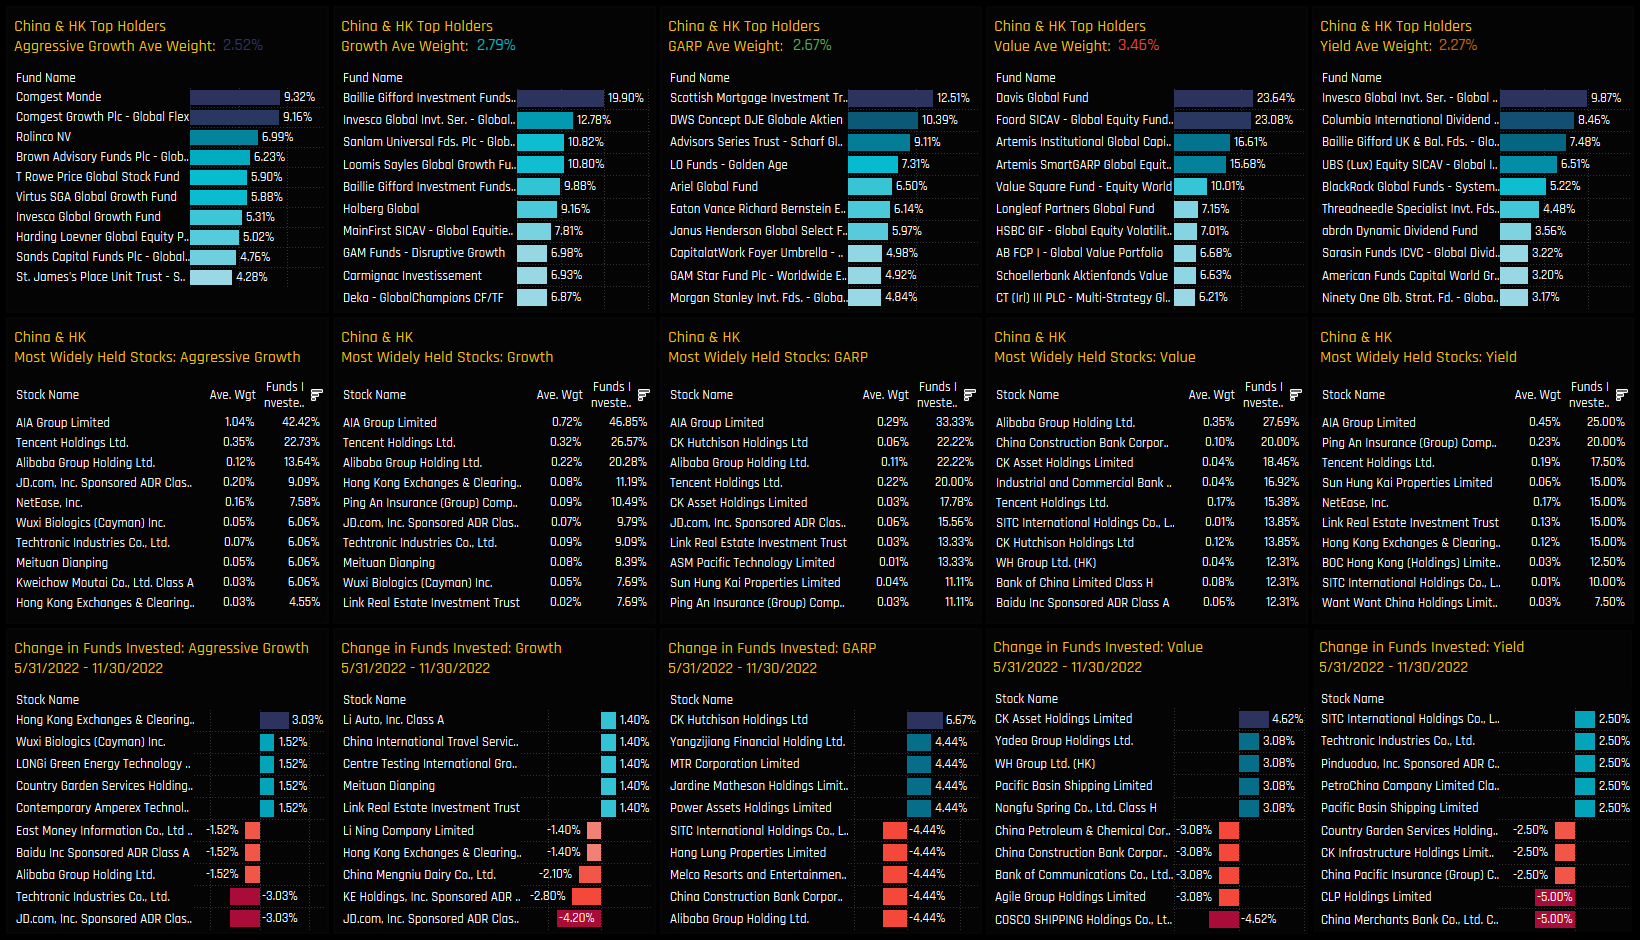
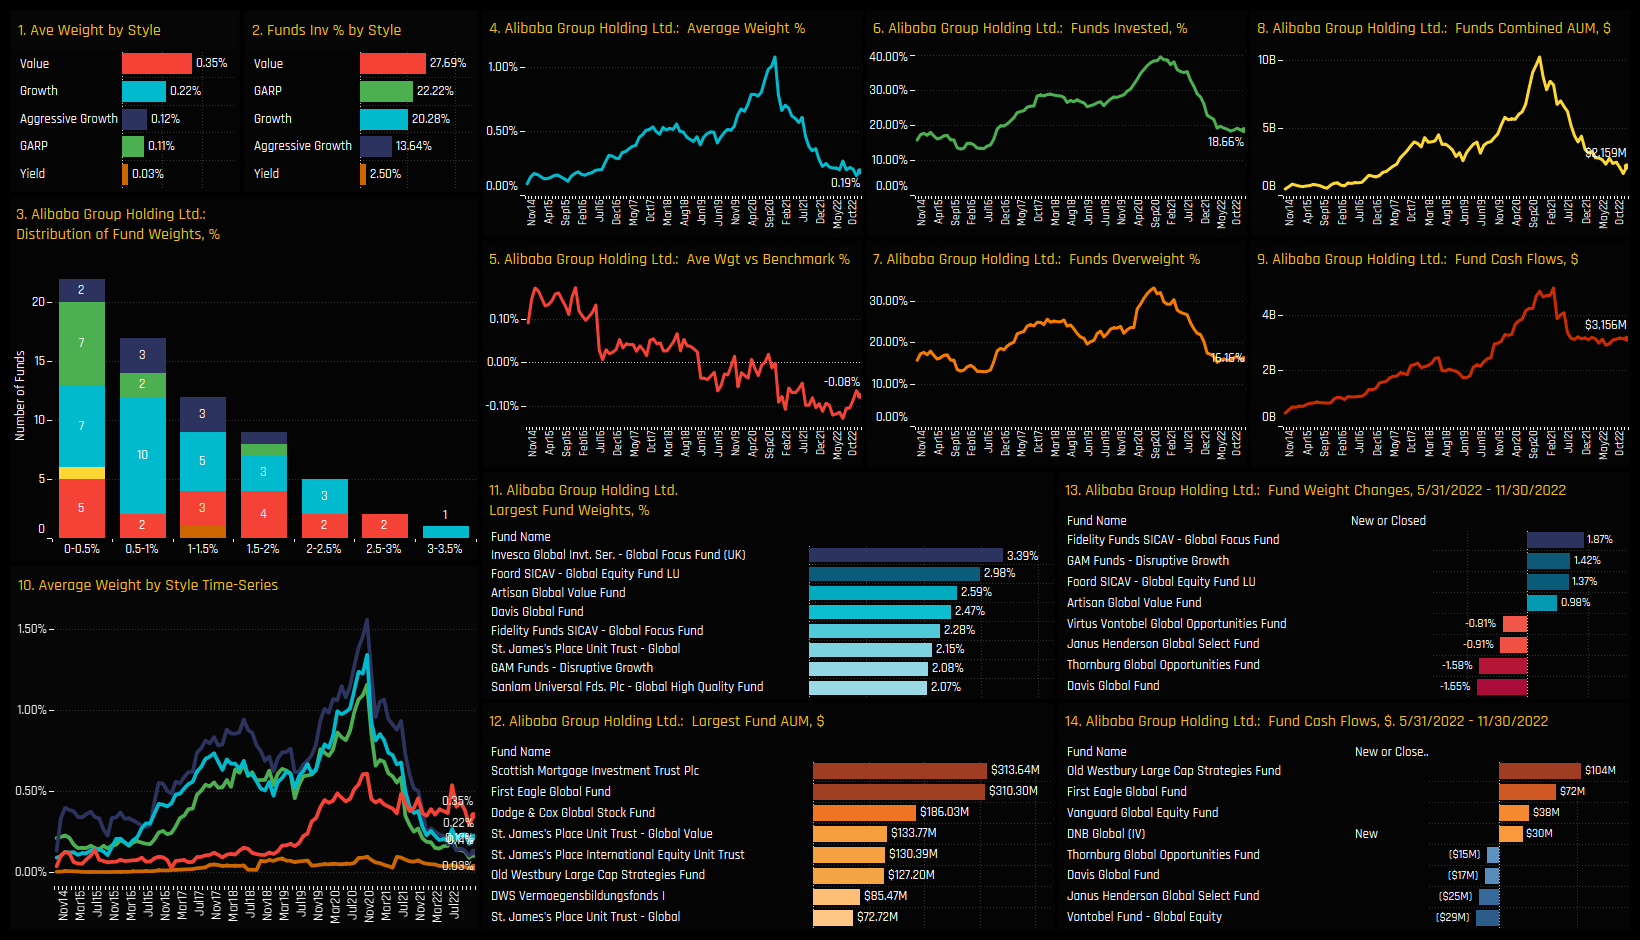
On a fund level, the majority of allocations sit between 0% and 5%, with an extended tail to the upside led by the Value strategies of Davis Global (23.6%) and Foord Global Equity (23.1%). Average weights in China & HK by Style highlight Value and Growth investors as the larger allocators, whilst Aggressive Growth and Yield are slightly behind.
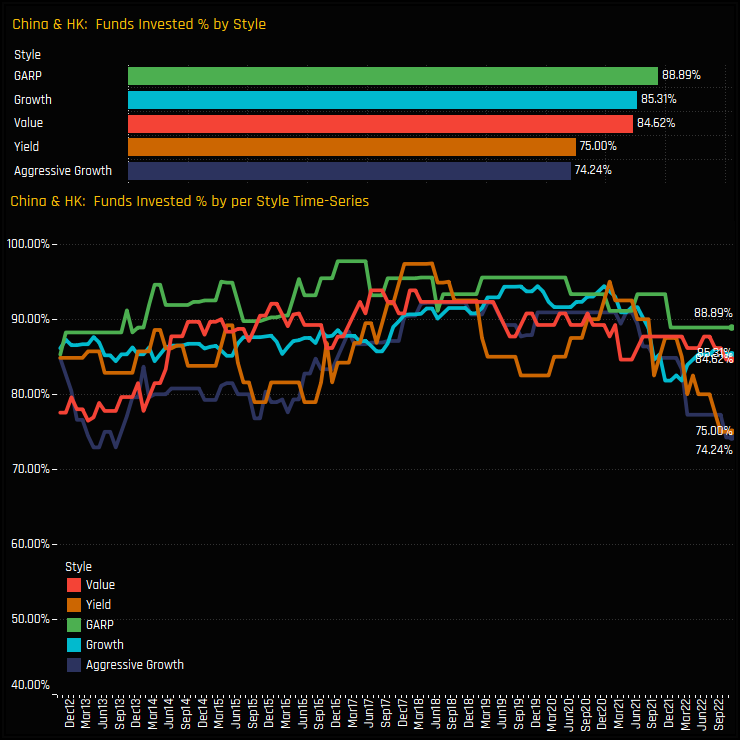
Over the last decade, allocations in China & HK have tracked a similar path for all Style groups. The divergence by Aggressive Growth and Yield investors has only occurred over the last 12 months.
Stock Holdings & Activity
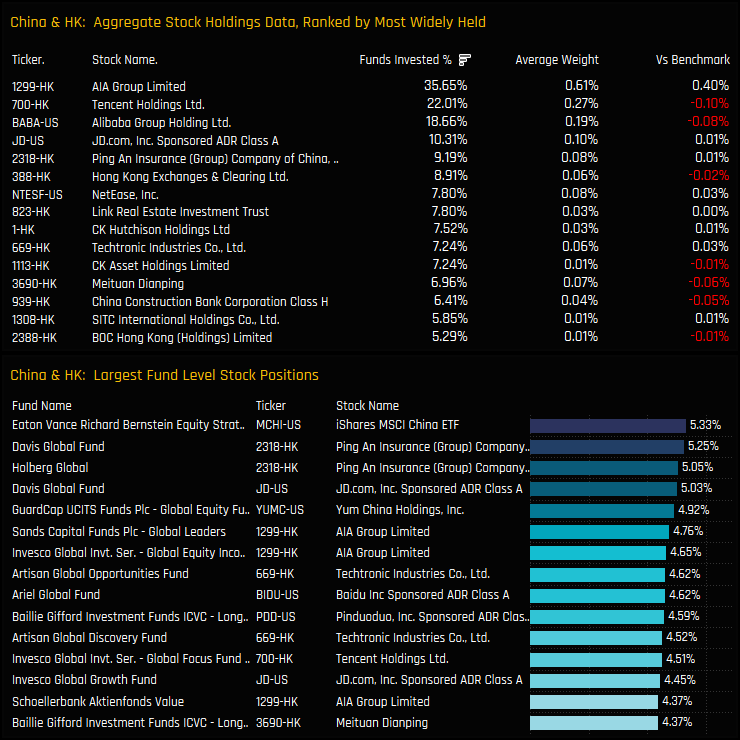
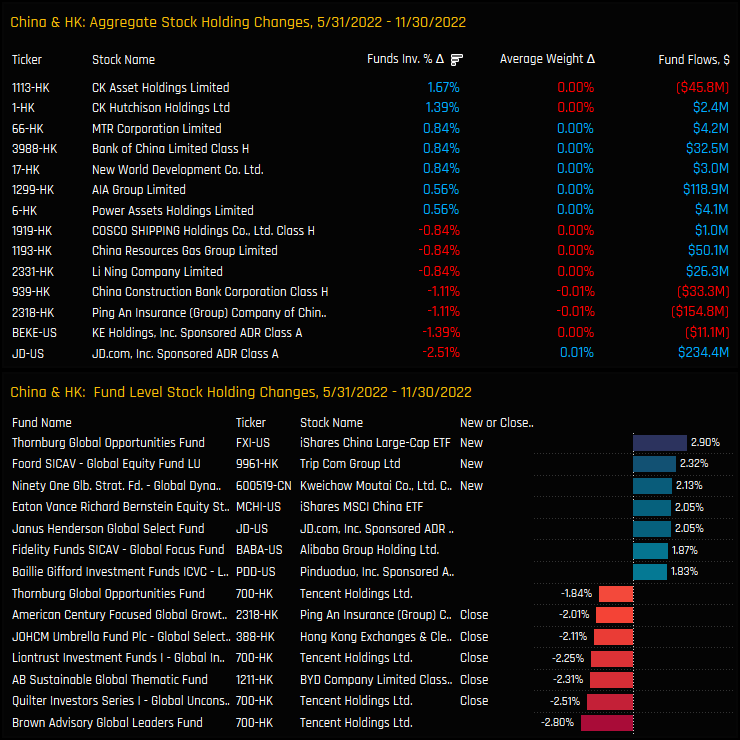
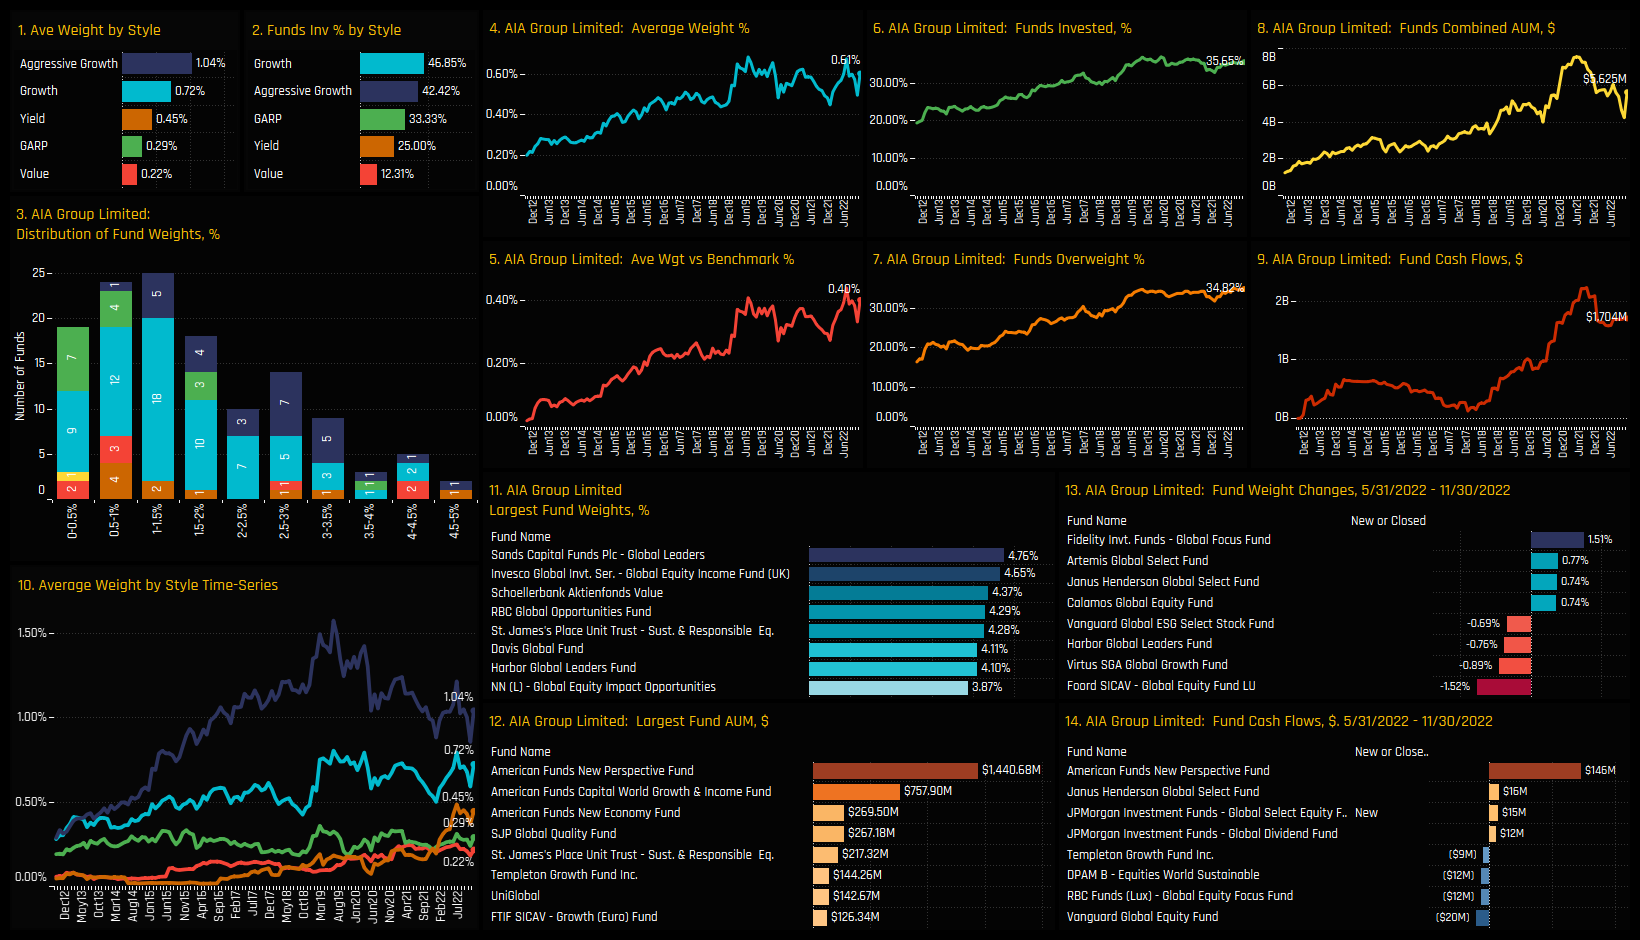
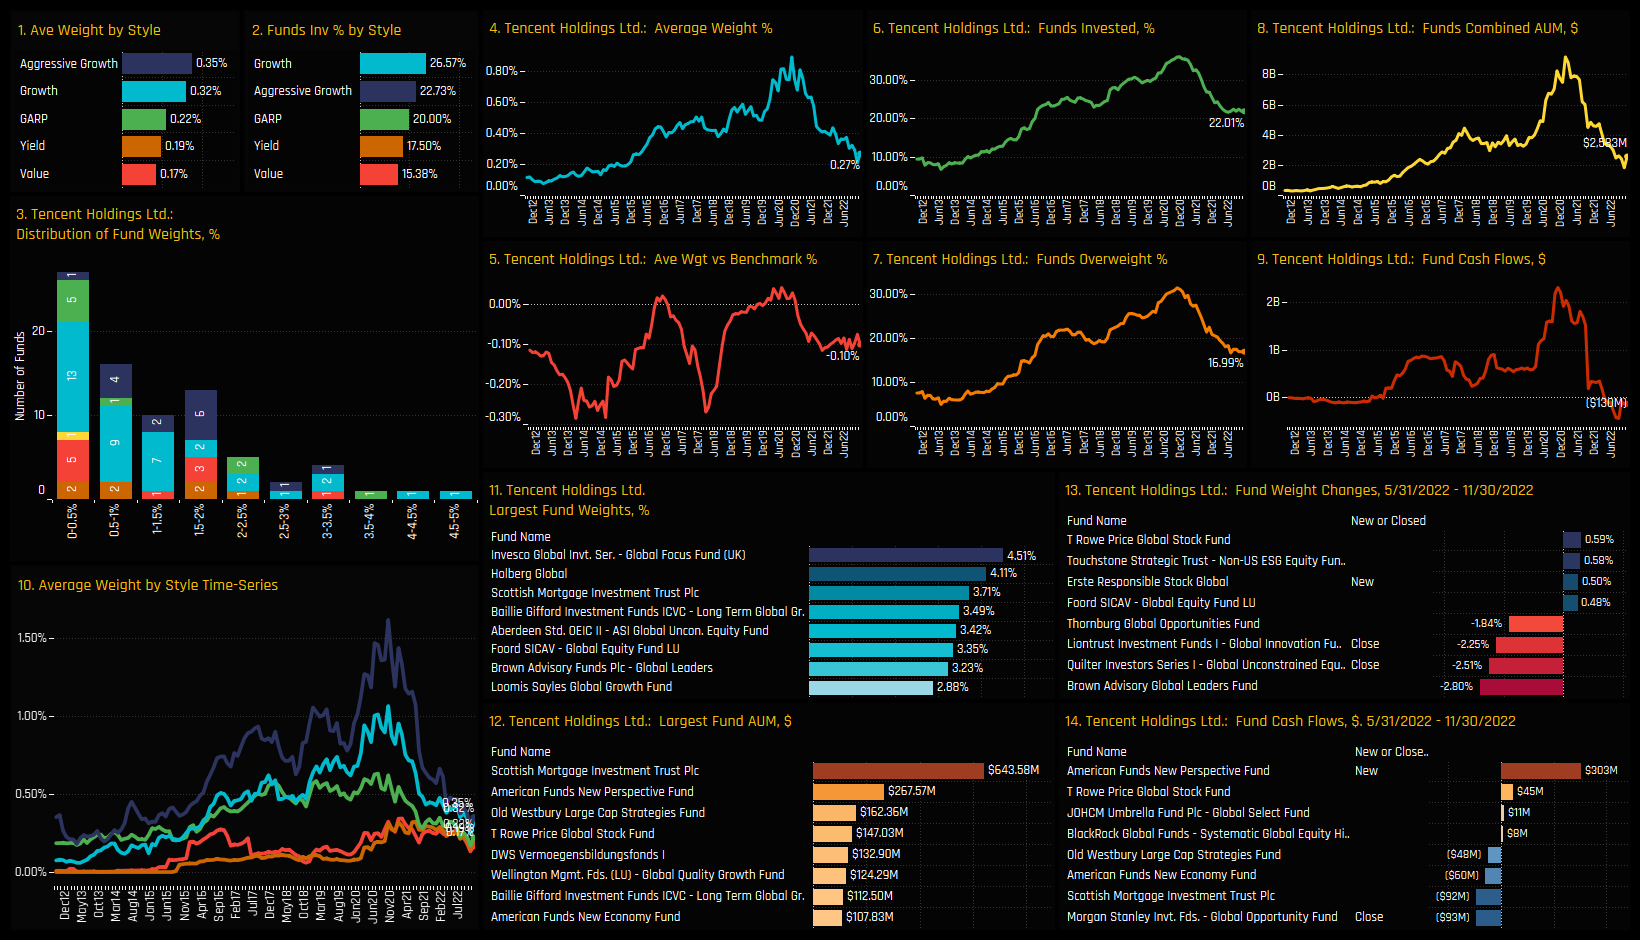
AIA Group Limited is the most widely held stock in China & HK by some margin. It is held by 35.7% of funds at an average weight of 0.61%. Tencent Holdings and Alibaba Group Holdings form the 2nd tier, with Tencent more widely owned and at a higher average weight. On an individual fund level, after Eaton Vance’s position in the iShares MSCI China ETF, Ping An Insurance stands out as a high conviction holding for Davis Global and Holberg Global, with AIA Group and JD.Com also featuring in the Top 15.
Activity over the last 6-months has been fairly subdued, though still skewed to the sell-side. A net -2.5% of managers closed their JD.Com exposure, whilst +1.7% opened positions in CK Asset Holdings Limited. On a fund level, closures in Tencent Holdings stand out, led by Quilter Global Unconstrained (-2.51%) and Liontrust Global Innovation (-2.25%).
Style Breakdown
AIA Group Limited is the most widely stock among Aggressive Growth, Growth, GARP and Yield funds, but well down the pecking order among Value managers, only owned by 12.3% of funds. Instead Value managers place greater faith in Alibaba Group Holdings, which is owned by 27.7% of managers at an average weight of 0.35%.
Conclusions & Data Report
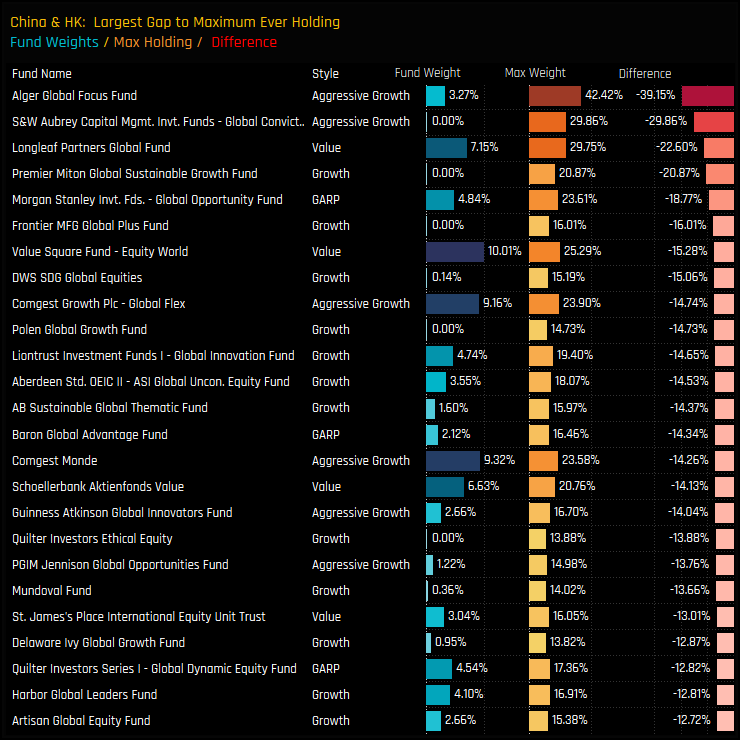
China & HK exposure among Global funds has seen a dramatic decline over the last 2-years. It now sits well down the list of key country exposures among managers. Yet in light of the recent easing of COVID restrictions, is there a case to suggest that China & HK is underowned among Global managers here? After all, only 23% of managers are positioned overweight and 18% of managers have no exposure at all.
The chart to the right lists the Global funds with the largest gaps to their maximum ever holding in China & HK. It highlights the huge drop in exposure by selected managers who used to hold China & HK in much higher regard than they do today. To raise weights here is to tread a path once trodden, so we might expect those with zero exposure to at least consider re-investing. Right now though, the consensus position is to remain underweight.
Please click on the link below for an extended data report on the China & HK among Global active equity funds. Scroll down for ownership profiles on AIA Group Limited, Tencent Holdings and Alibaba Group Holdings and for more analysis on Global fund positioning.
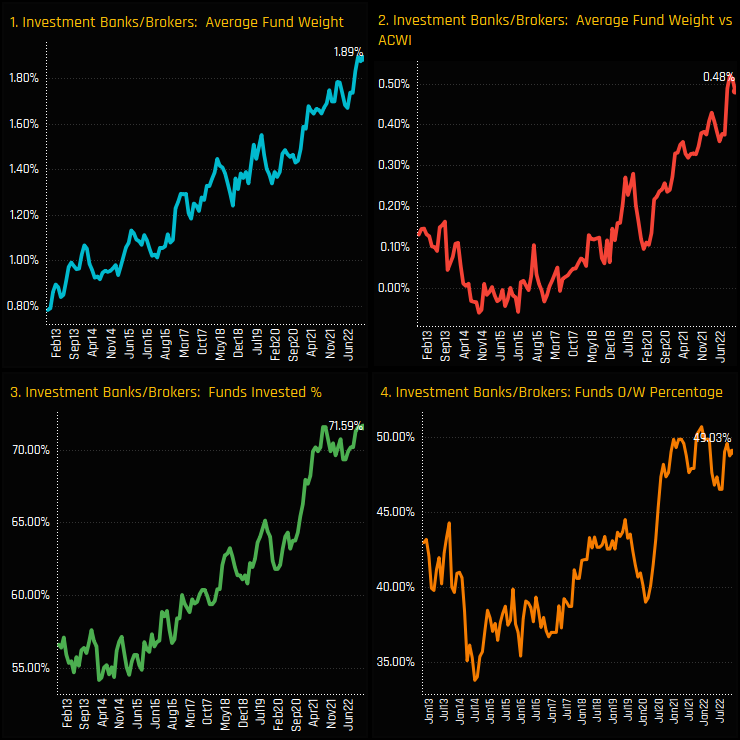
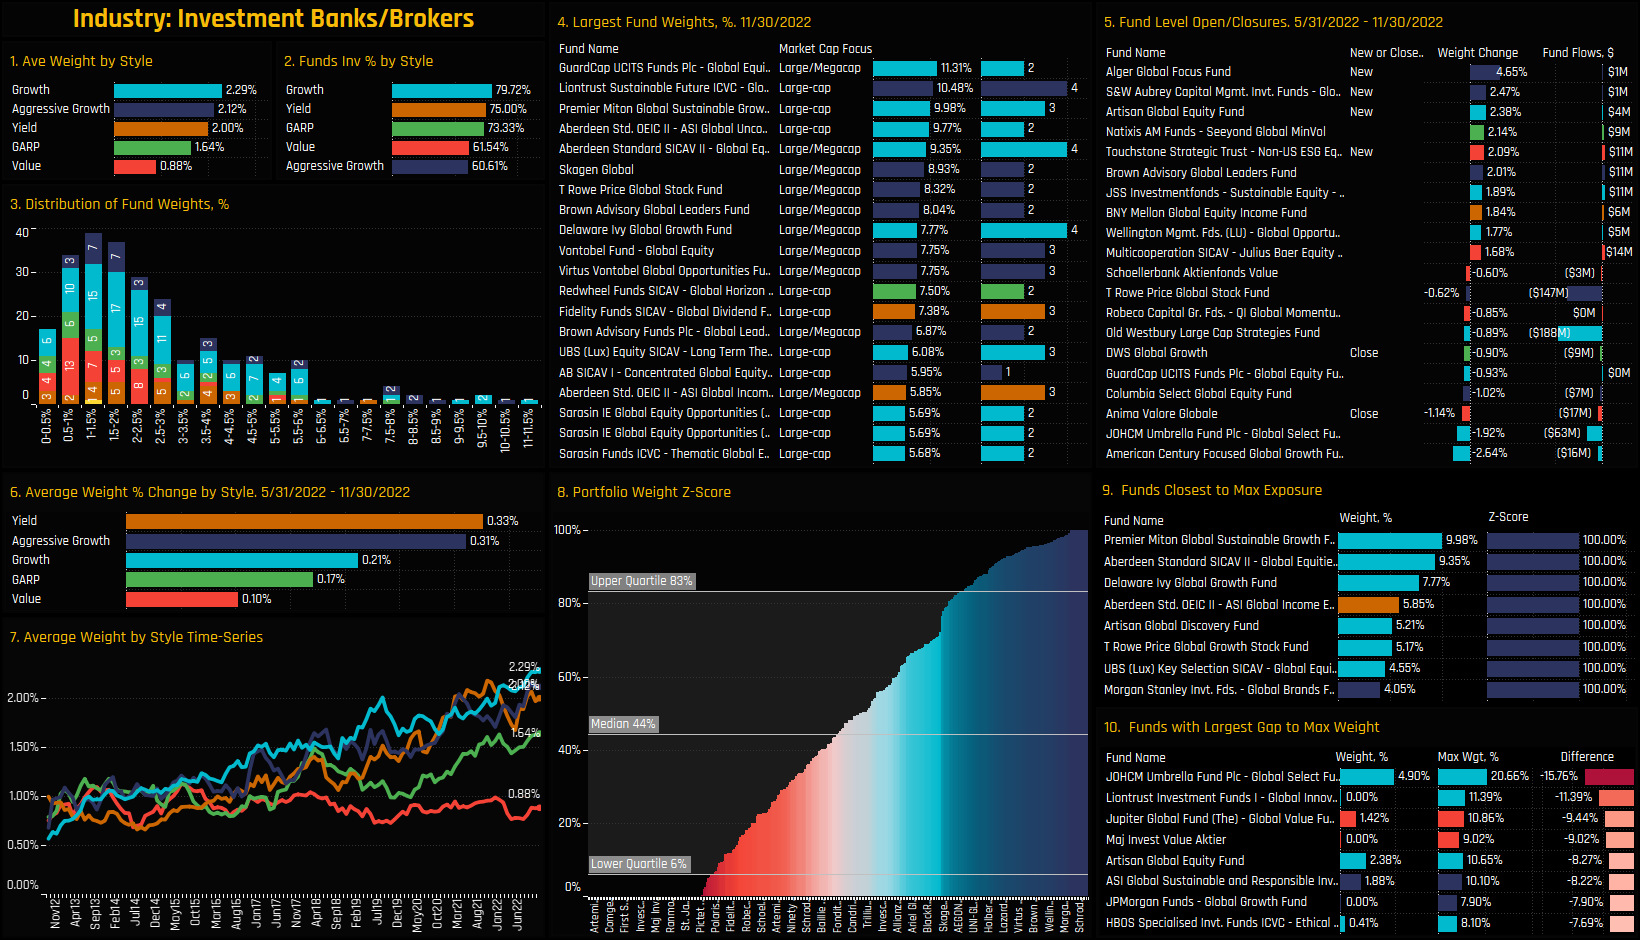
Ownership levels in the Investment Banks/Brokers Industry group have resumed their march higher. After a slight consolidation between August 2021 and April 2022, the percentage of funds invested has reached a record 71.59%. This has helped push average fund weights to a record 1.89%, or overweight the SPDRs MSCI ACWI ETF by +0.48% with 49% of managers positioned overweight.
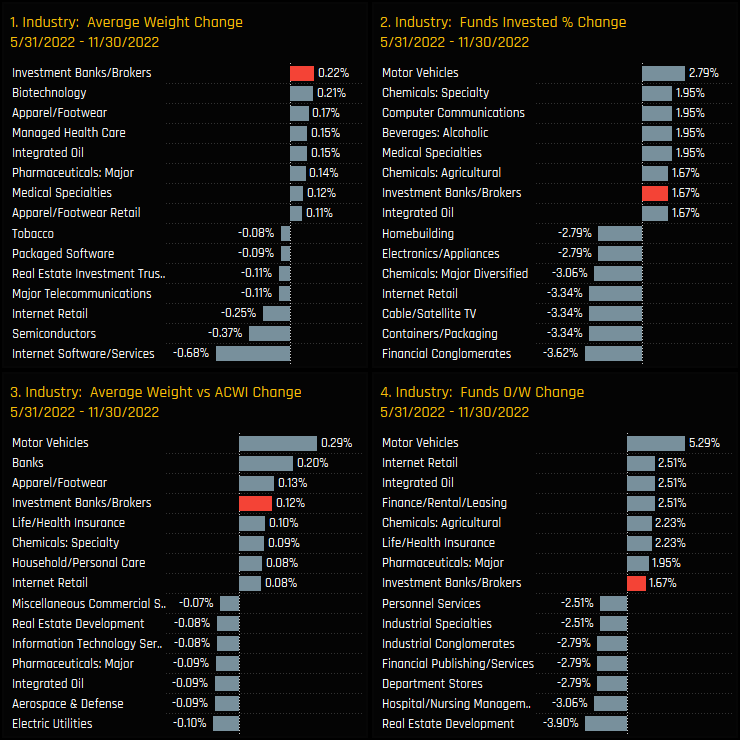
Compared to Global Industry peers, ownership increases in Investment Banks/Brokers have been among the highest over the last 6-months. Average weights increased by +0.22%, the highest of all Industry groups, funds invested by +1.67% and overweights by +0.12%. This has been an active rotation.
Fund Holdings & Style Analysis
The current make-up of fund holdings shows a definite Growth bias, with average weights among Growth funds at 2.29% compared to Value at 0.88%. The holding distribution is centered around the 0.5%-2.5% level, but a number of high Growth strategies are allocating substantially more. GuardCap Global Equity and Liontrust Sustainable Global Equity are the only funds to allocate >10%, but a further 30 strategies hold >5%. Among the top holders, it’s typical to hold at least 2 stocks within the industry group.
The balance of fund activity has been skewed to the buy side over the last 6-months and led by new positions from the Aggressive Growth strategies of Alger Global (+4.65%) and S&W Aubrey Global Conviction (+2.47%). Those at their highest ever allocations are at the Growth end of the spectrum, led by Premier Miton Global Sustainable Growth (9.98%) and Aberdeen Global Equity (9.35%).
Stock Holdings & Activity
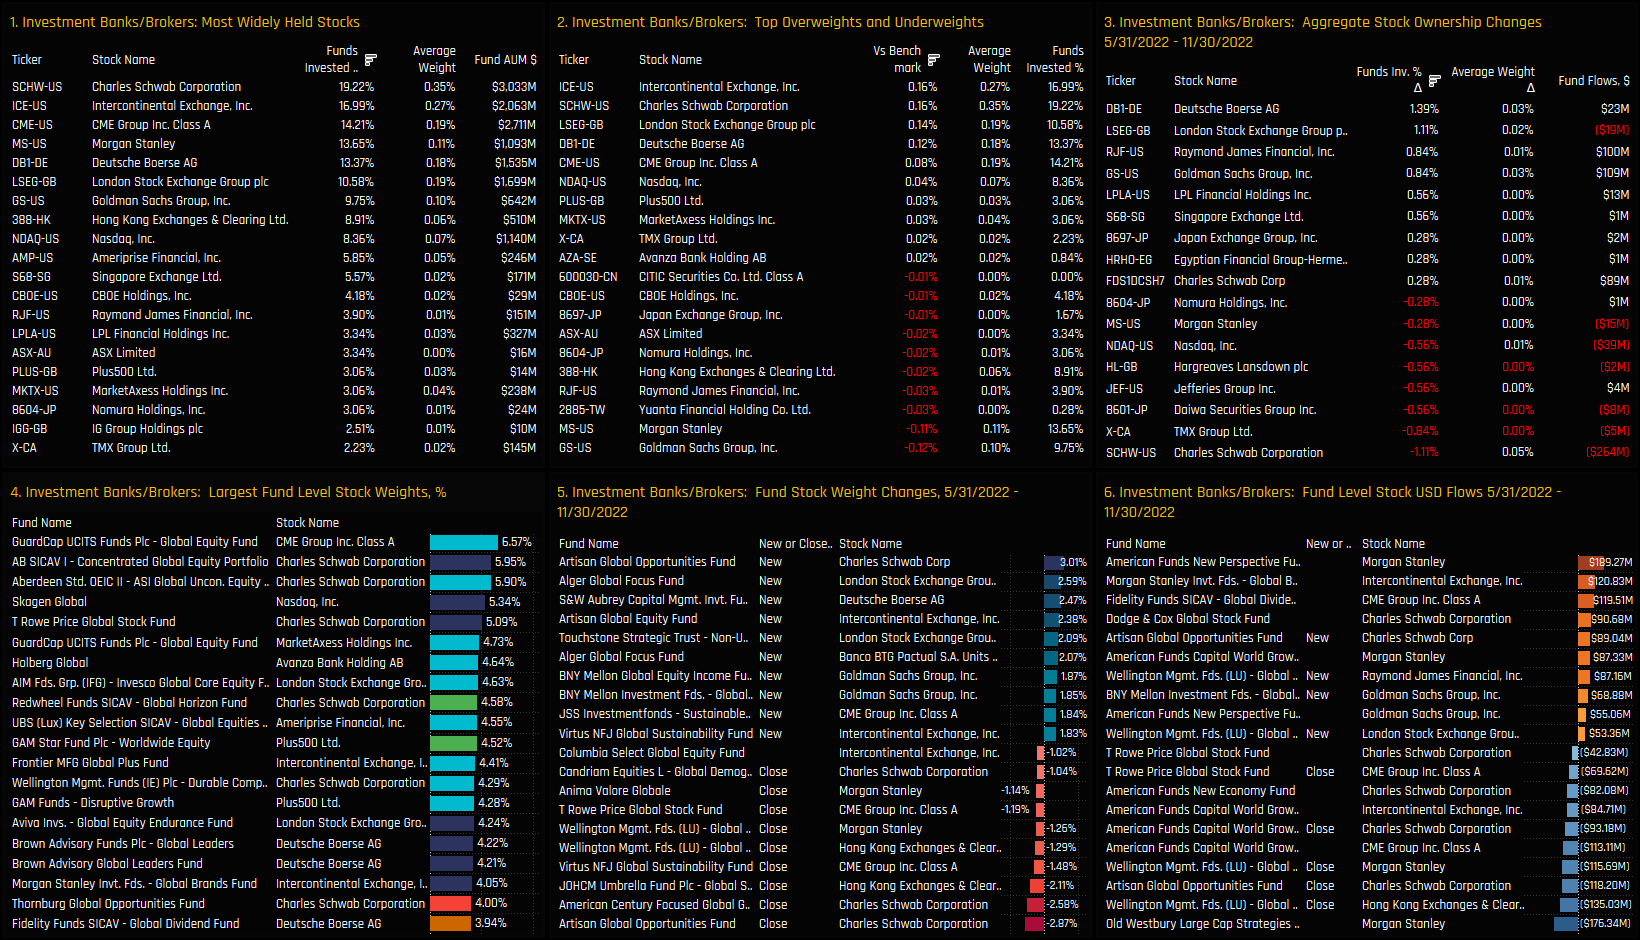
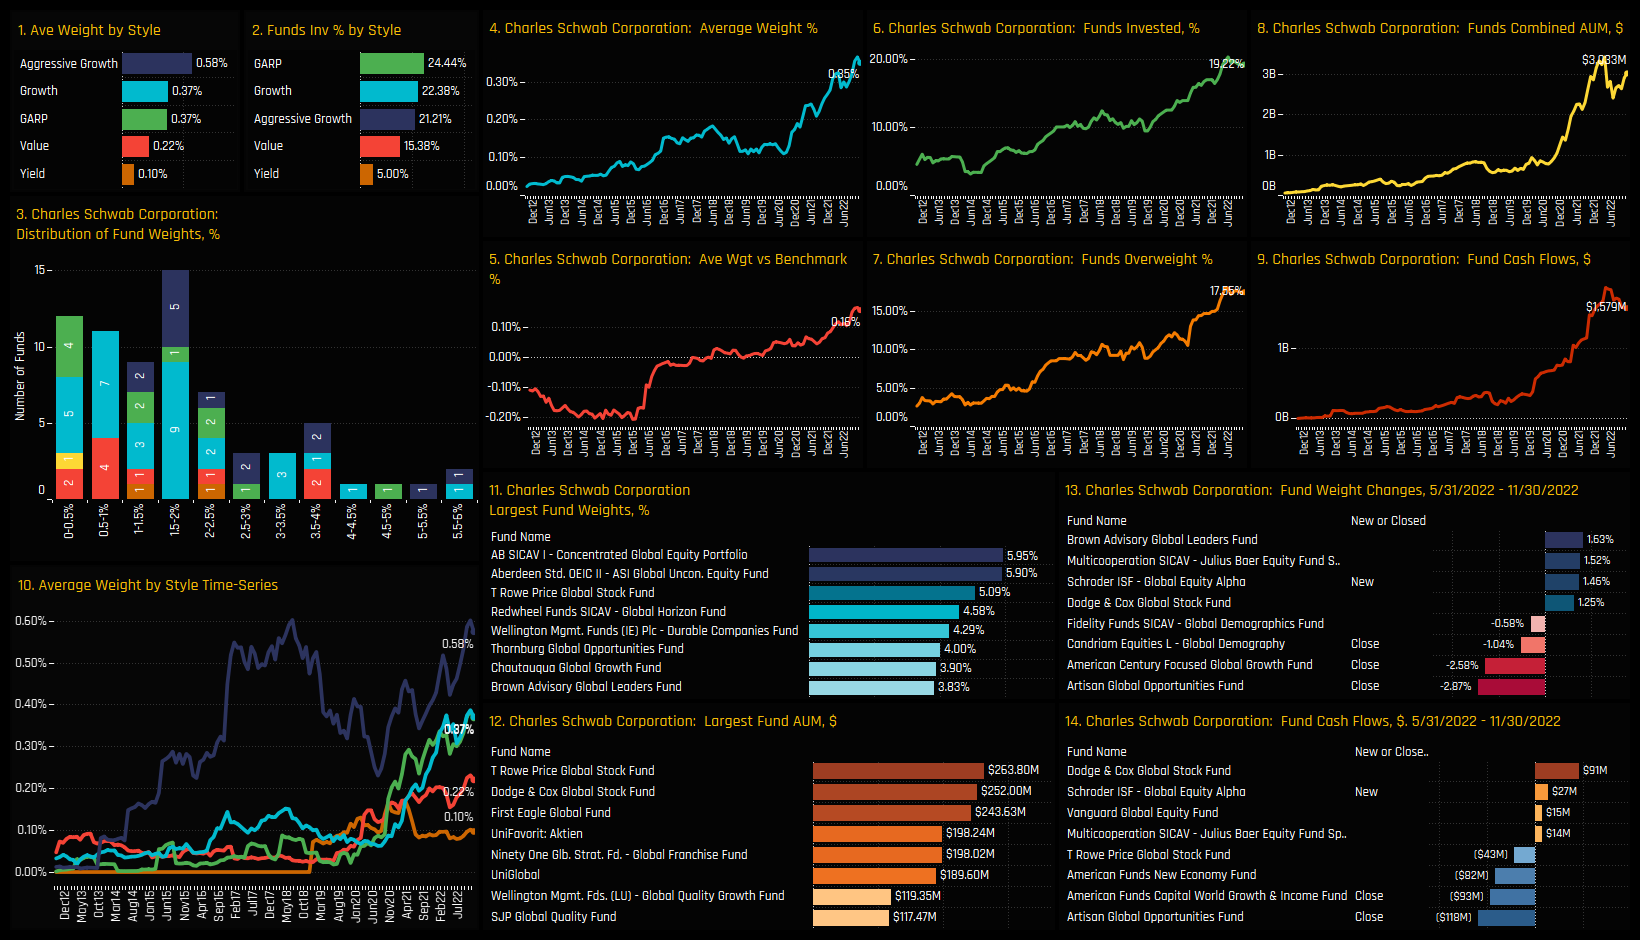
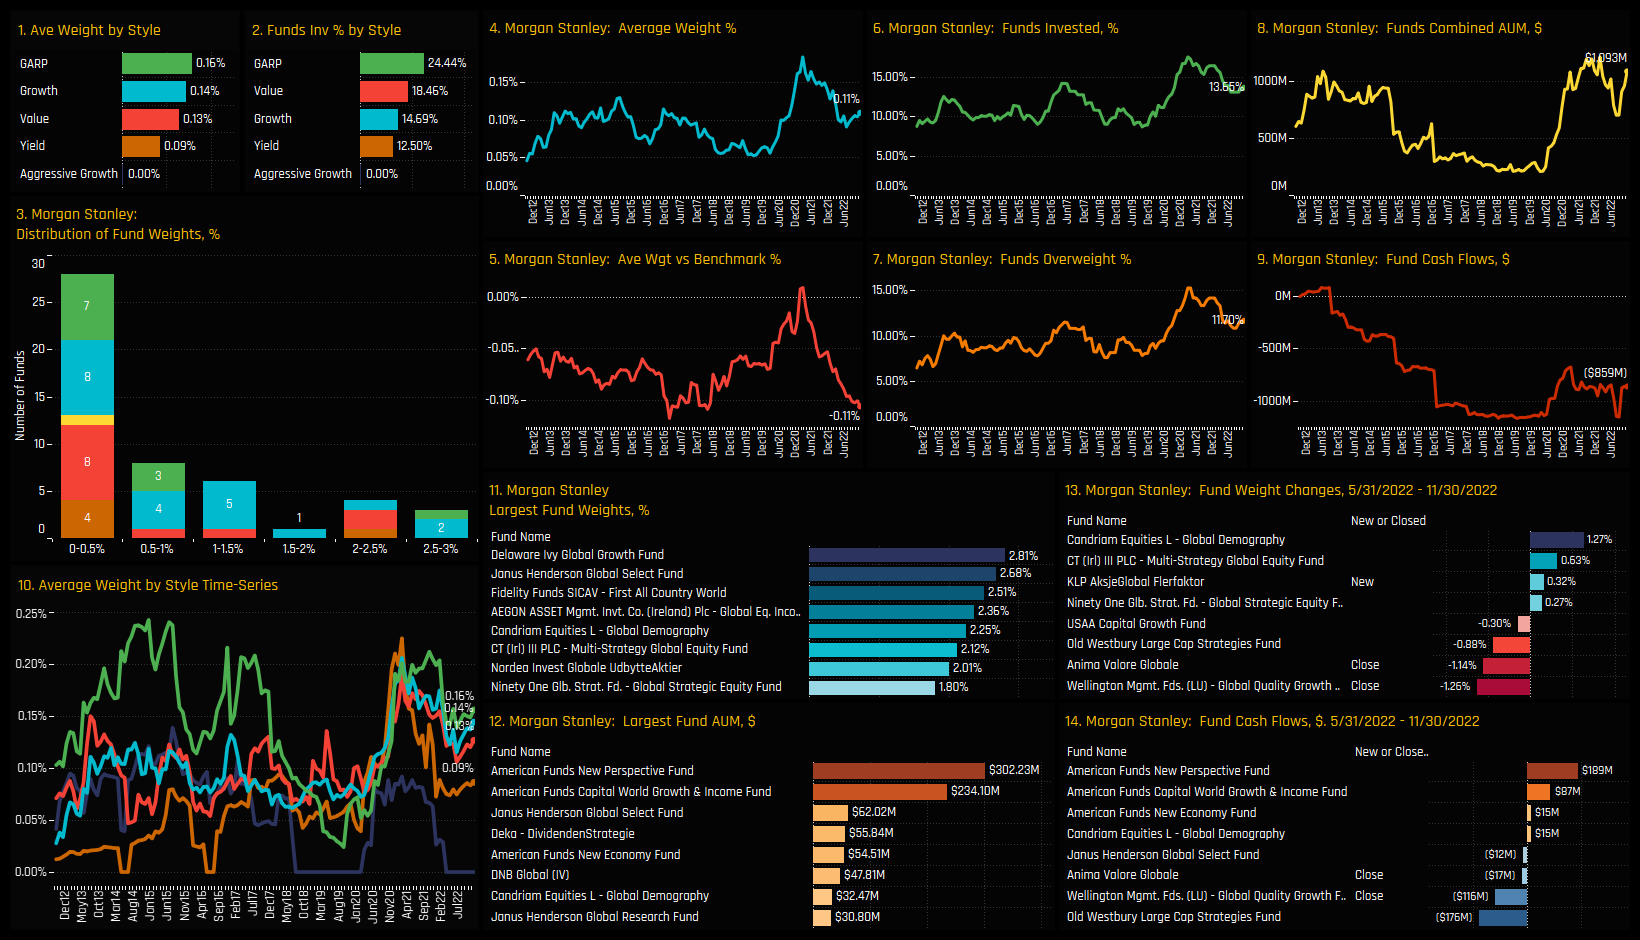
On a stock level, Charles Schwab Corporation is the most widely held company in the Industry group, owned by 19.2% of managers at an average weight of 0.35%. It also accounts for a number of the high conviction holdings in the sector, led by 5%+ positions from Alliance Bernstein Concentrated Global Equity and Aberdeen Global Unconstrained. Morgan Stanley is more widely owned than Goldman Sachs, but both stand as the largest stock underweights in the sector.
Despite the net increases in exposure on an industry level, stock activity between 05/31/2022 and 11/30/2022 is more evenly balanced. Moderate increases in ownership were seen in Deutsche Boerse AG and London Stock Exchange Group, whilst decreases were led by Charles Schwab Corporation and TMX Group. On a fund flow basis, Morgan Stanley saw 2-way activity, with American Funds New Perspective buying +$189m and Old Westbury Large Cap Strategies selling $176m.
Conclusions & Data Report
Our ownership data shows a continuation of the bullish sentiment for the Investment Bank/Broker Industry group. Ownership levels have been on an upwards trajectory for almost all of the last decade, albeit with a slight consolidation at the tail-end of last year. Our Global fund holdings data shows most ownership metrics at, or close to their all-time highs.
Yet despite this, it’s difficult to call the industry group ‘overowned’. There are still 28.5% of Global funds with no investment, and the most widely held stock is that of Charles Schwab with 19.2% fund ownership.
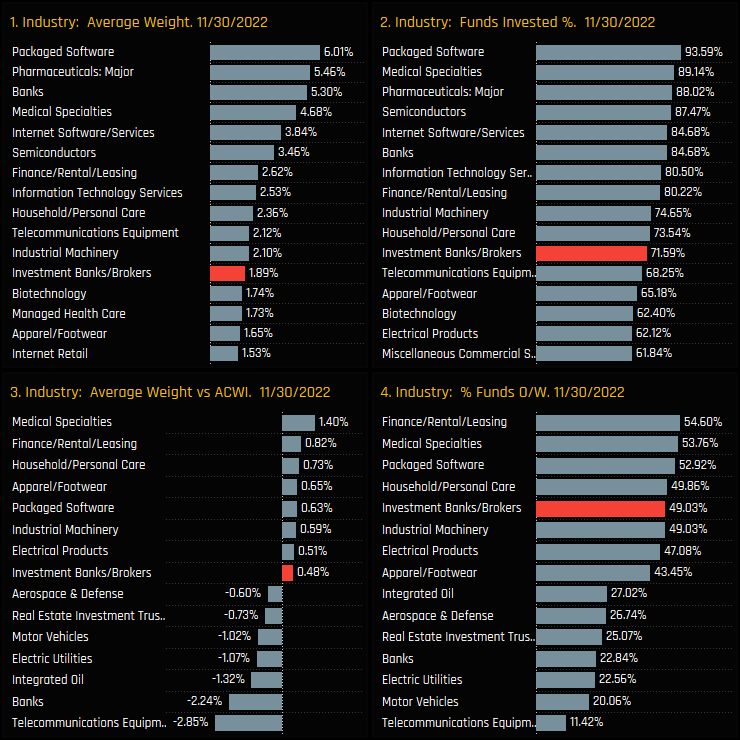
The chart to the right shows the latest ownership data for all Industry groups, with Investment Banks/Brokers well down the order in terms of both average weights and the percentage of funds invested. Versus the benchmark the stats look more favourable, with only a handful of industry groups positioned more bullishly, but there is plenty of scope for allocations to become more widespread.
Please click on the link below for an extended data report on the Investment Banks/Brokers Industry Group among Global active equity funds. Scroll down for ownership profiles on Charles Schwab and Morgan Stanley and for more analysis on Global fund positioning.
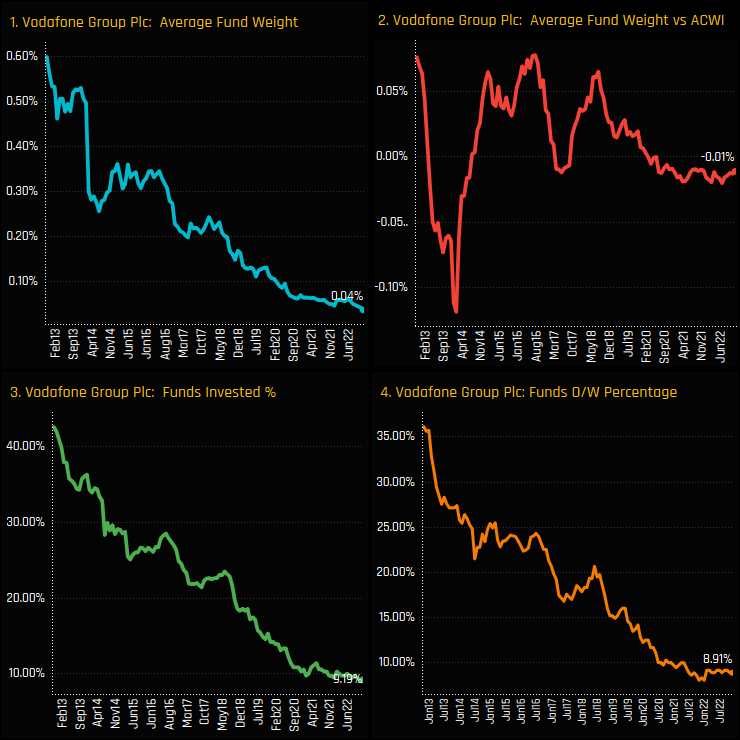
The appetite for Global investors to include Vodafone in their portfolio is dwindling. Once owned by over 40% of Global managers a decade ago, just 9.2% of the Global funds in our analysis now own a position, the lowest level on record. Average fund weights have fallen to a record low of 0.04%, with just 8.9% of funds overweight the SPDRs MSCI ACWI ETF.
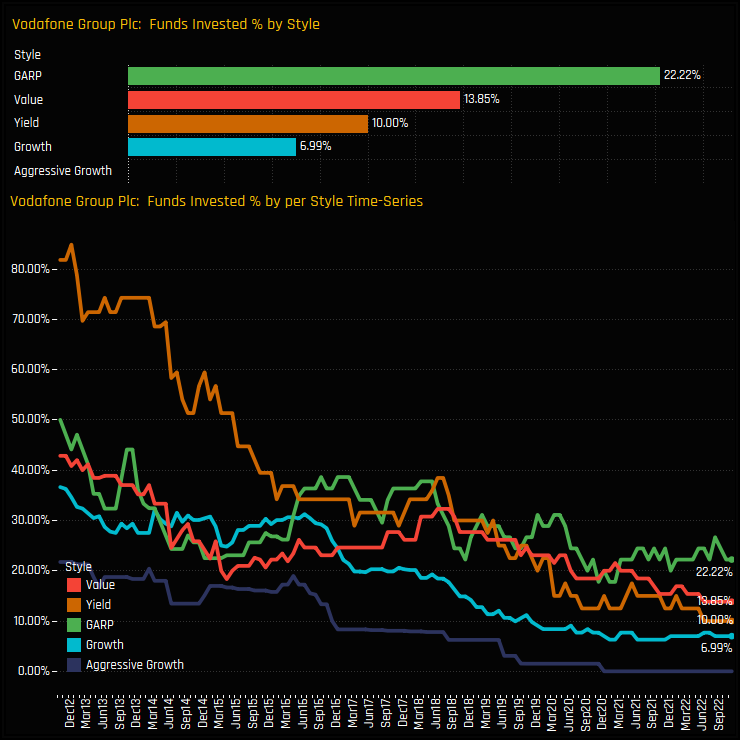
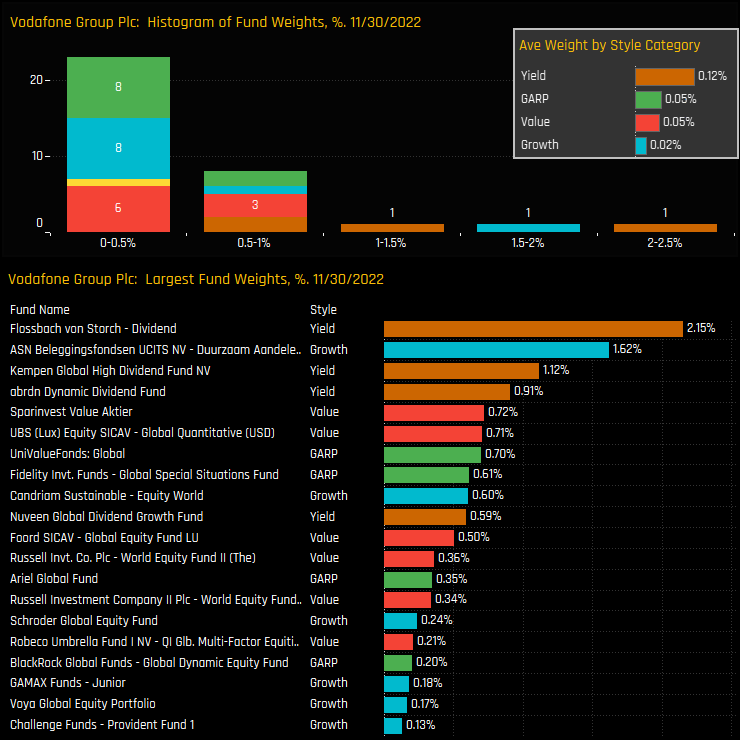
The charts below show the percentage of Global funds in each style group who hold a position in Vodafone (top chart) and the trends over time (bottom chart). The decline in Vodafone exposure has been driven by an exodus among Yield managers, a complete sell-down among Aggressive Growth funds and near record lows across the other Style groups.
Fund Holdings & Activity
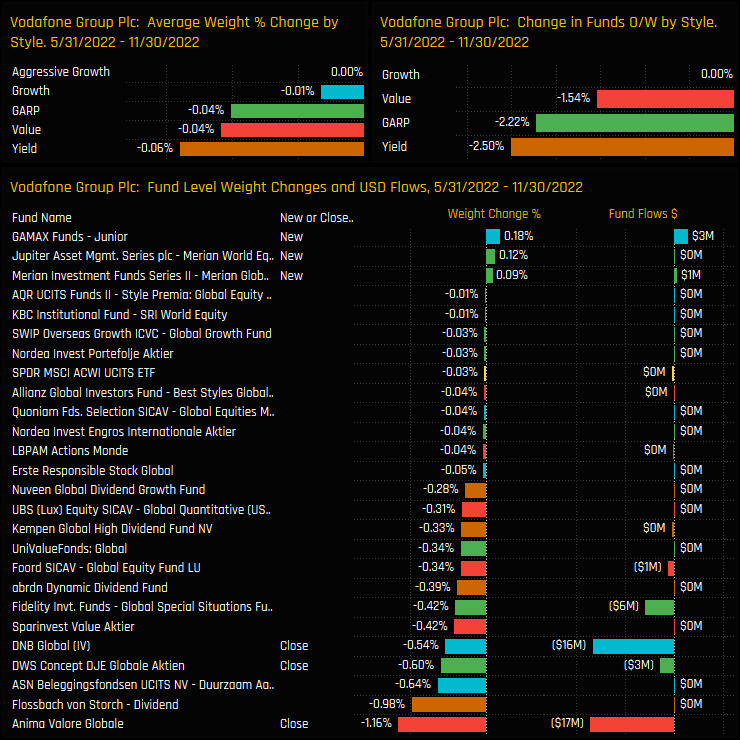
Over the last 6-months, all Style groups saw ownership levels decrease, led by closures from Anima Valore Global (-1.16%) and DWS Globale Aktien (-0.6%). Small opening positions by GAMAX Funds (+0.18%), Merian World Equity (+0.12%) and Merian Global (+0.09%) give some cause for optimism.
This leaves Vodafone as a fringe position for most funds, with the majority holding less than a 1% stake save for 3 funds allocating more than 2%. Yield investors remain the most aggressively positioned, led by Flossbach Dividend (2.15%) and Kempen Global High Dividend (1.12%).
Conclusions & Data Report
In over a decades worth of holdings data for Global active funds, ownership in Vodafone has never looked so bad. Sentiment is at rock bottom, with the number of funds holding a position at all-time lows and an increasing number of funds deciding to throw in the towel.
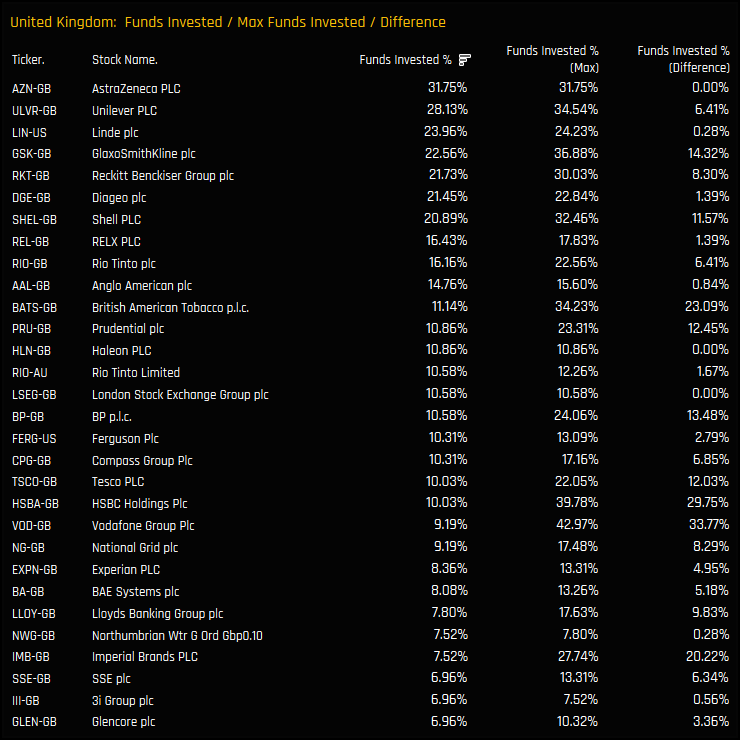
The chart to the rights shows the 30 most widely held stocks in the United Kingdom among Global managers. The 2nd column shows the maximum ever percentage of funds invested in each stock and the last column the difference between the two. Vodafone is the 21st most widely held stock and has the largest gap to maximum ownership across all stocks in the UK (only HSBC comes close). Perhaps the small opening positions highlighted above signal the start of position building, but it’s not enough to suggest a reversal of the trend. For now, Global managers have little incentive to buy back in.
Please click on the link below for the full data report on Global active fund positioning
For more analysis, data or information on active investor positioning in your market, please get in touch with me on steven.holden@copleyfundresearch.com


