Global Funds: Q3 Performance & Attribution

359 Active Global Funds, AUM $950bn.

Q3 Performance & Attribution

In this piece, we provide an overview of Q3 performance among the Global active funds in our analysis. We look at quarterly performance broken down by Style and Market Cap focus, together with longer-term analysis of active versus passive. We then breakdown this quarter’s performance based on the average active Global fund stock portfolio versus the iShares MSCI ACWI ETF.

Q3 Active Returns

Active Global managers posted an average return of -6.99% in the third quarter of 2022. This was largely in line with the benchmark MSCI ACWI return of -6.82%, with 46.75% of managers outperforming. Growth managers recovered some ground in Q3 despite the falling market, with the average Aggressive Growth manager outperforming their Value peers by +1.70% over the period.

The best and worst performers on the quarter are listed below. On top are Baron Global Advantage (1.74%) and the Scottish Mortgage Investment Trust (0.53%), 2 of 4 GARP managers occupying the top spots. Of the 15 worst performers on the quarter, 8 are either Value or Yield focused.


Returns by Style & Market Cap Focus

The grid below shows the top 3 and bottom 3 performers in each Style and Market Cap bucket

Long-Term Performance

The last 12-months haven’t been particularly kind to active Global managers, with cumulative underperformance of -2.47% after a painful Q4 last year and Q1 of 2022. In fact, this is the first time we have seen 4 consecutive quarters of underperformance in over a decade, so perhaps Q4 this year stands a good chance of bucking the trend.

Over the longer-term, the performance of Global active managers has closely tracked the benchmark MSCI ACWI index on average, though the sustained periods of outperformance seen in the early 2000s haven’t been repeated in recent years.


Fund Positioning

We now analyse the drivers behind this quarter’s absolute and relative performance. We start by looking at the average stock portfolio generated from the holdings of the 359 funds in our Global analysis. This is the portfolio we use for our monthly positioning analysis. The major exposures are highlighted in the middle Grid, with the USA a massively dominant allocation across all sectors. The US Tech allocation of 15.59% is larger than the combined allocations of the UK, Japan and France, for example. On a stock level, Microsoft Corporation tops the list, with average holding weights of 3.0% though managers hold slightly more in cash. The top 40 stocks listed in the right-hand table account for 28.2% of the total portfolio.

Fund Performance

The performance of the active Global portfolio comes in at -6.93% on the quarter. This differs slightly from the ‘average fund performance’ of -6.99% due to a combination of fees, delays in fund reporting and the fact that we take monthly snaps of each portfolio. The charts below show the performance of each country, sector, country sector and stock in the portfolio. The underperformance of China & HK, Taiwan and Spain are standouts, whilst the US remained relatively resilient throughout the quarter.

Portfolio Contribution

Marrying the performance of each portfolio component with the weight in the active portfolio provides the contribution of each country, sector and stock to the overall quarterly performance of -6.93%. The USA alone accounts for -2.83% of the total return over the quarter, with US Tech (Microsoft/Adobe) and US Communication Services (Alphabet/Meta) contributing the most to quarterly losses. Positives were much smaller in nature and led by US Consumer Discretionary (Amazon/Tesla), US Energy (Conoco/Marathon) and Indian Financials (HDFC Bank).

Relative Fund Positioning

To understand the drivers of the relative to benchmark performance over the quarter, we first need to look at the positioning of the active portfolio in relation to the benchmark. We use the iShares MSCI ACWI ETF (ACWI) as our benchmark proxy. On a country level, active managers are underweight US Stocks by -5.29% on average, with active managers running overweights across most of Developed Europe. On a sector level, underweights in US Consumer Discretionary (Tesla/Amazon) and US Tech (Apple/Microsoft) are offset by overweights in Cash, UK Consumer Staples (Reckitt/Unilever) and French Industrials (Schneider Electric).

Portfolio Attribution

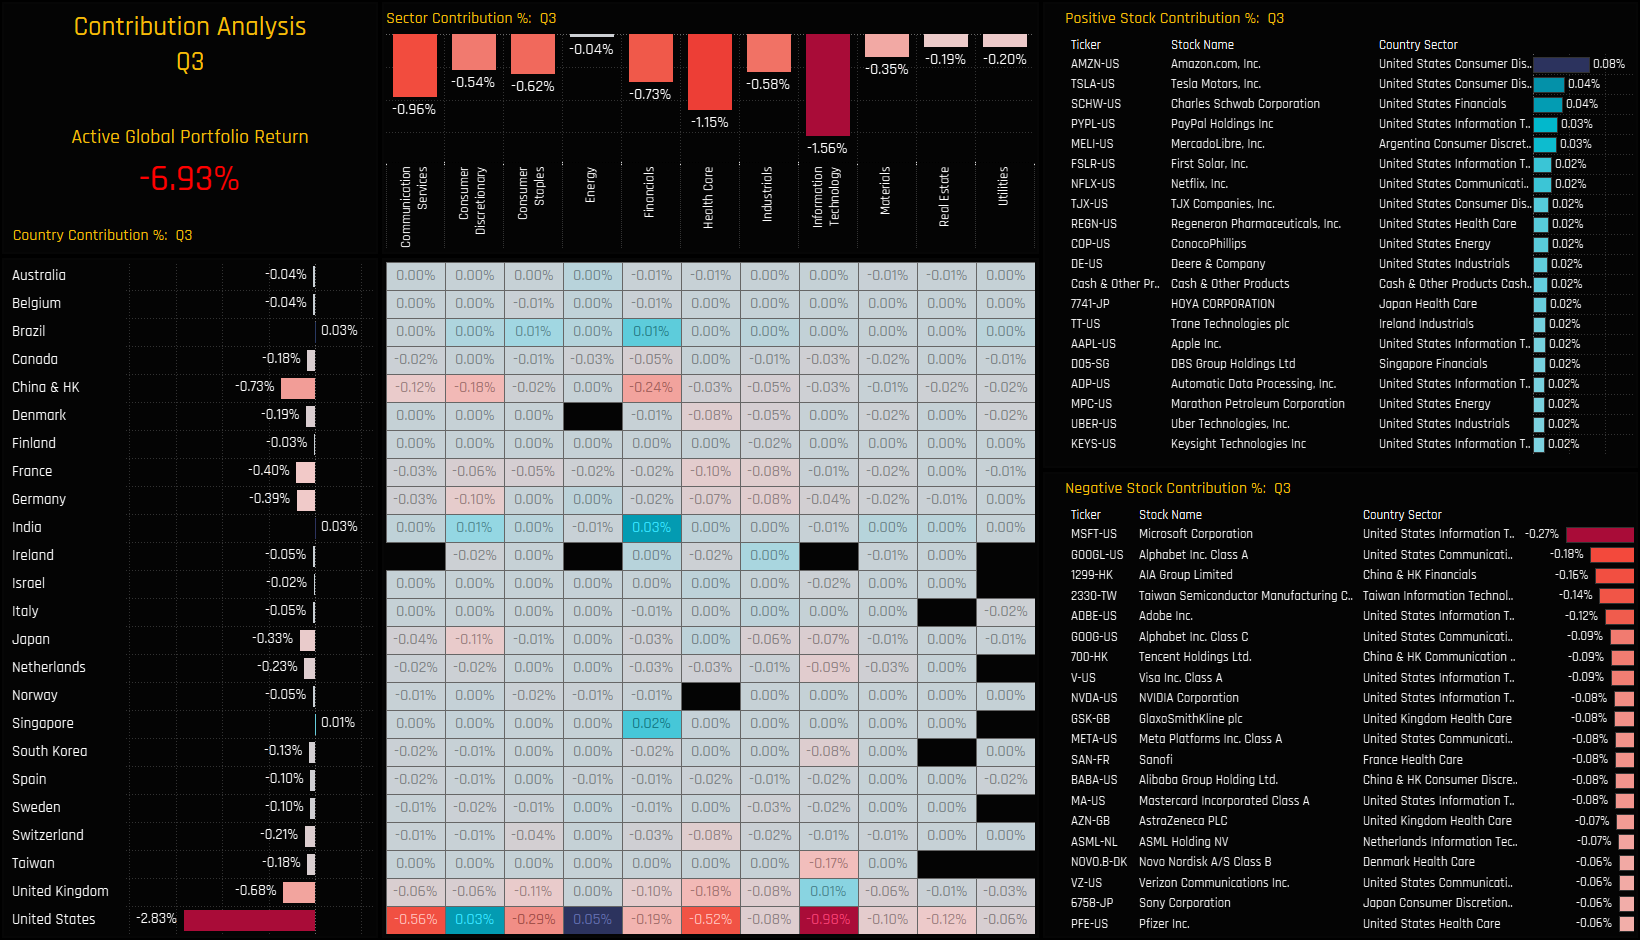
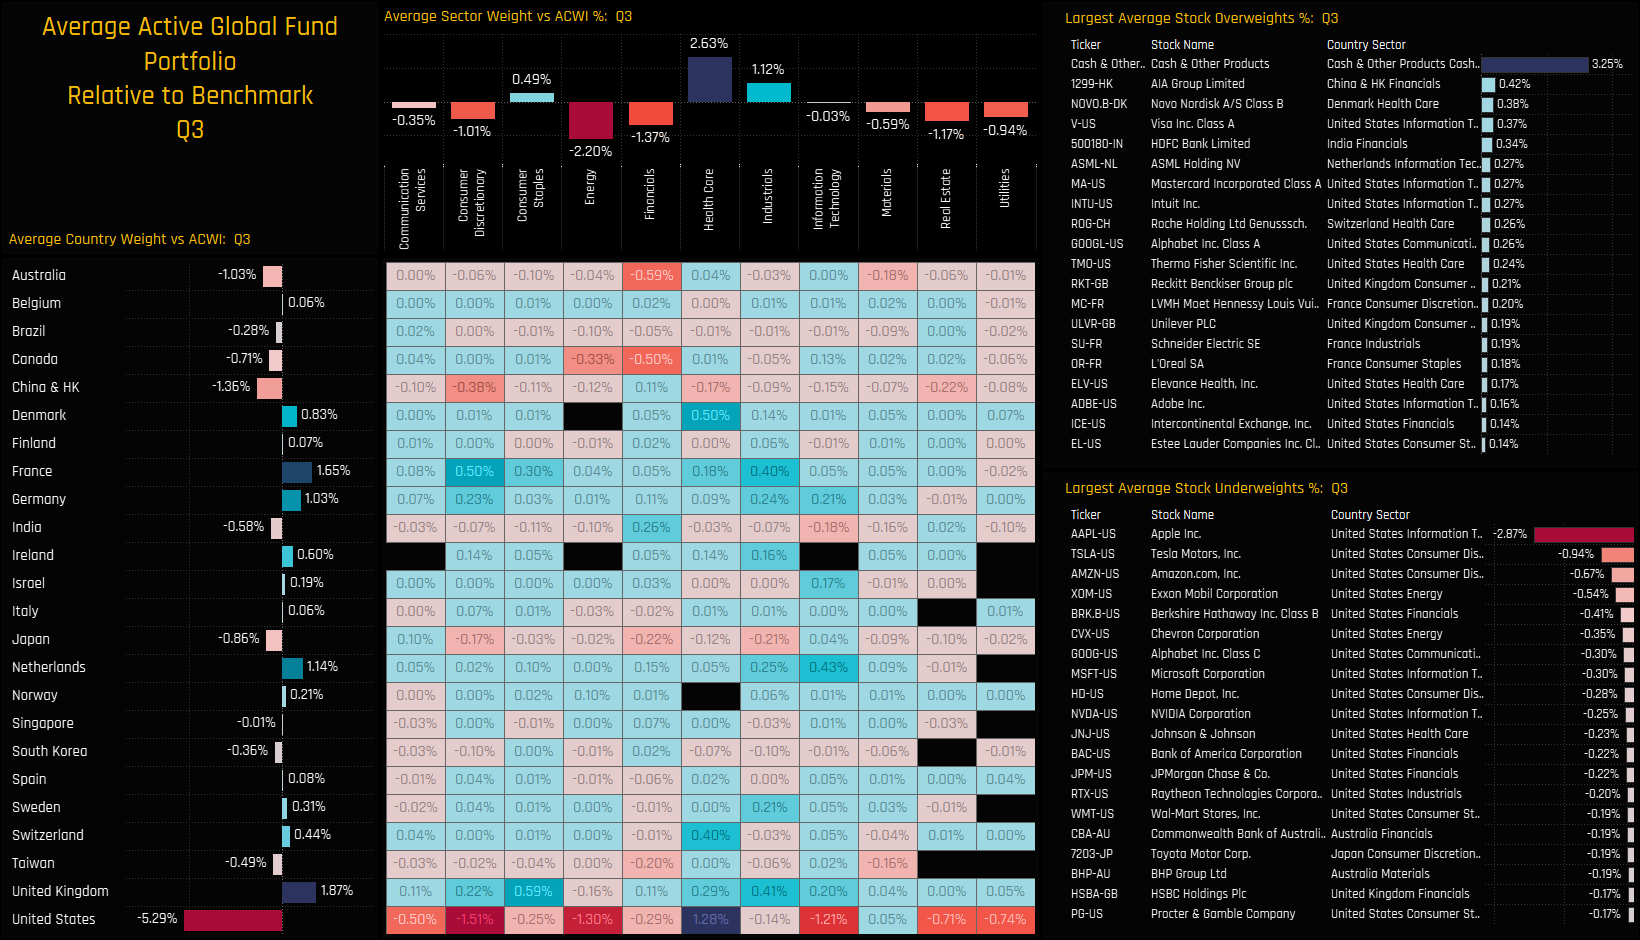
Marrying the performance of each portfolio component with the relative overweights and underweights in the active portfolio provides the attribution of each country, sector and stock towards the overall underperformance of -0.22% on the quarter. Again, this differs slightly from the underperformance of -0.17% derived from the fund performance for the reasons stated above, and the fact that we are using the ETF and not the MSCI Index. Reflecting the fact that performance between active and passive was largely in line, there were few standout generators of relative gains or losses. The underweight in China & HK generated positive outperformance of +0.23%, but this was offset by the outperformance of US Consumer Discretionary underweights, led by Apple Inc and Tesla Motors.

For more analysis, data or information on active investor positioning, please get in touch with me on steven.holden@copleyfundresearch.com