In this piece, we provide an overview of Q3 performance among the active MSCI China funds in our analysis. We look at quarterly performance broken down by Style and Market Cap focus, together with longer-term analysis of active versus passive. We then breakdown this quarter’s performance based on the average active China fund stock portfolio versus the iShares MSCI China ETF (MCHI).
Q3 Active Returns
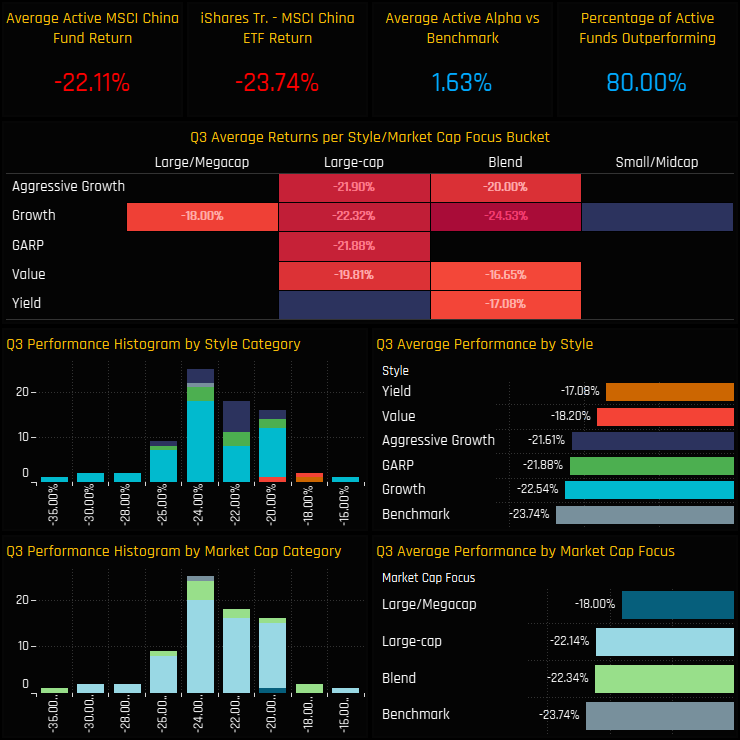
Q3 was dreadful for active China managers on an absolute basis, but pretty great relative to benchmark. Average weights of -22.11% beat the iShares MSCI China ETF by +1.63% with 80% of the managers in our analysis outperforming. The small number of Value and Yield funds in our analysis performed well, but all Style groups beat the MCHI ETF over the quarter.
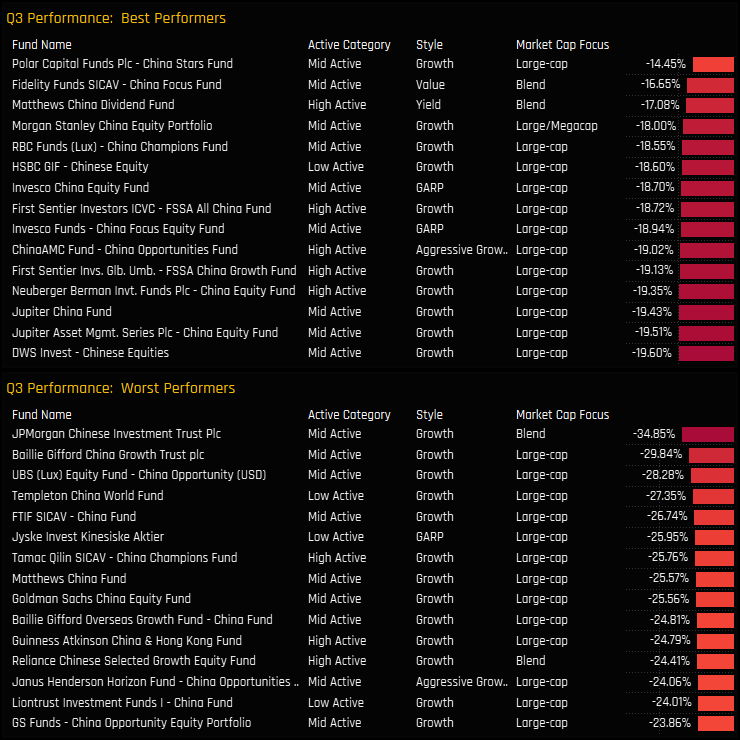
The top and bottom performers on the quarter are listed below. On top is the Large cap Growth strategy of Polar Capital China Stars on -14.45%, followed by the Value and Yield funds of Fidelity China Focus (-16.65%) and Matthews China Dividend (-17.08%). On the negative side, JP Morgan Chinese Investment Trust lost more than a 3rd of its value in Q3.
Returns by Style & Market Cap Focus
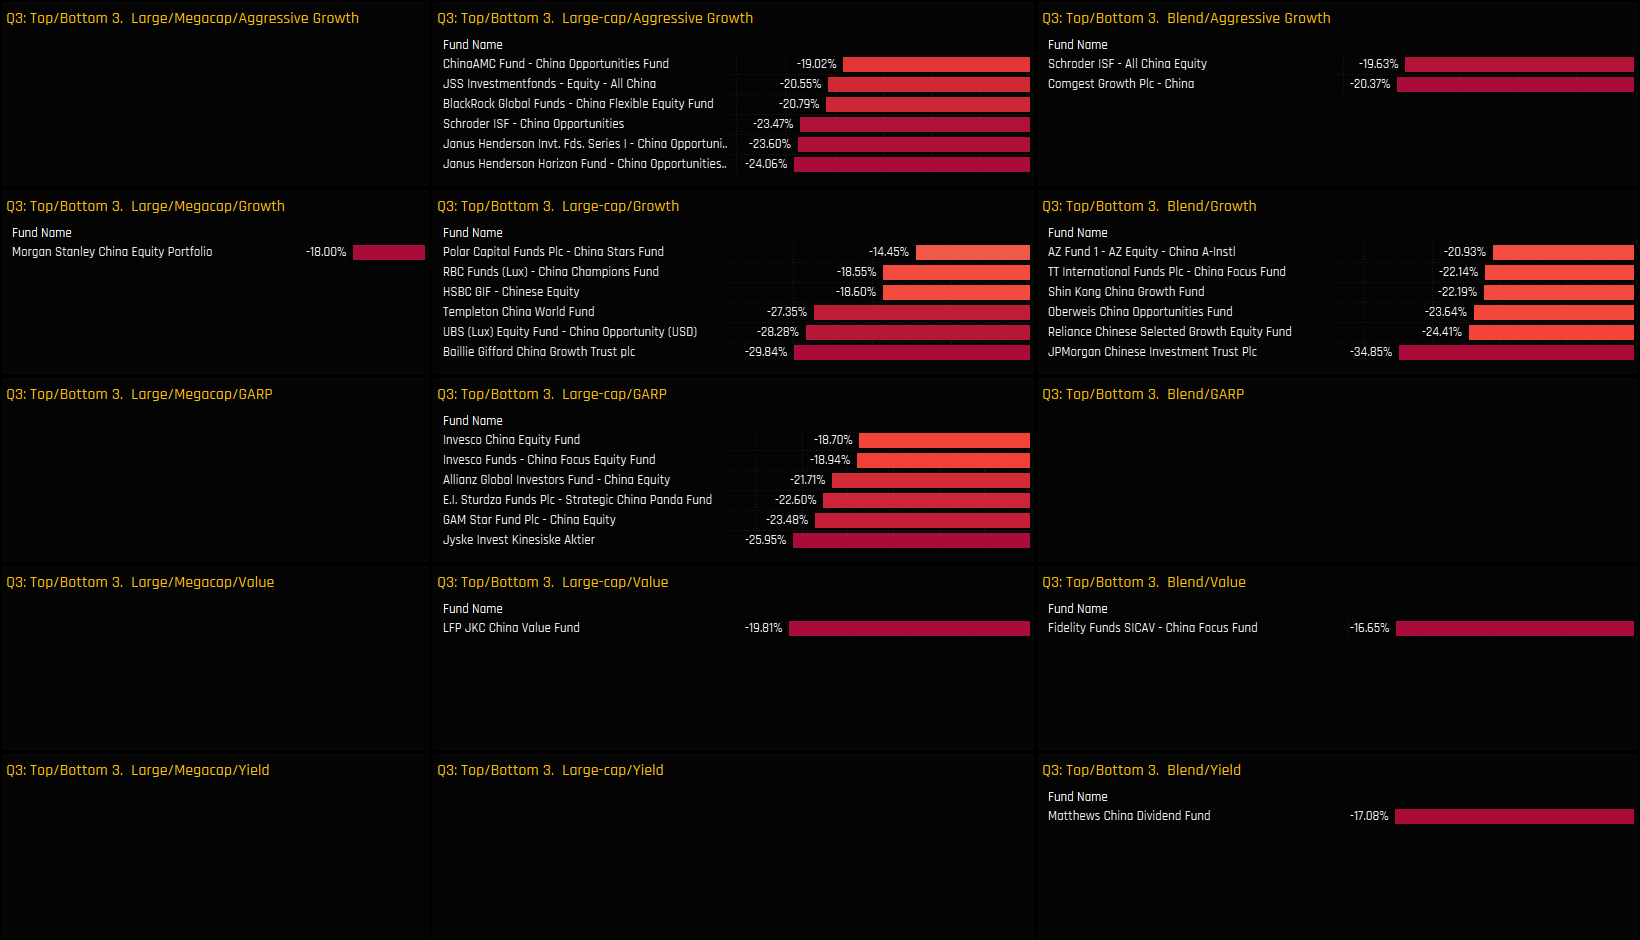
The grid below shows the top 3 and bottom 3 performers in each Style and Market Cap bucket
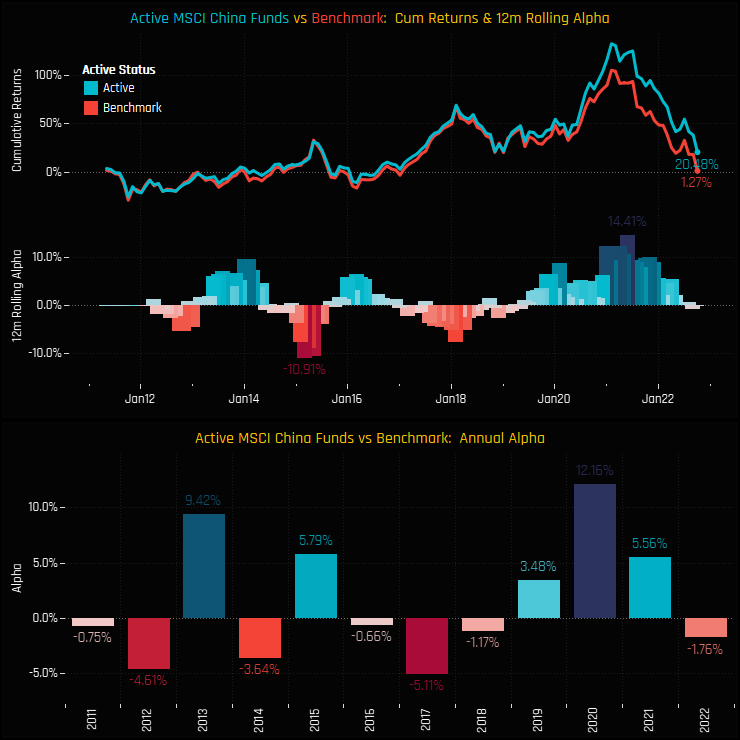
Long-Term Performance
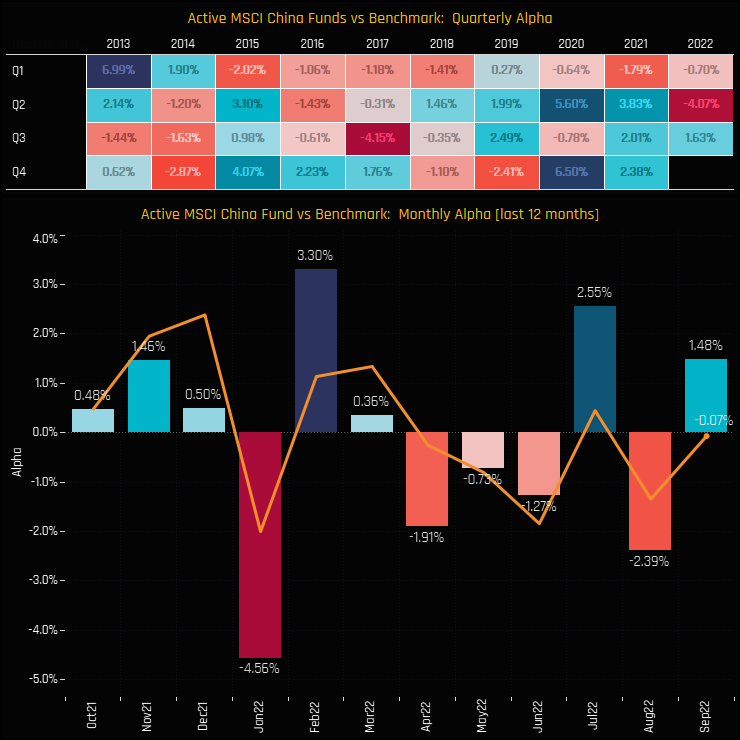
The outperformance in Q3 helped reverse some of the the underperformance seen in Q2, but managers remain underwater for the year.
Over the longer-term, active China managers have beaten their benchmark over the last decade, on average. Though there are more discrete years of underperformance, the outperforming years are much larger in magnitude.
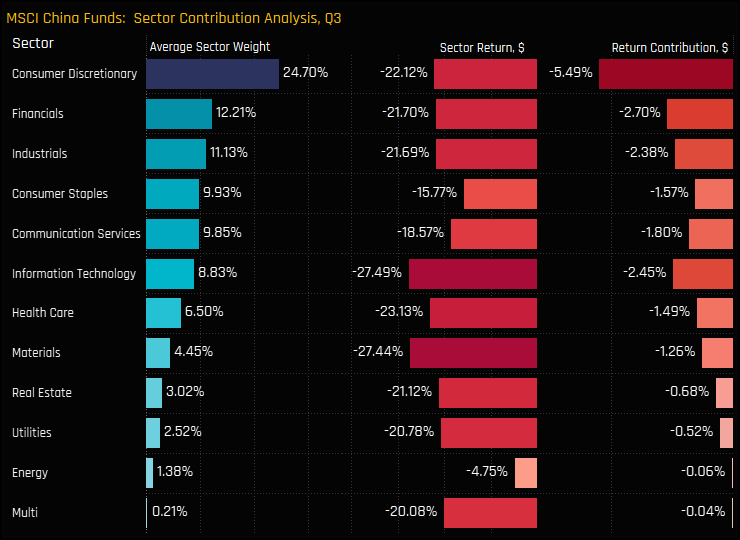
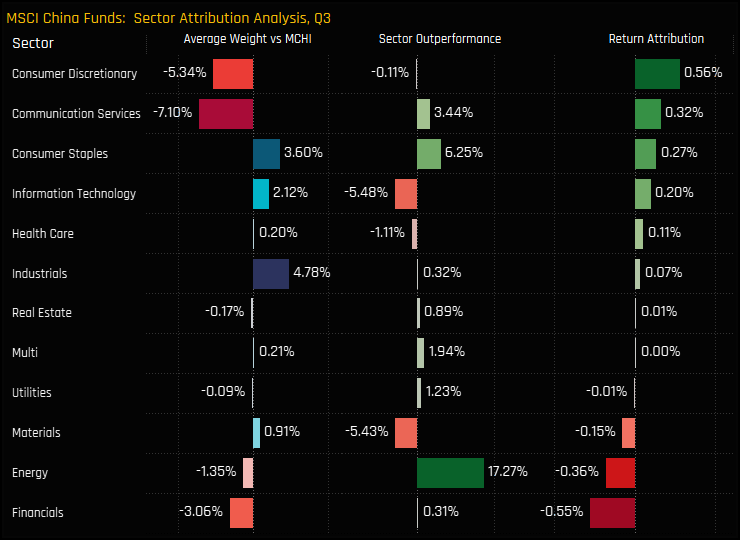
Sector Positioning, Contribution & Attribution
The chart below shows the breakdown of sector weights for the average active China fund, it’s associated Q3 return and the contribution to the overall quarterly performance. The active portfolio returned -20.41% on the quarter, with all sectors negative, led by Consumer Discretionary and Information Technology.
Relative to benchmark, underweights in Consumer Discretionary and Communication Services generated outperformance, whilst underweights in Energy and poor stock selection in Financials dragged on relative returns.
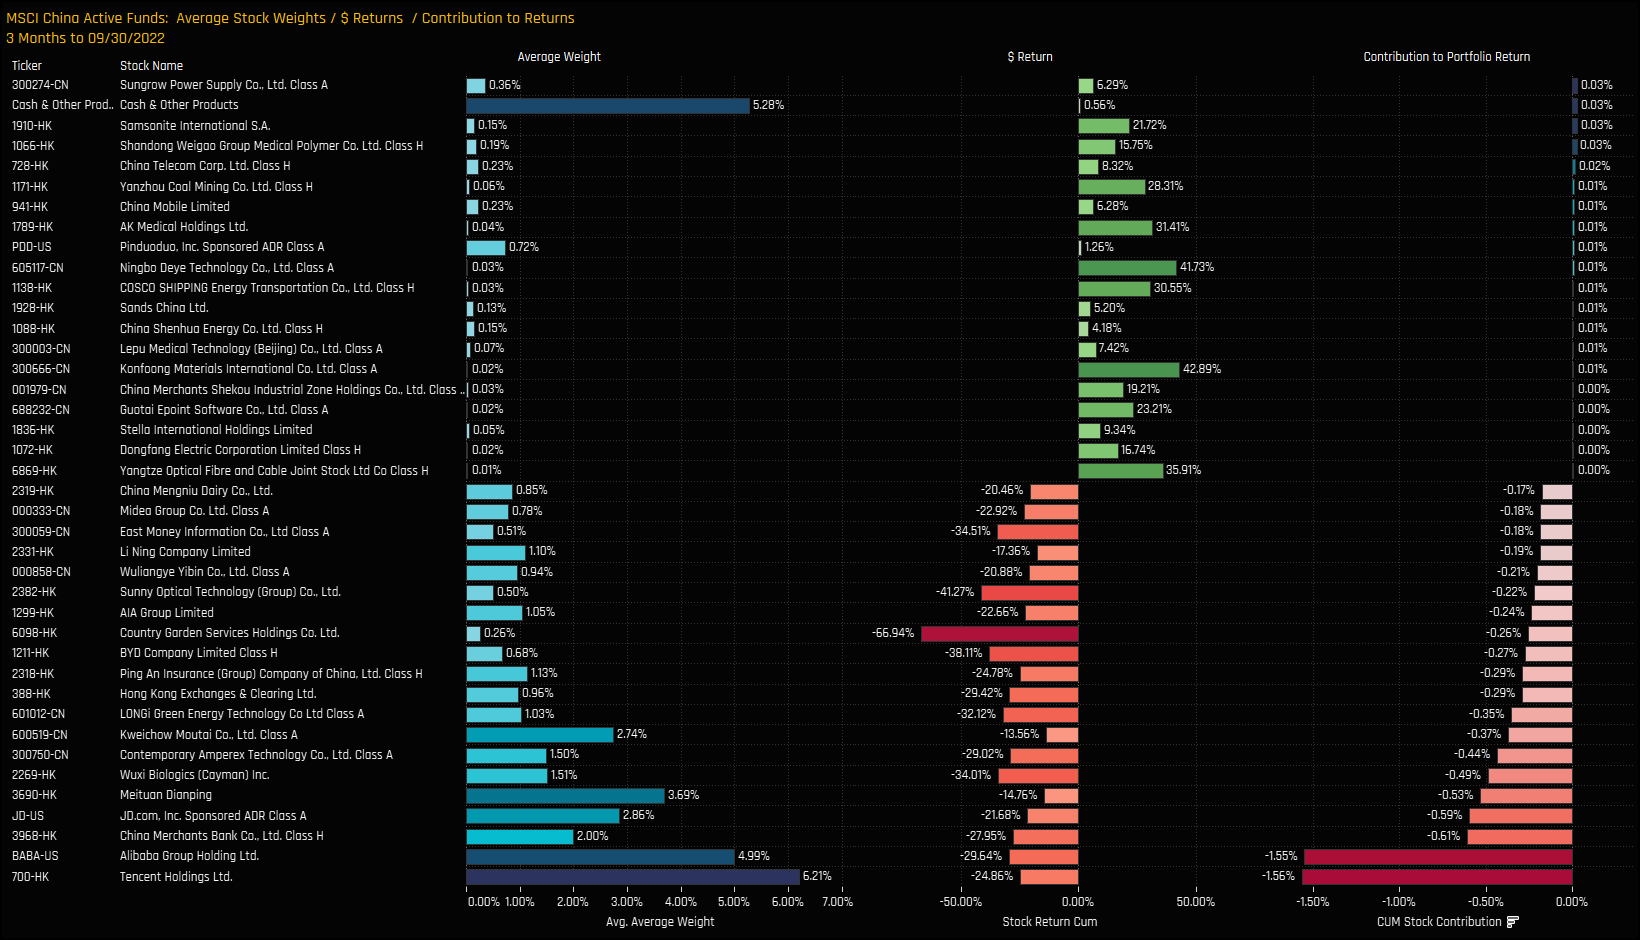
Stock Positioning & Contribution
On a stock level, there were only a handful of companies that posted positive returns in Q3 though these were typically the smaller exposures among active China managers. Cash holdings were obviously beneficial, but poor performance from the larger weights led by Alibaba Group Holdings and Tencent Holdings were the key drivers of poor returns in Q3.
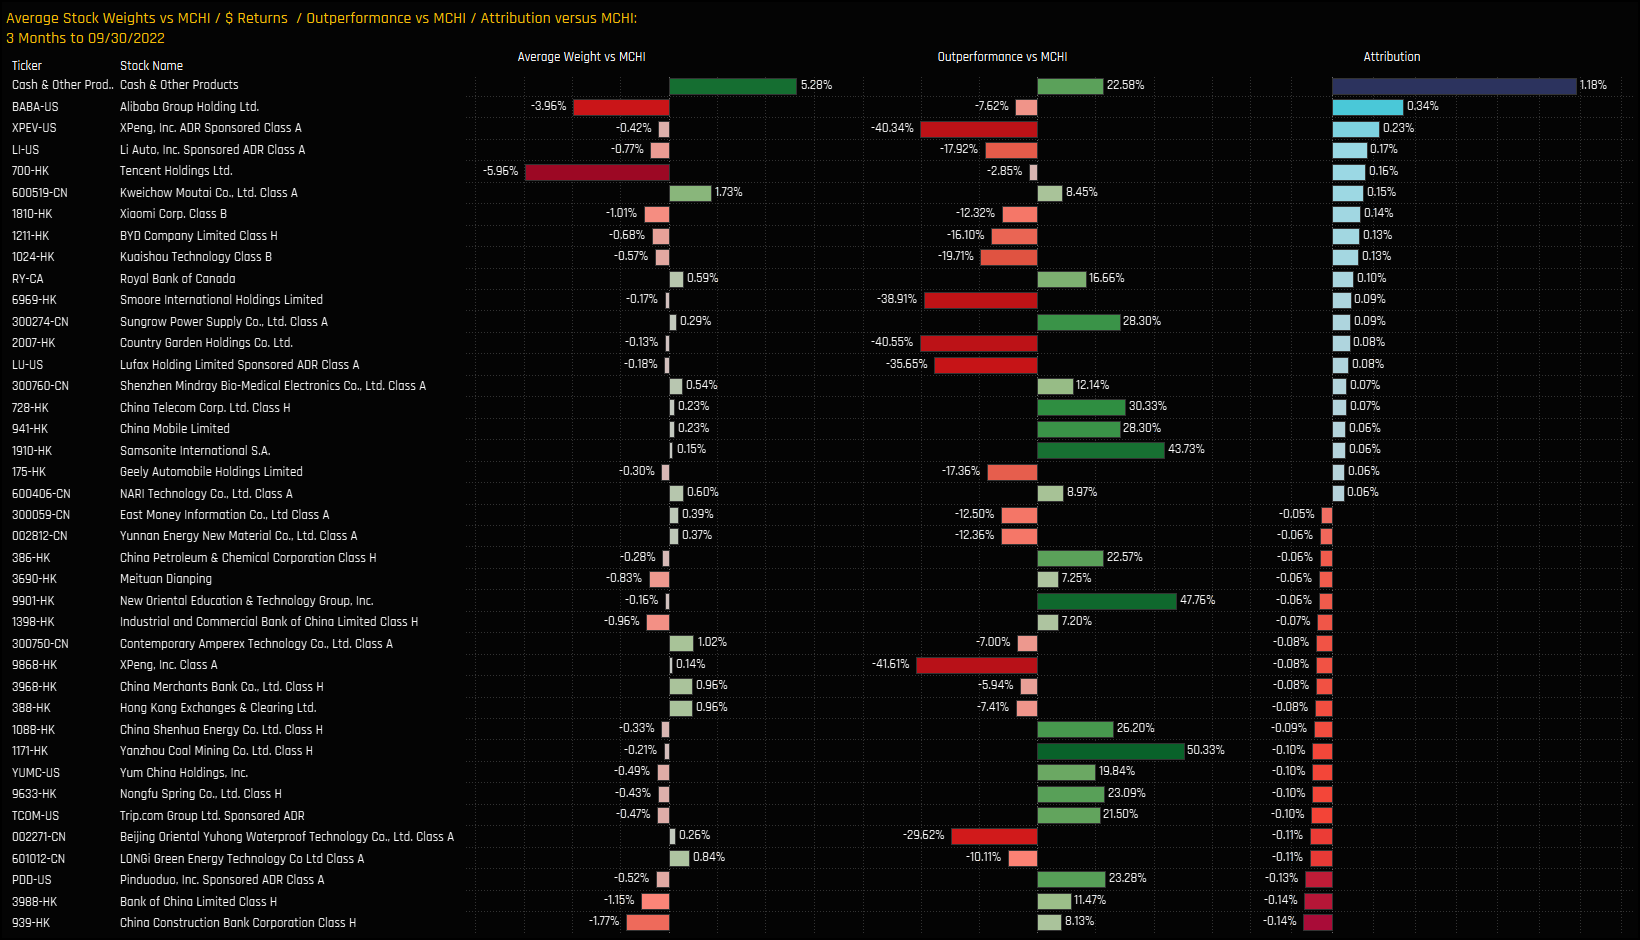
Stock Positioning & Attribution
Relative to benchmark the picture looks more favourable. Cash was king, but so were underweights in Alibaba Group Holdings, XPeng Inc and Li Auto which together contributed +1.92% of outperformance for the average active China fund. Offsetting these gains, but to a lesser degree were underweights in China Construction Bank and Bank of China, alongside overweights in LONGi Green Technology and Beijing Oriental Yuhong Waterproof Technology. Overall, a tough quarter for active China managers, but one tinged with the silver lining of some decent outperformance.


