In this issue:
Investment Managers: Out of Favour
Consensus Overweight in UK Stocks
EMEA Technology Rotation
358 Global Equity Funds, AUM $914bn
Investment Managers: Out of Favour
Sentiment in the Investment Managers industry group is at rock bottom.
Time-Series and Industry Activity
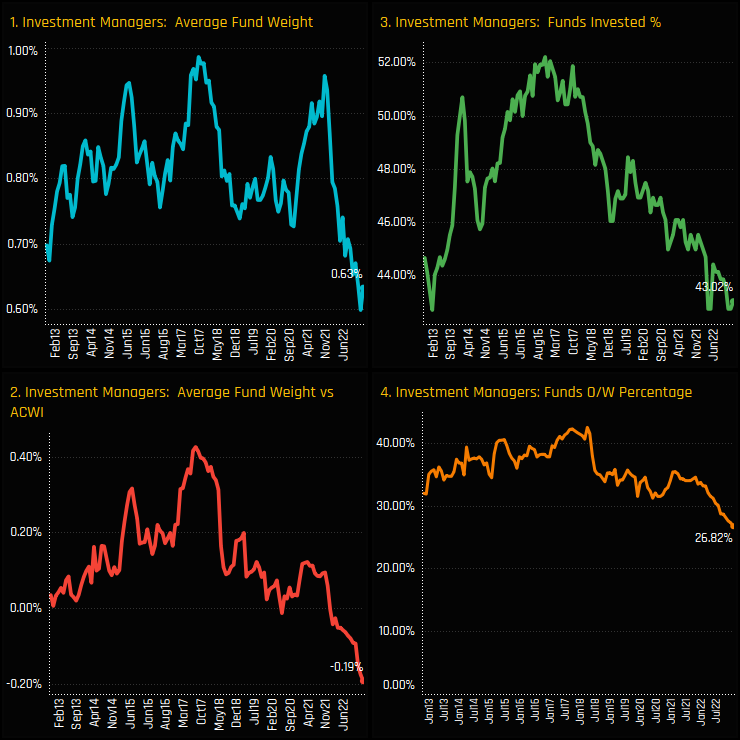
Global fund allocations in the Investment Managers industry group are on a downward trend. In fact, all measures of ownership are close to their lowest on record, with active Global managers moving from a net overweight to an underweight in 2021, leaving 43% of funds invested and a record low of just 26.8% positioned overweight the SPDRs MSCI ACWI ETF.
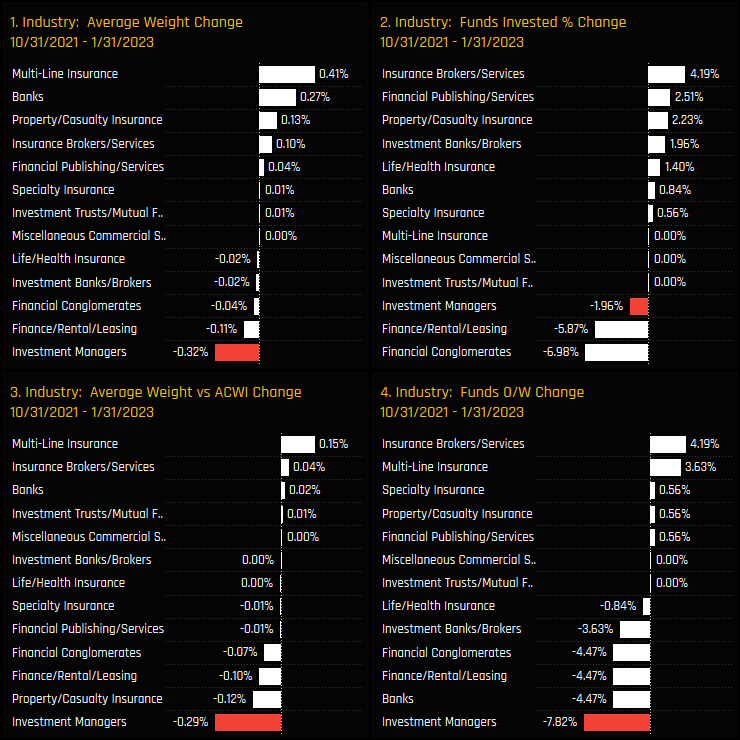
The below charts show the changes in our ownership metrics between the highs of October 2021 and end of January 2023 among the key Industry Groups within the Financials sector. Investment Managers have suffered the largest drop in average weight of -0.32%, the largest drop in relative weight of -0.29% and the most funds switching to underweight. Instead, Global funds increased allocations in Banks and Insurance stocks.
Industry Sentiment
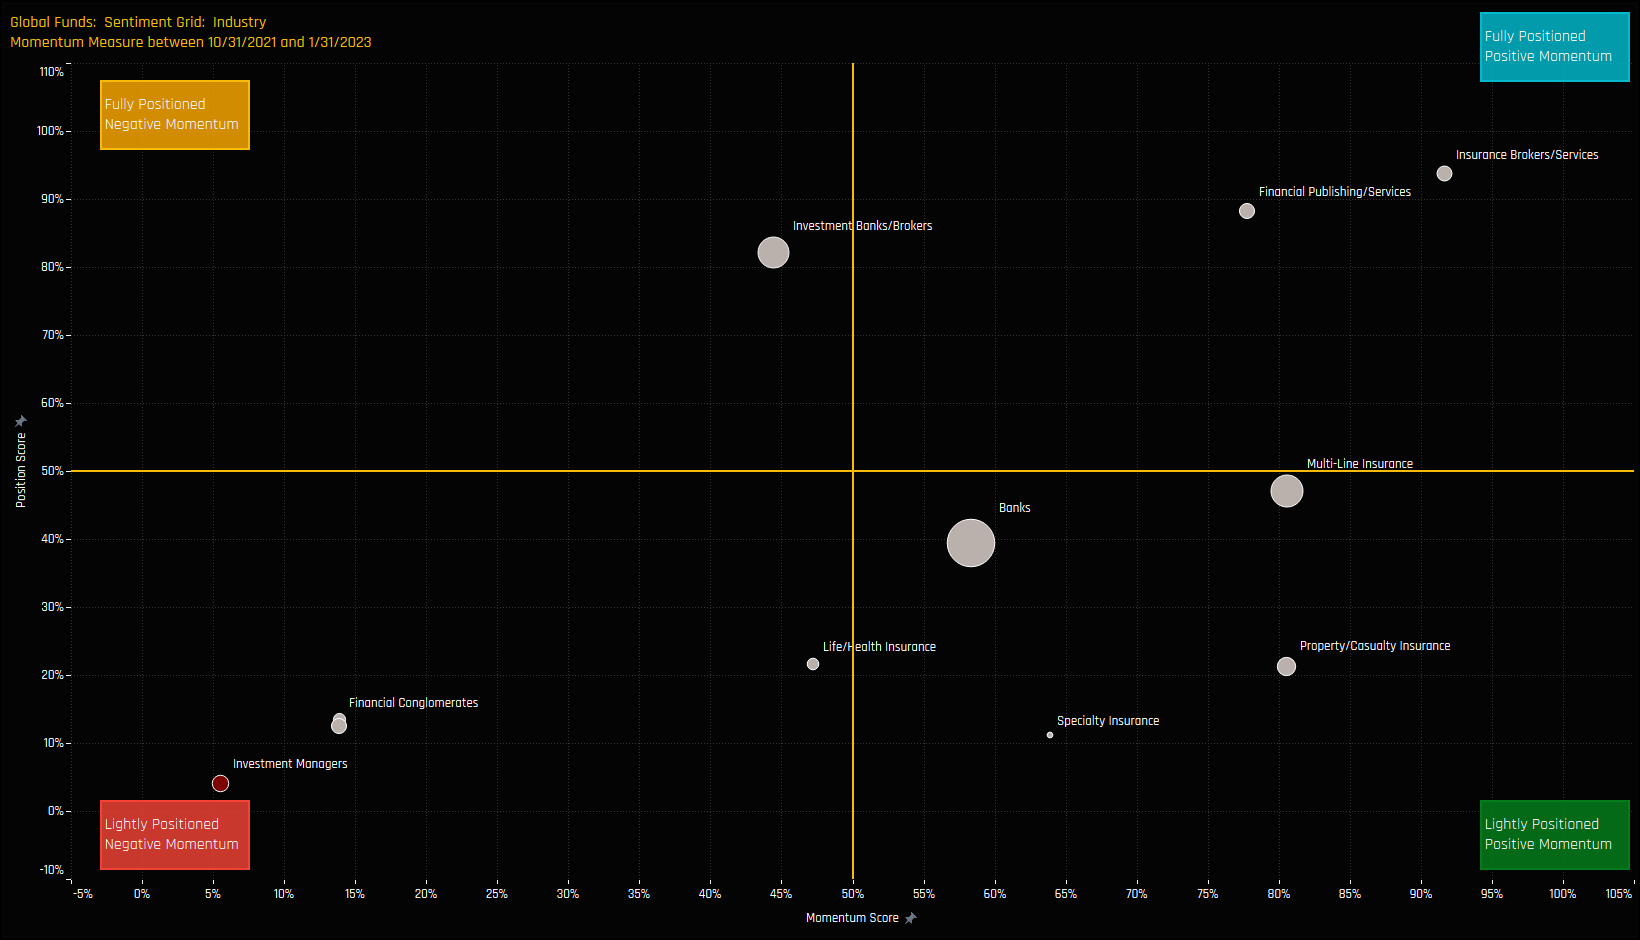
The sentiment grid below shows where current positioning in each Financials Industry group sits versus its own history going back to 2013 on a scale of 0-100% (y-axis), against a measure of fund activity for each Industry between 07/31/2022 and 01/31/2023 (x-axis).
The placement of the Investment Managers industry group in the bottom left hand quadrant highlights just out of favour it is versus industry peers. In contrast, Insurance related industries dominate the right side of the Grid, with Insurance Brokers/Services closing in on their highest levels of exposure on record.
Fund Positioning & Activity
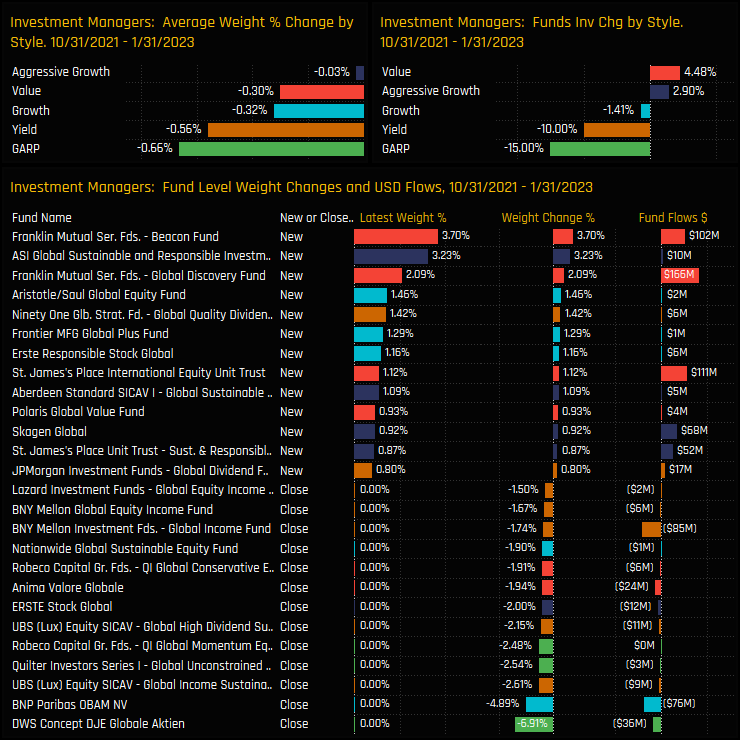
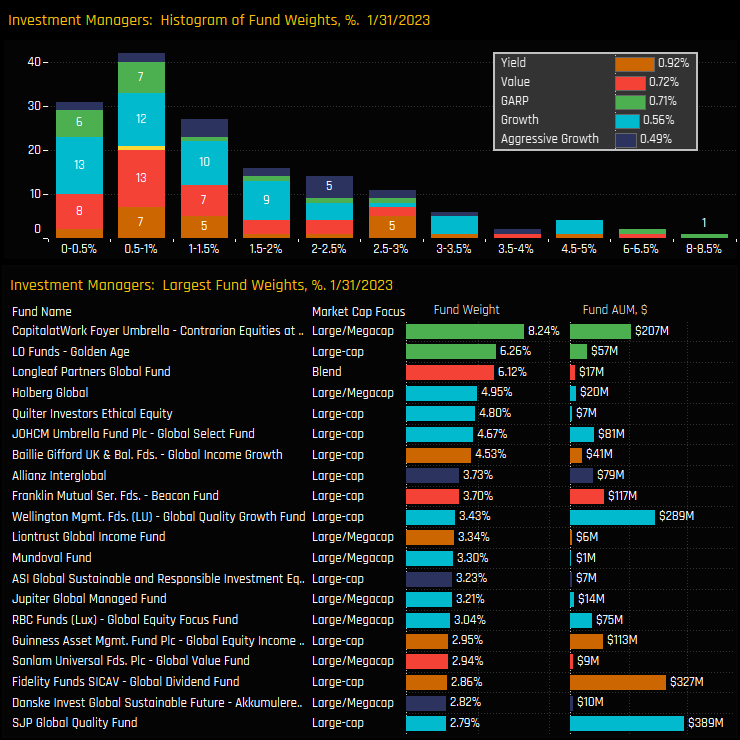
The decline in investment levels was led by GARP, Yield and Growth investors, with notable closures from DWS Global Aitken (-6.9%), BNP Paribas (-4.89%) and UBS Global Income (-2.6%) over the same period. It wasn’t all one-way traffic though, with +4.5% of Value managers adding new exposure and a number of funds increasing weights. On balance though, the sellers were dominant.
Today, the bulk of the holdings distribution sits below 1.5% with an extended right-sided tail. Only 3 funds hold more than a 5% weight, led by CapitalatWork Foyer Contrarian Equity (8.24%) and LO Golden Age (6.26%). On a Style basis, allocations are correlated to Style, with Yield average weights at 0.92% compared to Aggressive Growth on 0.49%.
Stock Positioning & Activity
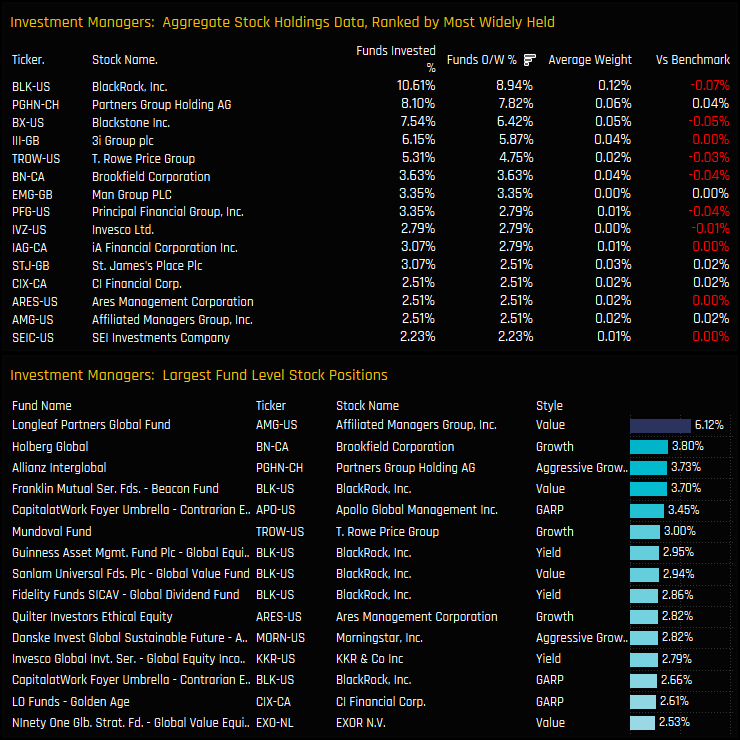
BlackRock Inc is the most widely held company in the Industry group, but is only owned by 10.6% of funds at an average weight of 0.12%. There are no glaring underweights, with investment levels commensurate with their benchmark allocations, on average. On an individual fund level, Longleaf Partners’ 6.12% holding in Affiliated Managers Group tops the list of high conviction positions, with only 5 further fund positions above 3%.
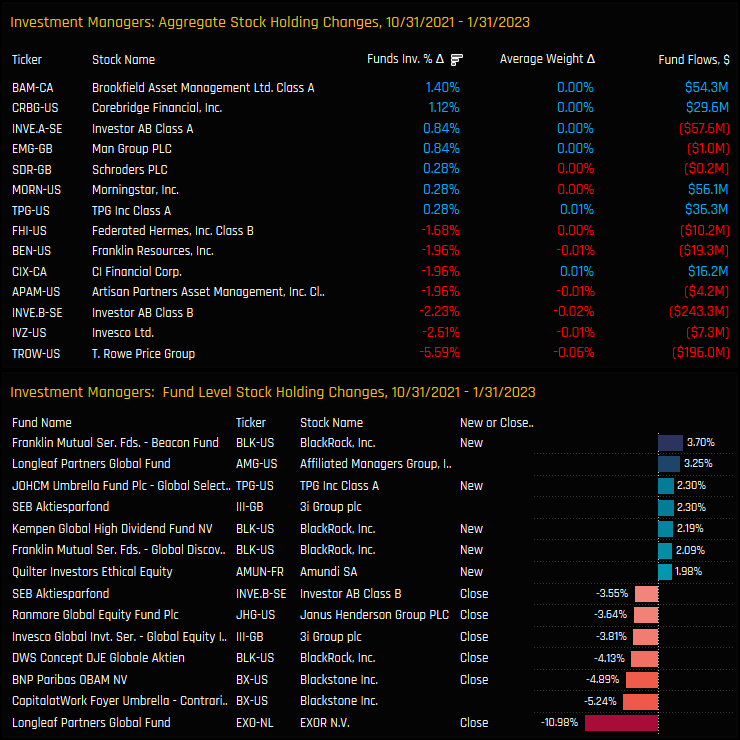
Between 10/31/2021 and 01/31/2023, Global funds scaled down their exposure to T.Rowe Price Group, Invesco Ltd and Investor AB. On an individual fund level, EXOR NV and Blackstone Inc saw sizeable closures. Positive activity was smaller in magnitude, with funds increasing ownership in Brookfield Asset Managers and Corebridge Financial.
Conclusion and Data Report
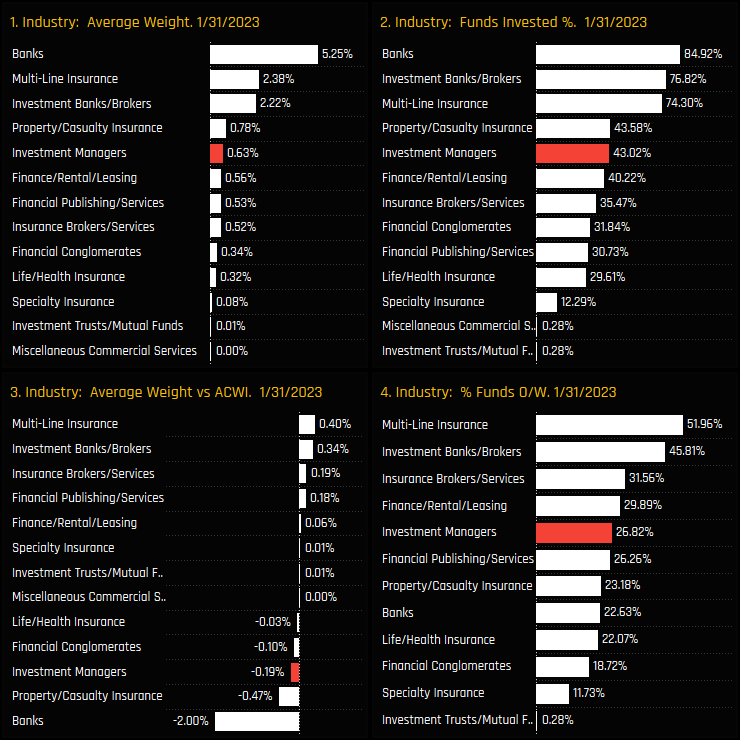
This outward rotation leaves Investment Managers as a low conviction holding within the Financial sector. The chart to the right shows the latest ownership statistics for Financials Industry groups, with Investment Managers the 5th largest and 5th most widely held allocation and the 3rd largest underweight.
Banks are the largest weight at 5.25%, though the majority of Global funds (77.4%) run an underweight position. Arguably the stars of the sector are Multi-Line Insurance and Investment Bank/Brokers. Both are widely held and represent the 2 key overweights in the Financials sector.
And in a sector that has seen a strong recovery from the COVID lows, Investment Managers have been left behind.
Click below for the latest report on Investment Manager positioning among the active Global funds in our analysis.
A record 70.4% of Global Funds are now positioned overweight the UK.
Time-Series & Country Activity
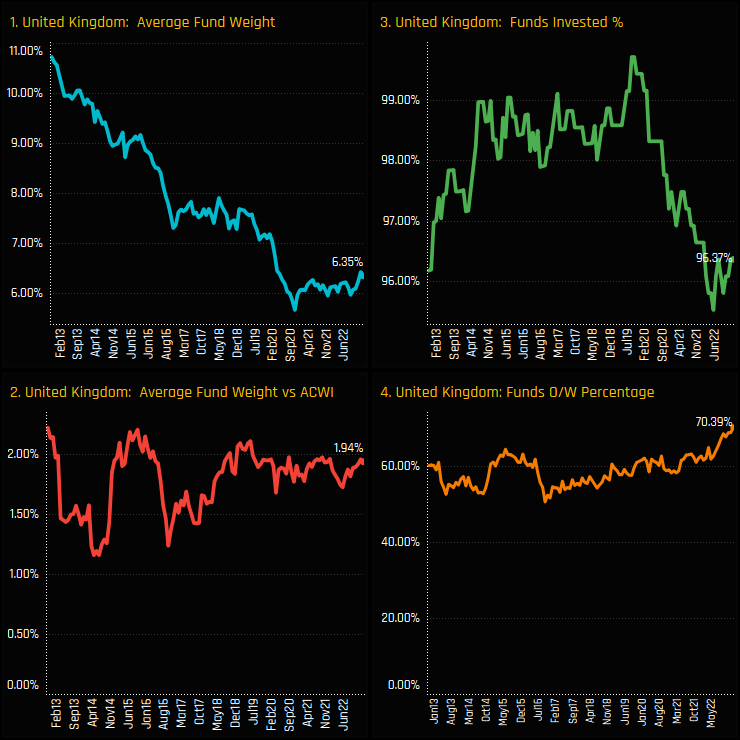
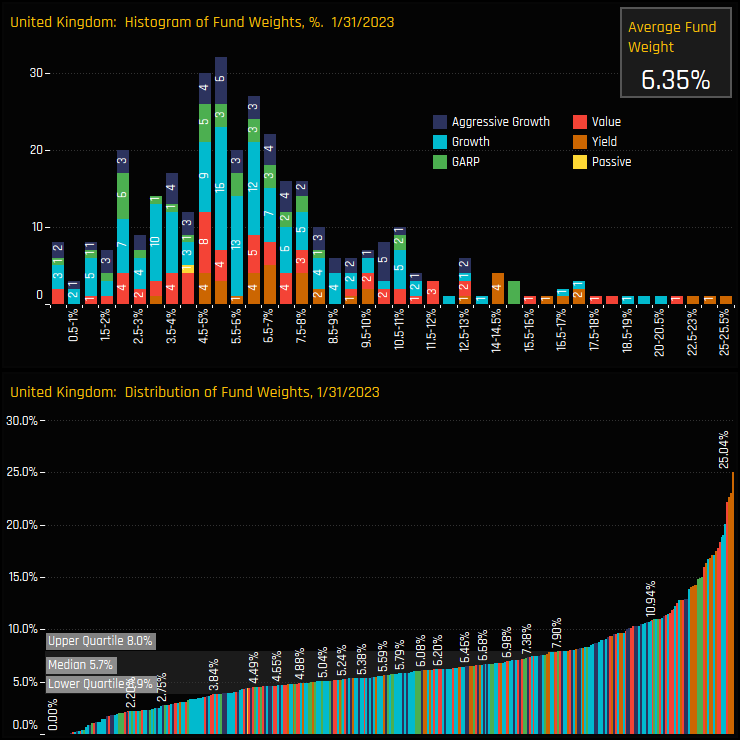
The majority of active Global Funds are expecting UK equities to outperform. Relative to the SPDRs ACWI ETF, a record 70.4% of funds are positioned overweight, with average fund weights +1.94% above the benchmark level. On absolute terms, fund weights in the UK are severely depressed at 6.35%, though there are signs that the decline from 2012 onwards is starting to reverse, with both average weights and the percentage of funds invested moving off the recent lows.
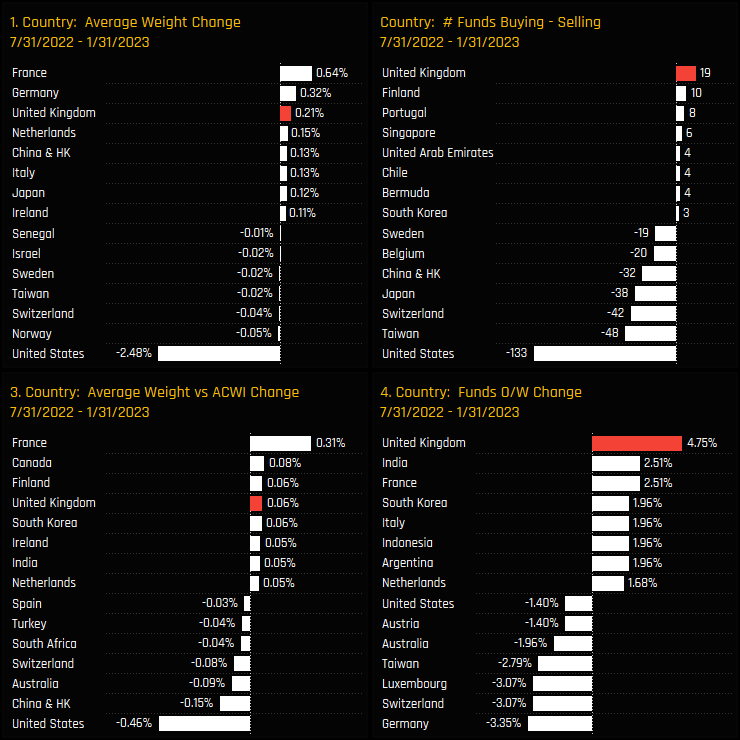
Over the past 6-months, the evidence for a positive re-positioning of UK stocks is clear, with average weights increasing by +0.21%, overweights increasing by 0.06% and a further 4.75% of funds switching to overweight. In a period where the number of funds seeing outflows outnumbered those seeing inflows by a factor of 2, an excess of 19 funds bought in to the UK, the most of any country and in contrast to a net 133 funds selling down USA positions.
Peer Group Positioning & Sentiment
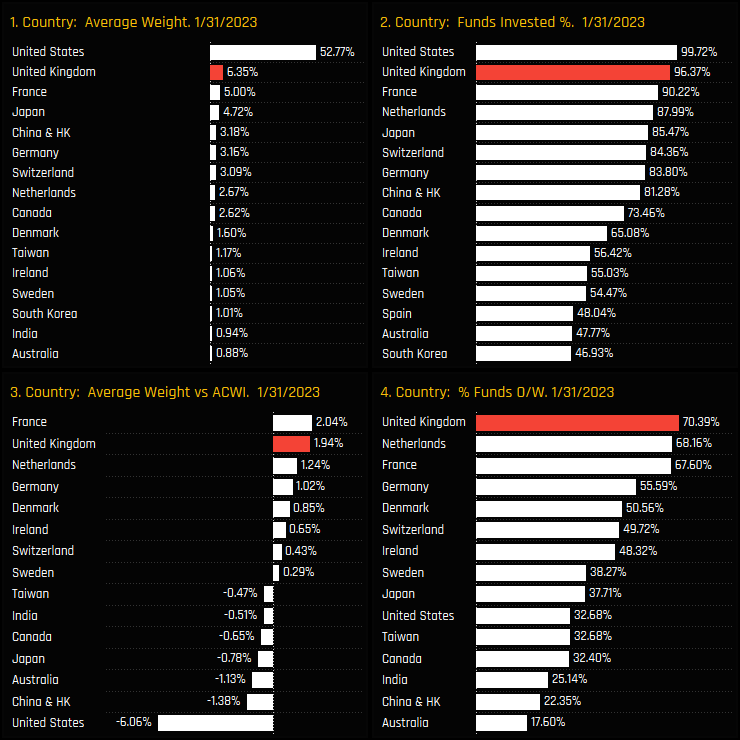
Outside of the USA, the United Kingdom is top of the 2nd tier, ahead of France, Japan and China & HK on both an average weight and funds invested basis. Relative to benchmark, no country is held overweight by more funds, with the net overweight only bettered by France. Global Funds are running a significant underweight in US equities.
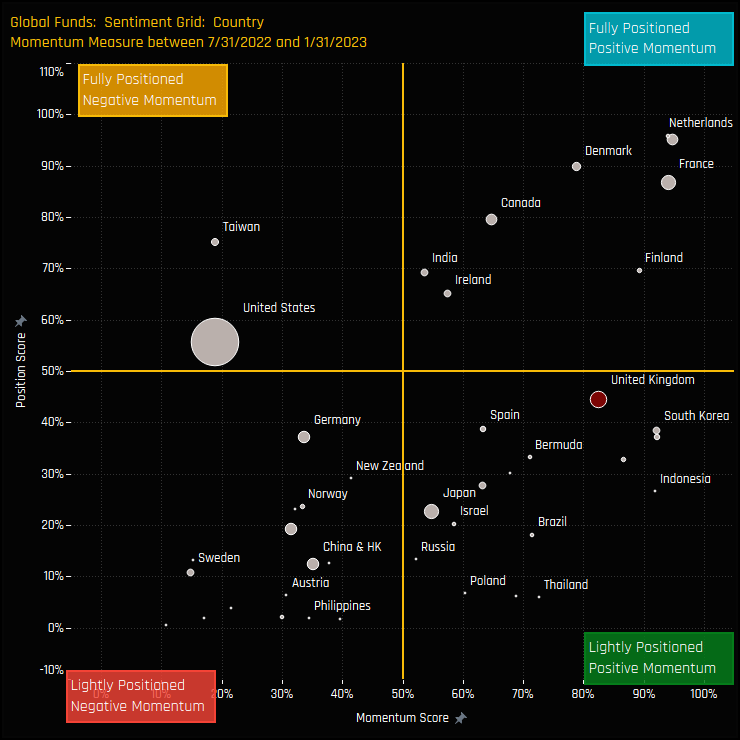
The sentiment grid below shows where current positioning in each Country sits versus its own history going back to 2012 on a scale of 0-100% (y-axis), against a measure of fund activity for each Country between 07/31/2022 and 01/31/2023 (x-axis). The UK’s position in the bottom right of the grid reflects its positive momentum but low absolute weight compared to history.
UK Sector Positioning
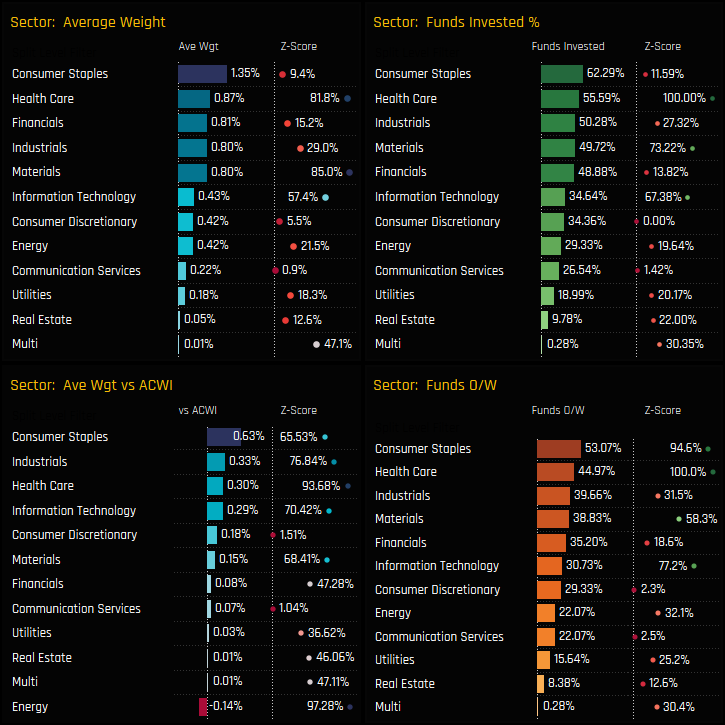
Of the 6.35% allocation in UK equities, nearly three quarters is taken up by the top 5 sectors of Consumer Staples, Health Care, Financials, Industrials and Materials. The overweight is driven by UK Consumer Staples, with 53% of funds overweight at a net +0.63% above benchmark. Only the Energy sector is held as a net underweight and could be described as ‘underowned’, with just 29.3% of funds exposed.
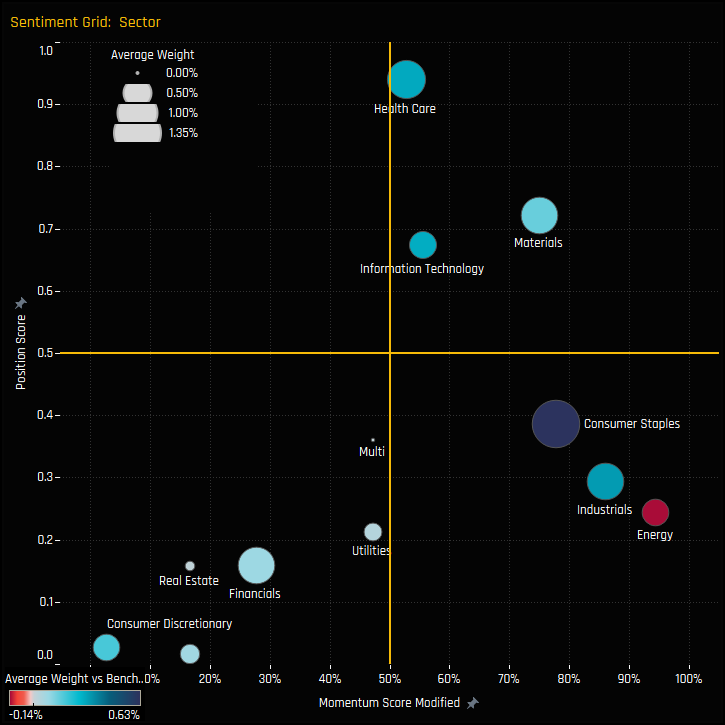
The Sentiment Grid for UK sectors highlights positive momentum among Consumer Staples, Industrials, Energy and Materials, with all but Materials positioned at the lower end of their historical ranges. UK Financials, Consumer Discretionary and Communication Services are out of favour, with depressed positioning and outward rotation over the last 6-months.
Fund Holdings & Activity
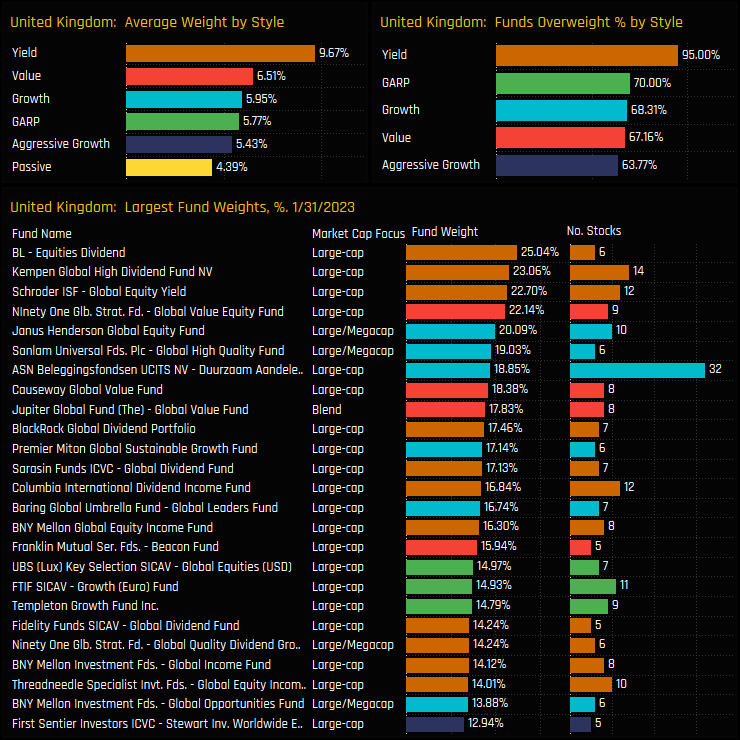
The consensus overweight stance is common across the Style groups, with 95% of Yield managers overweight the UK and 64% of Aggressive Growth managers. All are positioned net overweight the SPDRs ACWI ETF, on average. Yield managers are the most heavily allocated by a distance, with average weights of 9.67% and a dominance among the top 20 largest fund weights.
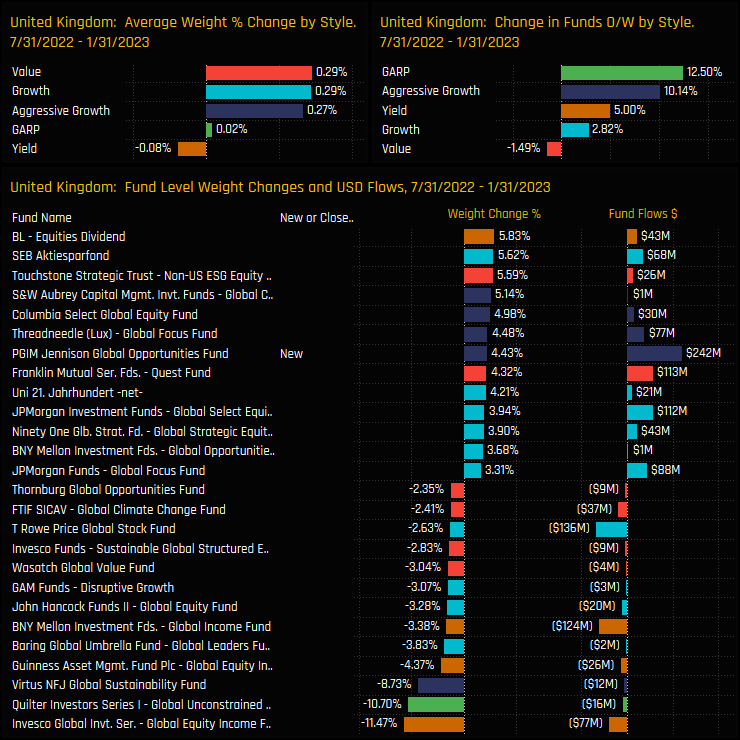
Fund level activity over the last 6-months reflects the growing overweight stance towards the UK, with 12.5% of GARP funds and 10.14% of Aggressive Growth managers switching to overweight. Fund inflows were more common than outflows, though activity wasn’t entirely one-directional, as Invesco Global Income and Quilter Global Unconstrained both cut positions by more than 10%.
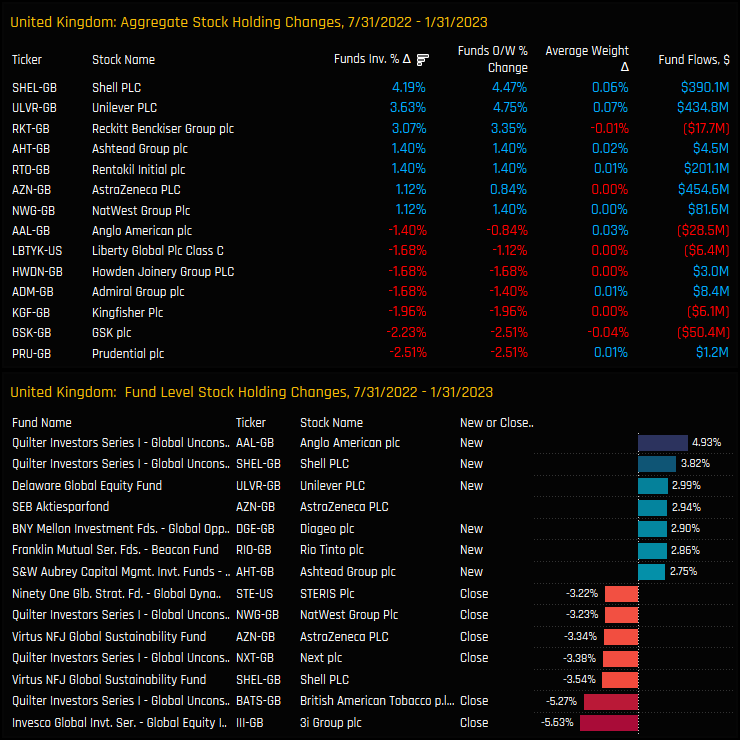
Stock Positioning & Activity
Positive sentiment was reflected in increased positioning in Shell PLC, Unilever PLC and Reckitt Benckiser over the last 6-months, with the percentage of funds invested increasing by 4.2%, 3.6% and 3.1% respectively. These increases outweighed decreases seen in Prudential, GSK and Kingfisher.
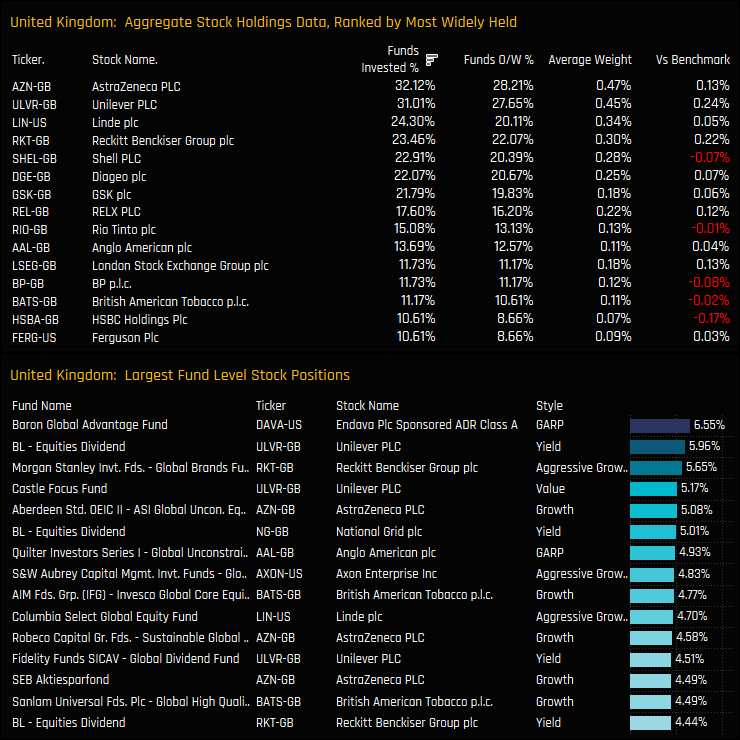
The latest snap of positioning shows AstraZeneca and Unilever as the most widely held stocks in the UK, owned by 32.1% and 31% of funds respectively. Most of the major stocks in the UK are held overweight the benchmark on average, save for BP, Shell and the perennially underowned HSBC Group. Among a sea of high conviction positions in Unilever, AstraZeneca and Reckitt Benckiser Group, Baron Global Advantage’s 6.55% holding in Endava is the standout.
Conclusions & Data Report
Global managers appear optimistic towards the UK. A record number of managers are positioned overweight, marking a reversal in the trend of decreasing allocations seen over the last decade. With the USA so dominant in Global strategies, the United Kingdom is carving a niche for itself as ‘The best of the rest’.
In a market as broad and as diverse as the UK, this increase in sentiment hasn’t been spread evenly across all sectors, with a clear rotation in to Industrials, ‘Staples, Energy and Materials partially offset by decreases in Financials and Consumer Discretionary. However, as it stands, active Global managers remain overweight every sector bar Energy, and every Style group from Value to Growth is positioned overweight the SPDRs MSCI All Country World ETF.
The charts to the right show the histogram and distribution of UK fund weights among the 358 funds in our analysis. The bulk of the distribution sits above the benchmark weight of 4.39%, with 50% of managers above 5.7% and 25% above 8%. To be underweight the UK today puts you in the clear minority.
Please click on the link below for the latest data report on UK positioning among active Global Funds.
Global Managers move to their highest ever overweight in the EMEA Technology sector.
Time-Series & Regional Sector Rotation
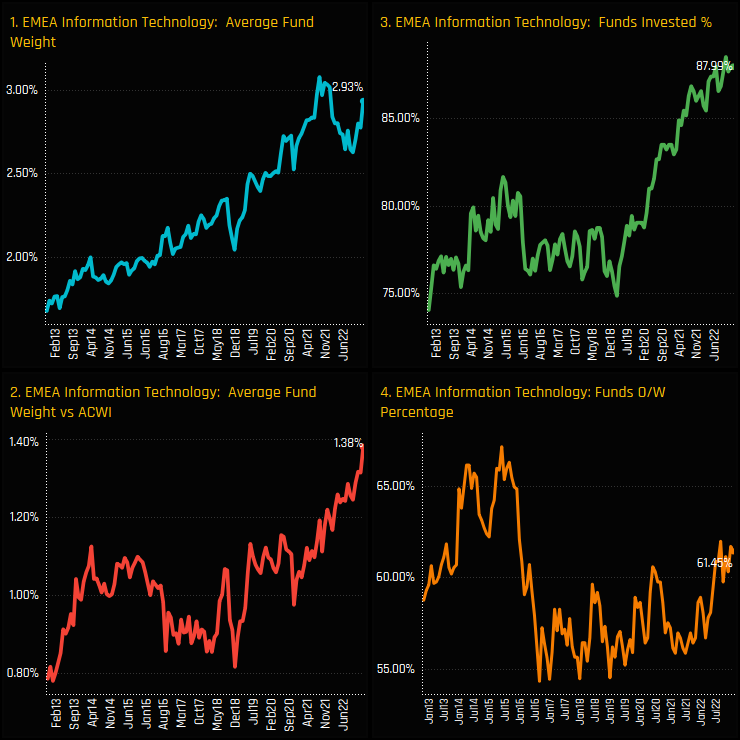
Global managers are positioned at their highest ever net overweight in the EMEA Technology sector. Ownership growth in the sector has been fairly consistent over the last 5-years, with the percentage of funds invested rising from 75% in late 2018 to 88% today. After stalling at a peak 3.1% in late August, average weights have resumed their upward trajectory, hitting 2.93% at the end of last month.
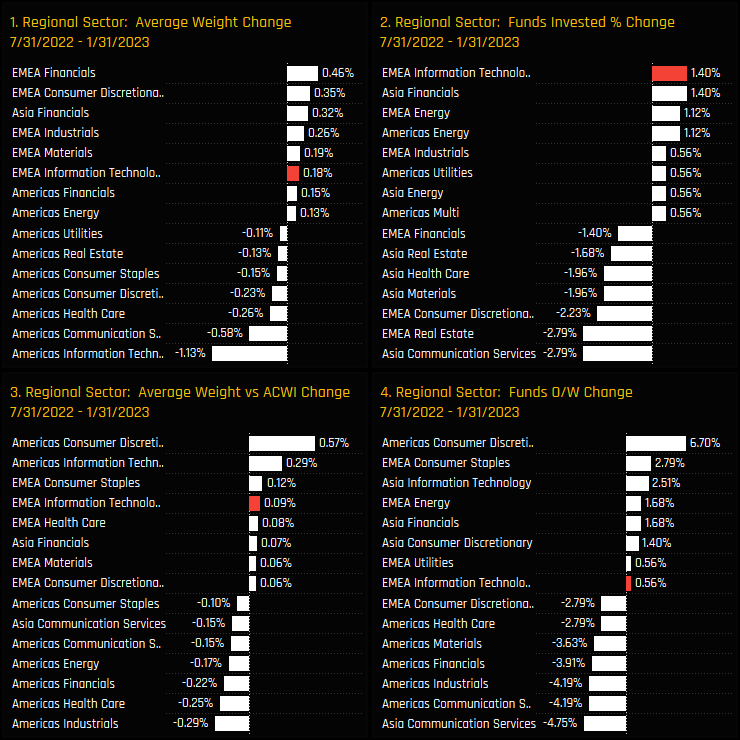
Regional sector activity from 07/31/2022 to 01/31/2023 highlights the positive rotation in to EMEA Technology stocks. All measures of ownership moved higher, with the +1.4% of managers opening new positions the highest among peers. EMEA Technology has been at the forefront of a broader diversification away from key sectors in the Americas region.
Regional Sector Sentiment
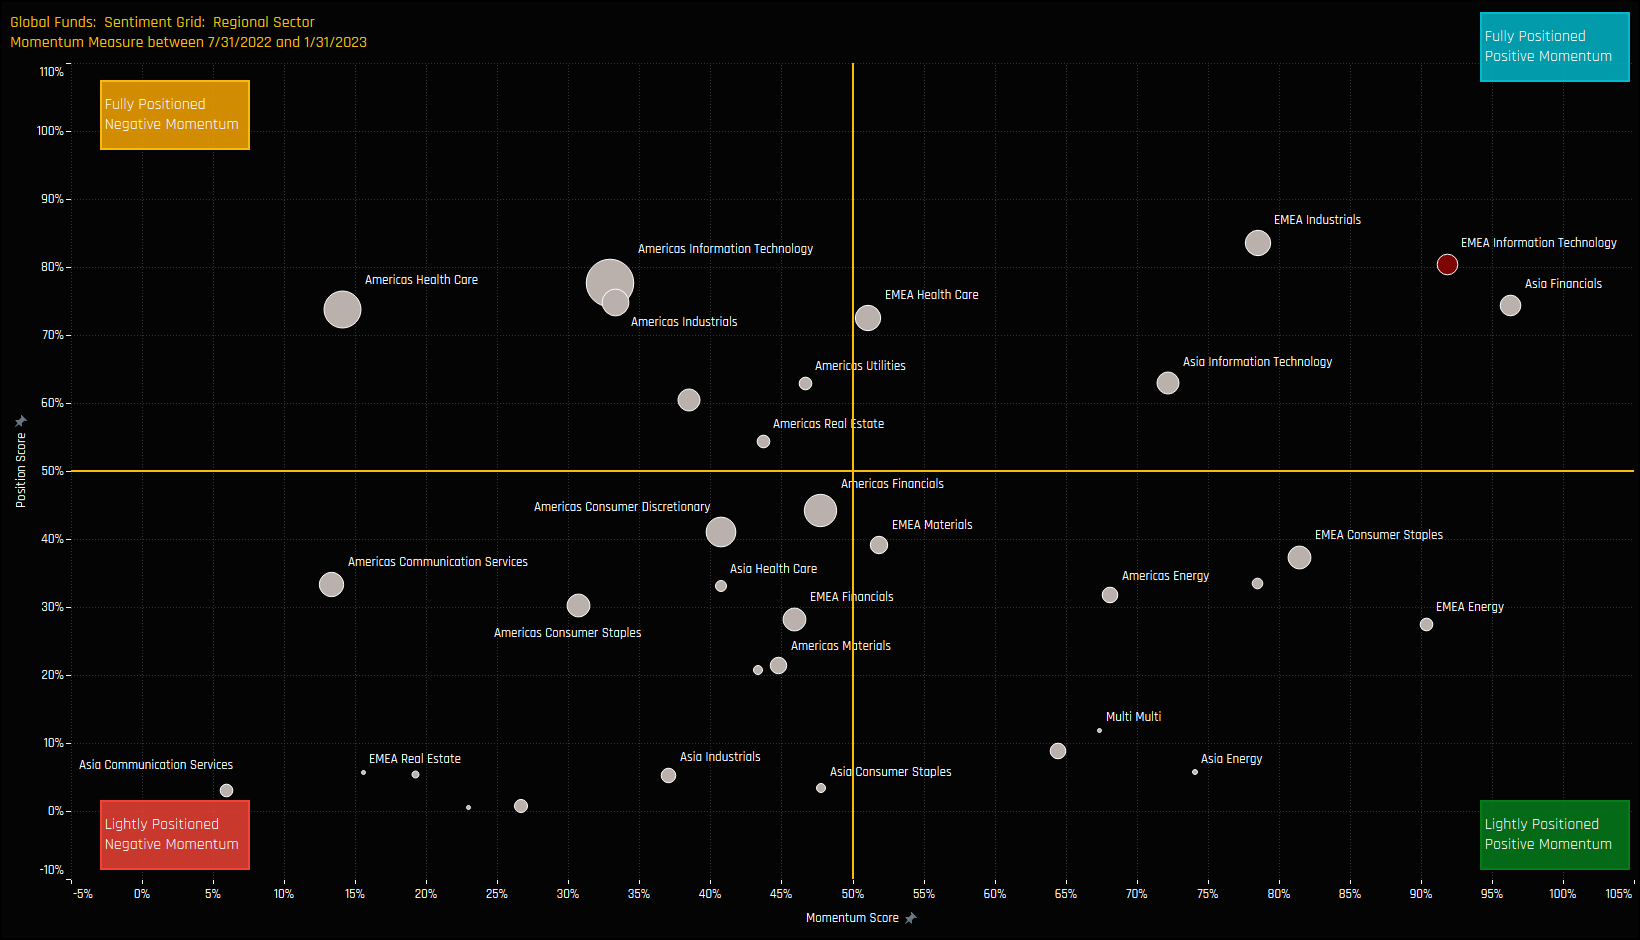
The sentiment grid below shows where current positioning in each Regional sector sits versus its own history going back to 2012 on a scale of 0-100% (y-axis), against a measure of fund activity for each Regional sector between 07/31/2022 and 01/31/2023 (x-axis).
EMEA Technology, alongside Asia Financials and EMEA Industrials sits in the top-right quadrant, being both well-positioned and benefiting from fund rotation. The Grid indicates a general sense of fatigue among sectors in the Americas, with Health Care looking vulnerable and Consumer Sector positioning approaching depressed levels.
Fund Positioning & Activity
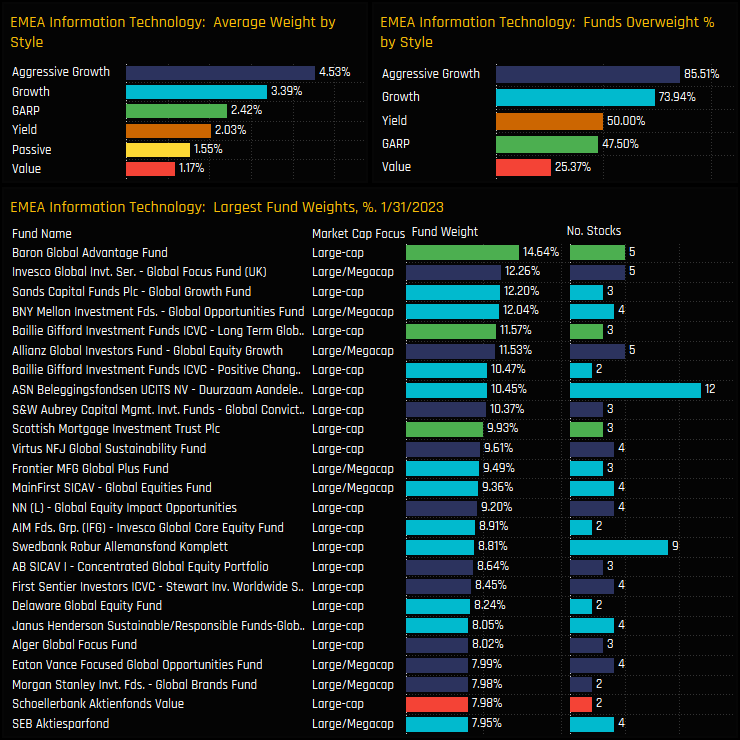
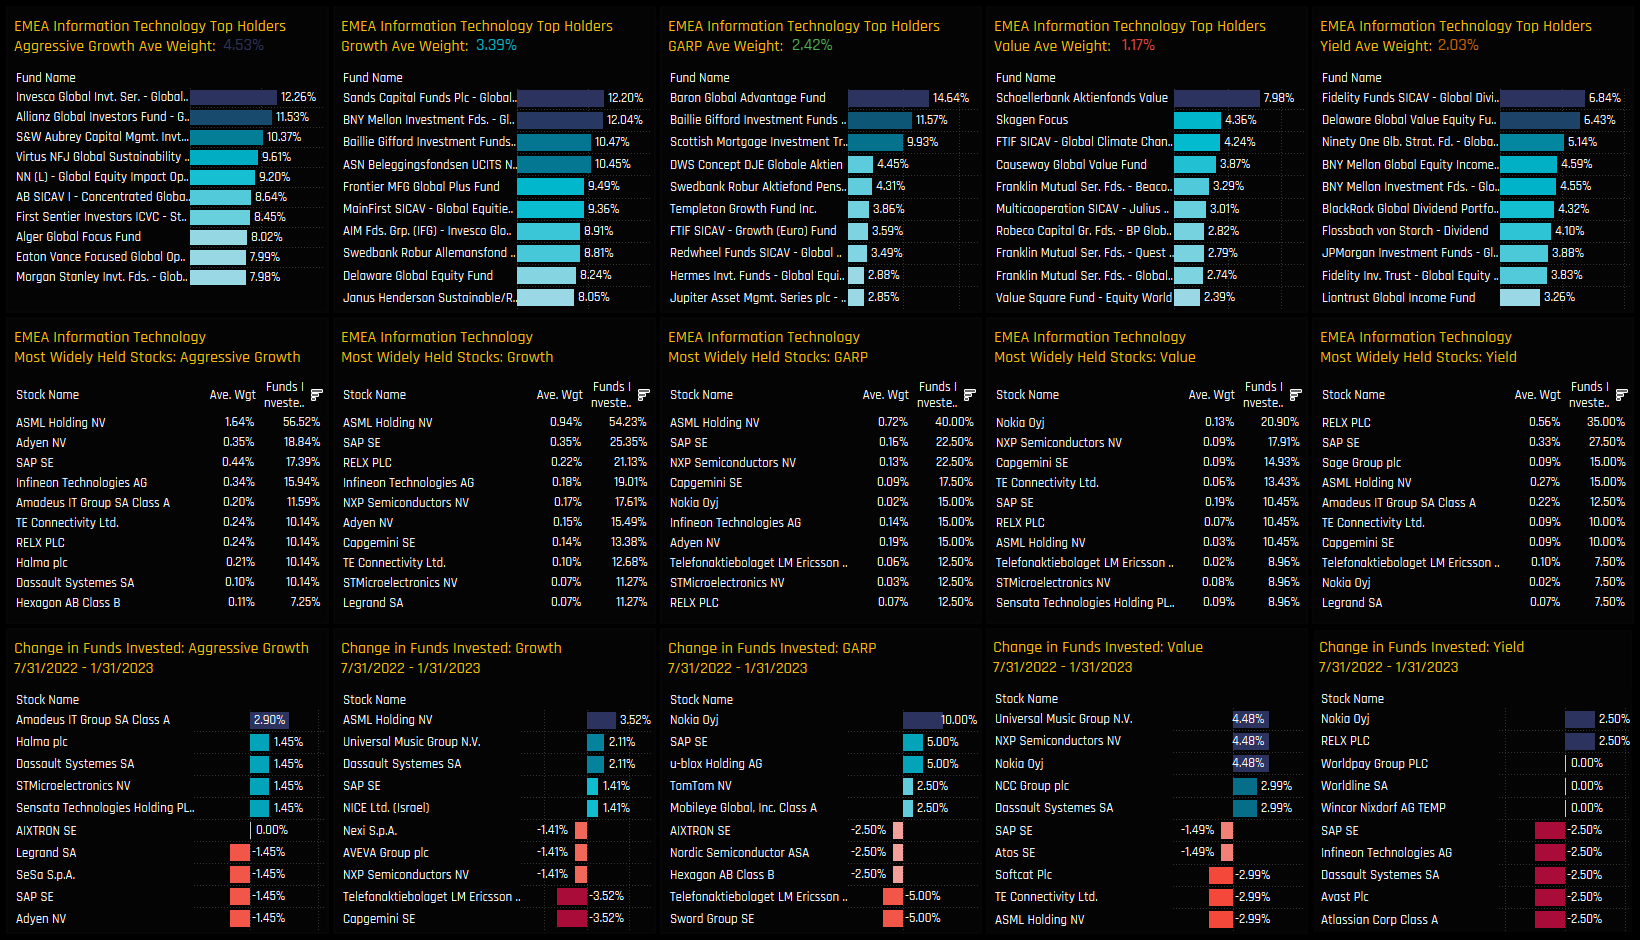
Fund allocations in the EMEA Technology sector are correlated to Style, with average weights among Aggressive Growth funds 4x those of Global Value managers. Indeed, 85.5% of Aggressive Growth funds and 74% of Growth funds are positioned overweight the EMEA Technology sector, occupying a combined 21 of the top 25 fund positions in the sector.
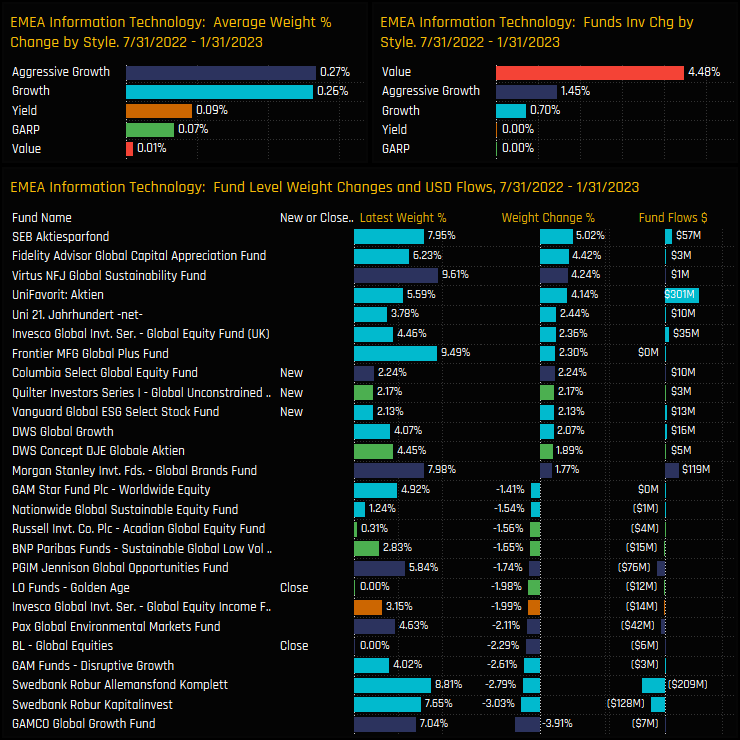
Whilst ownership among Aggressive Growth and Growth funds has moved higher over the past 6-months, perhaps the jump in Value fund ownership is the more interesting stat. An additional 4.5% of the Value funds in our analysis added EMEA Tech exposure over the period. The larger weight increases were from existing Growth funds led by SEB Aktiesparfond (5.02%) and Fidelity Global Capital Appreciation (+4.42%)
Stock Ownership by Style
The below chart dashboard breaks down stock and fund ownership by Style. The middle row of charts show the most widely held stocks per Style bucket, with ASML Holdings and SAP SE prominent holdings among Growth and GARP investors. Value funds are more lightly allocated and prefer Nokia Oyj and NXP Semiconductors.
Activity over the last 6-months highlights a growing investor base for Nokia Oyj among GARP, Value and Yield investors, whilst Aggressive Growth and Growth funds have increased investment in Amadeus IT Group, Dassault Systemes and ASML Holdings.
Conclusions & Data Report
The ownership picture for EMEA Technology stocks looks healthy. A beneficiary of recent manager rotation, investors are now positioned at record overweights and close to peak levels of outright exposure.
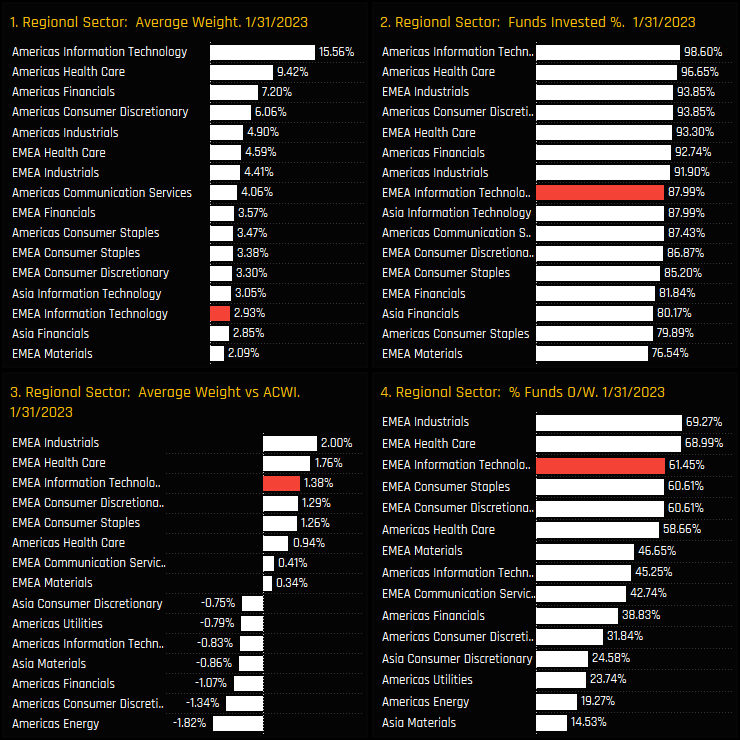
Compared to peers, EMEA Technology sits well down the pecking order of Regional Sector exposure. The chart to the right shows the latest ownership statistics for Regional Sectors, with EMEA Technology the 14th largest weight and the 8th most widely held. The largest allocations belong to the major sectors in the Americas region, led by Technology, Health Care and Financials. In fact, the top 5 Americas sectors account for 43.1% of the average active Global fund. If the current rotation out of America and in to EMEA continues, then EMEA Technology looks well positioned to capture further market share.
Please click on the link below for a data pack on EMEA Technology positioning among active Global equity funds.
For more analysis, data or information on active investor positioning in your market, please get in touch with me on steven.holden@copleyfundresearch.com


