USA: Record Underweight as Shift to Europe Accelerates
European Overweight Hits Record High
354 Global Equity Funds, AUM $952bn
Q1 Performance & Attribution
The latest stats on performance and the drivers of performance for Q1 2023.
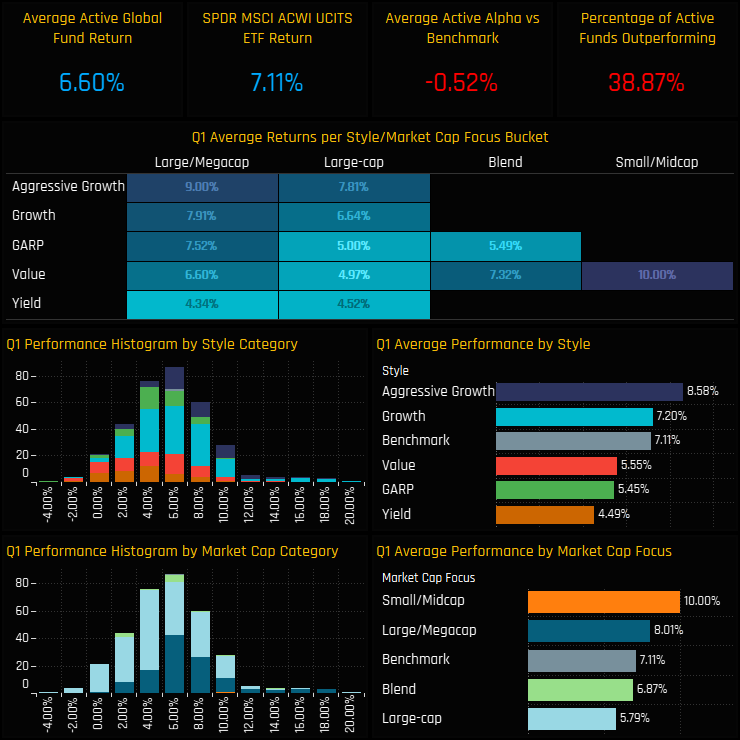
Q1 Performance Summary
Active Global managers have had a mixed start to the year. Average fund returns were strong at +6.6%, yet this lagged behind the SPDRs MSCI ACWI ETF by -0.52%, with 38.9% of the funds in our analysis outperforming. Returns were correlated to Style, with Aggressive Growth funds generating 8.6% on average versus Value on 5.6%.
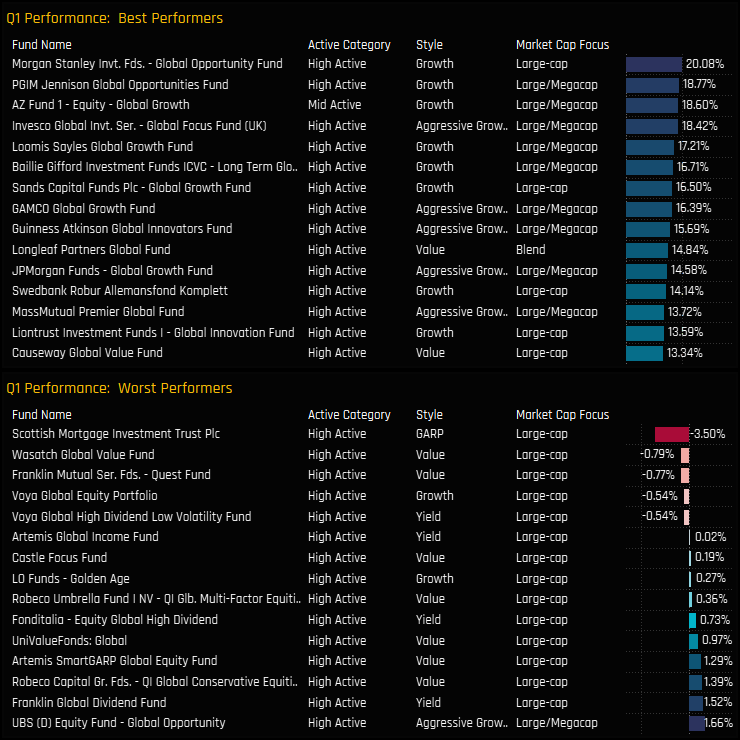
The range of returns was mainly contained between 2% and 10% on the quarter, but there were a small number of funds who fell either side of that range. Morgan Stanley’s Global Opportunity Fund topped the list with 20.1% return, whilst the Scottish Mortgage Investment Trust was one of 5 funds who posted negative returns on the quarter.
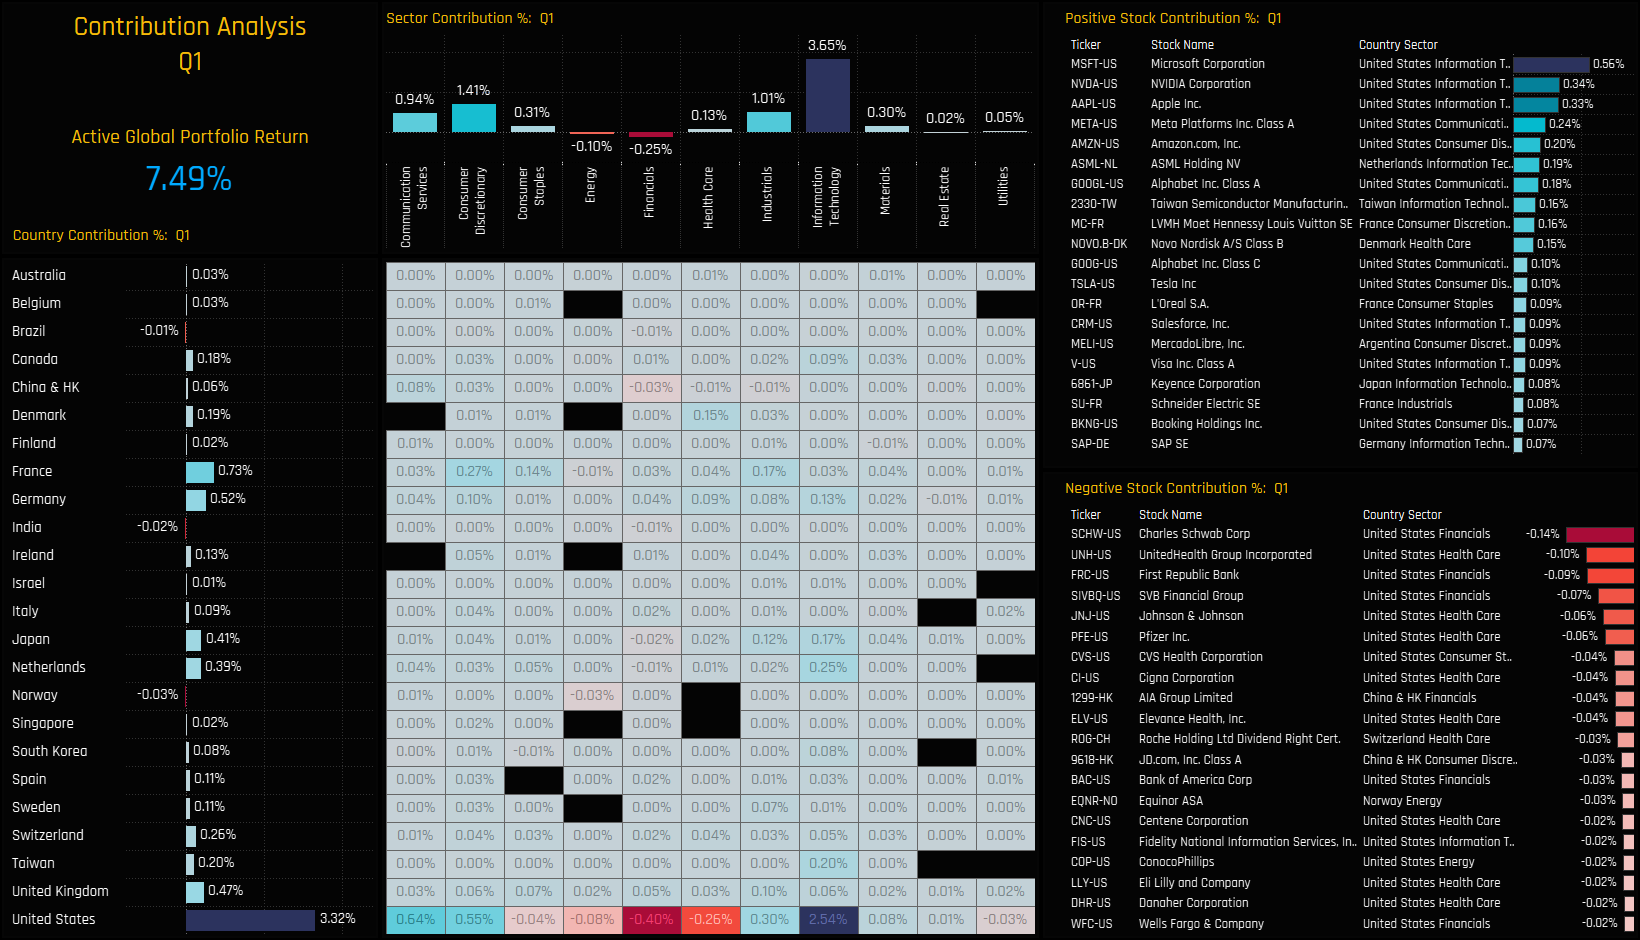
Portfolio Contribution
The drivers of returns on the quarter can be seen in the chart set below, which breaks down the performance of a portfolio based on the average holdings of the 354 active Global funds in our analysis. This theoretical portfolio returned 7.5% in Q1, driven by USA exposure (+3.3%), France (+0.73%) and Germany (+0.52%). On a sector level, Information Technology contributed +3.65% to total returns, followed by Consumer Discretionary (+1.41%) and Industrials (+1.01%).
Drilling down a level further, costly country/sectors were US Financials (-0.4%) and US Health Care (-0.26%), but these losses were overshadowed by strong gains in US Tech, US Comm’ Services and US Consumer Discretionary. The key stocks driving performance can be seen in the right hand charts below, led by Microsoft (+0.56%), NVIDIA Corp (+0.34%) and Apple Inc (+0.33%) on the positive side, and Charles Schwab Corp (-0.14%), UnitedHealth Group (-0.1%) and First Republic Bank (-0.09%) on the negative.
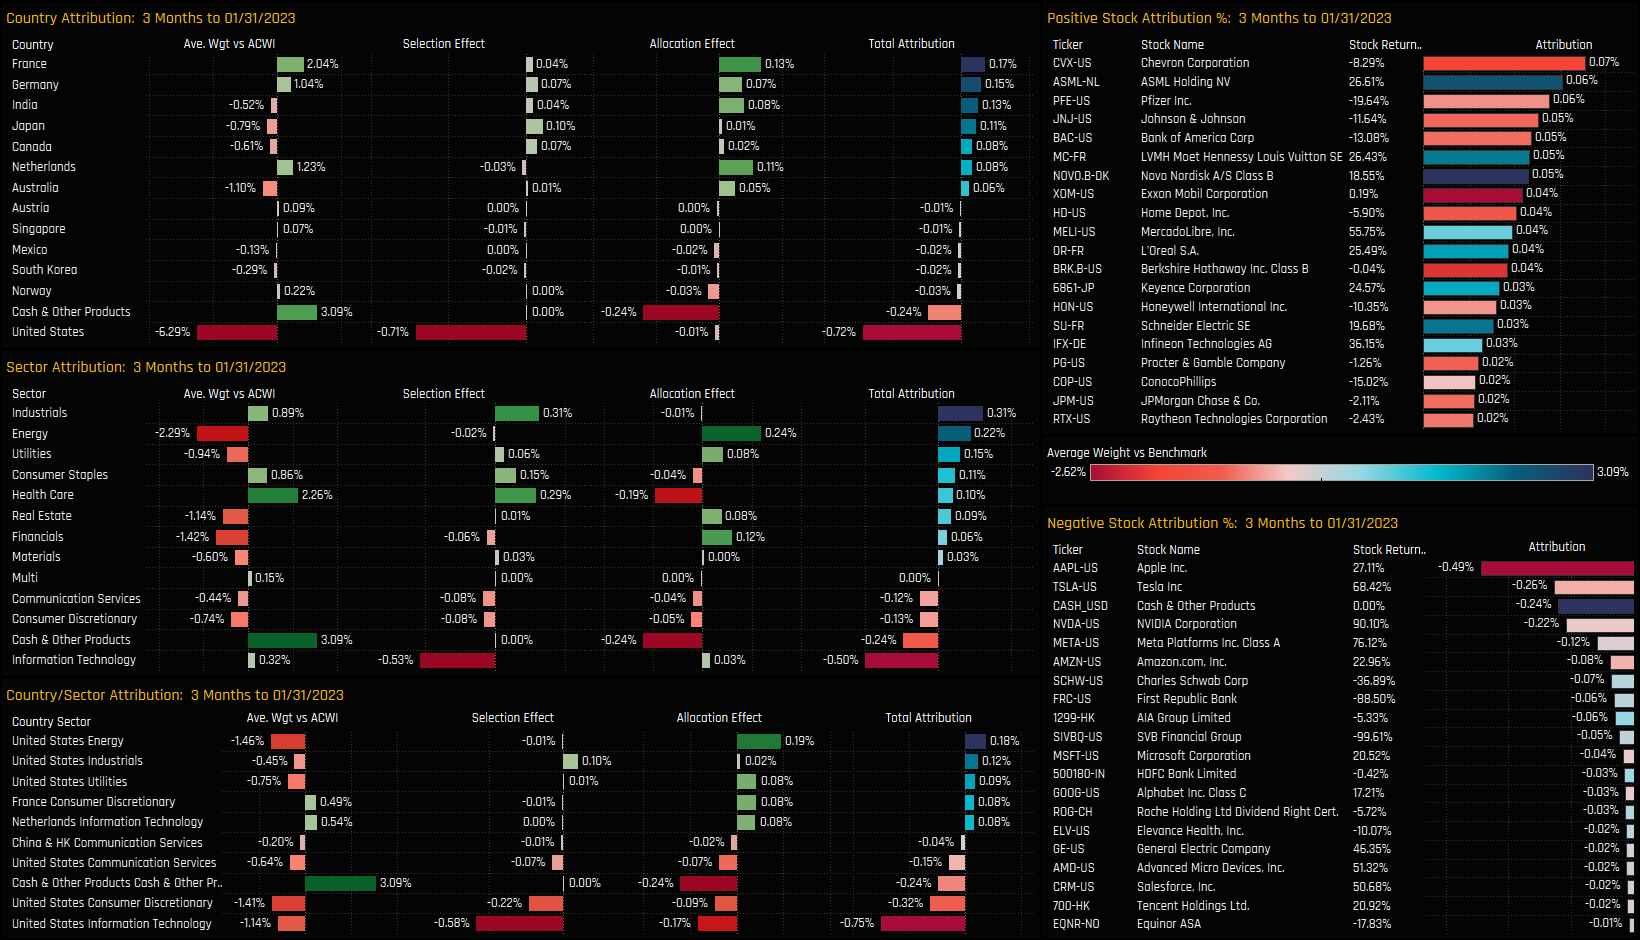
Portfolio Attribution
We perform attribution analysis on this portfolio versus a representation of the benchmark based on the SPDRs MSCI ACWI ETF. A summary of the key drivers of out/underperformance are documented below.
What worked:
Underweights in Energy, Financials, USA Utilities, India.
Overweights in France, Germany, Netherlands
Stock selection in Industrials, Japan, Health Care.
Underweights in Chevron Corp, Pfizer Inc, J&J
Overweights in ASML Holdings, LVMH, Novo Nordisk
What Didn’t:
Underweights in US Tech, US Consumer Discretionary
Overweights in Cash, Health Care.
Stock selection in the USA, Information Technology, Financials
Underweights in Apple Inc, Tesla Inc, NVIDIA
Overweights in Charles Schwab, First Republic, AIA Group
354 Global Equity Funds, AUM $952bn
USA: Record Underweight as Shift to Europe Accelerates
Global Managers move to their highest ever underweight in US Equities
Time-Series & Country Positioning
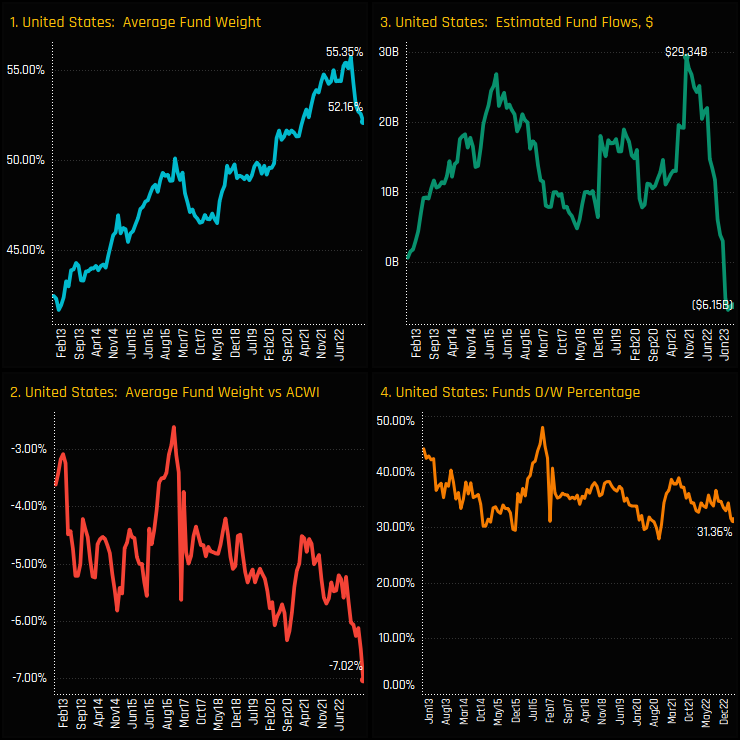
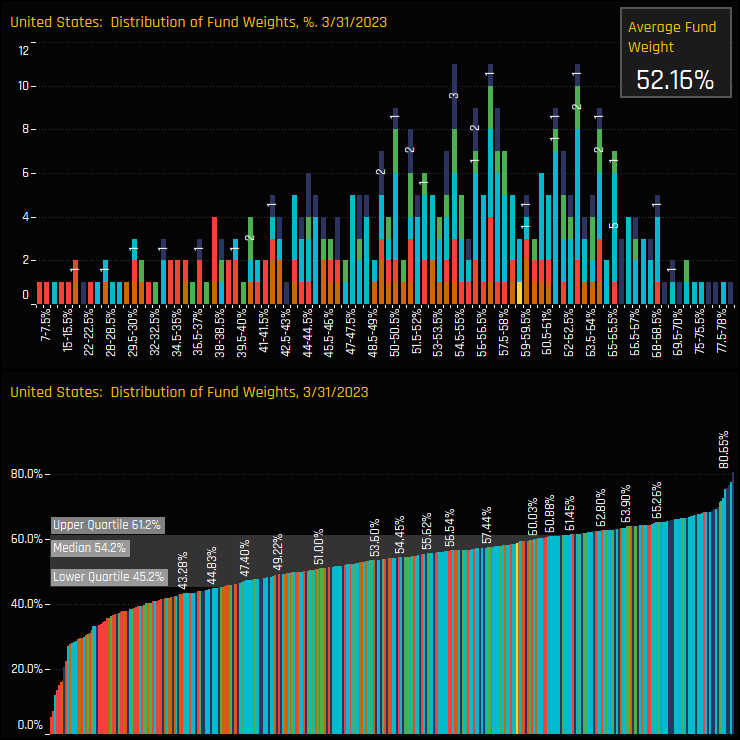
Global equity funds are becoming increasingly cautious on US stocks. Average weights have fallen from a high of 55.35% in October 2022 to 52.16% at the end of March (ch1), driven in part by sustained and sizeable fund outflows totaling an estimated $35.5bn since late 2021 (ch3). This has had the effect of pushing the long-running USA underweight to record levels of -7.02% below the SPDRs MSCI All Country World index ETF (ch3), with just 31.4% of funds positioned overweight (ch4).
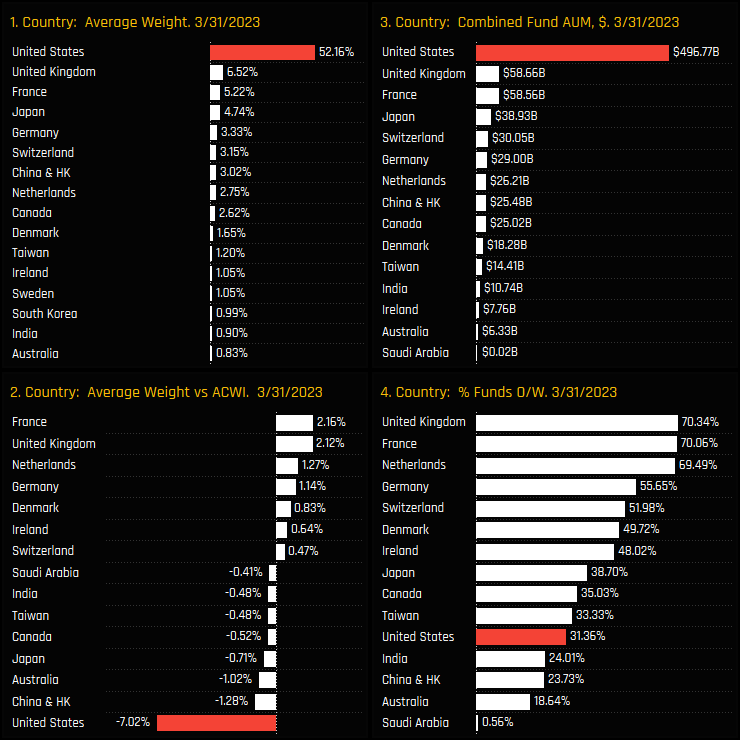
The United States is still the largest country weight by quite a margin, with the next largest 8 country weights accounting for 31.4% of the average Global fund, led by the UK and France. The relative measures in the bottom 2 charts show the USA underweight financing overweights in France, the United Kingdom and a host of European nations. China & HK, Australia and Japan join the United States as the other key country underweights, but to a lesser degree.
US/Europe Rotation
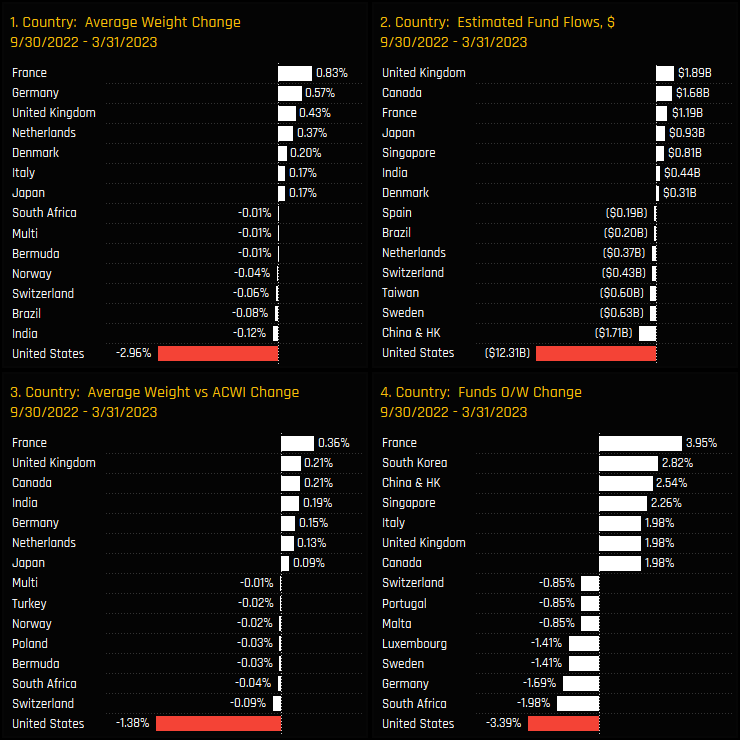
Fund activity over the last 6-months highlights the heavy rotation out of the USA and in to the major European nations. Between the filing dates of 09/30/2022 and 03/31/2022, average US fund weights fell by -2.96% (ch1) following -$12.3bn of net fund outflows (ch2). Relative to benchmark, underweights increased by -1.38% (ch3) as a further -3.4% of Global managers switched to underweight (ch4). This was an active rotation.
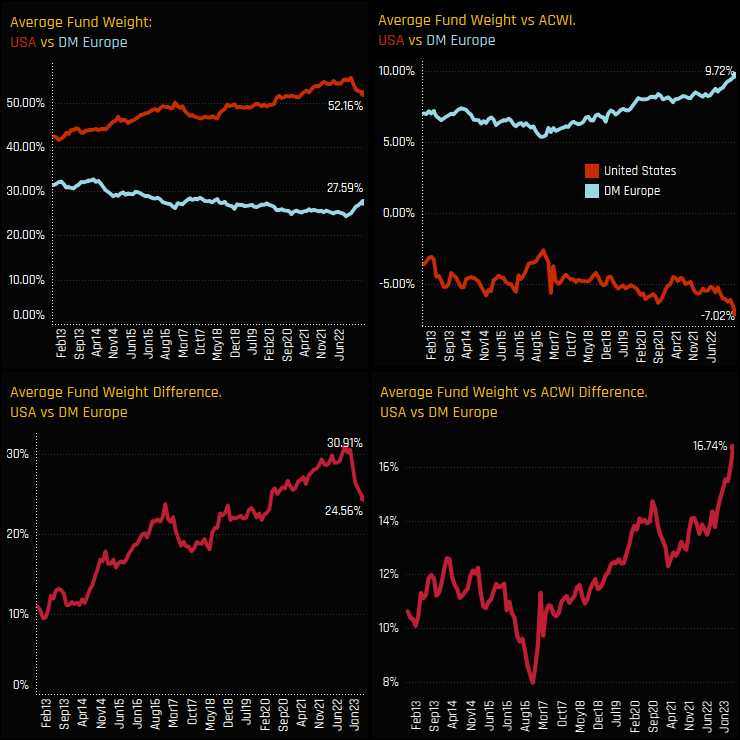
The longer term trends in positioning between the USA and Developed Europe are shown below. The left hand charts show the dispersion between US and Developed Market Europe fund weights over the last decade, with the long-term dominance of the USA starting to reverse in late 2022. The right hand charts the net over/underweight vs the SPDRs MSCI ACWI ETF, with Global funds increasing overweights in DM Europe and increasing underweights in the US, with today’s spread of +16.74% the highest on record.
Fund Positioning
The histogram of fund weights in the United States is shown in the top chart below. The bulk of fund allocations sit between 50% and 65%, with an extended tail to left hand side. The bottom chart shows the distribution, with 50% of managers allocating between the lower and upper quartiles of 45.2% and 61.2%.
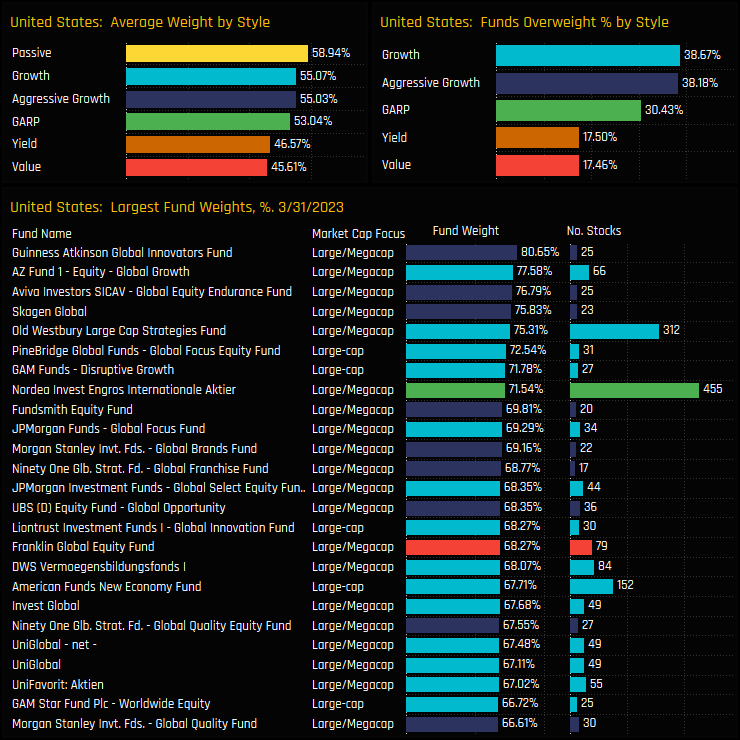
Allocations are correlated to Style, with Aggressive Growth and Growth managers more bullishly positioned than their Value peers. On a fund level, Guinness Atkinson Global Innovators tops the list on 80.6%, with most of the top holders owning in excess of 20 stocks in the United States.
Fund Activity & Style Trends
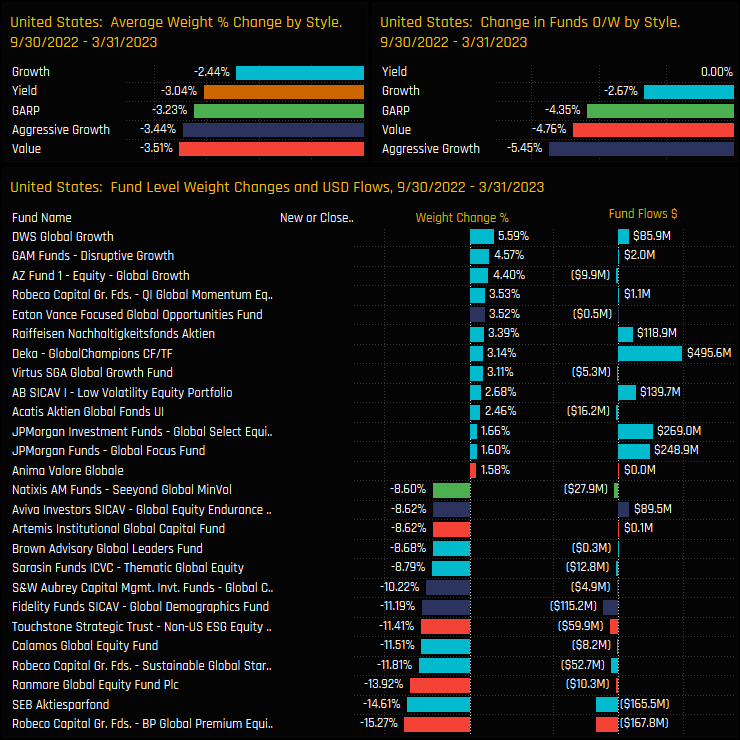
Over the last 6-months, all Style groups saw average USA weights decrease, led by Value and Aggressive Growth managers. In fact, a further -5.45% of the Aggressive Growth Funds and -4.76% of Value funds switched from overweight to underweight over the period. Individual fund level changes were heavily skewed to the sell side, led by Robeco BP Global Premium Equities (-15.3%) and SEB Akteisparfond (-14.6%).
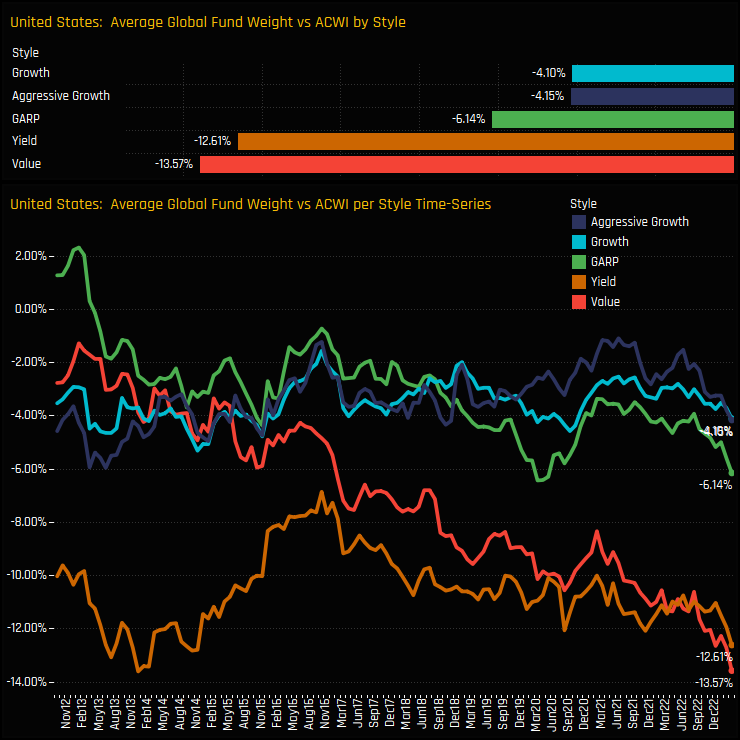
All Style groups are now positioned underweight the benchmark, with those underweights accelerating over the last 12-24 months. The longer-term downward move in relative positioning among Value managers is the standout trend, with today’s underweight of -13.6% below benchmark the lowest on record. The USA is becoming increasingly unattractive for those with a Value approach.
Sector Positioning & Activity
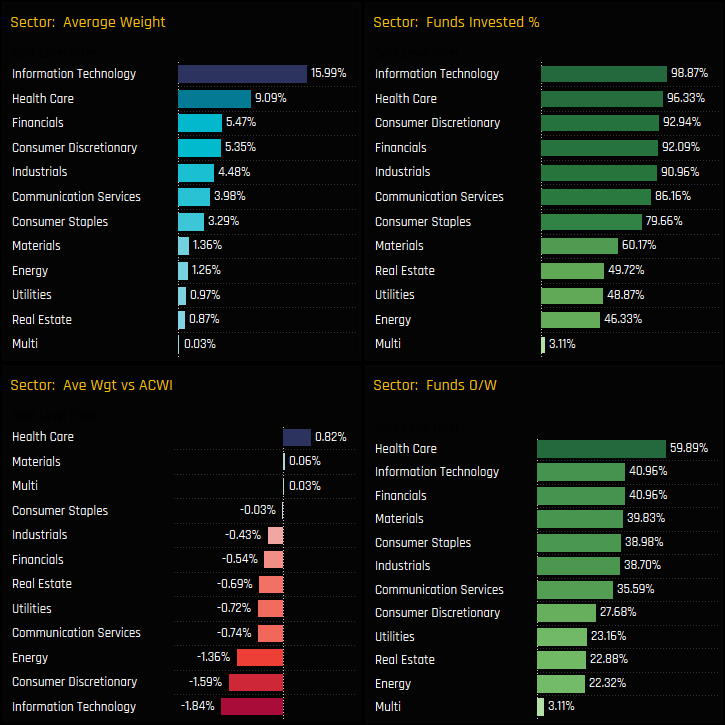
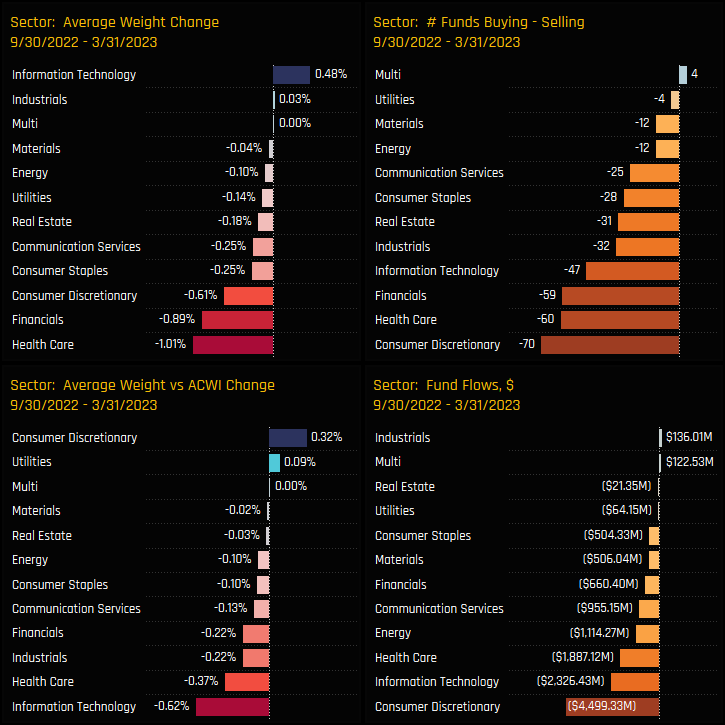
The breakdown of sector ownership in the USA is shown in the 4 charts below. Of the 52.16% total weight in the US, 15.99% is taken up by US Technology and 9.09% by US Health Care. All sectors with the exception of US Health Care are held underweight by active Global investors, with US Tech, US Consumer Discretionary and US Energy the dominant sector underweights.
The sectors driving allocations lower over the last 6-months were led by Consumer Discretionary, with a combined -$4.5bn of fund outflows and a net 70 funds in our analysis selling down positions. Health Care saw average weights fall by -1.01%, overweights decrease by -0.37%, fund outflows of -$1.9bn and a net -60 funds selling.
Stock Activity & Latest Positioning
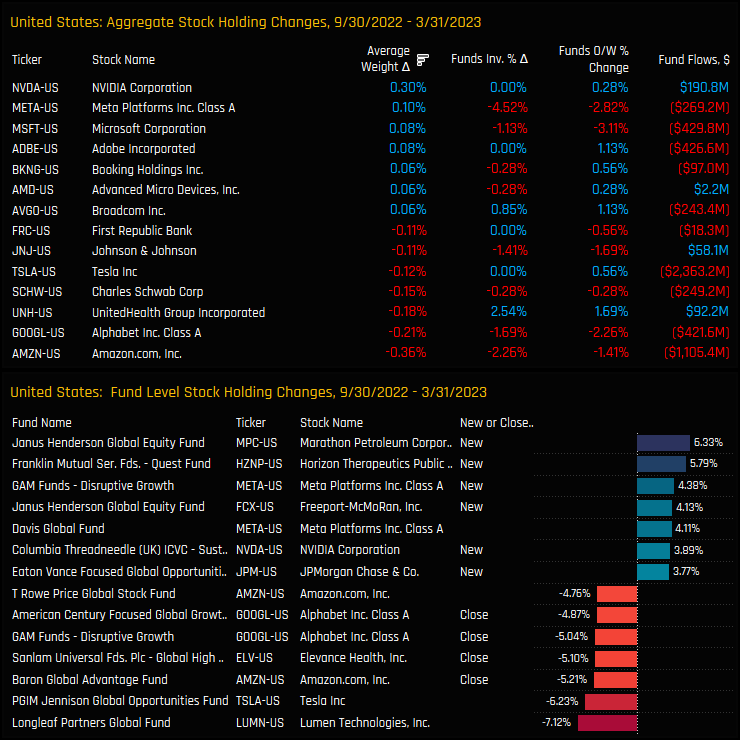
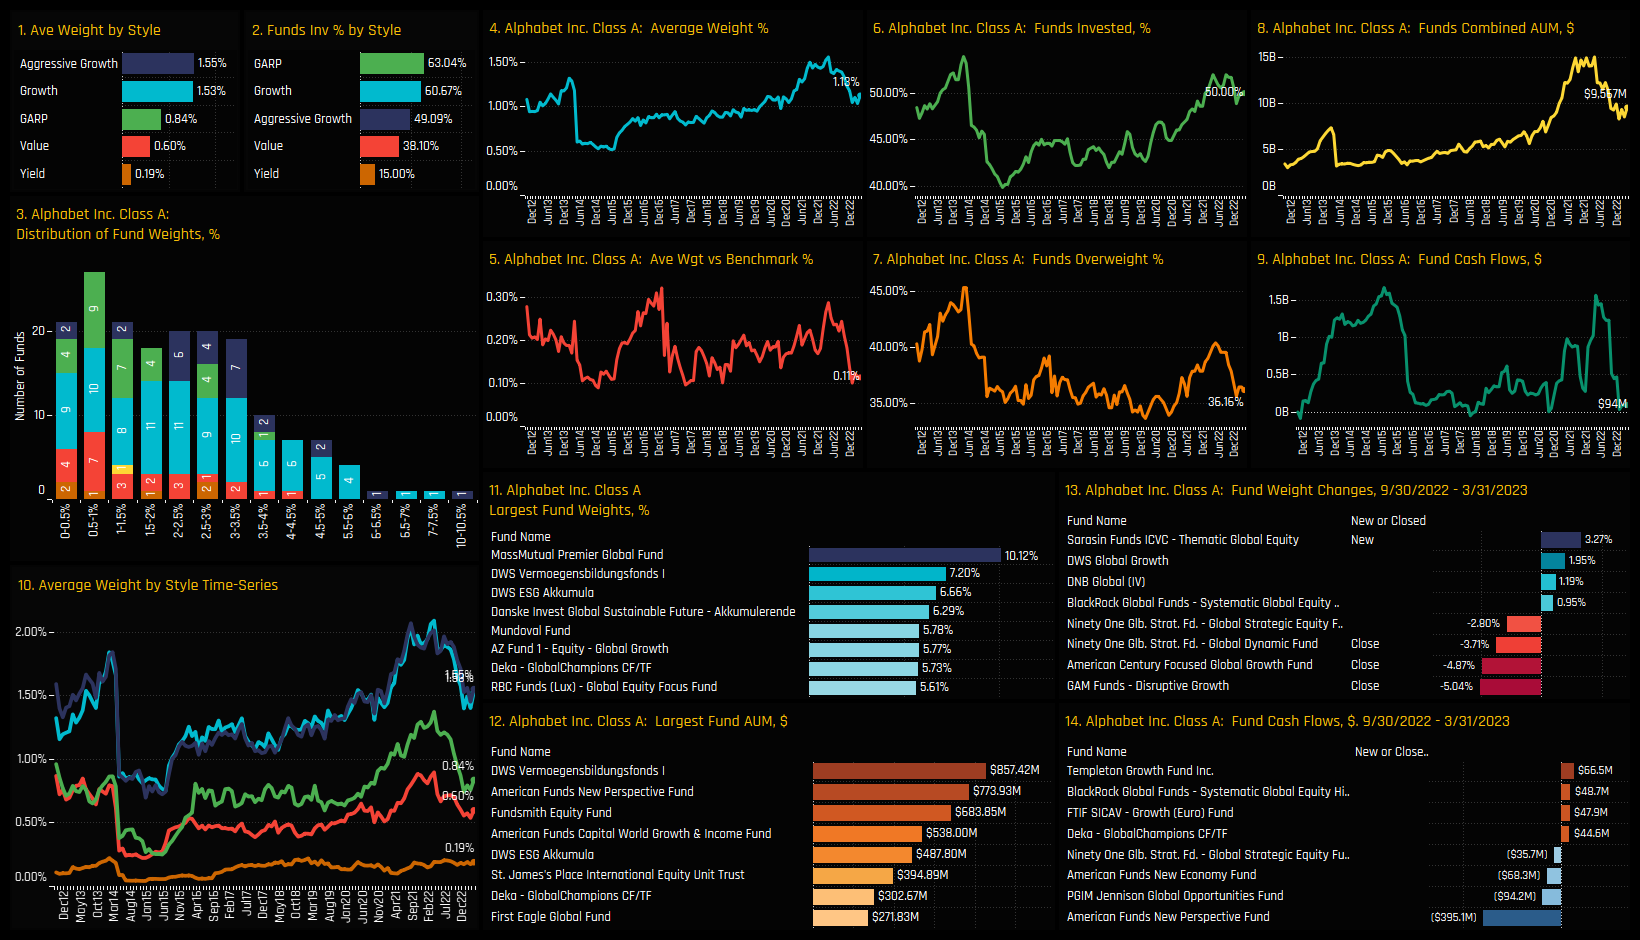
The companies driving US allocations lower were led by Amazon and Alphabet Class A. Both suffered from falling ownership among Global investors after sizeable net fund outflows. Despite an increase in average weight of +0.1%, Meta Platforms saw a net -4.5% of funds close positions, whilst Tesla Inc saw -$2.4bn of net outflows. NVIDIA Corp is one of the few genuine positives, with rising weights and positive fund flows. On a fund level, notable sales were from Longleaf Partners in Lumen Technologies and PGIM Jennison in Tesla Inc.
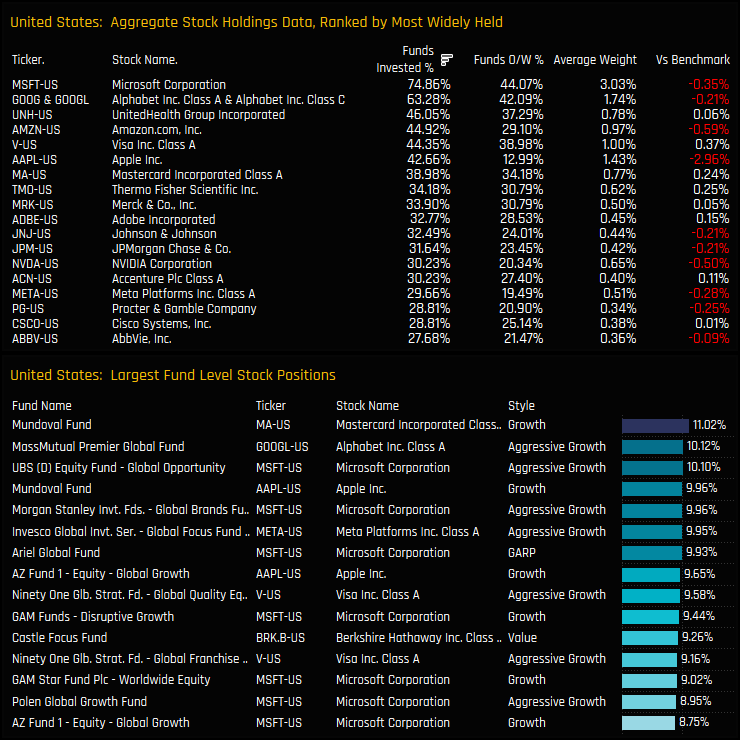
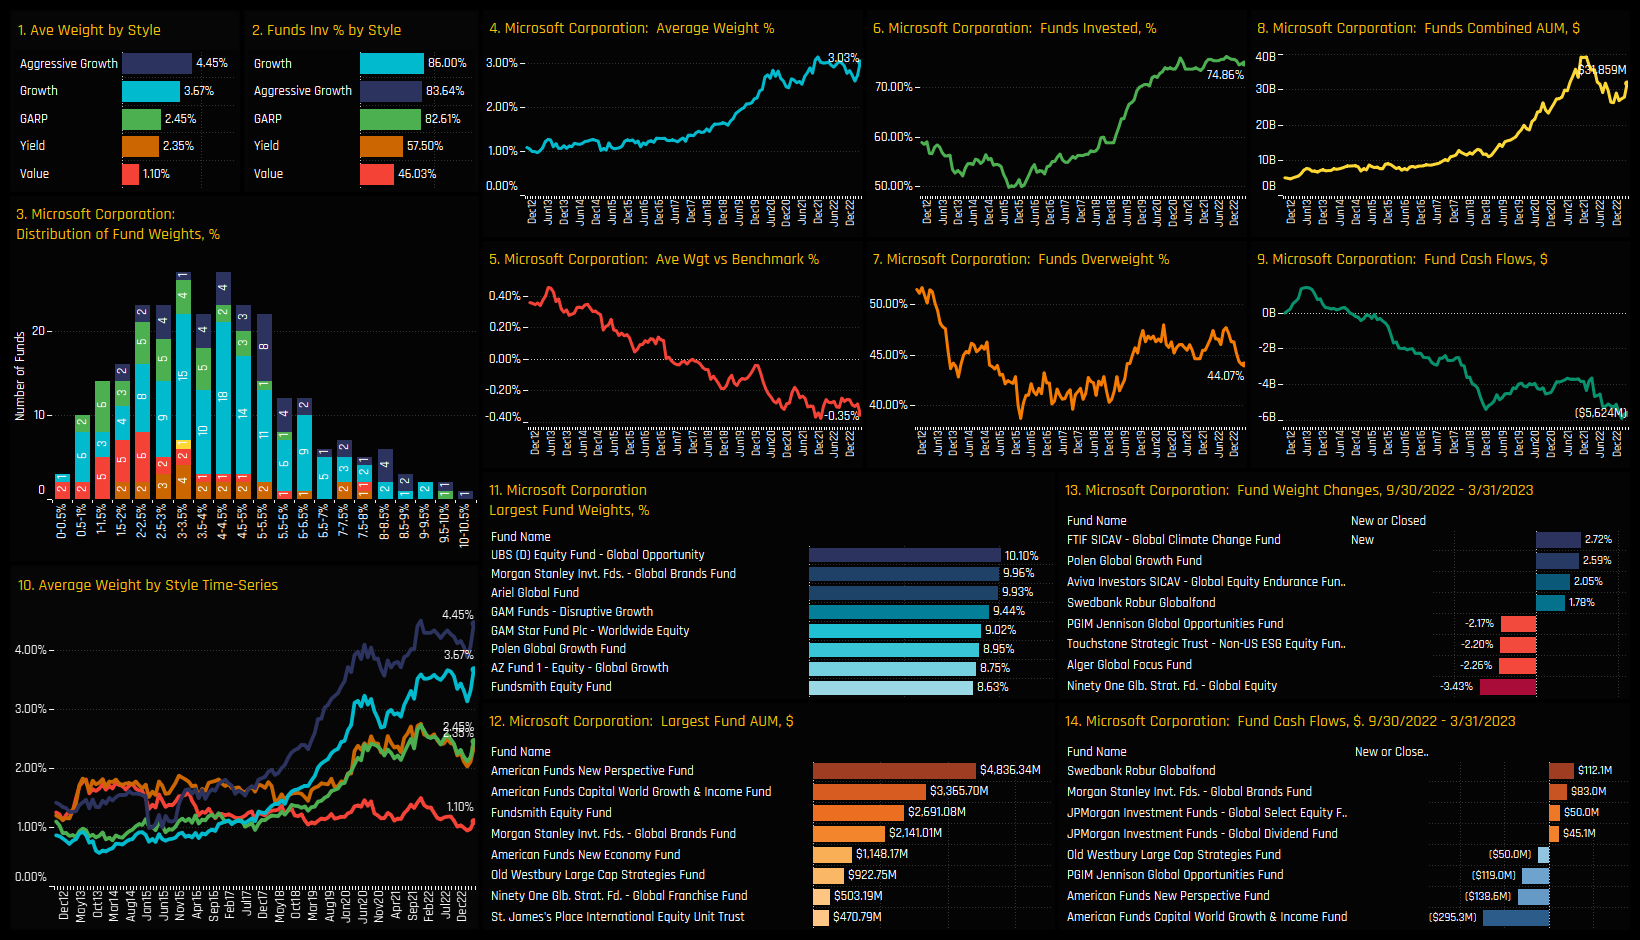
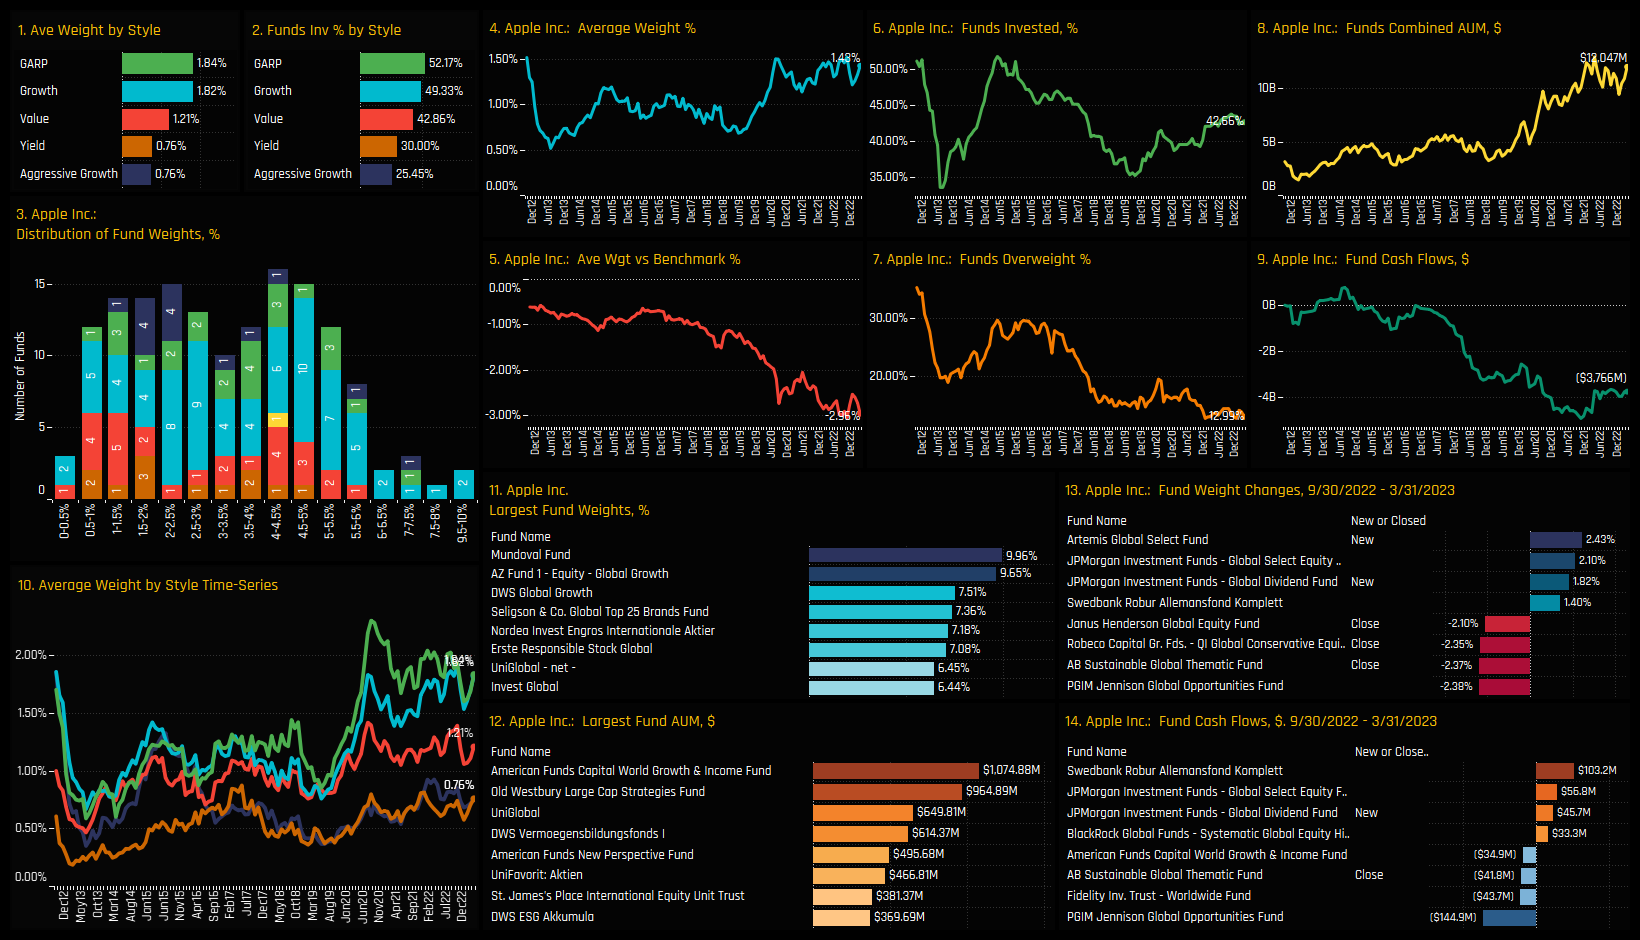
The most widely held stocks in the USA are Microsoft Corp and Alphabet Inc, owned by 74.9% and 63.3% of funds respectively. Microsoft is also dominant among the list of large individual fund positions in the bottom chart. Apple stands out as an under-owned stock compared to benchmark, with just 42.7% of funds holding a position at an average weight of 1.43%, or underweight the benchmark by -2.96%. For extended data on stock positioning, check out the data report at the end of this analysis.
Conclusions & Data Report
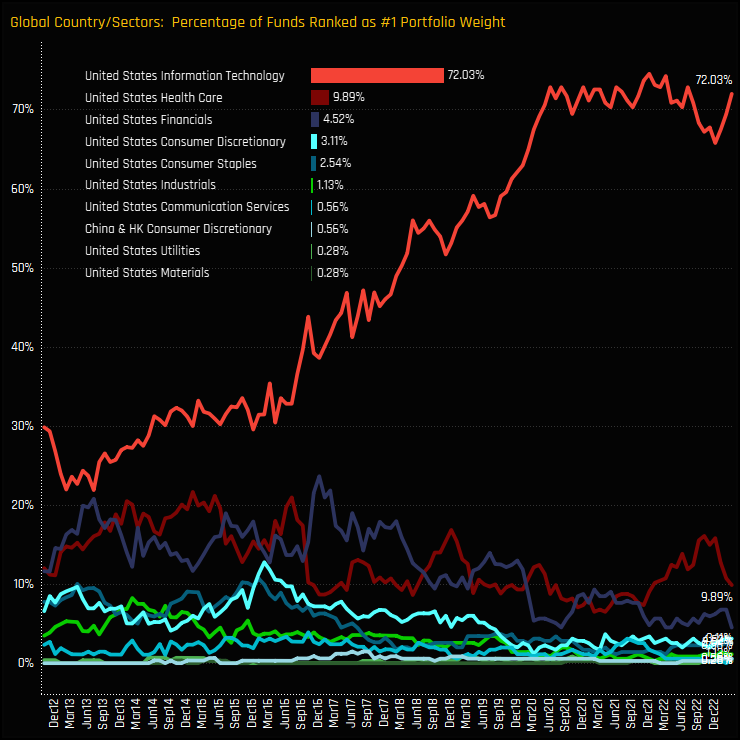
The existence of tracking error restrictions means that position sizing tends to be based on the market cap of a company, so the USA is still the largest country level exposure by quite a margin. We can see that in the chart opposite, which shows the percentage of funds who hold a specific country/sector exposure as their largest holding. Of the 354 Global funds in our analysis, 72% hold US Technology as their largest country/sector weight, the same as in the benchmark MSCI All Country World Index.
But within the boundaries of these constraints, Global managers are positioning themselves for European outperformance and US underperformance. The record spread between the underweight position in the US and the overweight position in DM Europe underscores the high conviction in this view.
Please click on the links below for a data pack on US positioning among active Global equity funds. Scroll below for individual profiles on Microsoft, Alphabet and Apple Inc.
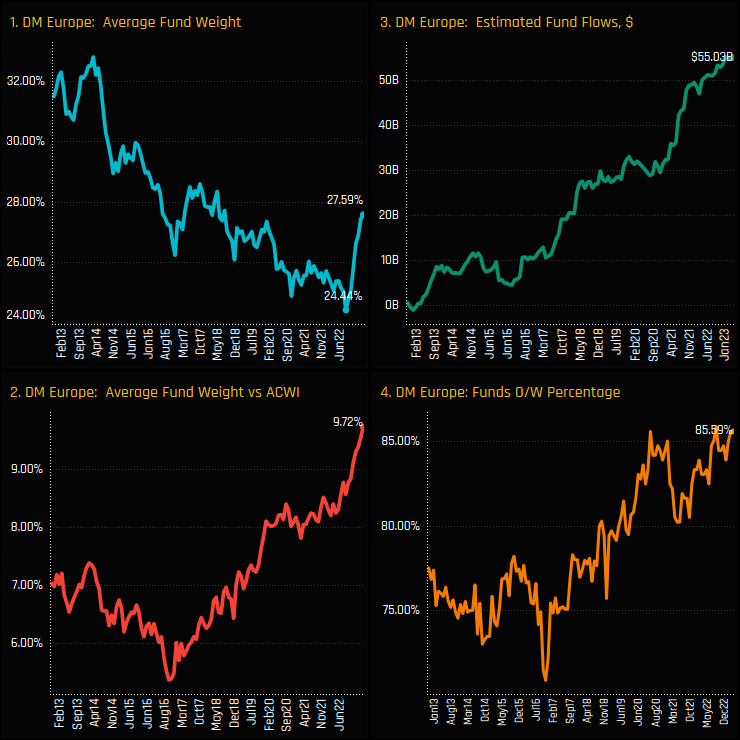
Overweight positioning in Developed Market Europe hits record levels following a rotation out of North America.
Time-Series and Regional Activity
European countries have been a key beneficiary of the rotation away from the USA in recent months. Average holding weights in DM Europe bottomed out in August last year at 24.44%, but have since made an aggressive move higher to 27.6% at the end of last month. Active Global managers have been increasing overweights to DM Europe over a much longer period, with today’s record of +9.72% overweight the culmination of an 8-year upward trend (ch2). Consistent fund inflows over the same period has helped propel 85.6% of the Global funds in our analysis to an overweight stance in the Developed European region. This is as consensus a position as it gets.
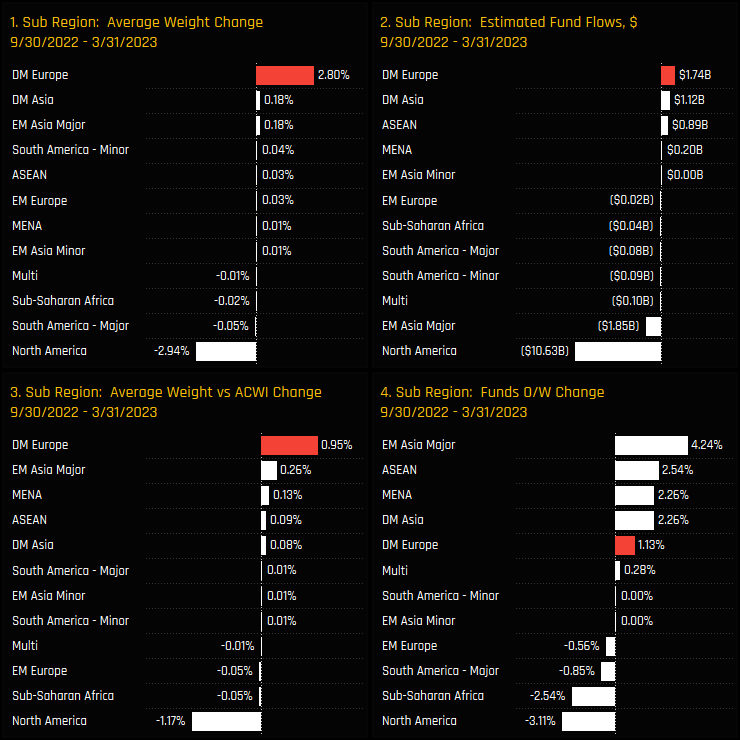
A snapshot of Regional fund activity over the last 6-months can be seen in the charts below. It shows a big rotation out of North America and in to DM Europe, with average weight increases of +2.8% in DM Europe almost offsetting the -2.94% decrease in North American weights. This helped drive Global funds further underweight North America and further overweight DM Europe. On a fund flow basis, Global funds sold an estimated $10.6bn in North American stocks, whilst buying +1.74bn in stocks in the DM European region.
Fund Activity & Latest Holdings
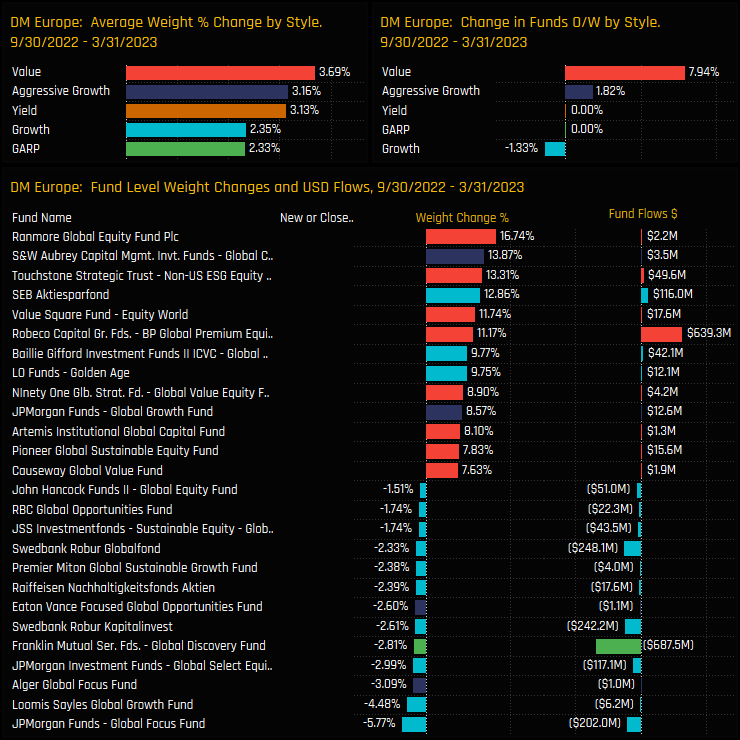
Drilling down to a fund level reveals the key drivers behind this active rotation. Value funds were at the heart of the move, with Ranmore Global Equity increasing DM European weights by +16.74% over the last 6-months. A further +7.94% of the Value managers in our analysis switched to overweight with average weights rising by +3.69%. Note also the increase in exposure among Aggressive Growth funds, led by S&W Aubrey and JP Morgan Global Growth.
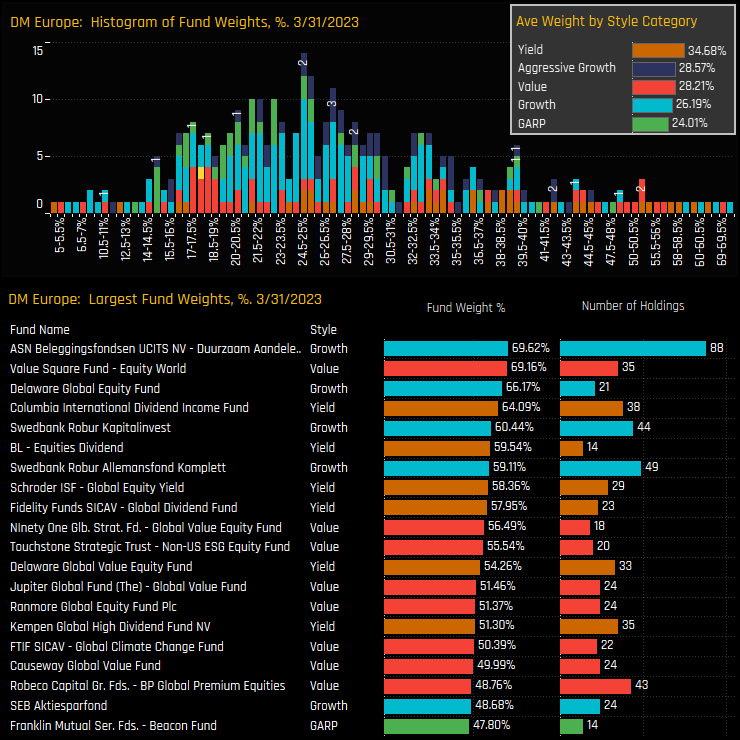
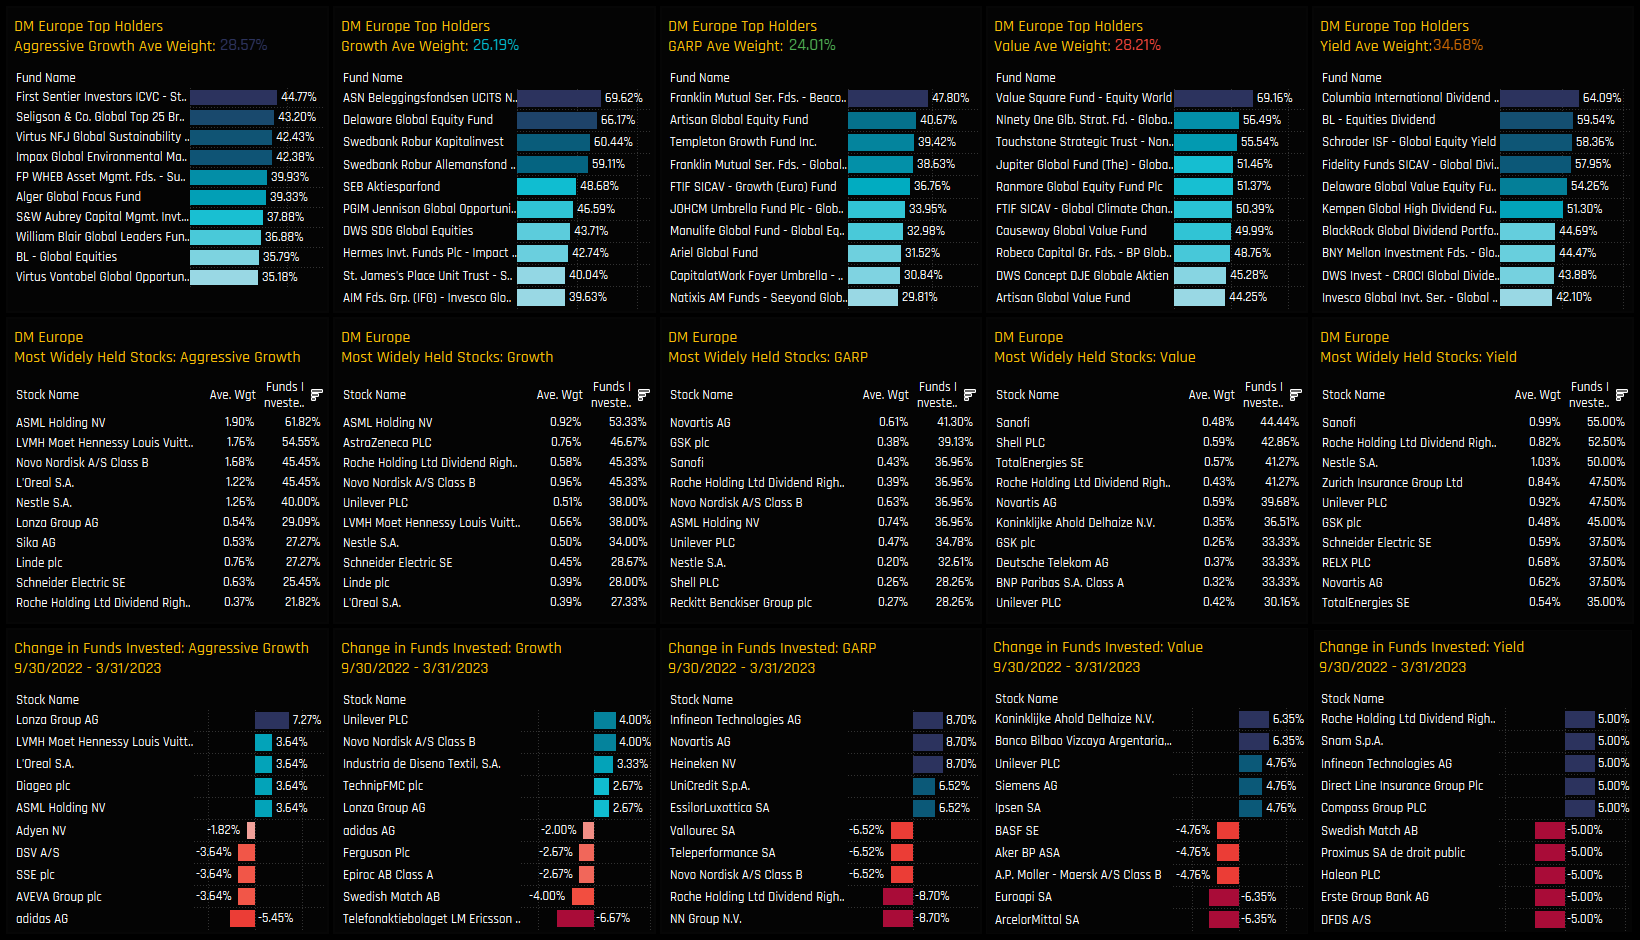
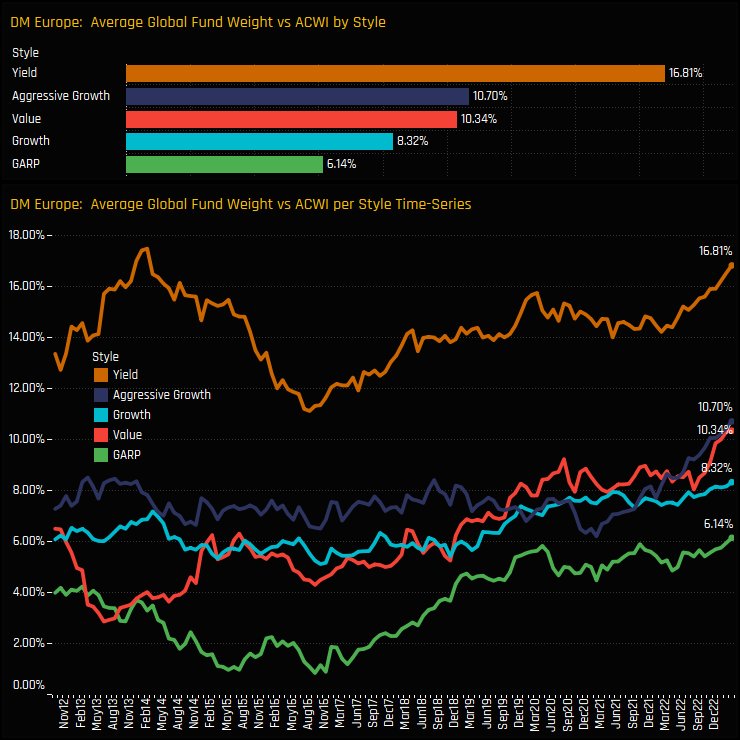
The histogram of fund weights shows a distribution much lower than that of the USA, with the bulk of portfolio weights between 15% and 30%, albeit with an extended tail to the upside. Yield managers are the most heavily allocated, with average weights of 34.7% versus 24% for GARP, whilst Aggressive Growth and Value funds are similarly exposed. Top holders are well above the 60% level, led by ASN Sustainable Equity (69.6%) and Value Square Equity World (69.2%).
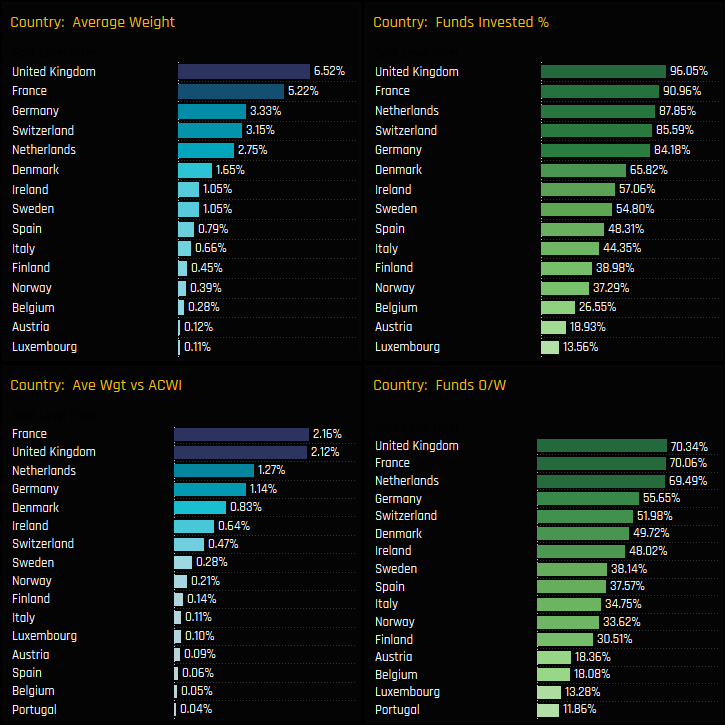
Country Exposure
The breakdown of Country ownership in the DM European region is shown in the 4 charts below. On an absolute basis, the UK and France are the dominant exposures, being the most widely held and largest portfolio weights on average. Versus the benchmark, every country in DM Europe is held as an overweight compared to the SPDR’s MSCI ACWI ETF weight. Again, the UK and France are the highest conviction holdings, each held overweight by over 70% of the funds in our analysis.
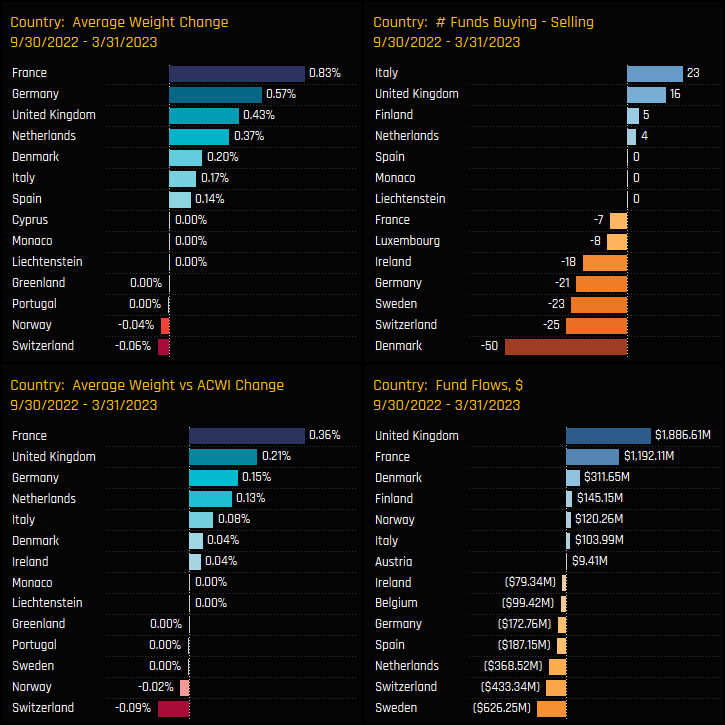
Country level ownership changes over the last 6-months highlight France and the UK as key beneficiaries of the fund rotation. Both countries captured positive net fund inflows over the period, saw average weights move higher and overweights increase. Though activity was positive on balance, Switzerland, Sweden and Denmark were negative on a number of measures.
Stock Activity & Holdings
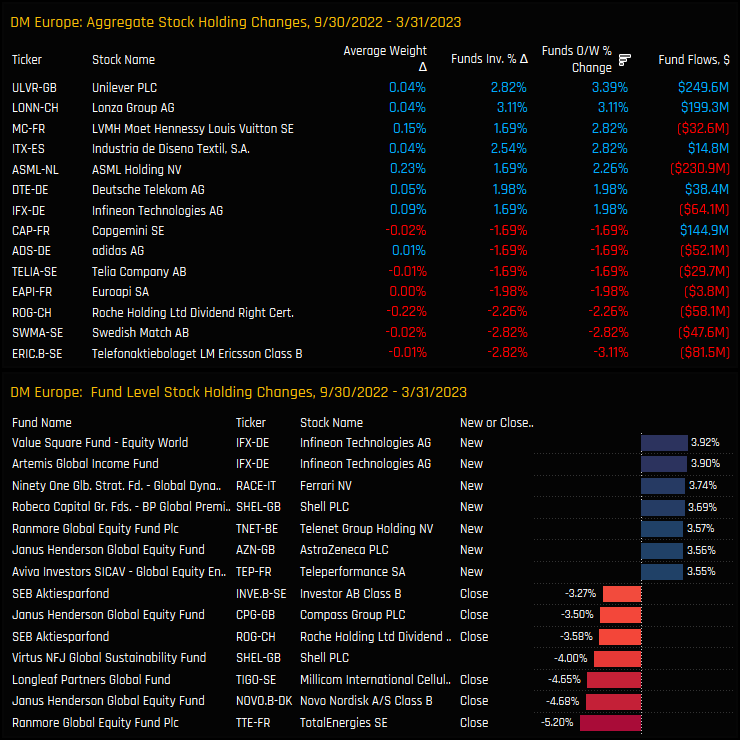
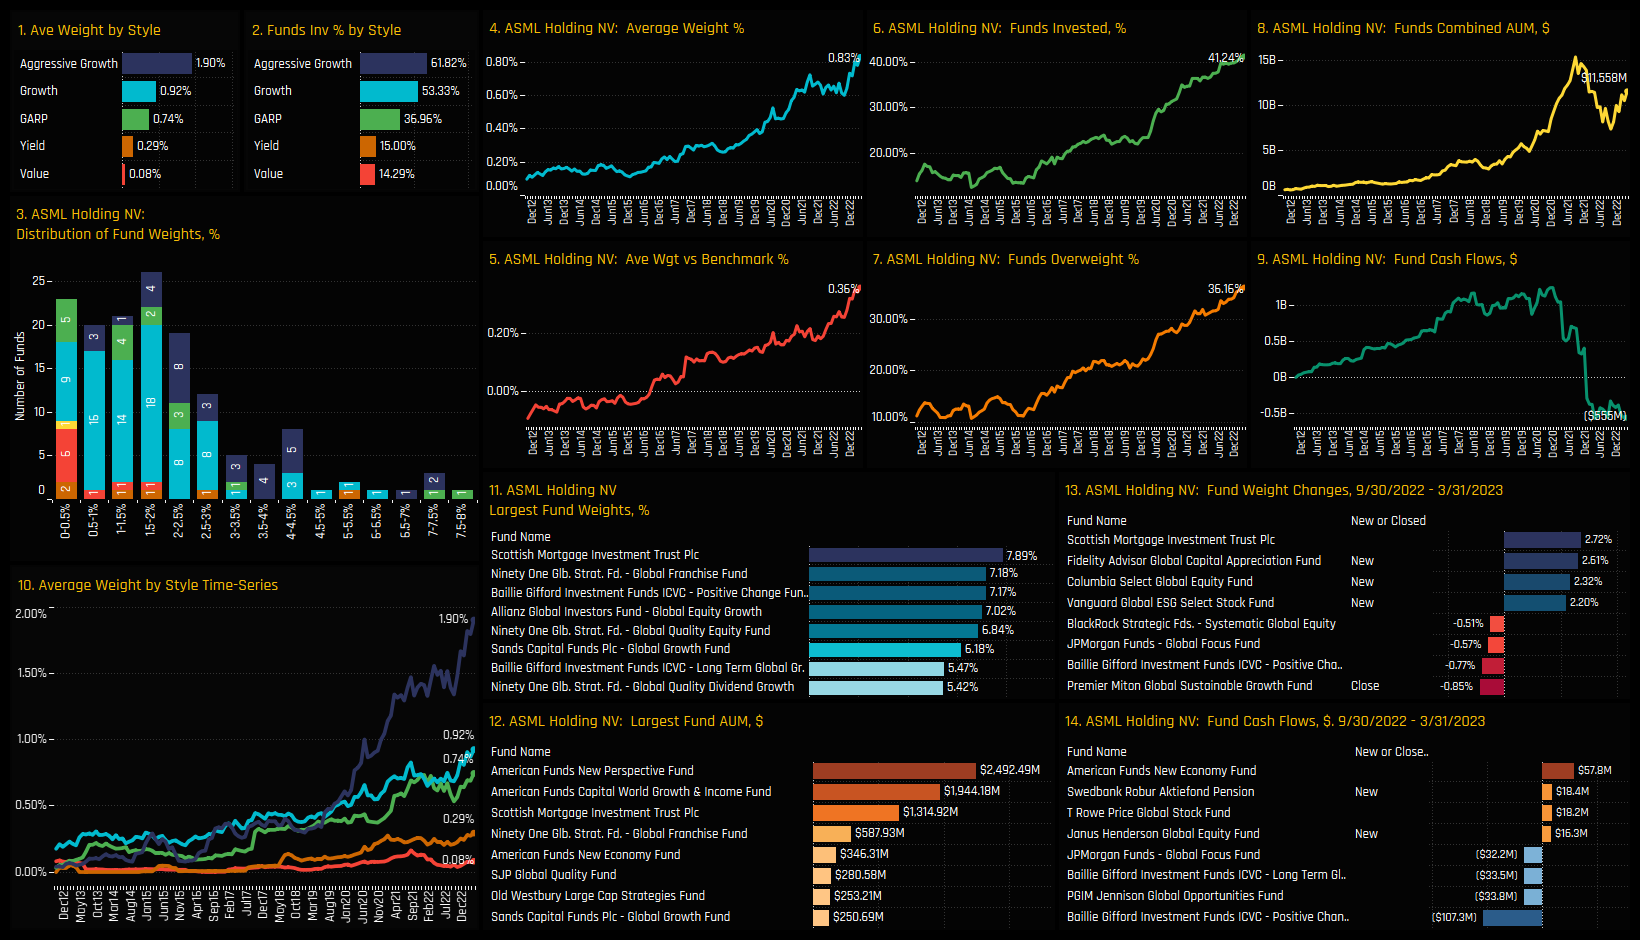
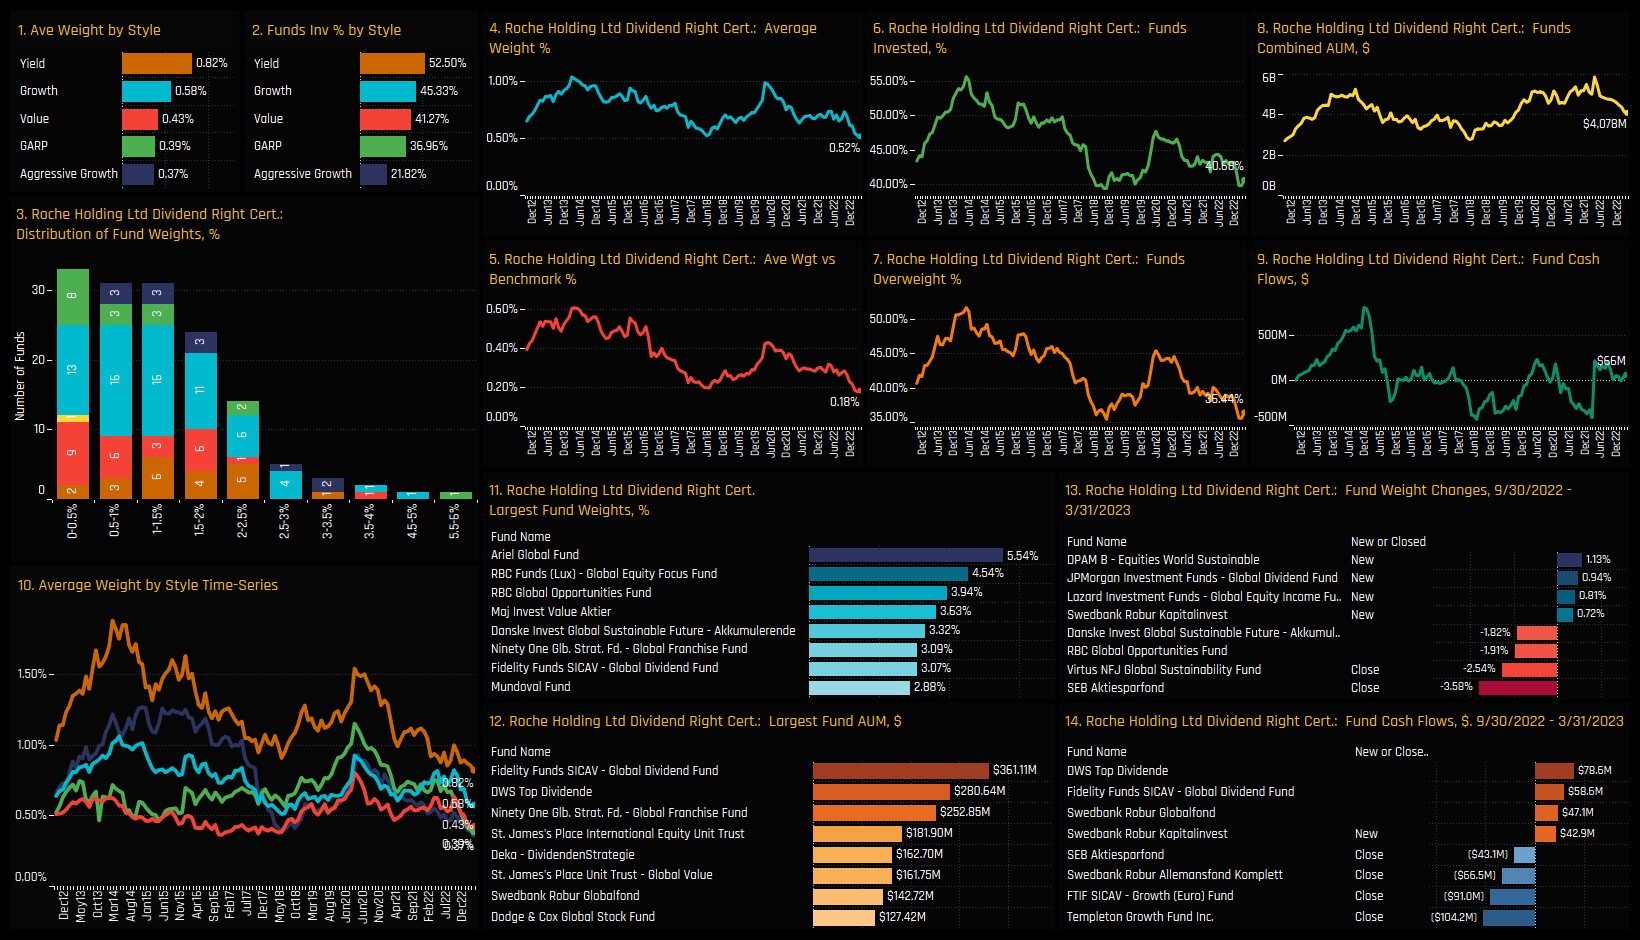
Ownership increases on a stock level over the last 6-months were driven some of Europe’s most established companies. Unilever and Lonza Group saw the percentage of funds invested increase by 3.1% and 2.8% respectively, and ASML and LVMH saw average weights increase by 0.23% and 0.15%. It wasn’t all one-way traffic though, with investors more cautious on Ericsson, Swedish Match and Roche Holdings.
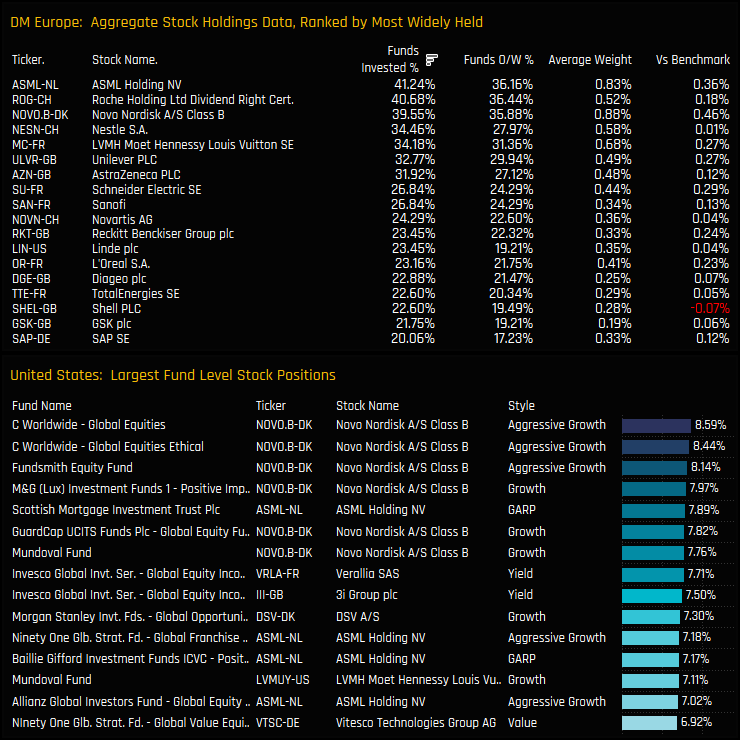
Stock ownership in DM is not nearly as widespread as for the US megacap stocks. The most widely held companies are ASML Holdings, Roche Holding and Novo Nordisk, all held by around 40% of managers and at levels higher than the benchmark. In fact, all of the most widely held stocks in DM Europe are held overweight on average with the exception of Shell PLC. On an individual fund level, large positions in Novo Nordisk from C Worldwide and Fundsmith Equity are the standouts.
Stock Ownership by Style
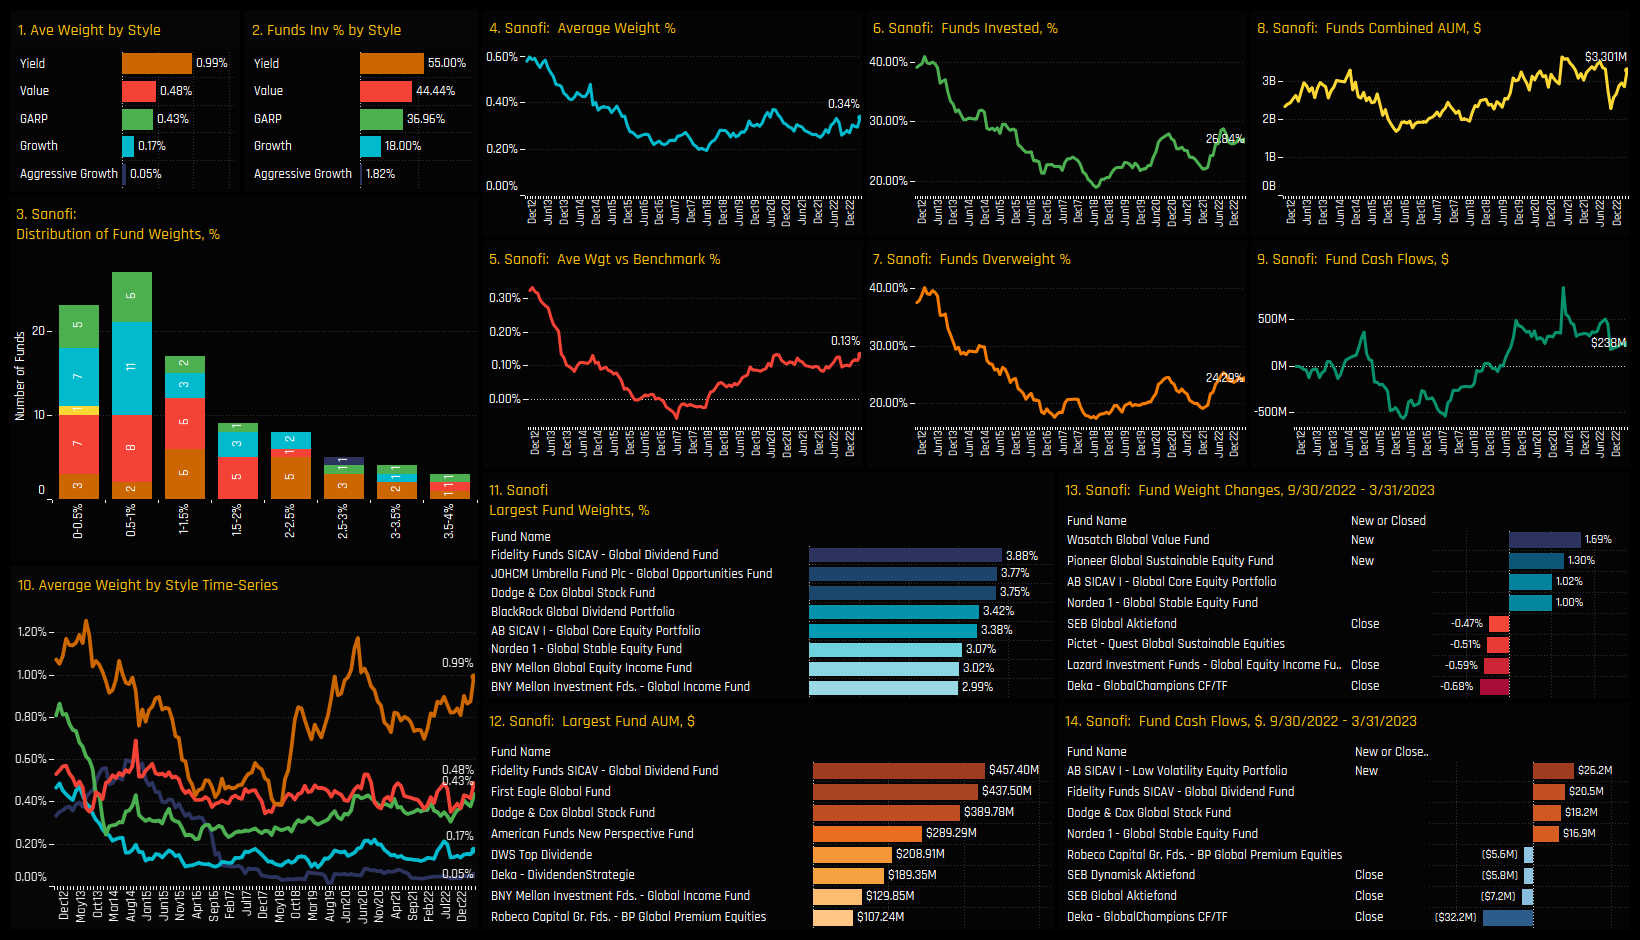
The below set of charts splits stock ownership by the Style of the fund, and highlights a big difference between the holdings of Value and Growth investors. At the Growth end of the spectrum, ASML Holdings, L’Oreal and LVMH are all widely held among Global Aggressive Growth and Growth investors. For Value and Yield investors, neither of those 3 stocks appears in the top 10 most widely held, with Sanofi, TotalEnergies and Novartis among the key holdings. Stocks with cross-Style appeal are Schneider Electric, Nestle and Roche Holding.
Conclusions & Links
Active Global managers have been increasing overweights in DM European stocks for the best part of the last decade. What makes things different this time is that today’s record overweight of +9.7% comes hand in hand with a significant increase in absolute exposure, with average weights increasing from 24.4% to 27.6% in the space of just 6-months. This is the first time we have seen both absolute and relative weights move in the same direction and was driven by a significant rotation away from the USA.
The chart opposite shows the average fund weights versus the SPDRs MSCI ACWI ETF weight in DM Europe, split by Style. It shows that the record overweights have been driven by all funds, irrespective of Style. In particular, the rise of both Value and Aggressive Growth fund overweights to record levels shows the cross-style appeal of DM Europe to Global active investors. As it stands, all Style groups are positioned overweight the benchmark, and by a significant margin. Overweight DM Europe is the consensus trade for 2023.
Please click on the links below for a data pack on DM European positioning among active Global equity funds. Scroll below for individual profiles on ASML Holdings, Sanofi and Roche Holdings.
For more analysis, data or information on active investor positioning in your market, please get in touch with me on steven.holden@copleyfundresearch.com


