In this issue:
Global Equity Managers Trim EM Underweight, but Remain Bearish
Global Funds Country/Sector Radar
Global Managers Lead a Bullish Charge on Linde plc
349 Global Equity Funds, AUM $999bn
Global Equity Managers Trim EM Underweight, but Remain Bearish
• The heavy decline in EM allocations that started in early 2021 came to an end last October. Since then, a growing number of funds are rotating back in or moving to an overweight stance.
• Value managers are the largest allocators, but Growth and Aggressive Growth are now increasing exposure.
• Taiwan, China & HK, Mexico and Indonesia are at the heart of these moves, but all major countries are held underweight, on average.
• Stock exposures remain heavily skewed to the large caps, with 38% of the EM allocation in 6 key companies.
Time Series Analysis & EM vs DM
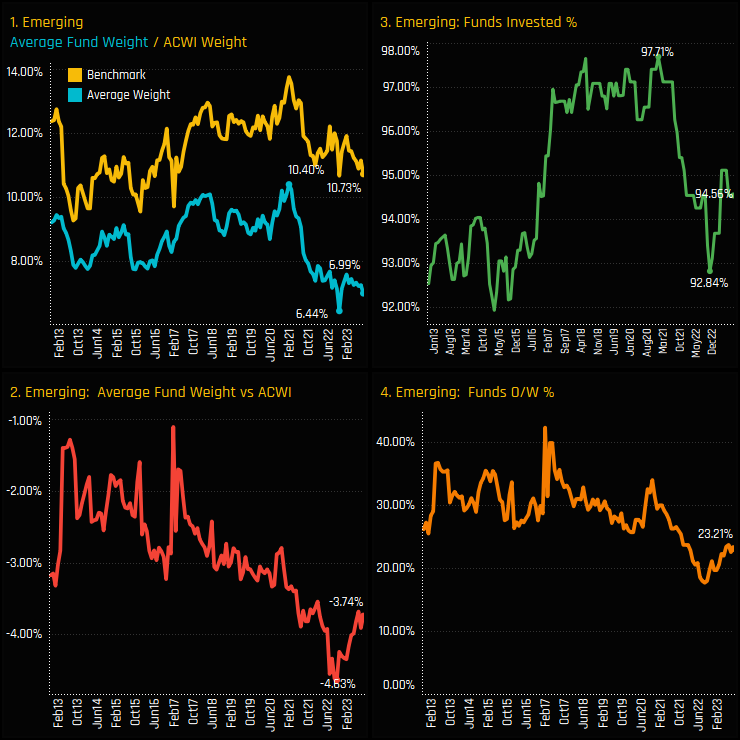
Active Global managers have been positioned underweight Emerging Markets since our records begin in late 2012. Chart 1 below shows the consistent gap between the average active allocation (blue) and the iShares ACWI weight (yellow). This underweight hit a peak of -4.63% following a heavy rotation away from EM between Jan 2021 and October 2022. During this period, EM average weights fell from 10.4% to 6.4% and the percentage of funds with any EM exposure from 97.7% to 92.8%. However, since that bottom last October, some Global managers have started to rotate back in, with selected funds either switching to overweight or reinstating their recently closed exposures.
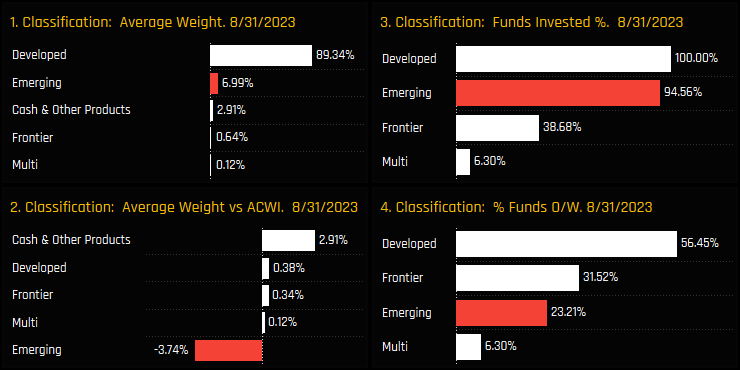
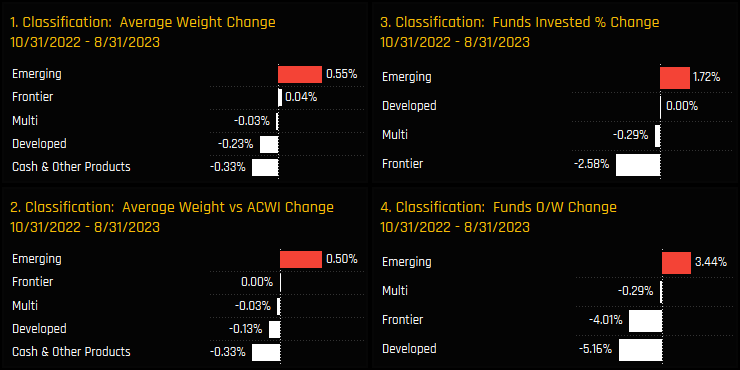
The top 4 charts below show the latest ownership statistics between the major stock classifications. Emerging Markets are a tiny allocation for the average Global fund at 6.99%, dwarfed by the 89.34% in Developed Markets. Versus the iShares ACWI benchmark, EM is a strategic underweight, offsetting cash positions of 2.91%, whilst managers remain largely inline with benchmark in Developed Market stocks. Ownership changes in the bottom 4 charts show EM rising across all metrics since the lows of October 2022. Notably, an increase in average weight of +0.55% and a decrease in the net underweight of +0.5%. Chart 4 shows 3.44% of funds moving to an overweight stance in EM against -5.16% moving to underweight DM.
Fund Holdings & Activity
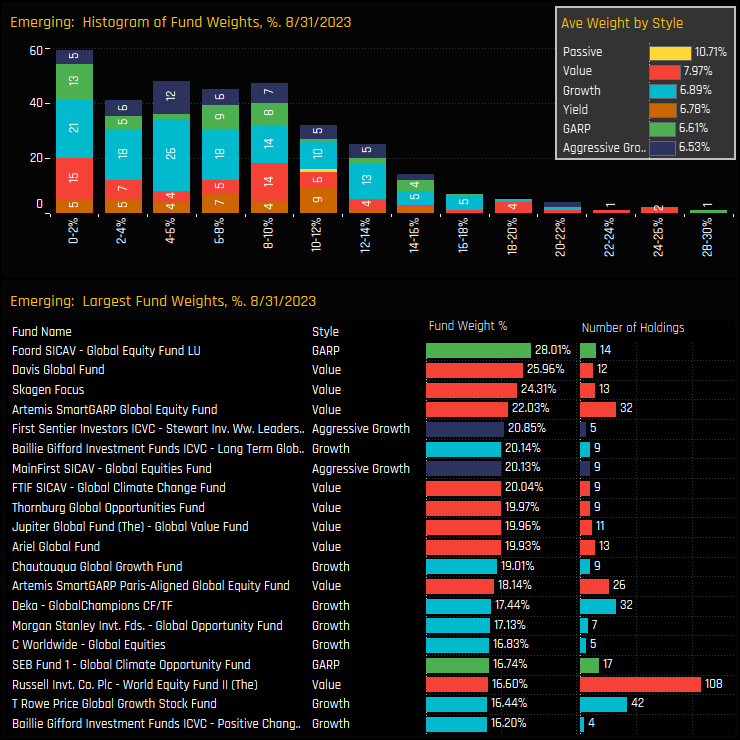
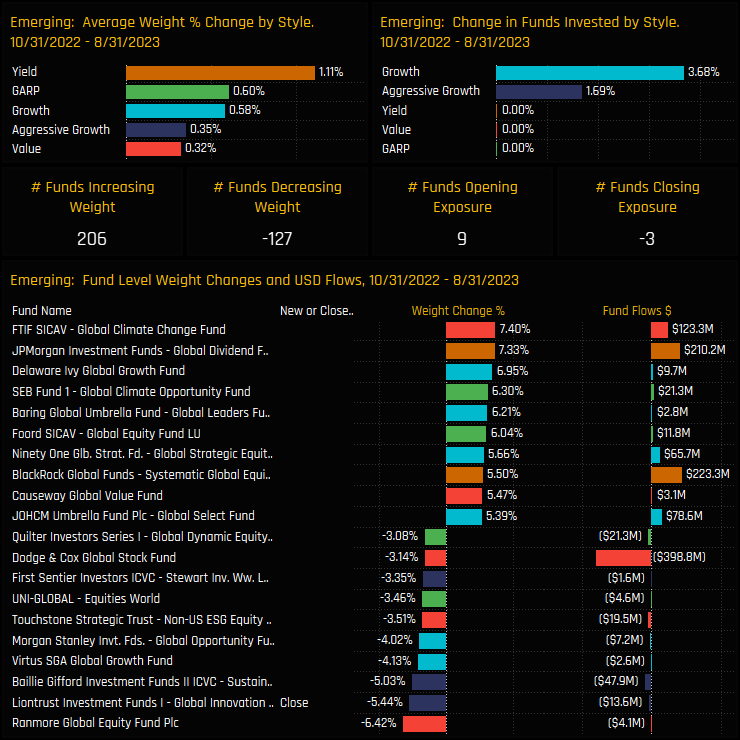
The top chart below shows the histogram of funds weights in Emerging Markets as of 08/31/2023. For each 2% bucket below 12%, the number of managers is quite evenly dispersed, with 272 of the 349 funds in our analysis holding a sub-12% allocation. The inset chart shows the average allocation by fund style, with Value funds the top allocators at 7.97%, though all are underweight the ACWI benchmark weight of 10.71%. Value managers dominate the bottom list of the largest holders, though the GARP strategy of Foord Global Equity tops the chart with a 28% allocation.
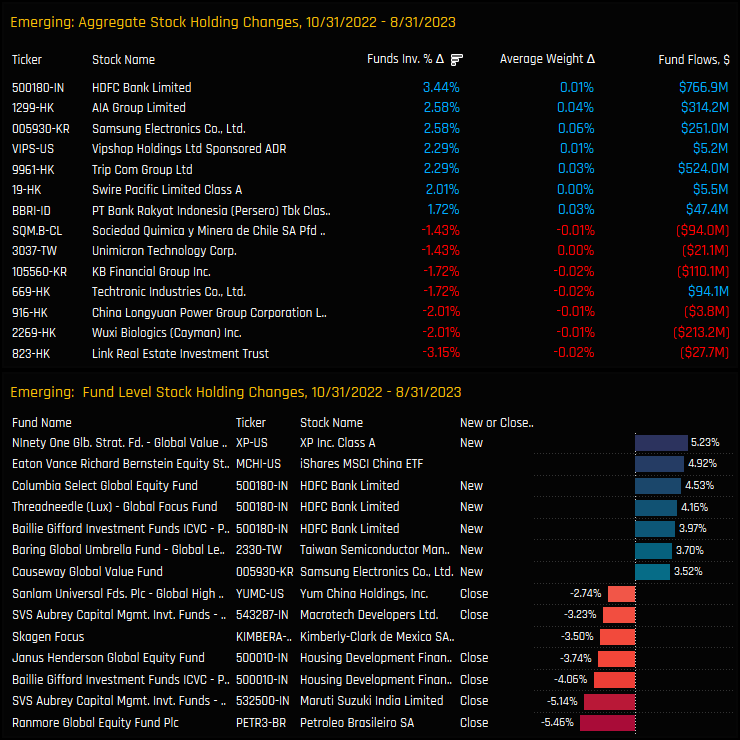
Fund level activity since the October 2022 lows shows the buyside bias that has driven EM allocations higher. All Style groups saw average allocations increase over the period, with a net +3.68% of Growth funds and +1.69% of Aggressive Funds adding new exposure. Over the period, 9 funds opened new EM exposure versus 3 closing and with a large excess of funds increasing weight compared to decreasing. On a fund level, FTIF Global Climate Change (+7.4%) and JP Morgan Global Dividend (+7.33%) led the increases, whilst Ranmore Global Equity and Liontrust Global Innovation led the decreases.
EM Country Allocations & Activity
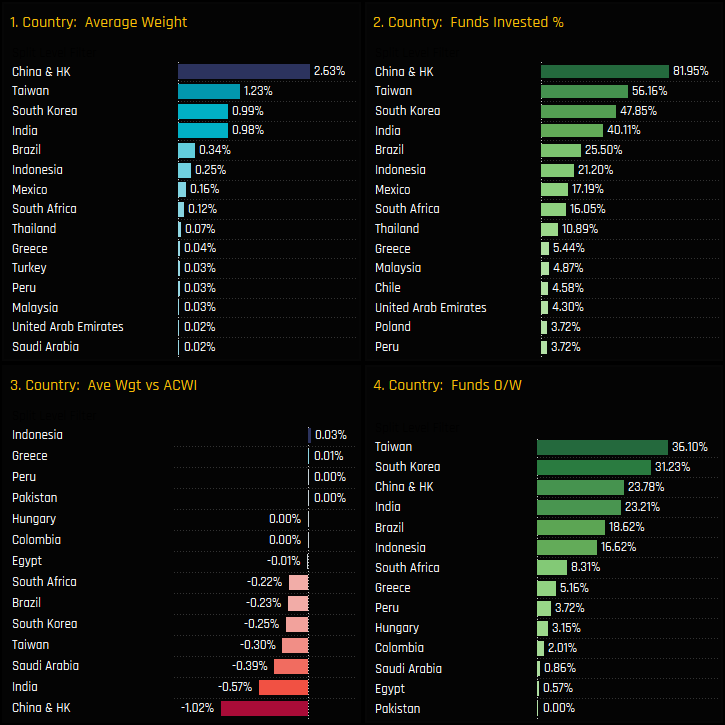
Broken down by Country, Global funds hold 83% of their total EM allocation in the big 4 of China & HK, Taiwan, South Korea and India, with China the dominant country by a margin (ch1). All countries are held underweight the benchmark with the exception of tiny overweights in Indonesia and Greece. China & HK is the standout underweight (ch3).
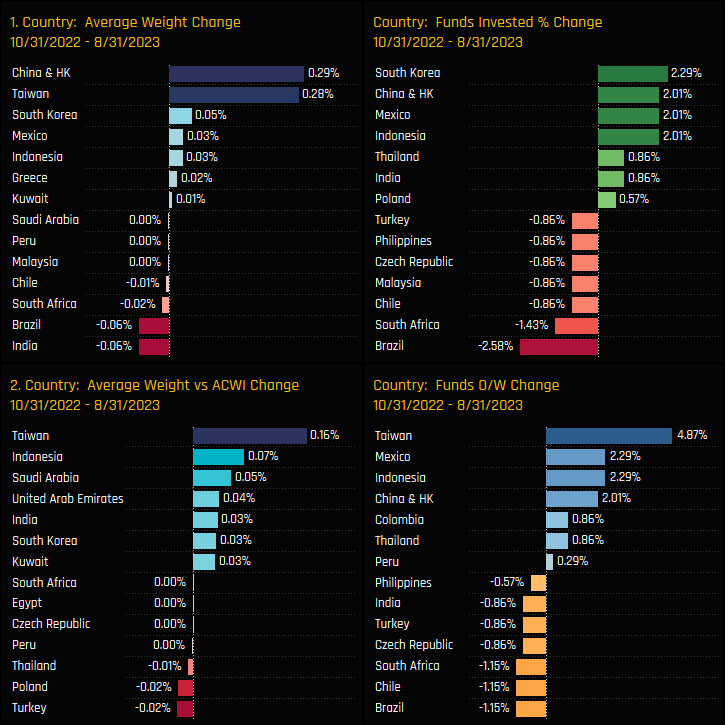
Country level activity between 10/31/2022 and 08/31/2023 shows China & HK and Taiwan the drivers behind the moves higher in average weight (ch1), though the decrease in EM underweight was caused by rotation in to Taiwan and Indonesia. In LATAM, Mexico was a notable recipient of inward rotation whilst Global funds scaled back their Brazilian exposure.
Stock Holdings & Activity
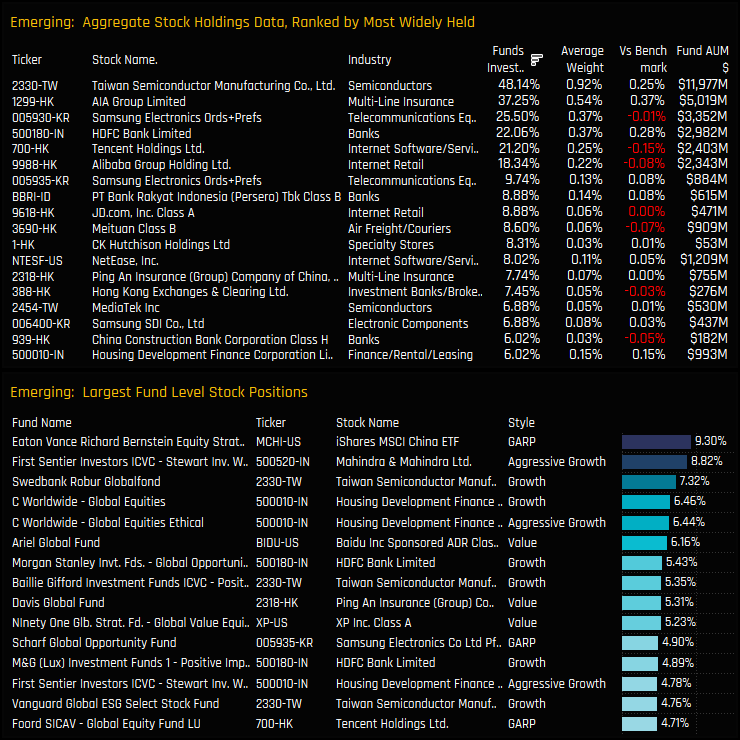
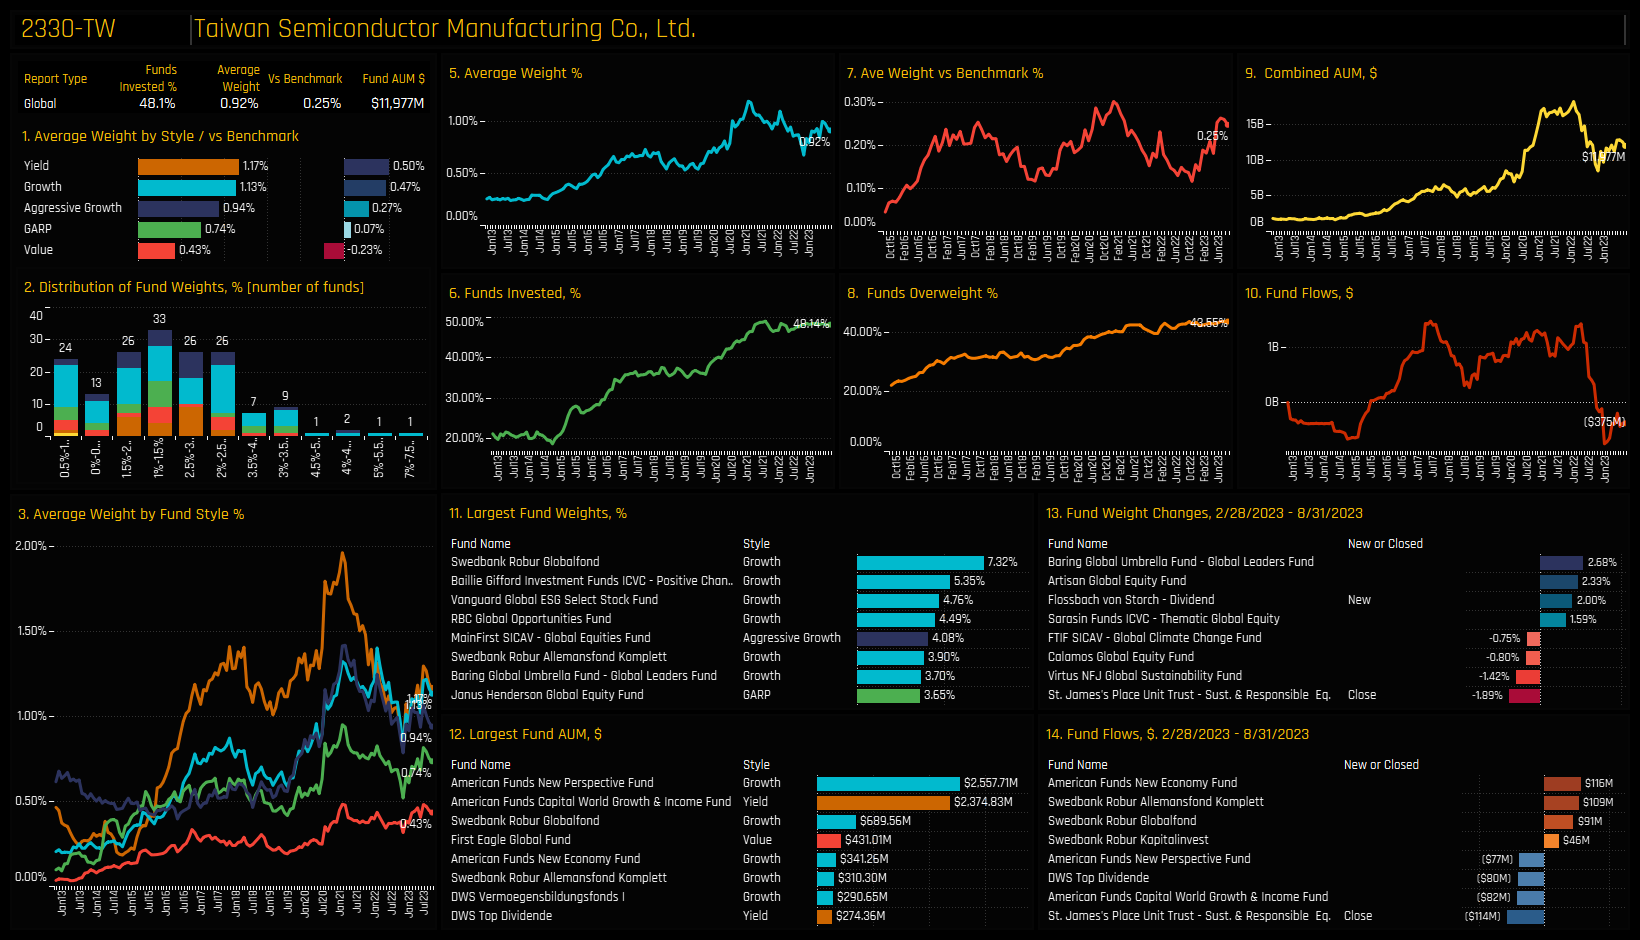
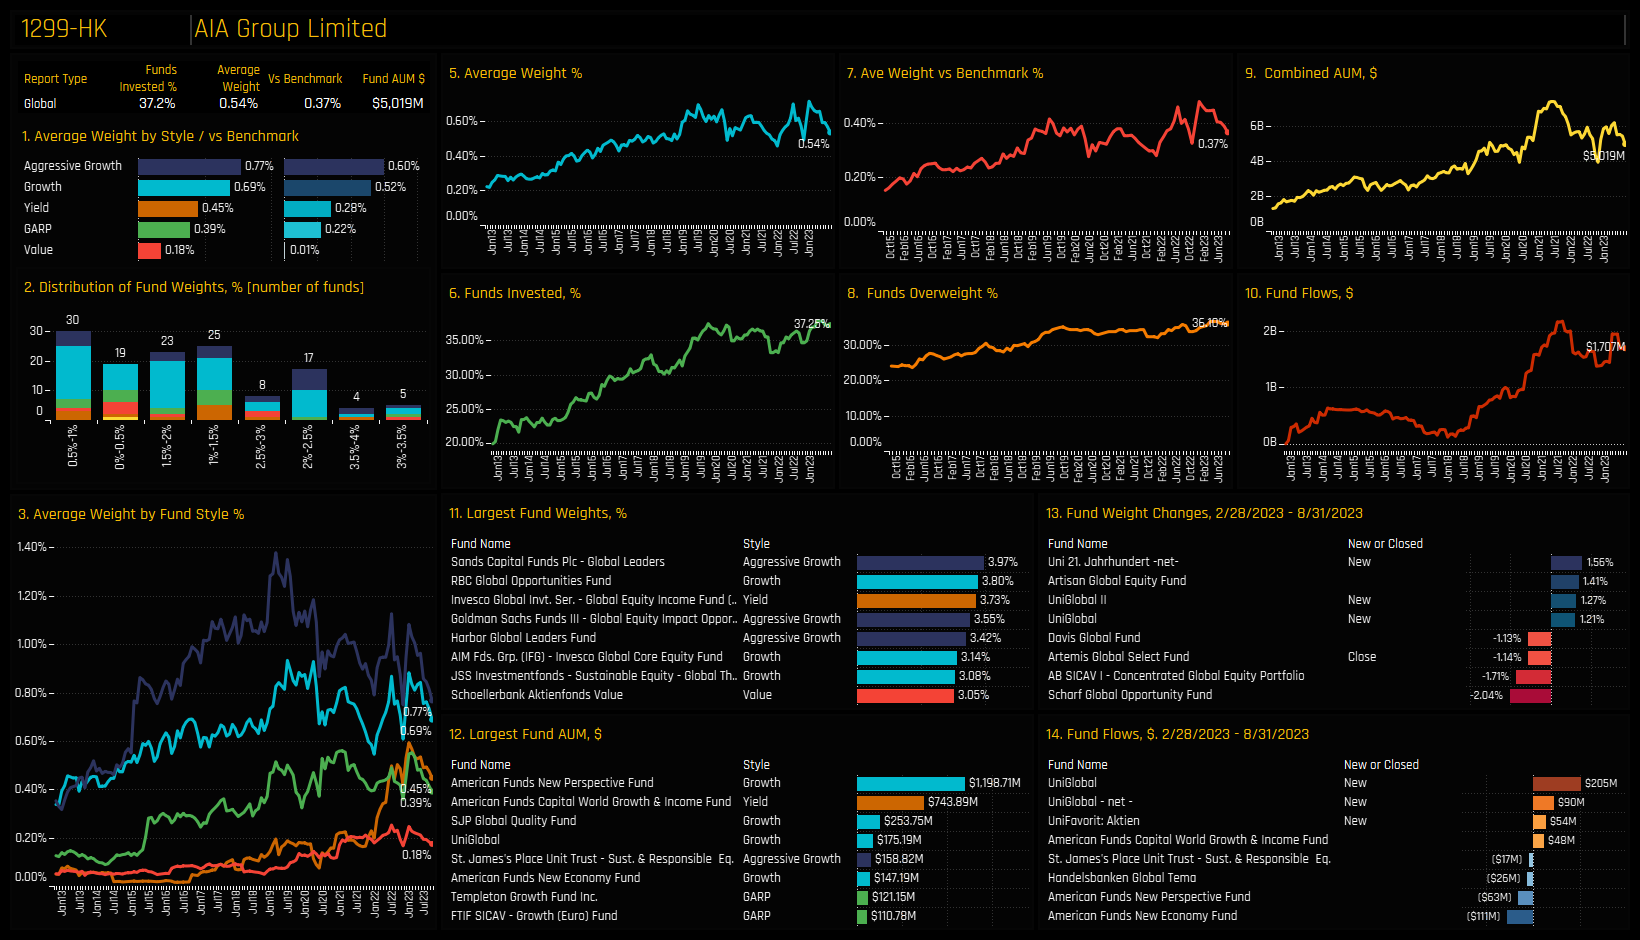
Stock level ownership in EM remains fairly thin. TSMC is the most widely held company with 48.14% of funds owning a position, followed by AIA Group (37.25%) and Samsung Electronics (25.5%). But outside of the top 6, no other company in EM is held by more than 10% of funds. Of the larger individual fund level positions in the bottom chart, First Sentier’s 8.8% position in Mahindra & Mahindra stands out as a large position outside of the more popular names in the top chart.
Activity since 10/31/2022 hasn’t been all one way, but again skewed to the buyside. HDFC Bank Limited, AIA Group Limited and Samsung Electronics saw the largest increases in investment, whilst Global investors scaled back exposure to Link Real Estate Investment Trust and Wuxi Biologics, among others. On a fund level, good sized opening positions in HDFC Bank by Columbia Threadneedle and Baillie Gifford were the stand outs.
Conclusions & Links
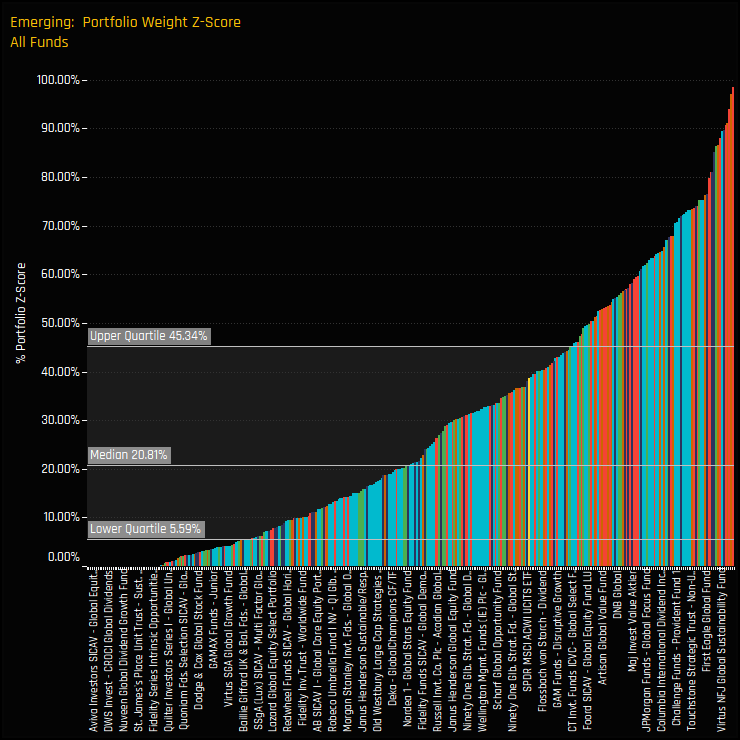
The chart to the right shows the Z-Score of each fund’s current weight in EM compared to all historical values going back to 2012. A Score of 100% means today’s weight is the highest on record for that fund, 0% the lowest. The quartile values tell the story, with half of the managers in our analysis at a Z-score of 20.8% or less, and 75% with a Z-Score of 45.3% or less. In short, managers are lightly positioned compared to their own history.
It’s almost hard to believe that despite all the coverage and buzz around emerging markets this year, they only make up 6.99% of the average global portfolio. Although ownership is no longer declining, the recent uptick feels more of a cautious step rather than a full-on turn in sentiment. The fact remains that 77% of the global funds in our analysis are positioned for underperformance – we’re a long way from bullish positioning in EM.
Click on the link below for the latest data report on Emerging Markets among the active Global funds in our analysis. Scroll down for stock profiles on TSMC and AIA Group.
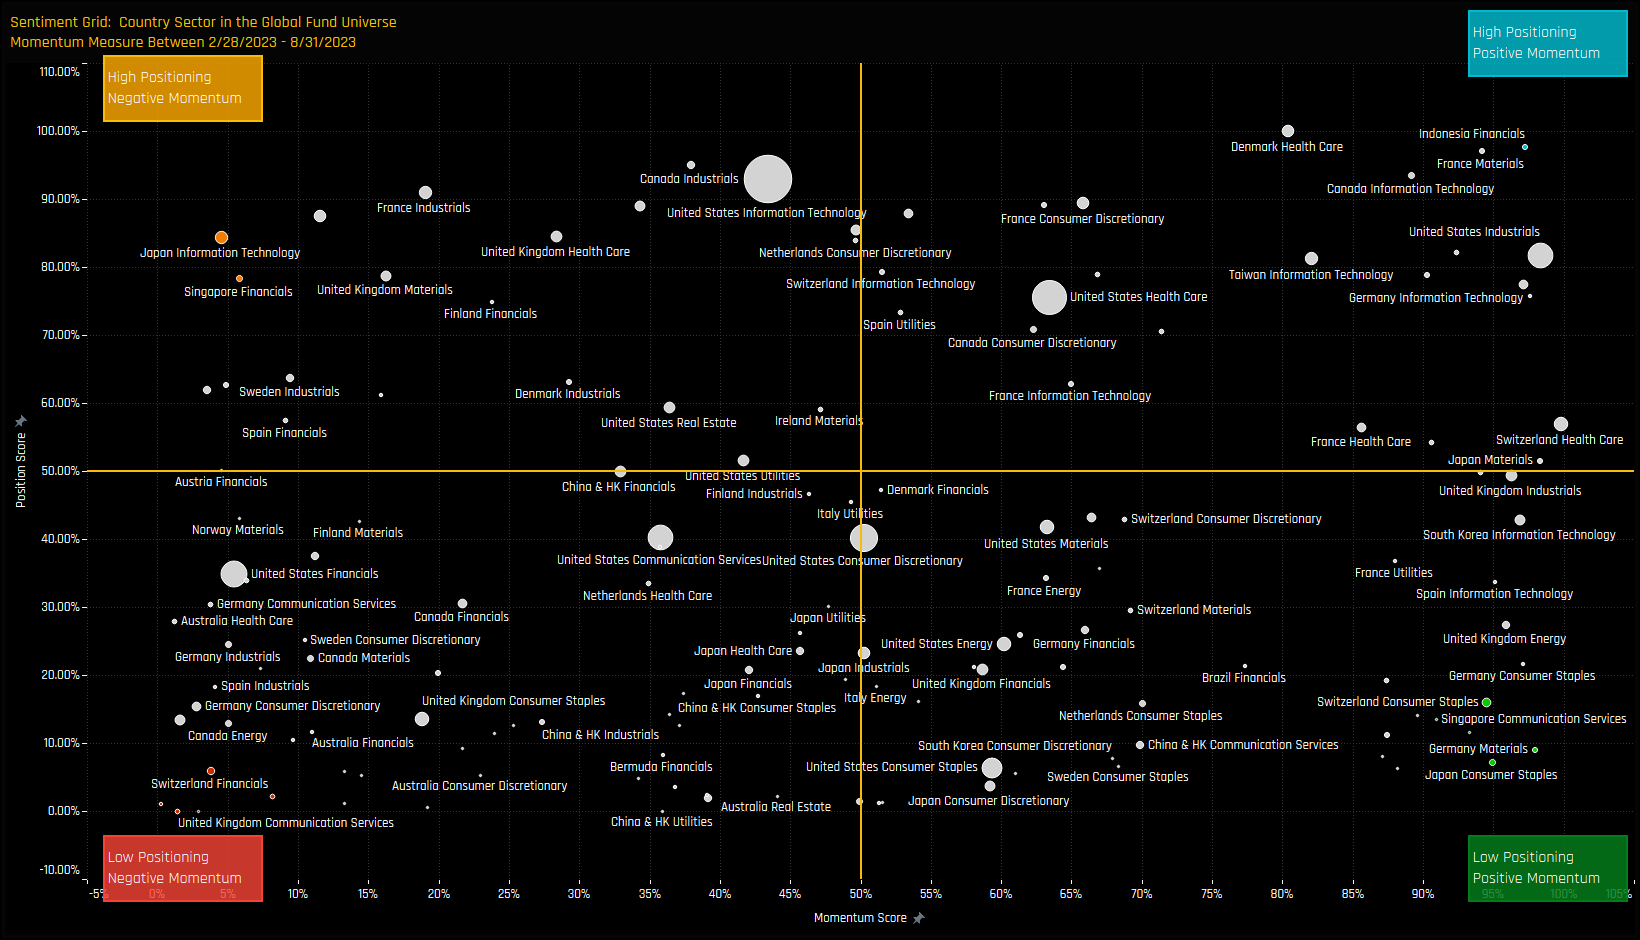
Investment levels among the key country/sectors in the investible Global universe differ greatly. Some country/sectors are widely owned, others largely avoided with ownership levels changing every month. We combine current and historical positioning against shorter-term manager activity to get a handle on where sentiment lies for every country/sector in our Global analysis. We highlight 8 country/sectors at the extreme ends of their own positioning ranges whilst also seeing significant changes in fund ownership.
Country/Sector Sentiment
The Sentiment Grid below is designed to visualize the interplay between current fund positioning, long-term fund positioning and shorter-term fund manager activity for all country/sectors in the Global fund active universe. The Y-axis shows the ‘Position Score’, a measure of current positioning in each country/sector compared to its own history going back to 2012 on a scale of 0-100%. It takes in to account the percentage of funds invested in each country/sector versus history, the average fund weight versus history and the percentage of funds overweight the benchmark versus history. The higher the number, the more heavily a country/sector is owned by active Global managers compared to its own history.
The X-Axis shows the ‘Momentum Score’, a measure of fund manager activity for each country/sector between 2/28/2023 and 08/31/2023 on a scale of 0% (maximum negative activity) to 100% (maximum positive activity). The Momentum Score takes in to account the change in the percentage of funds invested in each country/sector over the period, the change in average weight and the change in the percentage of funds overweight. The chart also highlights the country/sectors at the extreme ends of each quadrant by colour, which will shall explore in more detail below.
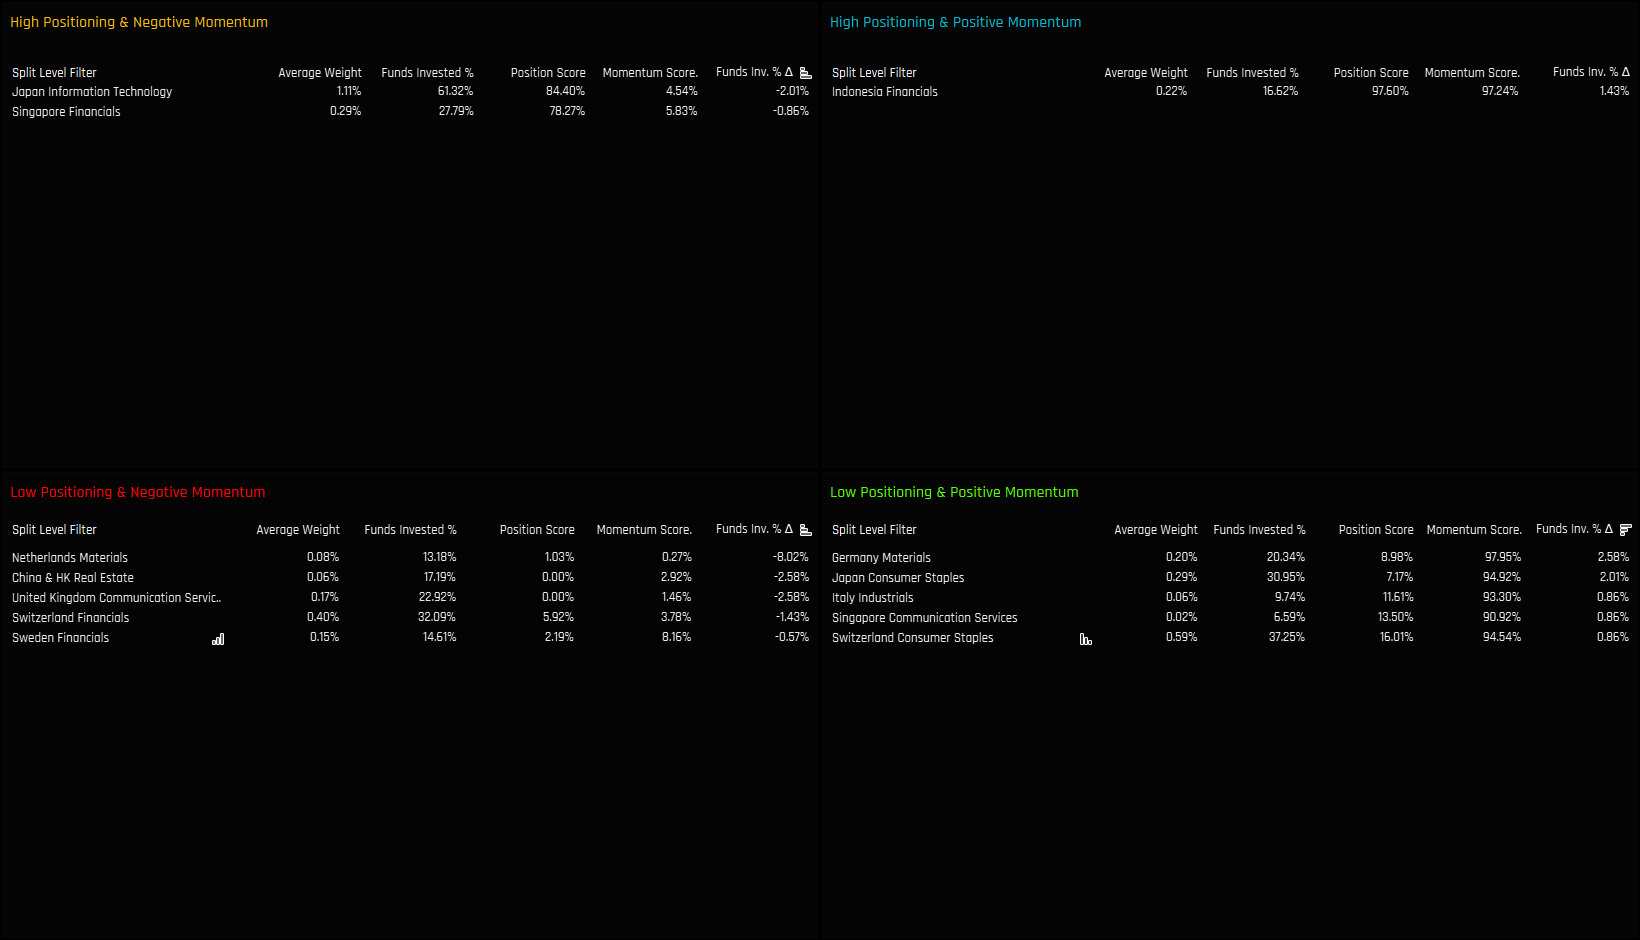
Extreme Country/Sectors
The tables below list the country/sectors in the extreme corners of each quadrant. The screening methodology is as follows:
High Positioning & Negative Momentum: Position Score > 75%. Momentum Score < 10%
High Positioning & Positive Momentum: Position Score > 95%. Momentum Score > 95%
Extreme Country/Sectors
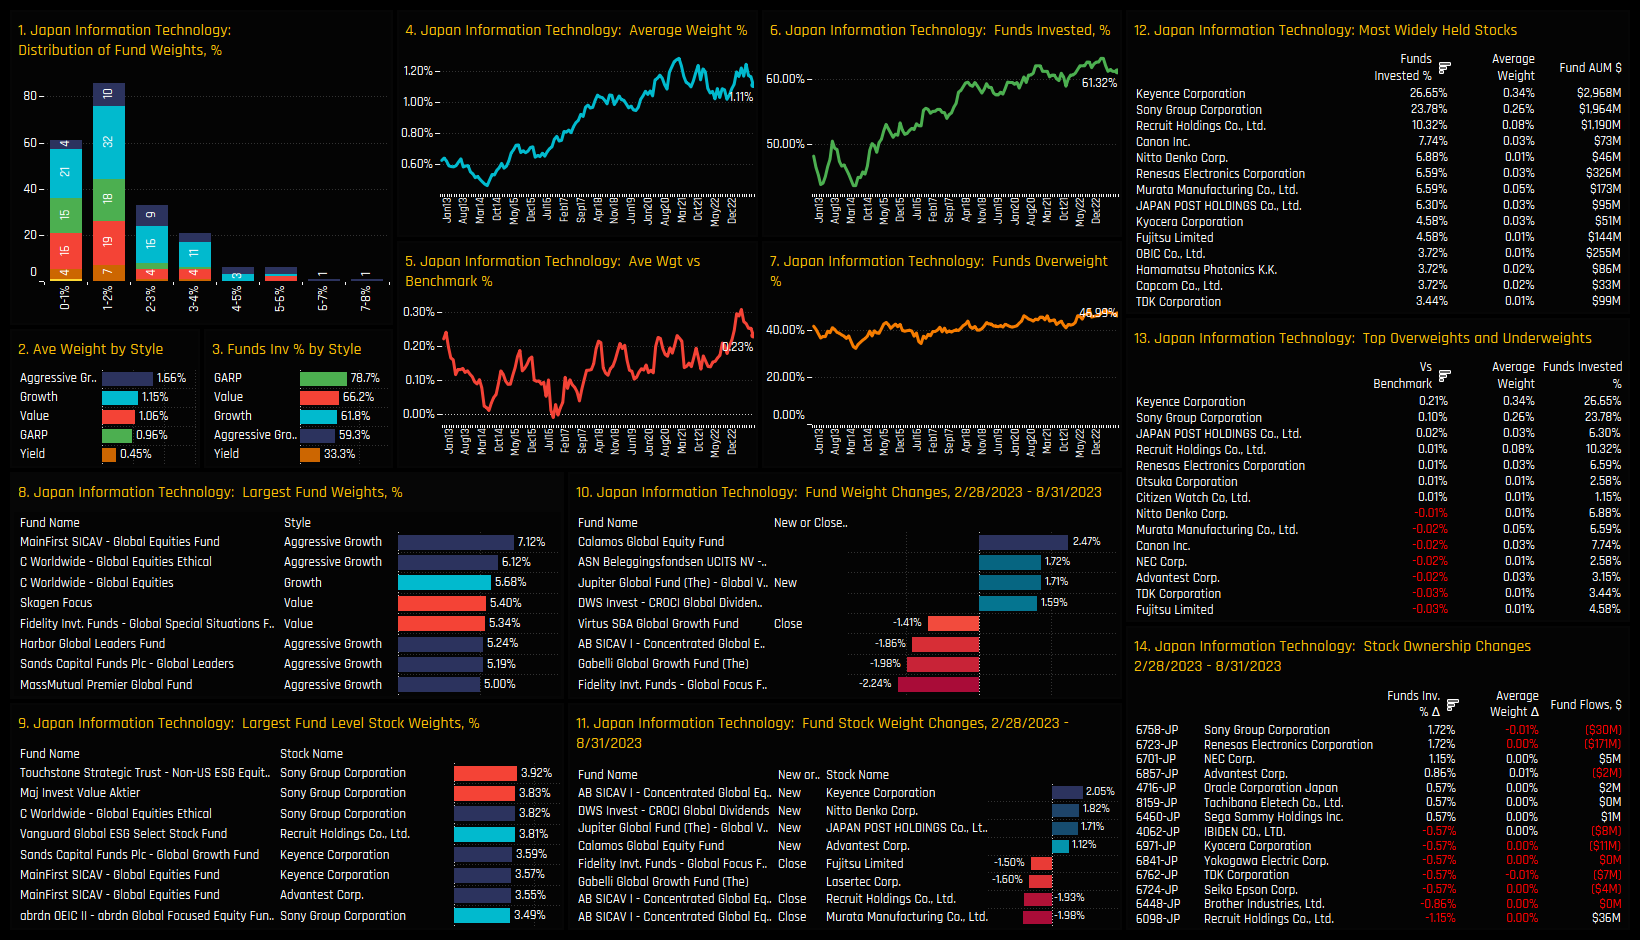
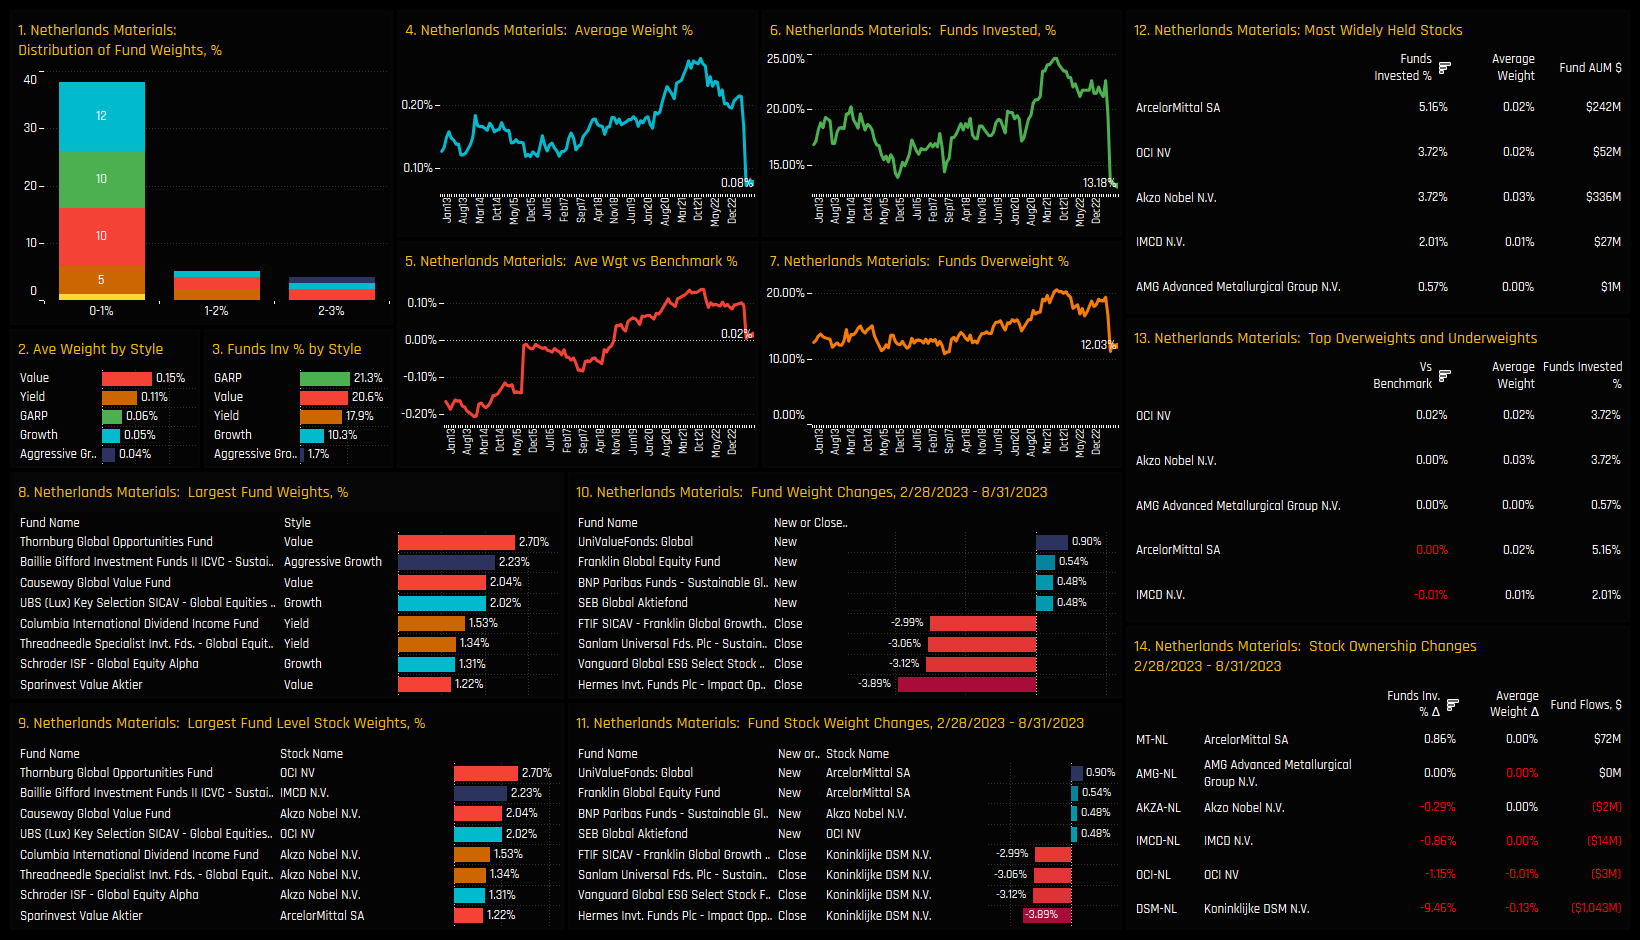
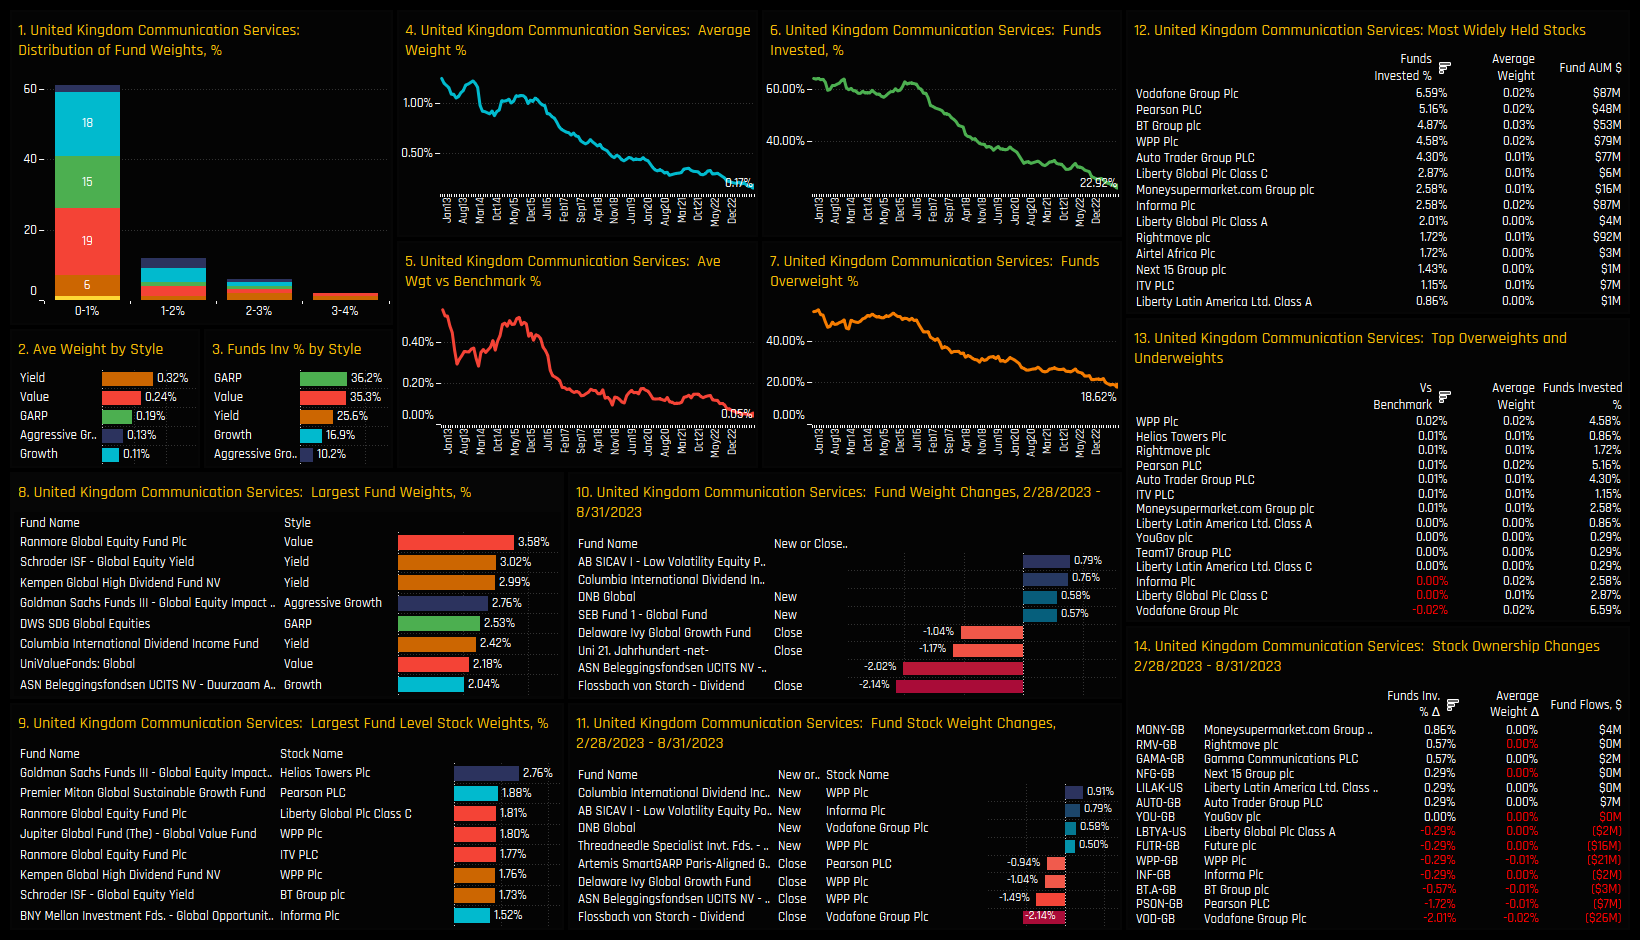
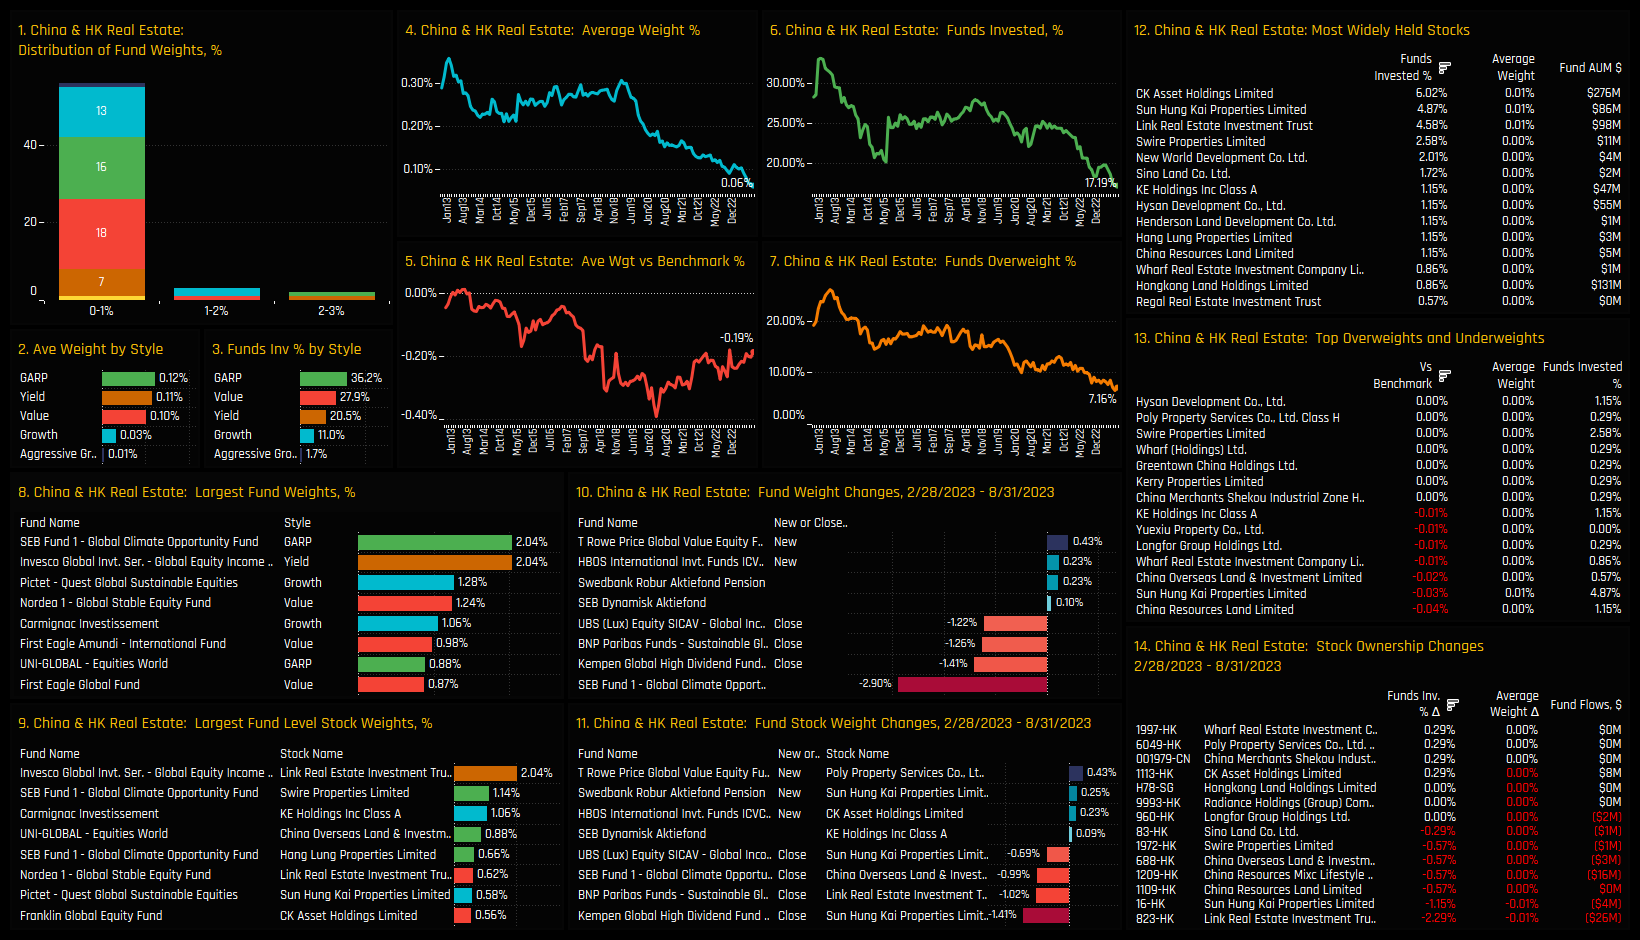
The following charts illustrate the proportion of active funds invested in each of the country/sectors listed above over time. This visualization provides an additional perspective how the Sentiment Grid works. For Japan Technology and Singapore Financials, today’s ownership levels are near their highest on record, but recent selling has push both off the highs. For UK Communication Services, China & HK Real Estate and Netherlands Materials, today’s record low levels of fund ownership follow years of decline.
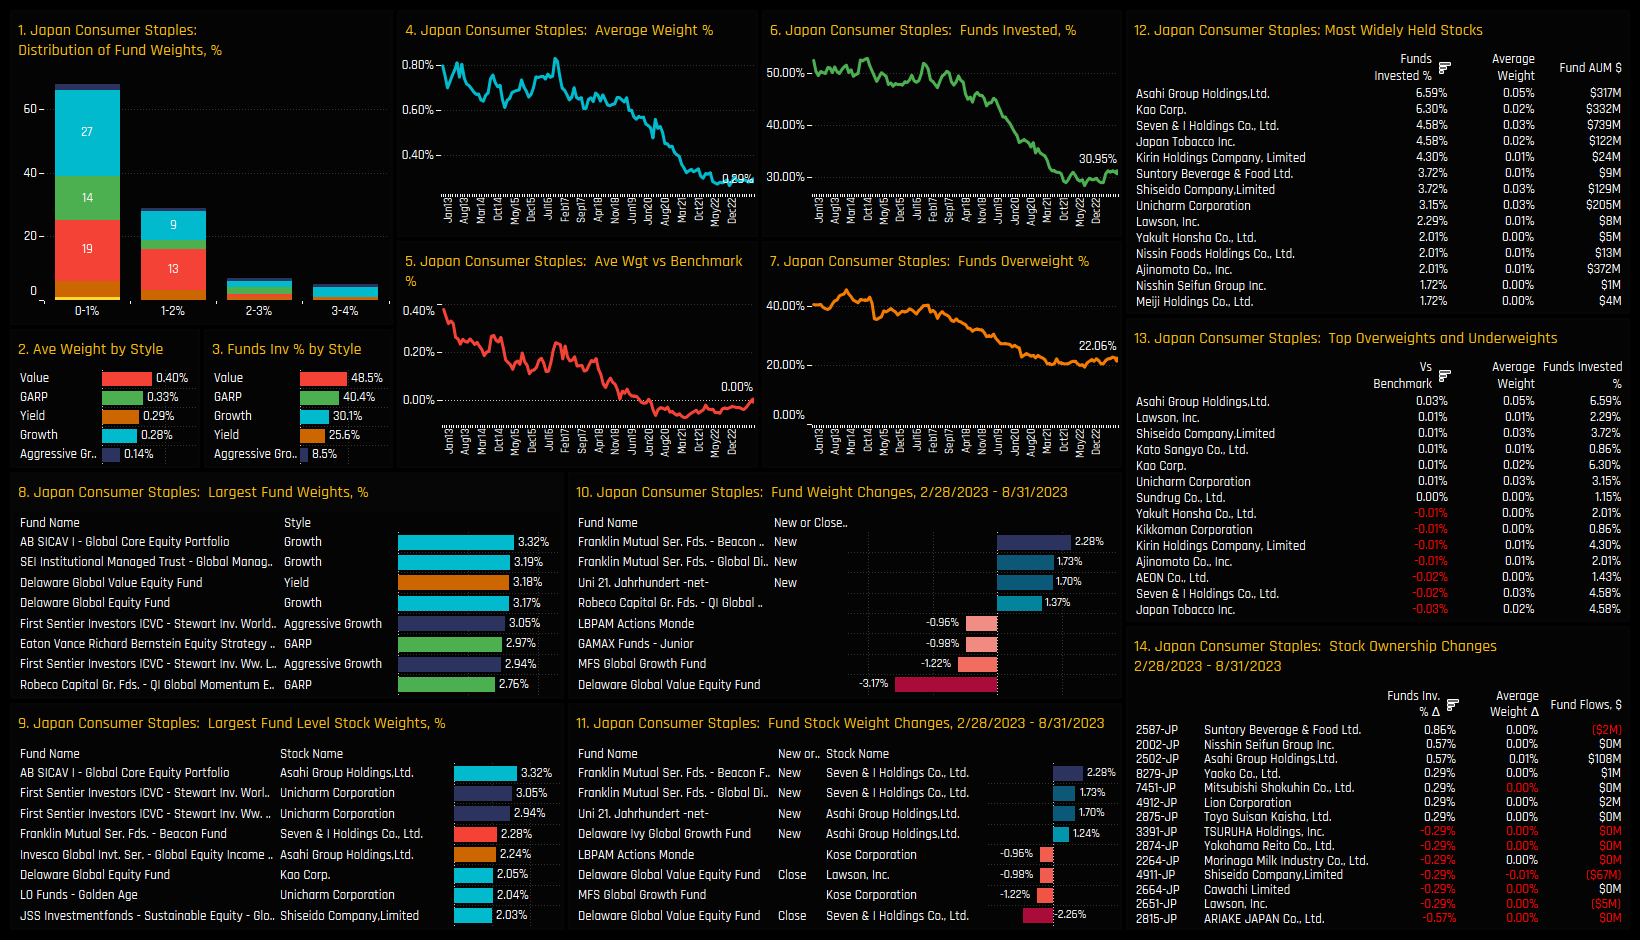
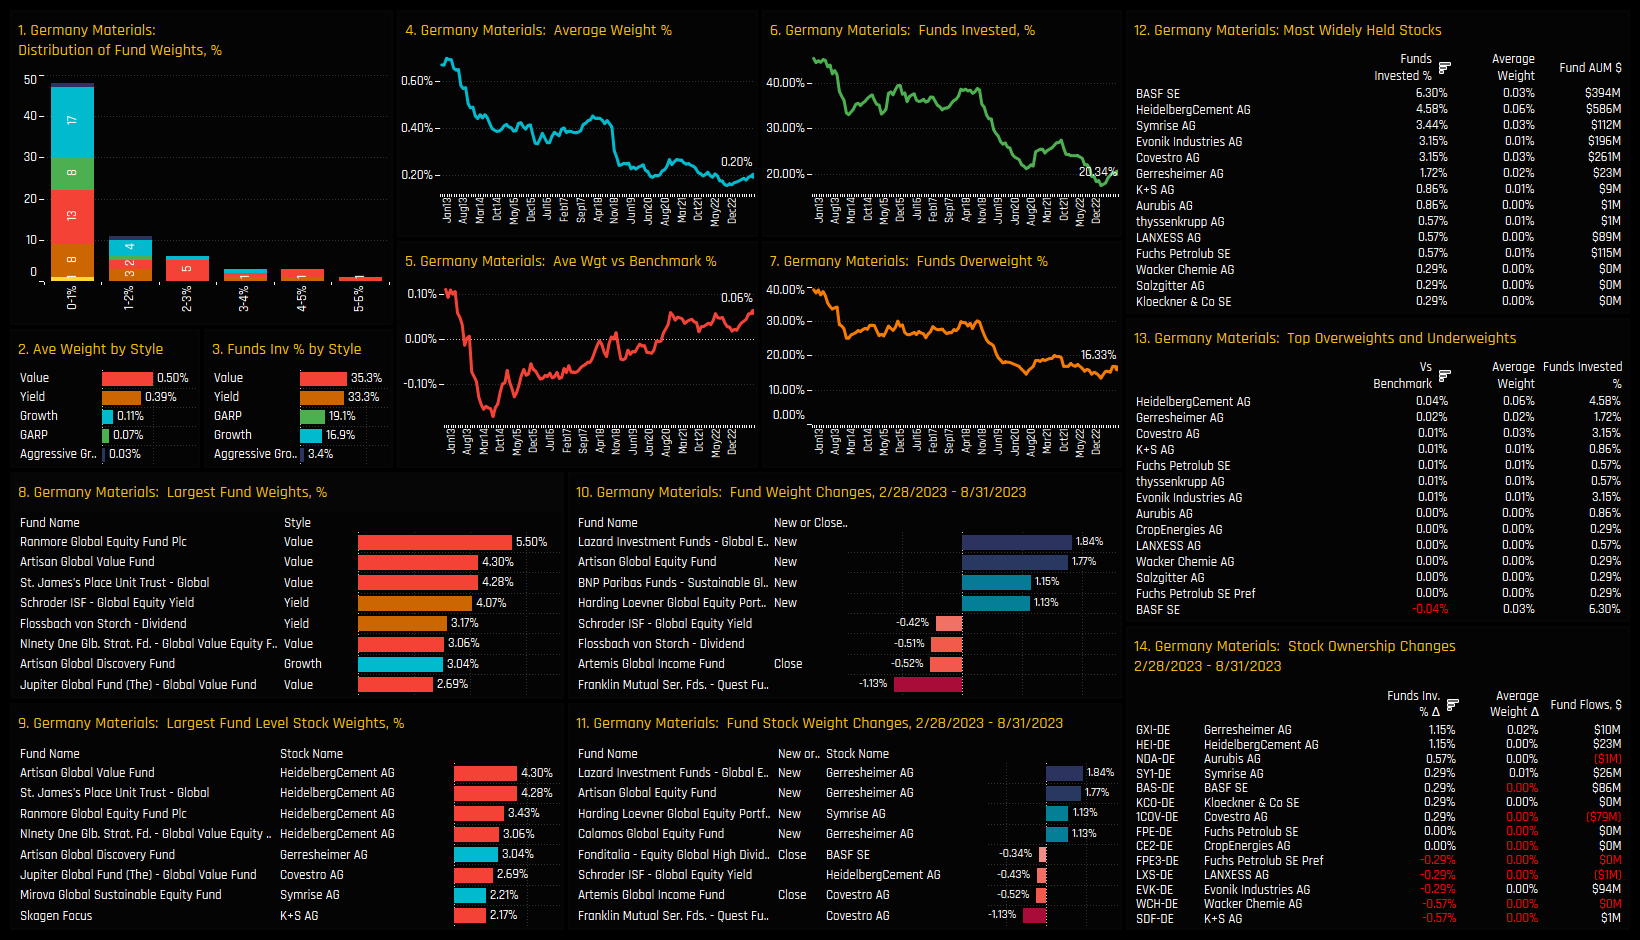
Japan Consumer Staples and German Materials have seen similar levels of long-term decline, but both sectors have seen ownership levels climb over the last 6-months. For Indonesian Financials, ownership levels are at all-time highs after sustained increases in exposure among active Global managers this year. Please scroll down for more detailed profiles of each country/sector to understand the funds and stocks behind the country/sector positioning.
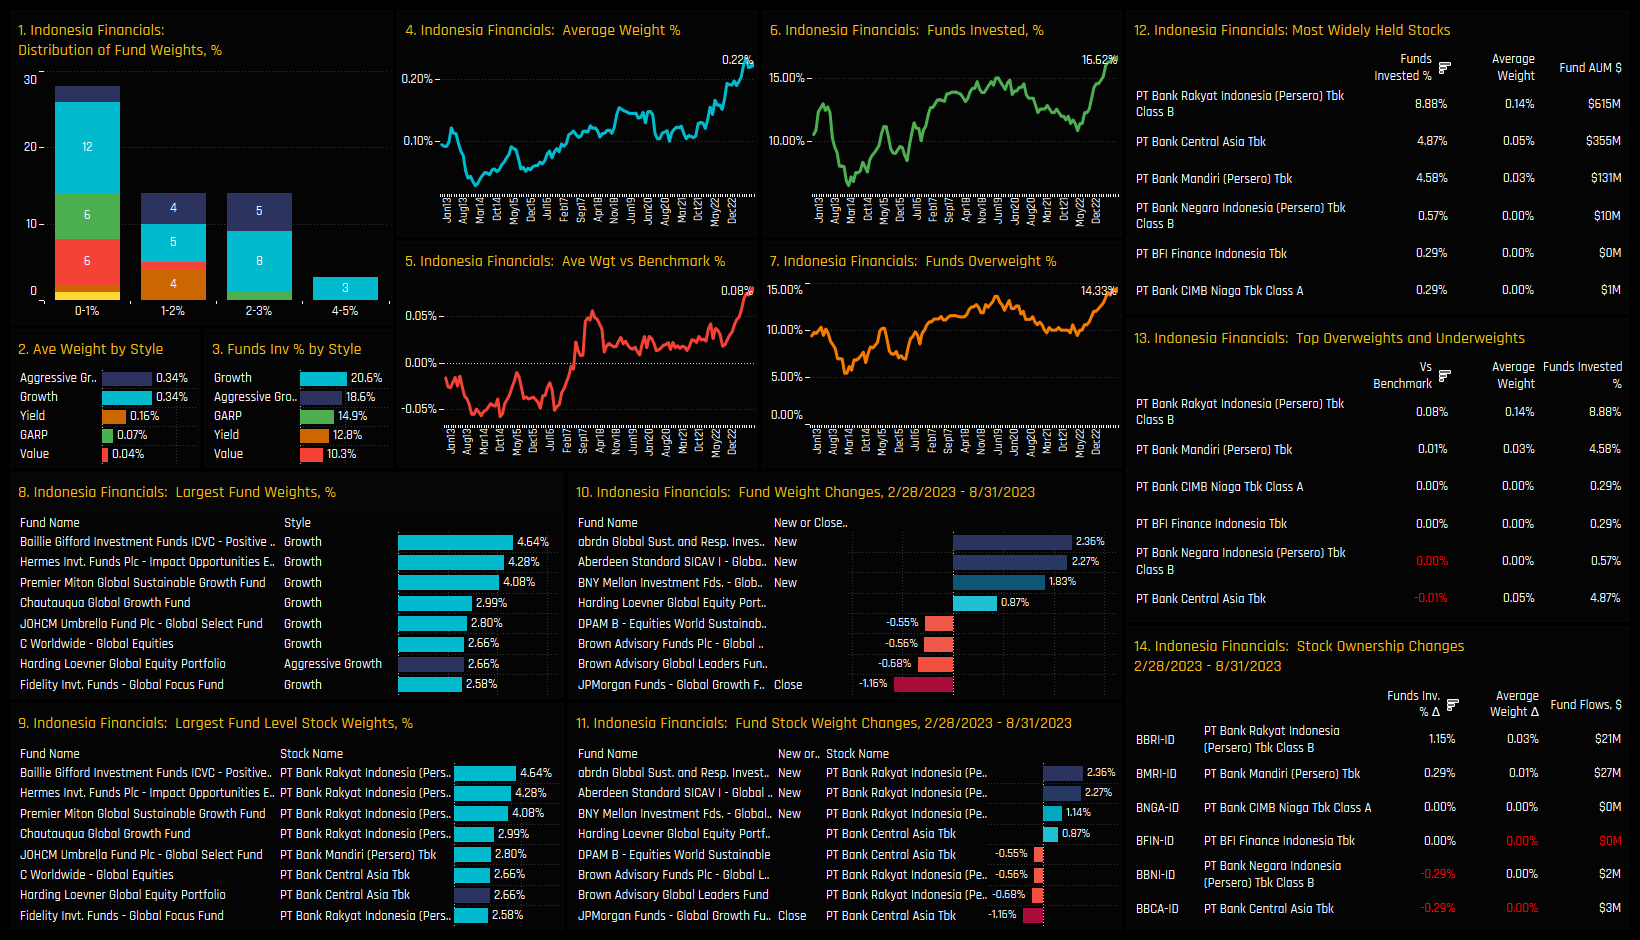
High Positioning & High Momentum: Indonesian Financials
Chart 1. Histogram of fund weights. The bulk of allocations sit below the 1% level, with max allocations between 4% and 5%
Chart 2 & 3. Average weights and the percentage of funds invested in Indonesian Financials by Style. Growth and Aggressive Growth Funds are the key allocators.
Chart 4. The equally weighted average holding weight in Indonesian Financials. The current weight of 0.22% is the highest on record.
Chart 5. The equally weighted average holding weight minus the iShares MSCI ACWI Weight. Active funds are at record overweights, on average.
Chart 6. The percentage of funds invested in Indonesian Financials, again at all-time highs of 16.6%.
Chart 7. The percentage of funds overweight the Indonesian Financials sector.
Chart 8. The largest holders in Indonesian Financials, with Baillie Gifford and Hermes the key allocators.
Chart 9. The largest fund level stock holdings in the Indonesian Financials sector, led by Baillie Gifford and Hermes in PT Bank Rakyat.
Chart 10. The largest weight changes in Indonesian Financials between 02/28/2023 – 08/31/2023.
Chart 11. The largest individual fund level stock weight changes over the same period.
Chart 12. Aggregated Stock Holdings, ranked by the most widely held stocks in the sector. PT Bank Rakyat is the most widely held, owned by 8.9% of funds.
Chart 13. The top overweight and underweight stock holdings in the sector. Overweights led by PT Bank Rakyat, underweights by PT Bank Central Asia.
Chart 14. The largest aggregate changes in stock ownership. PT Bank Rakyat and PT Bank Mandiri saw ownership increase the most. PT Bank Central Asia saw minor decreases.
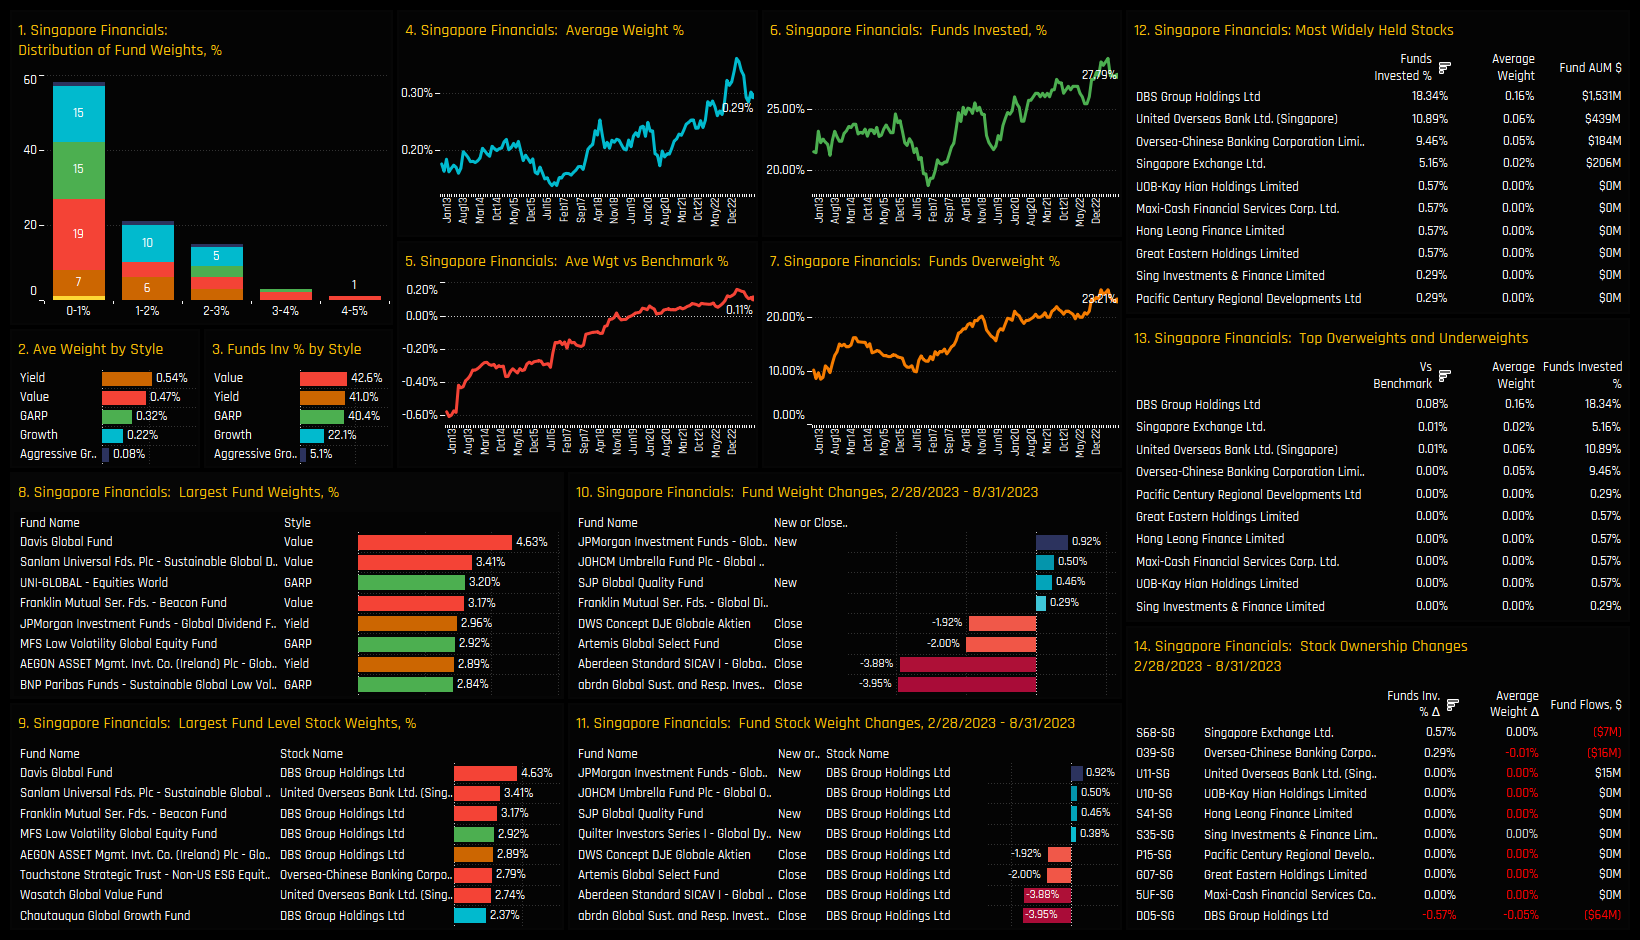
High Positioning & Low Momentum: Singapore Financials
High Positioning & Low Momentum: Japan Information Technology
Low Positioning & Low Momentum: UK Communication Services
Low Positioning & Low Momentum: China & HK Real Estate
Low Positioning & High Momentum: Japan Consumer Staples
Low Positioning & High Momentum: Germany Materials
349 Global Equity Funds, AUM $999bn
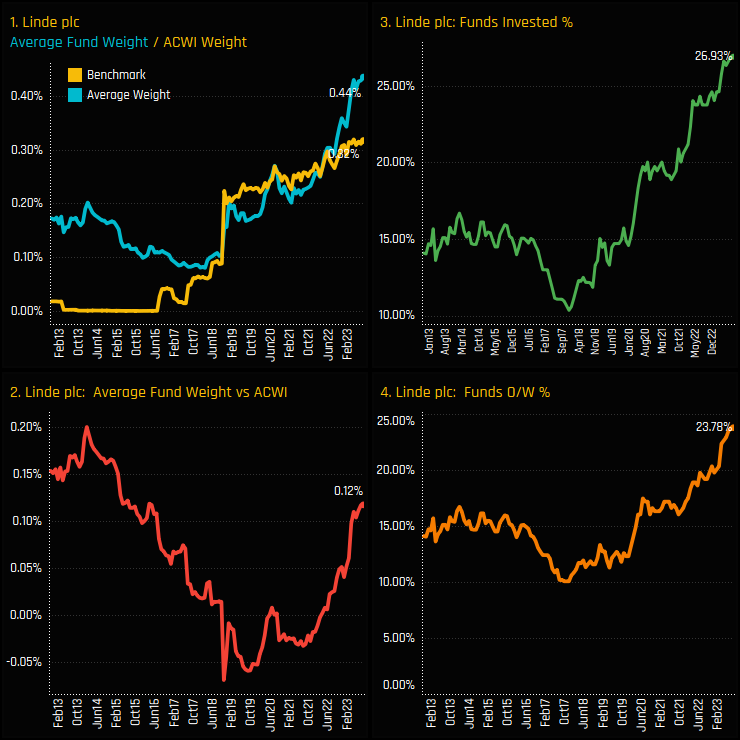
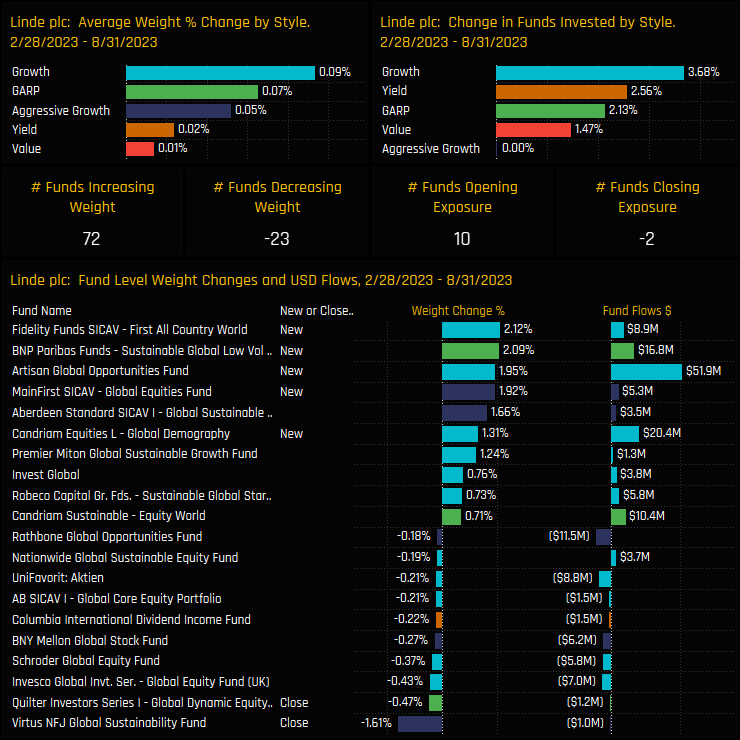
Global Managers Lead a Bullish Charge on Linde plc
• Ownership levels move to all time highs in Linde PLC after significant rotation from Global managers.
• Fidelity, BNP Paribas and Artisan among 10 funds to open new exposure over the last 6-months.
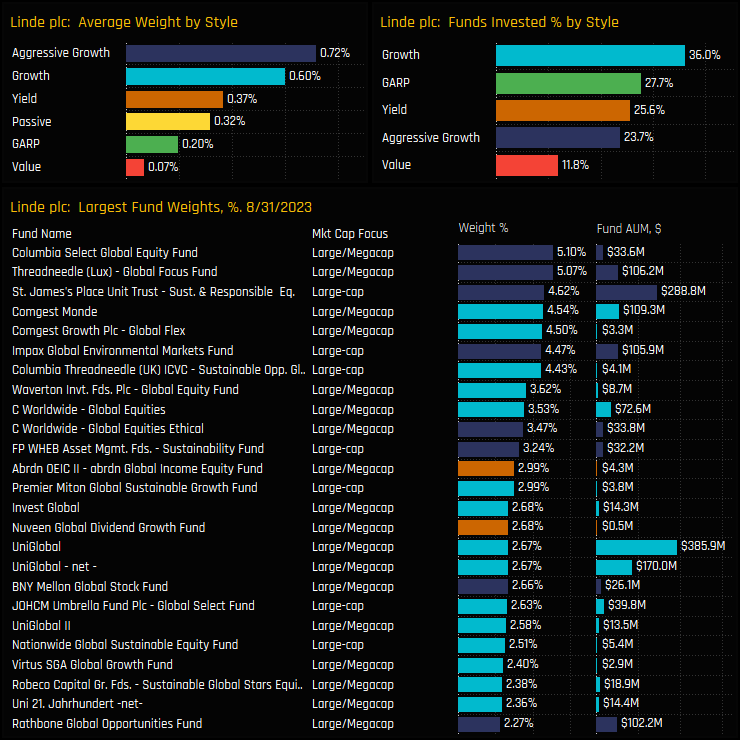
• Growth and Aggressive Growth funds the key allocators, led by Columbia Threadneedle and St James's Place
• Linde PLC is the most widely owned stock and key overweight in the Global Materials sector.
Time Series & Stock Activity
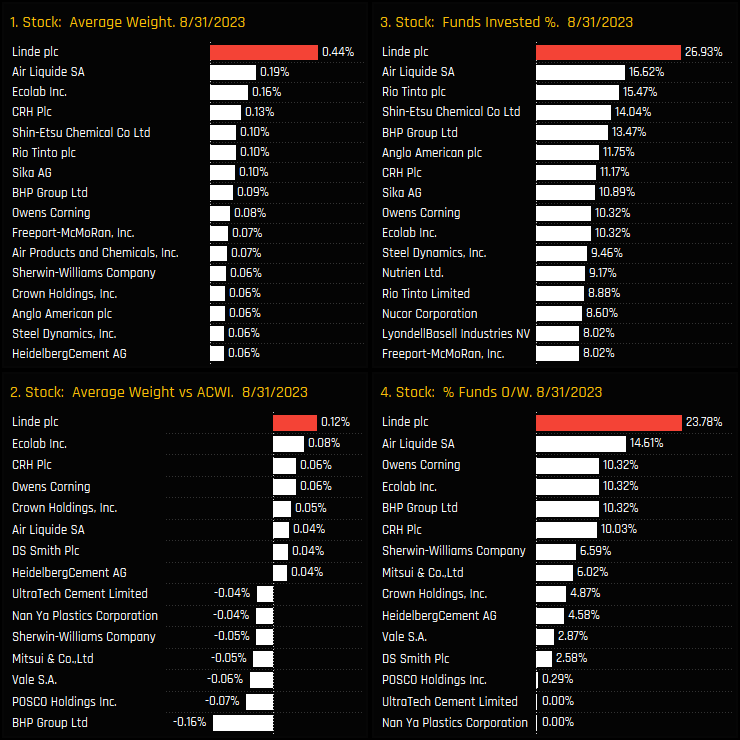
Global Fund exposure in Linde PLC has hit fresh highs again this month. Average holding weights in Linde PLC have broken away from the MSCI ACWI weight in recent months, hitting a new high of 0.44% driven by an increasing number of funds buying in to the UK Gas giant. A record 26.9% of the Global funds in our analysis how hold a position, pushing the net overweight to a 7-year high of +0.12%.
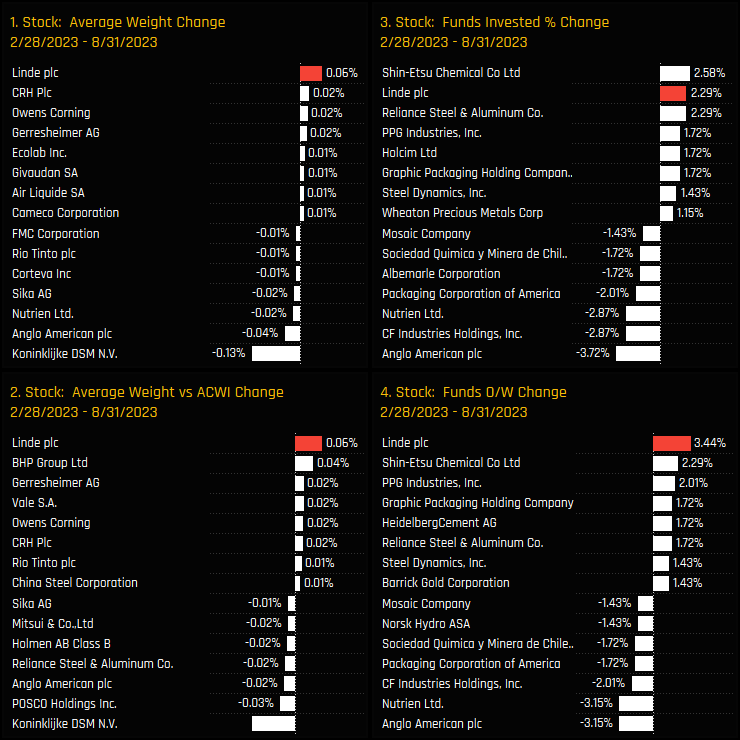
Over the last 6 months, these moves have been among the largest among global Materials sector peers. Linde PLC captured the largest increase in average weight, the largest overweight move and the most funds switching from underweight to overweight. Only Shin-Etsu Chemical saw a larger increase in funds invested. This was most definitely an active rotation.
Fund Activity & Latest Holdings
Driving this rotation were new positions from Fidelity First All Country World (+2.12%), BNP Sustainable Global Low Vol (+2.09%) and Artisan Global Opportunities (+1.95%), among others. Scaled up to a Style level, Growth, Aggressive Growth and GARP saw good increases in exposure, whilst new positions from Deka DividendenStrategie helped push up the Yield averages. Value funds were less a part of the rotation.
In fact, only 11.8% of Value funds have actually invested in Linde PLC so far. While Aggressive Growth funds are less commonly invested in Linde compared to Growth , the ones that do invest tend to do so in greater size. Columbia Select Global Equity and Threadneedle Global Focus lead the Aggressive Growth Style group, each allocating more than 5% to the stock as of the end of last month.
Conclusions & Data Report
This year’s further rotation has only served to cement Linde PLC as the most favoured stock in the Global Materials sector by some distance. The chart set opposite shows Copley’s ownership statistics for companies in the Materials sector. Linde PLC tops the list across all 4 metrics by some distance.
Record positioning, continued rotation and a star in its sector. Active global managers really like this one.
Click below for an extended data report on Global fund ownership in Linde PLC.
For a more detailed look at positioning among the Global funds in our analysis, click on the link below for the latest edition of the Global Active Funds Ownership Report
For more analysis, data or information on active investor positioning in your market, please get in touch with me on steven.holden@copleyfundresearch.com
Investor Positioning Report — Copley Fund Research Ltd · Last updated: July 2026 · Registered in England and Wales
1. Who we are
Copley Fund Research Ltd provides proprietary institutional fund intelligence to listed companies and investor relations professionals. These terms govern every purchase of an Investor Positioning Report. By completing a purchase you confirm you have read, understood, and agreed to these terms in full.
2. What you are purchasing
The Investor Positioning Report is a bespoke PDF report mapping the institutional fund universe around your stock. It covers current investors, past investors, competitor investors, and white space investors. Every report is built from scratch for the specific company ordered and is not a standardised or templated product.
3. Delivery and process
Following payment or invoice issuance, Copley Fund Research will contact you within one working day to agree your competitor set. Production begins once the competitor set is confirmed in writing. The completed report will be released to you within 48 hours of production starting, provided payment has been received in full; where payment is outstanding, the report will be withheld until payment clears. If the requested company falls outside our covered fund universes, or a competitor set cannot be agreed, Copley Fund Research will issue a full refund or cancel the outstanding invoice.
4. Competitor set agreement
The competitor set is agreed with you in writing prior to production, and the report is built to that agreed specification. Requests to amend the competitor set after delivery, based on a change of preference rather than an error, may be treated as a new order.
5. Refund policy
Because each report is produced individually for your company, orders are non-refundable once production has begun, except as set out in clauses 3 and 5a below. By purchasing, you agree not to dispute the charge with your card provider on the basis that the service was not as described, provided the report has been delivered to the agreed specification or corrected under clause 5a.
5a. Quality remedy
If a delivered report contains a material error caused by Copley Fund Research — for example, an incorrect company analysed, a competitor omitted from the agreed set, or content missing from the specification in clause 2 — Copley Fund Research will correct and redeliver the report at no additional charge, within a reasonable timeframe. This is your sole remedy for such errors.
6. Data and accuracy
All fund positioning data in the report reflects holdings as disclosed at the most recently available reporting date at the time of compilation. The timing of fund holdings disclosures is determined by regulatory requirements applicable to each fund and is outside the control of Copley Fund Research Ltd. This data may not reflect current fund positions. Copley Fund Research takes reasonable care to ensure accuracy but makes no warranty, express or implied, as to the completeness or current accuracy of the underlying data — though this does not affect the quality remedy in clause 5a for errors in how that data was analysed or presented. Past fund positioning is not indicative of future fund behaviour or investment decisions.
7. Not investment advice
The Investor Positioning Report is produced for investor relations intelligence purposes only. It does not constitute investment advice, financial advice, or a recommendation to buy, hold, or sell any security. The data reflects historical fund positioning and must not be relied upon as a prediction of future fund behaviour or investment decisions. Copley Fund Research Ltd is not authorised or regulated by the Financial Conduct Authority for the provision of investment advice.
8. Permitted use and confidentiality
The report is licensed for internal use by the purchasing organisation only. You may share it with employees and directors of your organisation. You may not: reproduce, redistribute, publish, or resell the report or any part of it; share it with any third party outside your organisation without prior written consent; use the fund or portfolio manager names contained in the report to approach those individuals on behalf of Copley Fund Research or in a manner that could damage Copley Fund Research's relationships with those funds; or use the data for any purpose other than your own investor relations strategy. The data, analysis, and methodology contained in the report are the intellectual property of Copley


