Asia Ex-Japan Fund Positioning Analysis, August 2023
In this issue:
Philippines: Emerging Signs of Investment Recovery
Asia Ex-Japan Funds Country/Sector Radar
China & HK. Six Stocks Hit Peak Ownership
104 Asia Ex-Japan Funds, AUM $66bn
Philippines: Emerging Signs of Investment Recovery
• Philippines fund ownership shows signs of life after decade long bear market
• All measures of fund ownership increase over the last 6-months
• Asia Ex-Japan funds buy in to BDO Unibank, Bank of the Philippine Islands and Jolibee Foods Corp.
• Despite this, The Philippines remains a zero allocation for 50% of the funds in our analysis.
Time Series & Country Activity
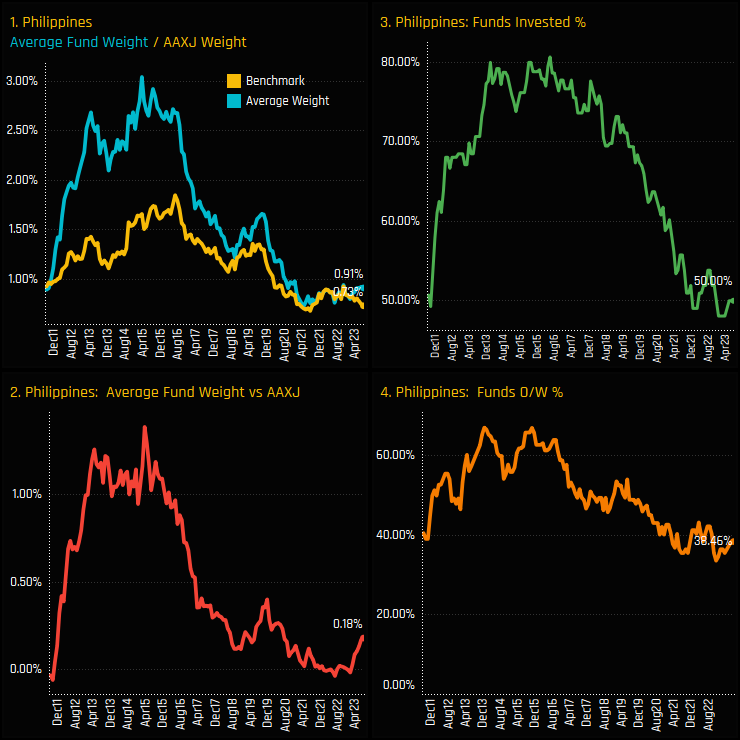
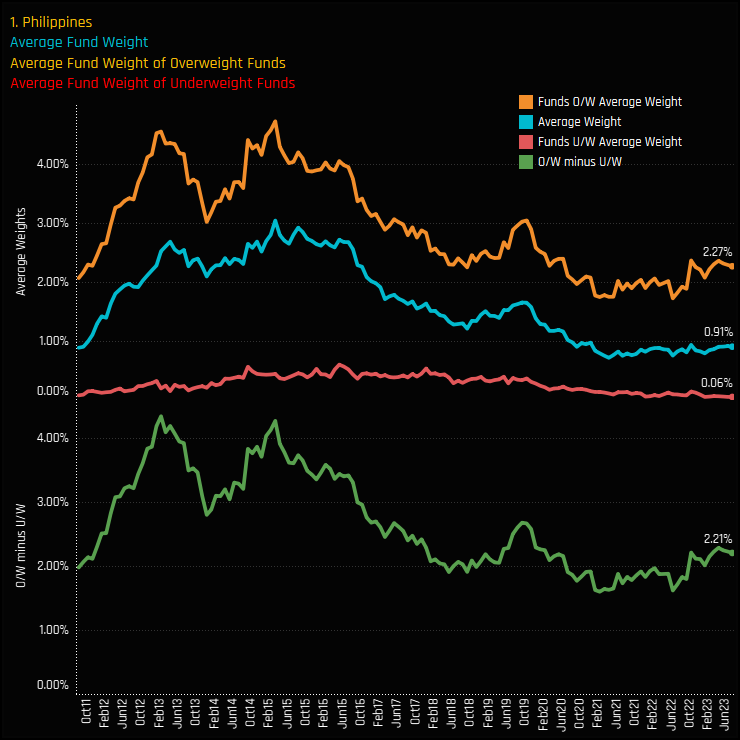
There are tentative signs that Asia Ex-Japan investors are starting to reconsider the Philippines investment case. Exposure among the 104 active funds in our analysis has been in decline over the last decade, with the percentage of funds falling from over 80% in 2016 to just 50% today (ch3). In tandem, average weights have fallen (ch1) as well as a significant overweight decline from over 1% to near flat at the end of 2022 (ch2). More recently though, the charts are showing small signs of a reversal.
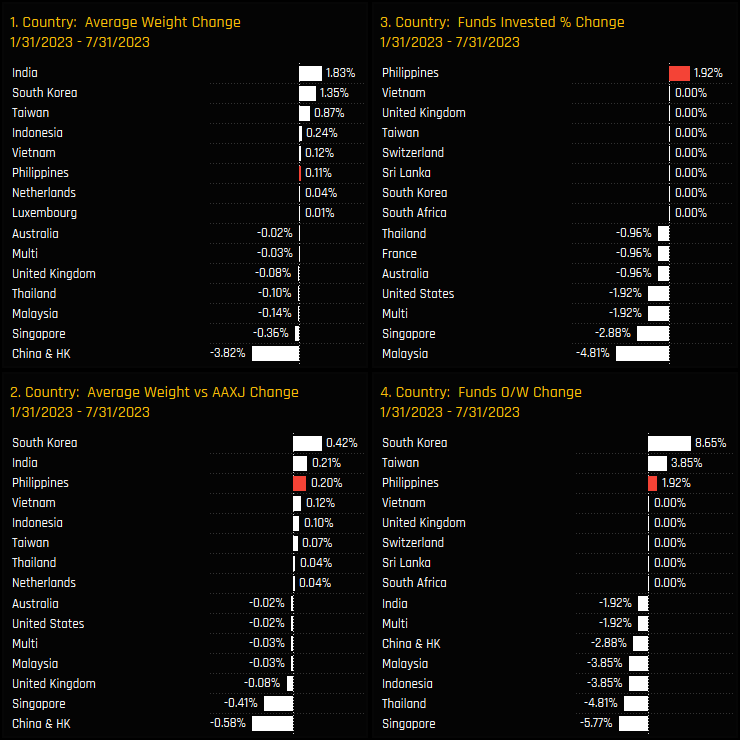
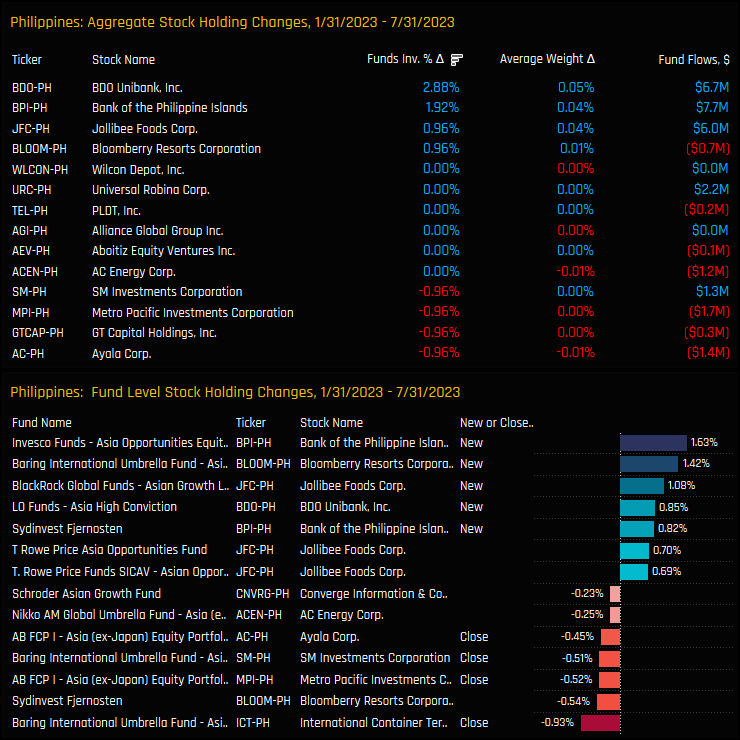
We can see this more clearly in the charts below, which measure changes in Country exposure between 01/31/2023 and 07/31/2023. The Philippines saw +1.92% of funds open new exposure (ch3), +1.92% switch to overweight (ch4), with average weights (ch1) and relative weights (ch2) moving higher in unison. These are not particularly aggressive moves and by no means come close to reversing the declines of the last decade, but they do signify a reversal in sentiment.
Country Positioning & Sentiment
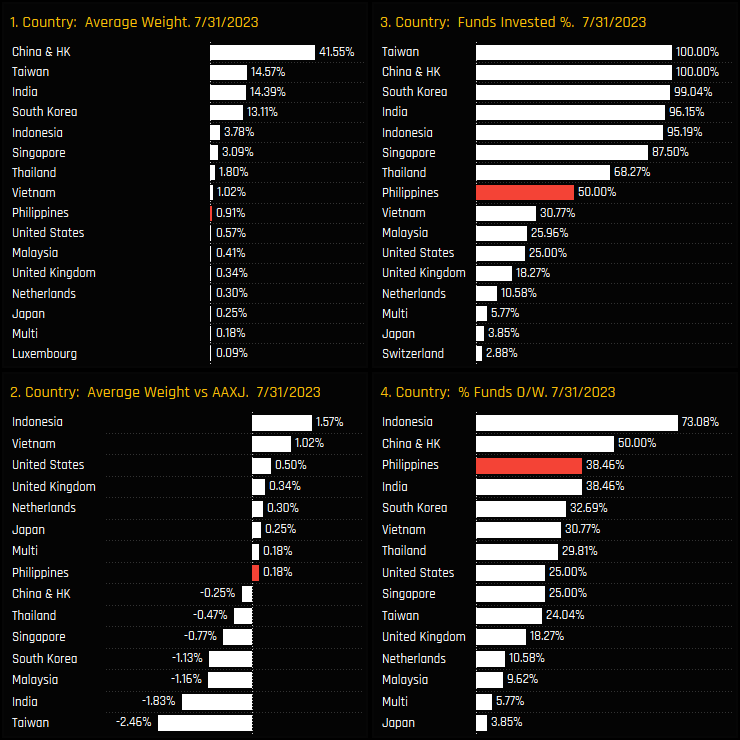
Current levels of positioning in The Philippines place it well down the pecking order of Country exposures in the Asia Ex-Japan region. It is the 8th most widely held country and the 9th largest on an average holding weight basis. The minor overweight of 0.18% should be viewed positively, with only 2 other countries (China and Indonesia) having more funds positioned overweight the benchmark. Most of the funds who have exposure to the Philippines do so with an overweight allocation.
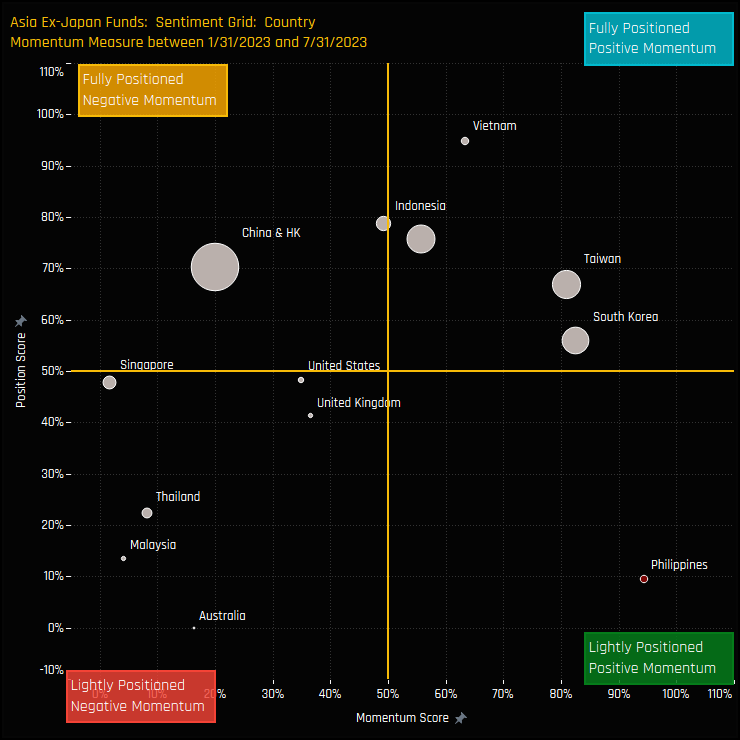
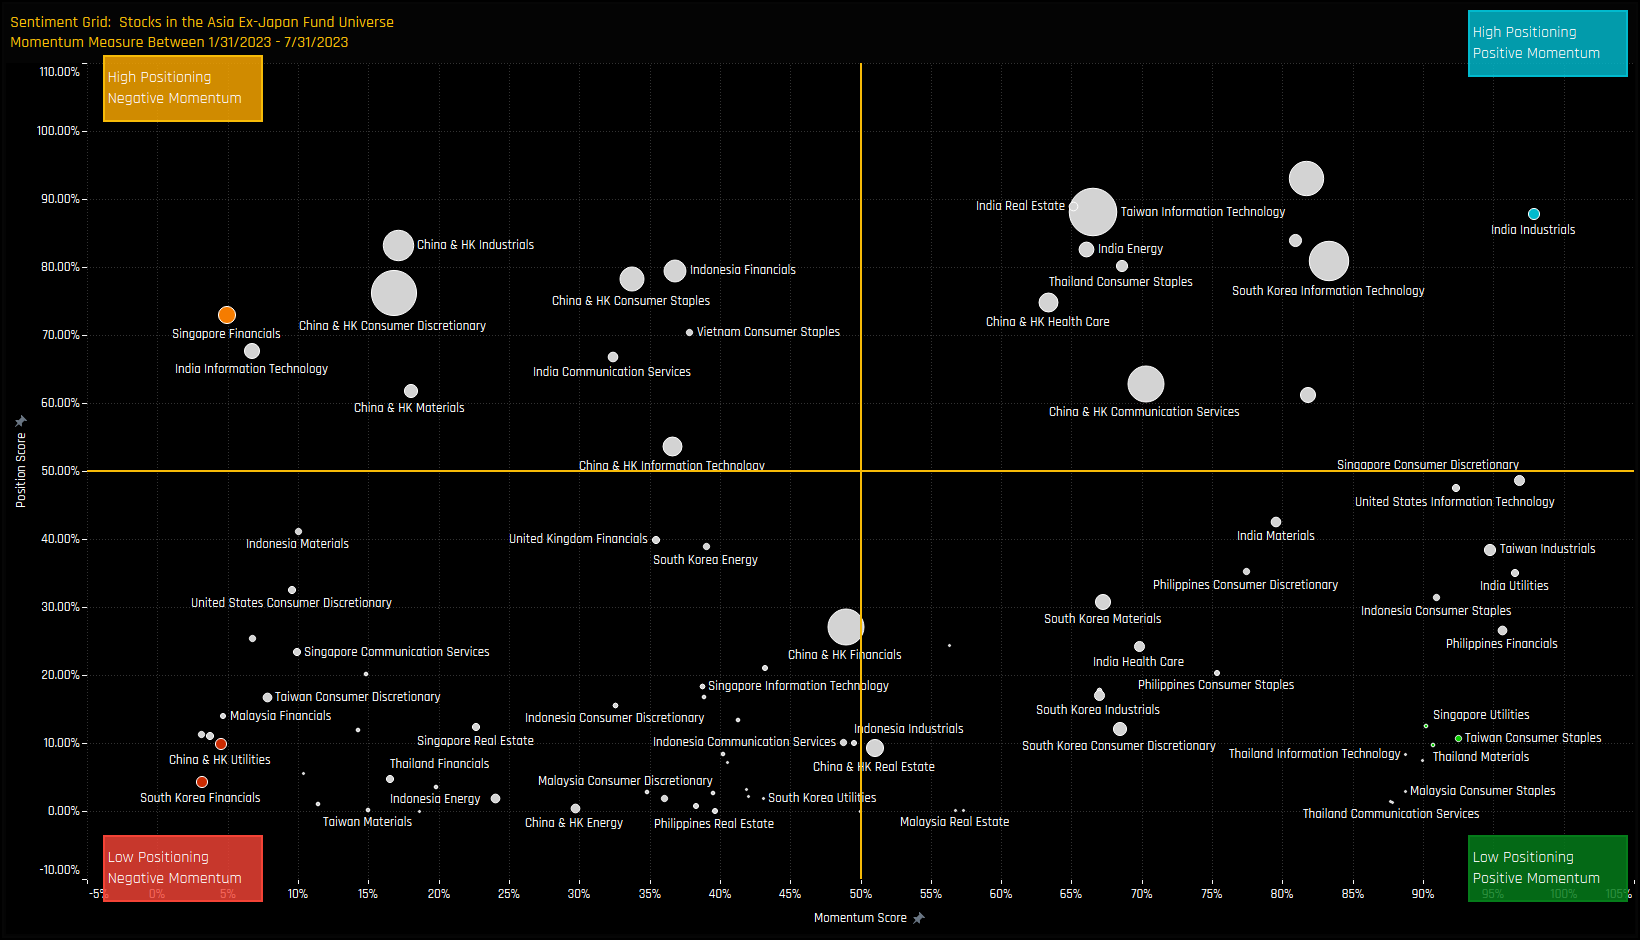
Capturing the relationship between long-term positioning and short term fund activity is the Sentiment Grid below. The Y-axis shows the ‘Position Score’, a measure of current positioning in each country compared to its own history going back to 2011 on a scale of 0-100%. The X-Axis shows the ‘Momentum Score’, a measure of fund manager activity for each country between 1/31/2023 and 07/31/2023 on a scale of 0% (maximum negative activity) to 100% (maximum positive activity). The Philippines position in the bottom right highlights the depressed levels of positioning combined with positive fund rotation.
Stock Positioning & Activity
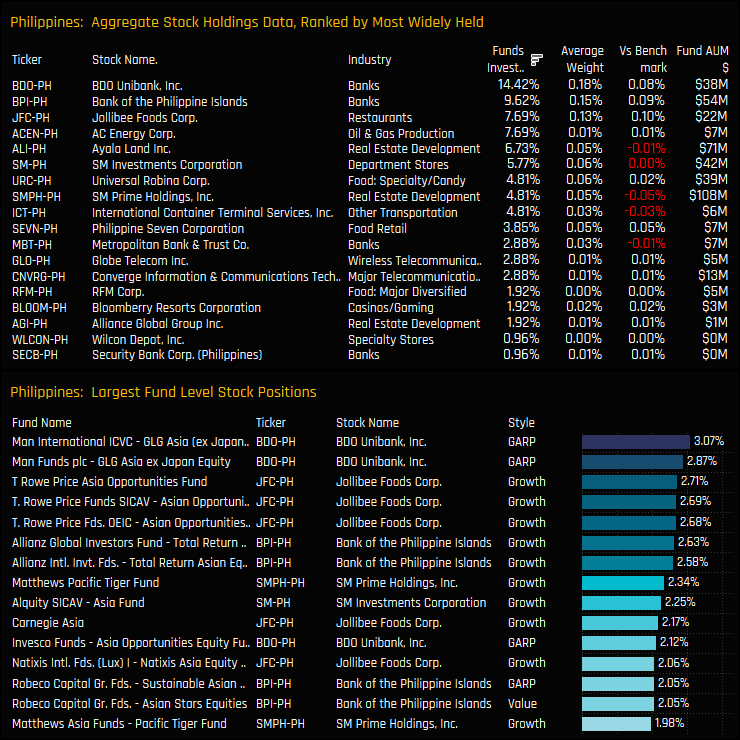
On a stock level, BDO Unibank, Bank of the Philippine Islands and Jollibee Foods Corp are the most widely held and largest holding weights. Combined, these 3 companies account for just over 50% of the total Philippines allocation. They also account for 12 of the largest 15 individual fund level positions, led by Man GLG in BDO Unibank (3.07%) and T Rowe Price in Jollibee Foods Corp (2.71%).
Indeed, the positive rotation in to the Philippines this year has been underpinned by ownership increases in these 3 companies. BDO Unibank led the way with the percentage of funds invested rising by +2.88% between 01/31/2023 and 07/31/2023, followed by Bank of the Philippine Islands (+1.92%) and Jollibee Foods Corp (+0.96%). The larger new positions were in the 1%-2% range and led by Invesco Asia Opportunities’, opening a position of 1.63% in the Bank of the Philippine Islands.
Conclusions & Links
The current set up of Philippines positioning among active Asia Ex-Japan funds is one of the have’s and the have-nots. The chart opposite splits the average holding weight in the Philippines by the 38.5% of funds positioned overweight and the 61.5% who are underweight. Obviously the former will always be greater than the latter, but the chart highlights that the average overweight is increasing and the total average weight is dragged down significantly by funds who are underweight, or who are avoiding Philippines exposure entirely. Not everyone, it seams, is bearish on The Philippines.
All of this points to a definite reason to be more constructive. The downward spiral of reduced allocations and position closure has finally reversed course, albeit in small size for now, whilst current positioning suggests that 38.5% of the funds in our analysis are quite bullish. Perhaps its time for the 50% of funds who are avoiding exposure to reconsider their stance – if that happens, then expect some upward pressure on prices.
Click below for the extended data report on Philippines investor positioning among Asia Ex-Japan funds.
Investment levels among the key country/sectors in the investible Asia Ex-Japan universe differ greatly. Some country/sectors are widely owned, others largely avoided with ownership levels changing every month. We combine current and historical positioning against shorter-term manager activity to get a handle on where sentiment lies for every country/sector in our Asia analysis. We highlight 7 country/sectors at the extreme ends of their own positioning ranges whilst also seeing significant changes in fund ownership.
Country/Sector Sentiment
The Sentiment Grid below is designed to visualize the interplay between current fund positioning, long-term fund positioning and shorter-term fund manager activity for all country/sectors in the Asia Ex-Japan fund active universe. The Y-axis shows the ‘Position Score’, a measure of current positioning in each country/sector compared to its own history going back to 2011 on a scale of 0-100%. It takes in to account the percentage of funds invested in each country/sector versus history, the average fund weight versus history and the percentage of funds overweight the benchmark versus history. The higher the number, the more heavily a country/sector is owned by active Asia Ex-Japan managers compared to its own history.
The X-Axis shows the ‘Momentum Score’, a measure of fund manager activity for each country/sector between 1/31/2023 and 07/31/2023 on a scale of 0% (maximum negative activity) to 100% (maximum positive activity). The Momentum Score takes in to account the change in the percentage of funds invested in each country/sector over the period, the change in average weight and the change in the percentage of funds overweight. The chart also highlights the country/sectors at the extreme ends of each quadrant by colour, which will shall explore in more detail below.
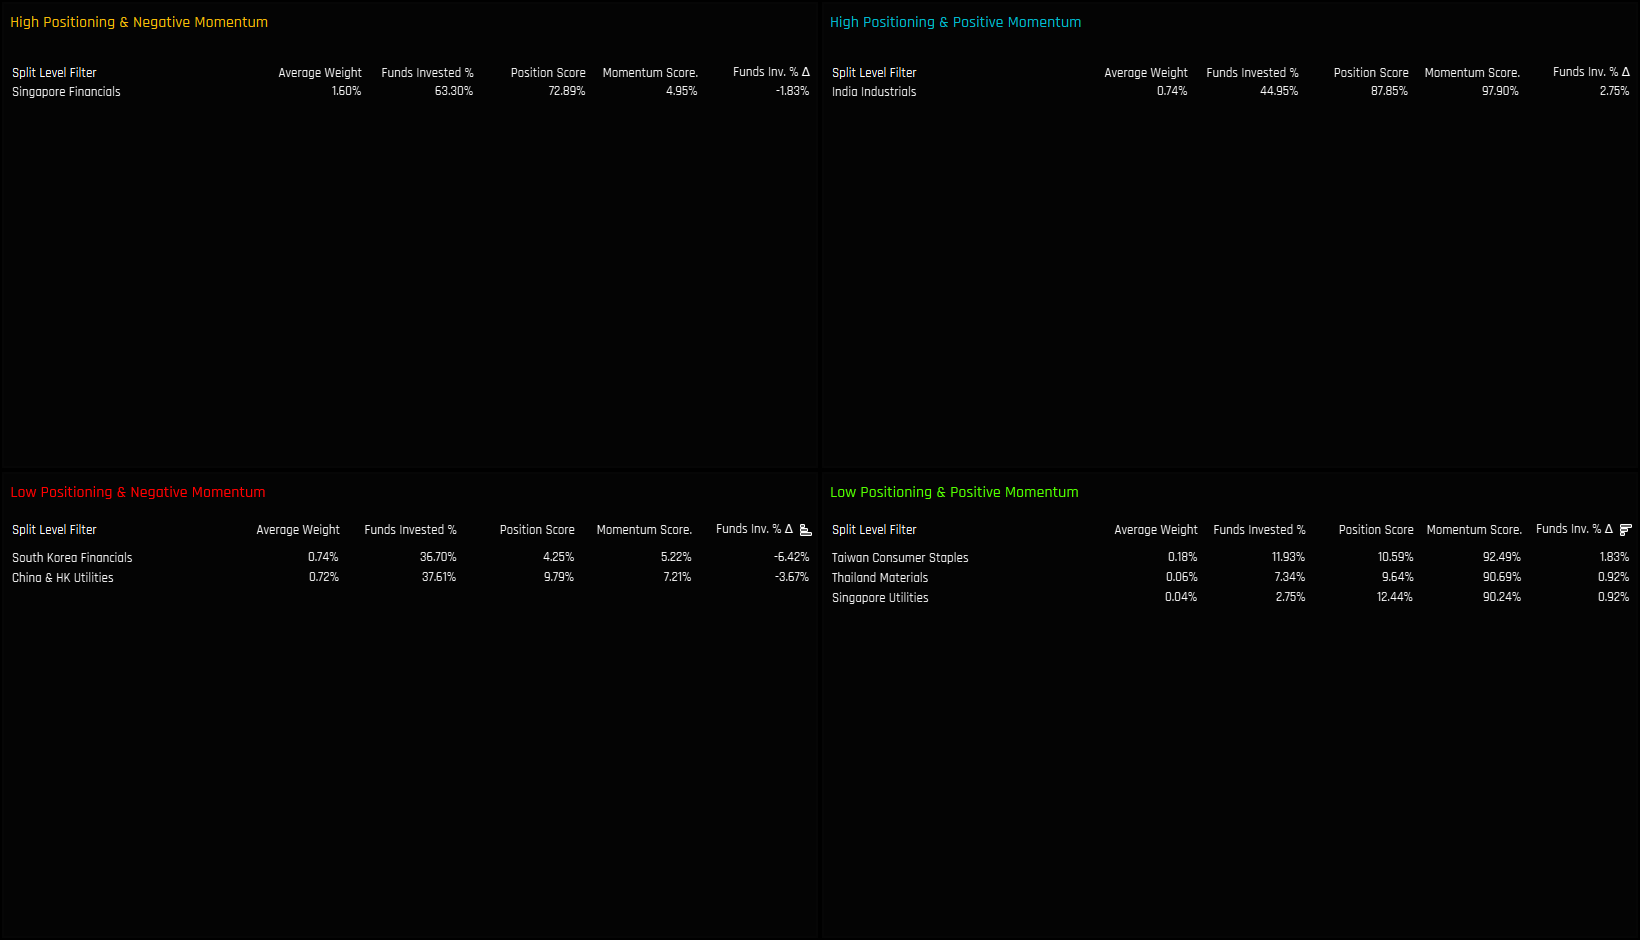
Extreme Country/Sectors
The tables below list the country/sectors in the extreme corners of each quadrant. The screening methodology is as follows:
High Positioning & Negative Momentum: Position Score > 70%. Momentum Score < 5%
High Positioning & Positive Momentum: Position Score > 85%. Momentum Score > 95%
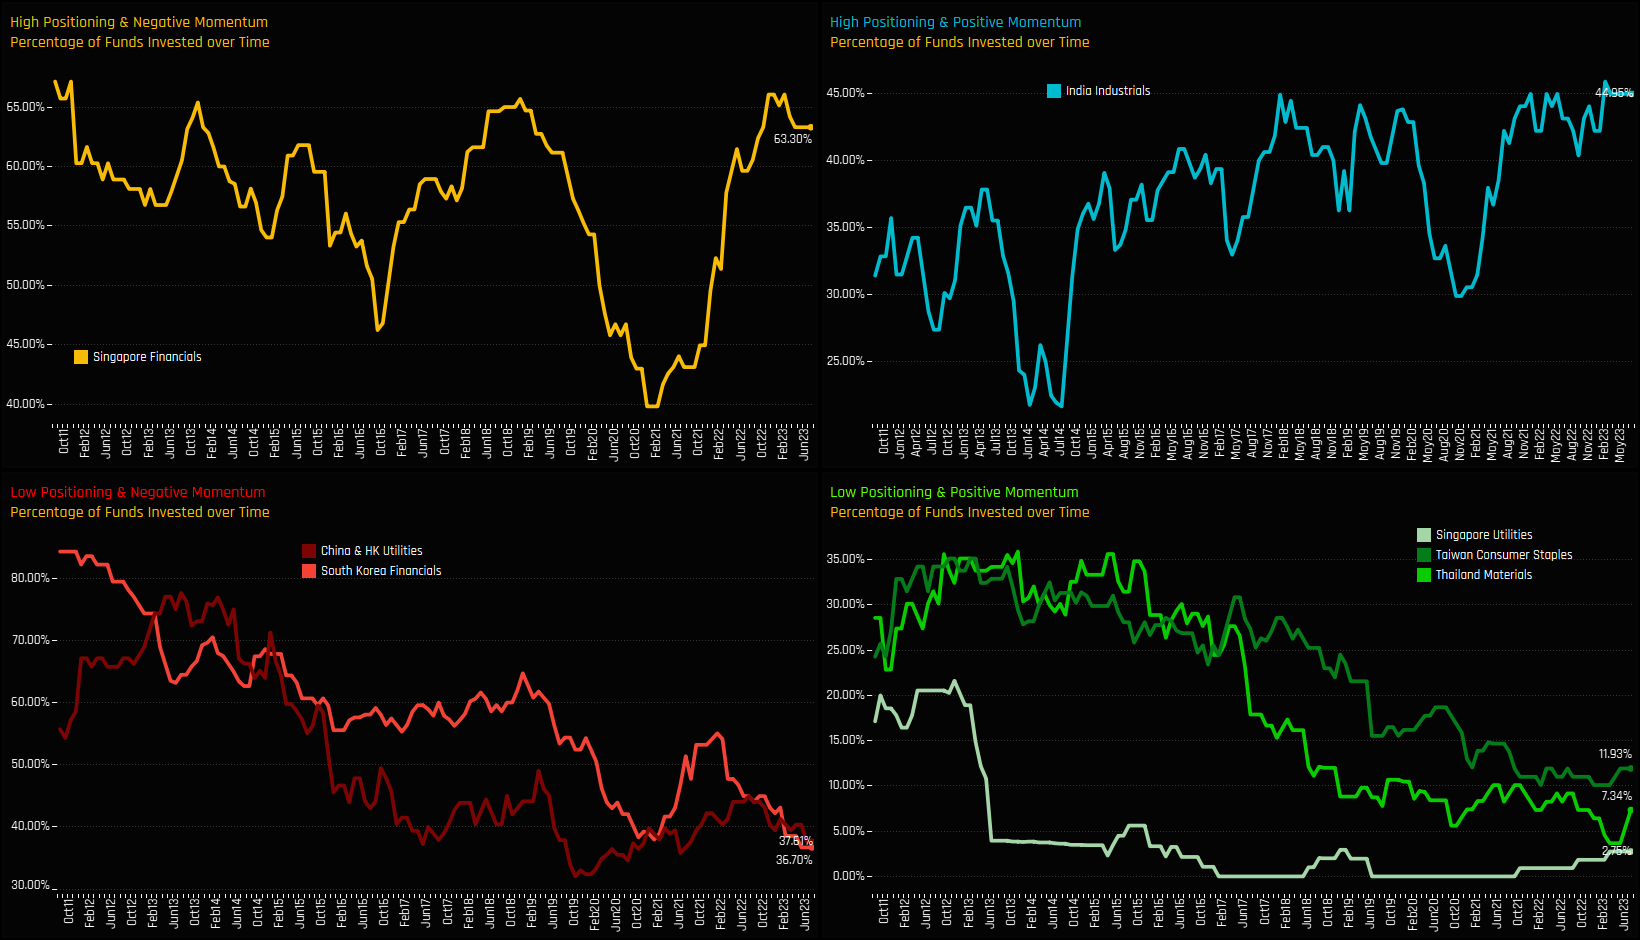
Extreme Country/Sectors
The following charts illustrate the proportion of active funds invested in each of the country/sectors listed above over time. This visualization provides an additional perspective how the Sentiment Grid works. For Singapore Financials in the top left chart, ownership levels have followed a cyclical path, with peaks and troughs occurring every 2-3 years. Perhaps we have reached the peak of the latest cycle. For China & HK Utilities and South Korean Financials (bottom left), ownership levels have been in multi-year declines, with recent selling pushing exposure levels to all-time lows.
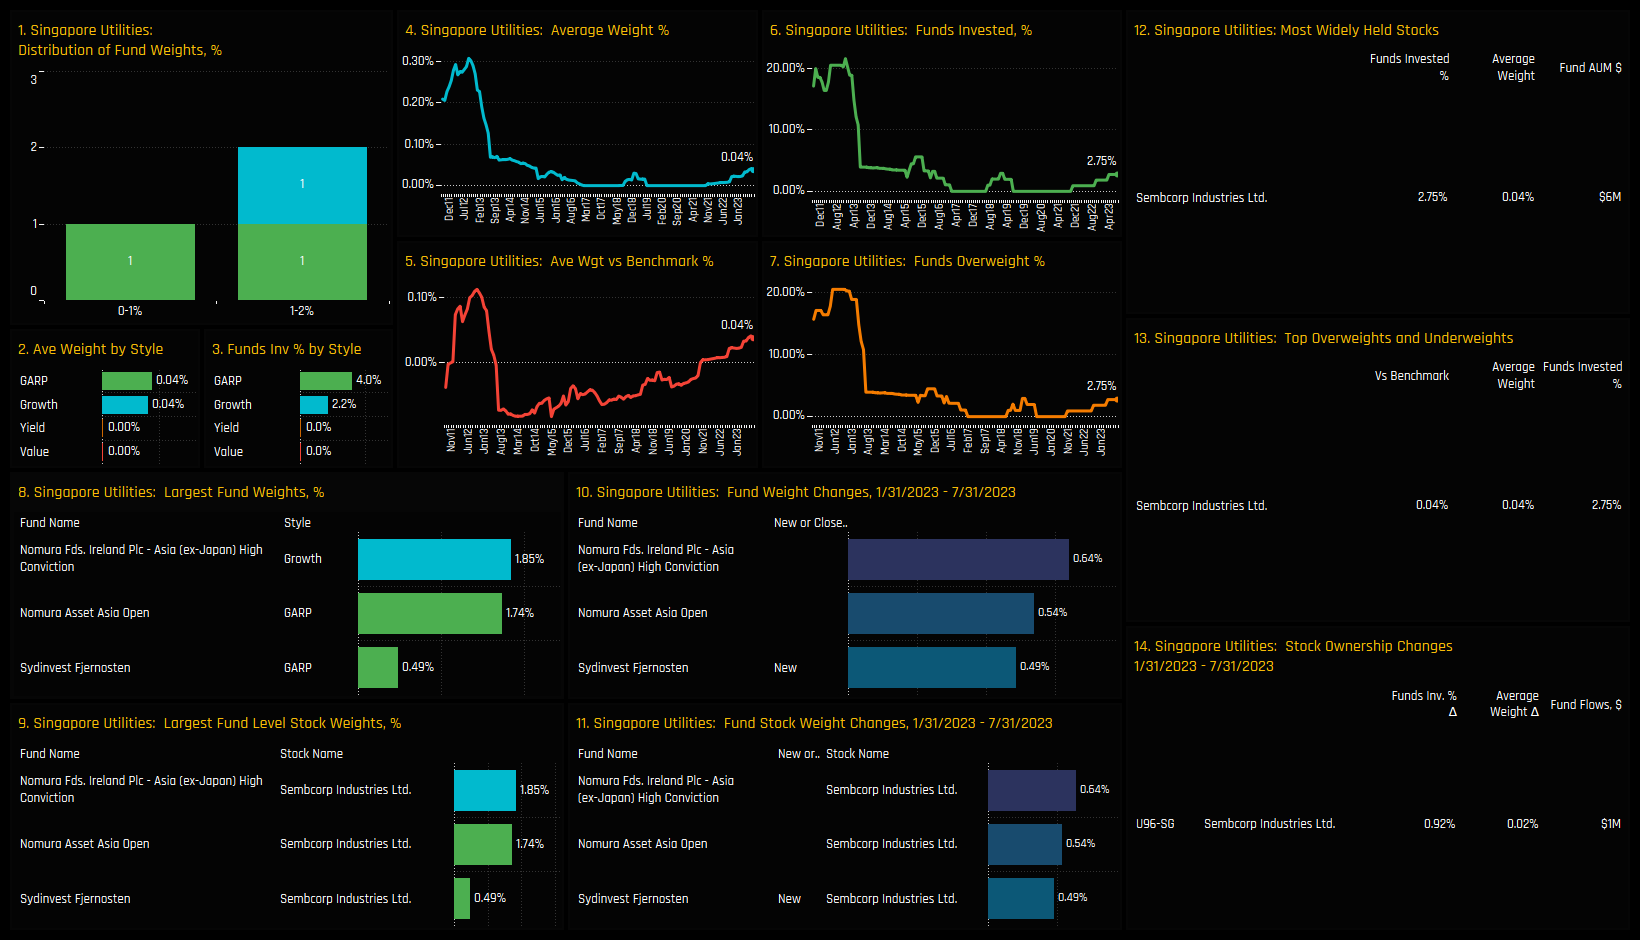
For Indian Industrials, ownership levels are bumping up against at all-time highs after sustained increases in exposure among active Asia Ex-Japan managers since 2020 (top right). Finally, for Singapore Utilities, Taiwan Consumer Staples and Thailand Materials, ownership levels are at historical lows but recent activity has been skewed to the buy side – i.e something in the investment case has changed. Please scroll down for more detailed profiles of each country/sector to understand the funds and stocks behind the country/sector positioning extremes.
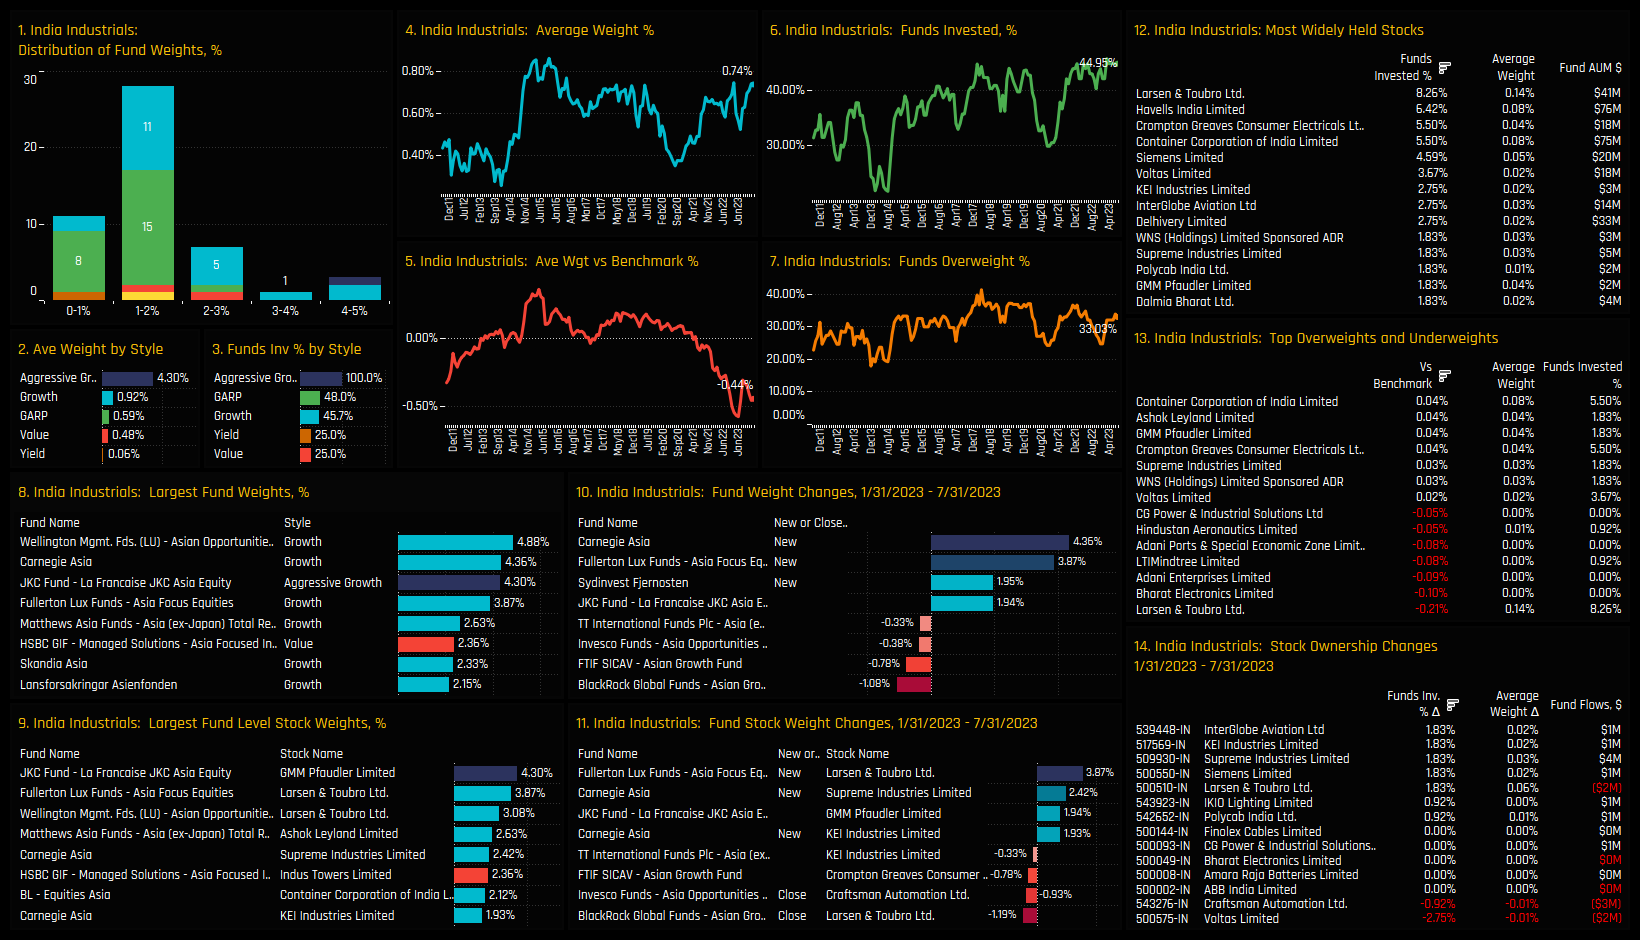
High Positioning & High Momentum: Indian Industrials
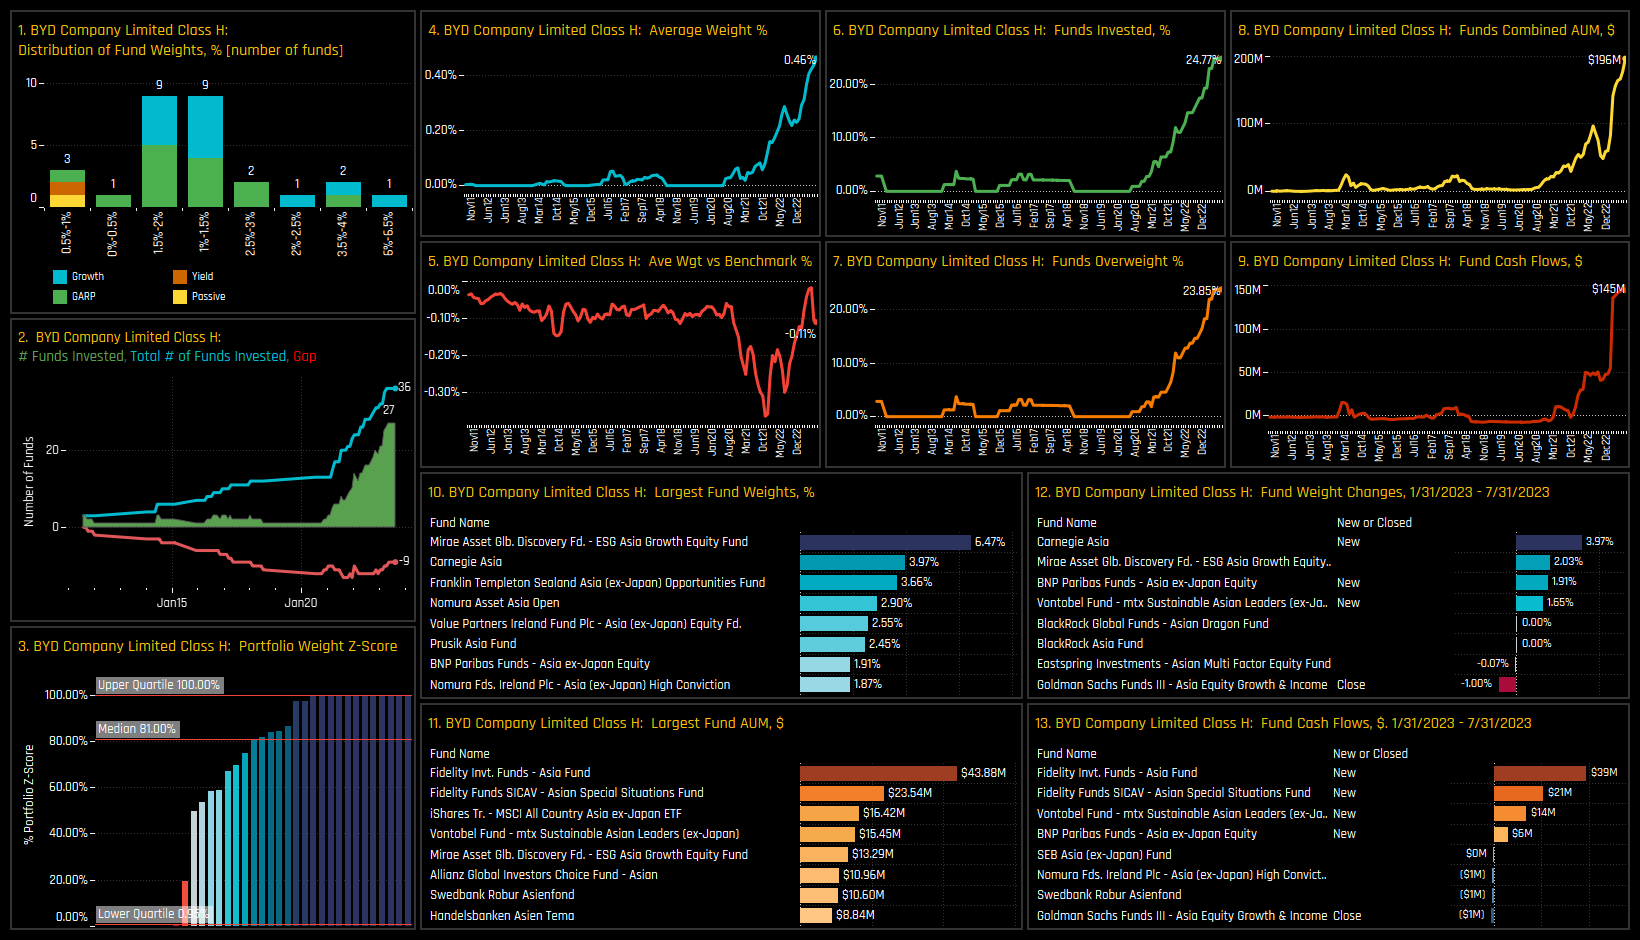
Chart 1. Histogram of fund weights. The bulk of allocations sit below the 3% level, with max allocations between 4-5%.
Chart 2 & 3. Growth funds are the major allocators, with Value and Yield funds largely absent from the investor base for now.
Chart 4. The equally weighted average holding weight in Indian Industrials. The current weight of 0.74% is approaching a 5-year high.
Chart 5. The equally weighted average holding weight minus the iShares MSCI Asia Ex-Japan Weight. Active funds are underweight by -0.44%, on average.
Chart 6. The percentage of funds invested in Indian Industrials, at all-time highs of 44.95%.
Chart 7. The percentage of funds overweight the Indian Industrials sector.
Chart 8. The largest holders in Indian Industrials, with Wellington, Carnegie and JKC the key allocators.
Chart 9. The largest fund level stock holdings in the Indian Industrials sector, led by JKC’s 4.3% position in GMM Pfaudler Ltd.
Chart 10. The largest weight changes in Indian Industrials between 01/31/2023 – 07/31/2023. Carnegie’s opening position of 4.36% is the standout move.
Chart 11. The largest individual fund level stock weight changes over the same period. Fullerton’s 3.87% opening position in Larsen & Toubro was the largest opening position.
Chart 12. Aggregated Stock Holdings, ranked by the most widely held stocks in the sector. Larsen & Toubro is the most widely held, owned by 8.26% of Asia Ex-Japan fund managers.
Chart 13. The top overweight and underweight stock holdings in the sector. Overweights led by Container Corp of India, underweights by Larsen & Toubro.
Chart 14. The largest aggregate changes in stock ownership. Indian Industrials surge driven by increases in InterGlobe Aviation, KEI Industries and Supreme Industries.
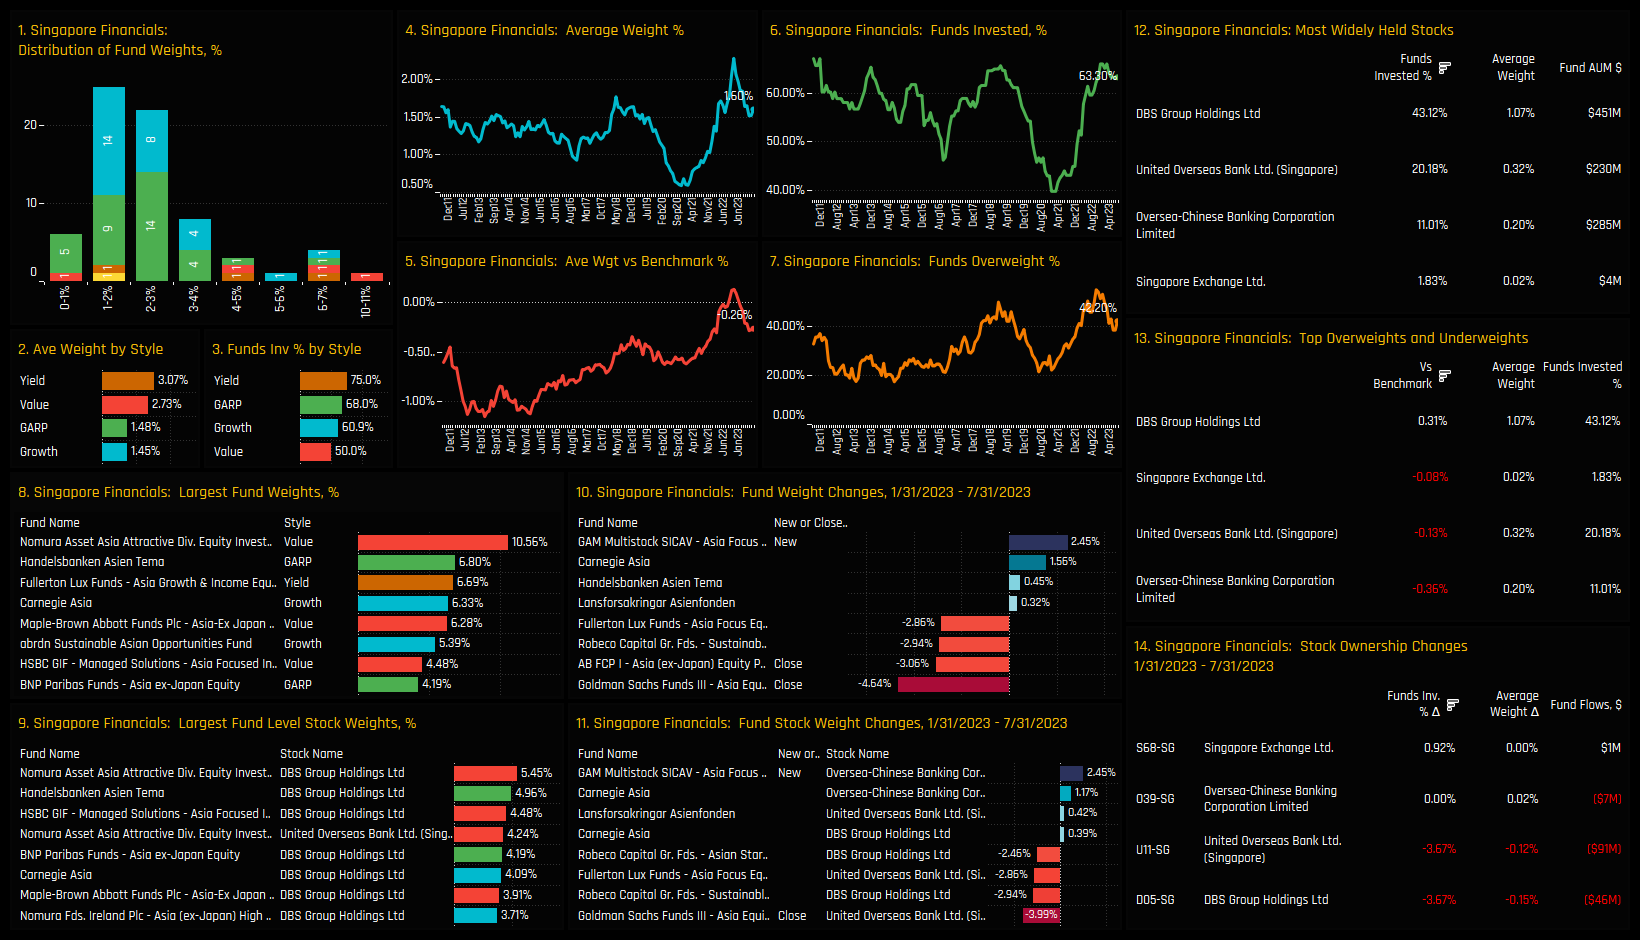
High Positioning & Low Momentum: Singapore Financials
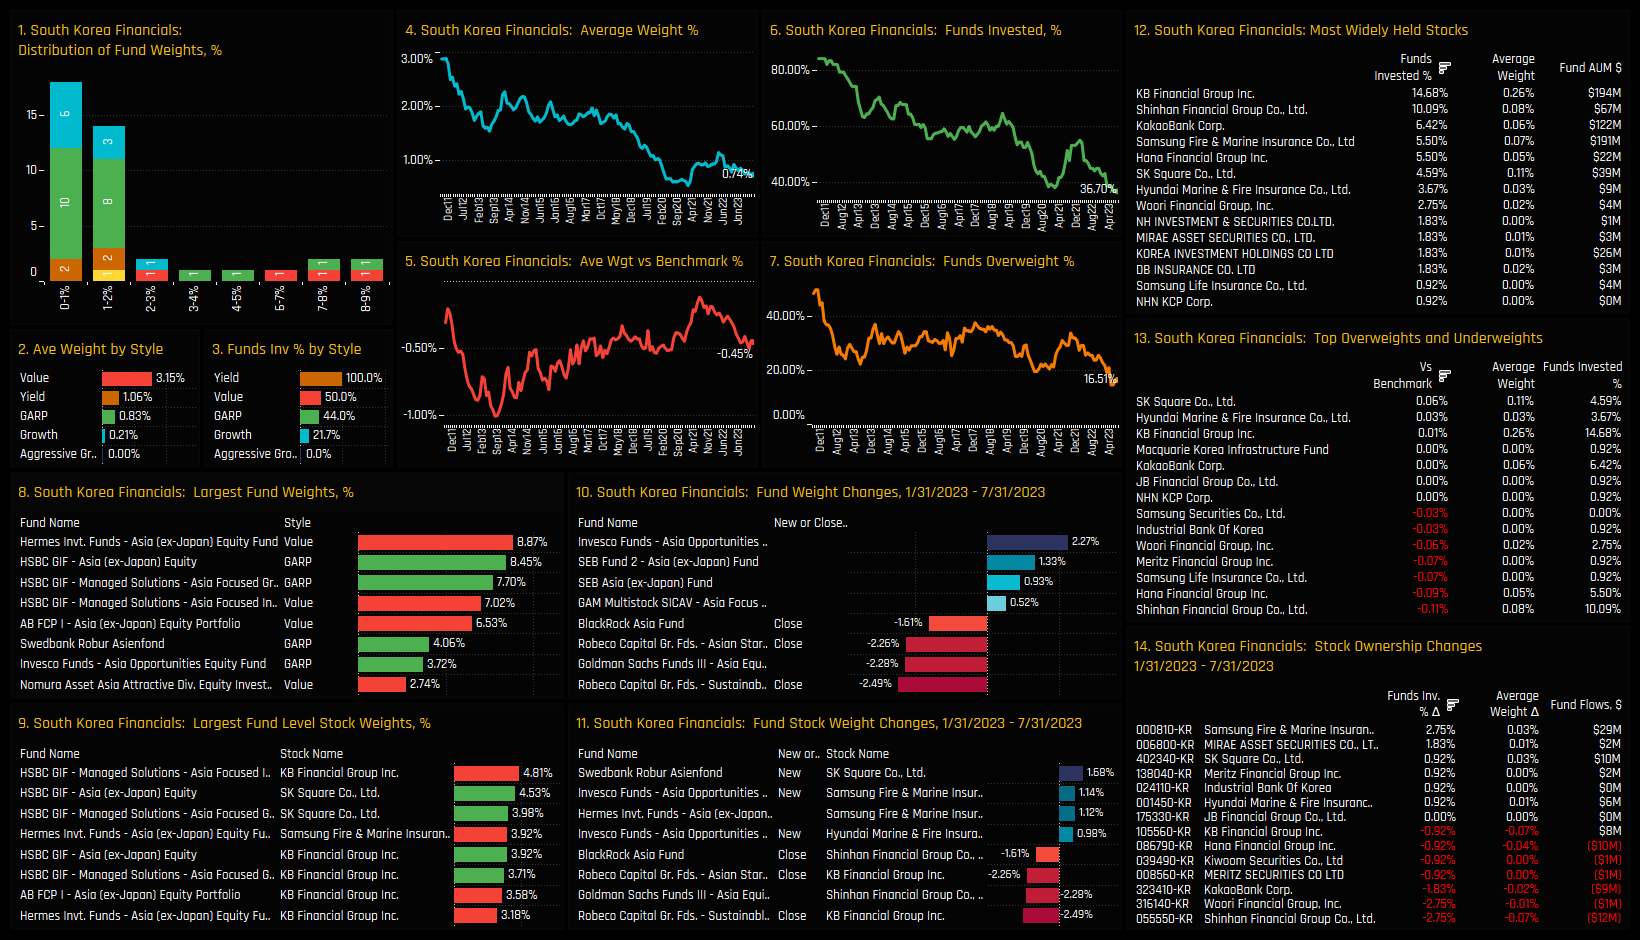
Low Positioning & Low Momentum: South Korean Financials
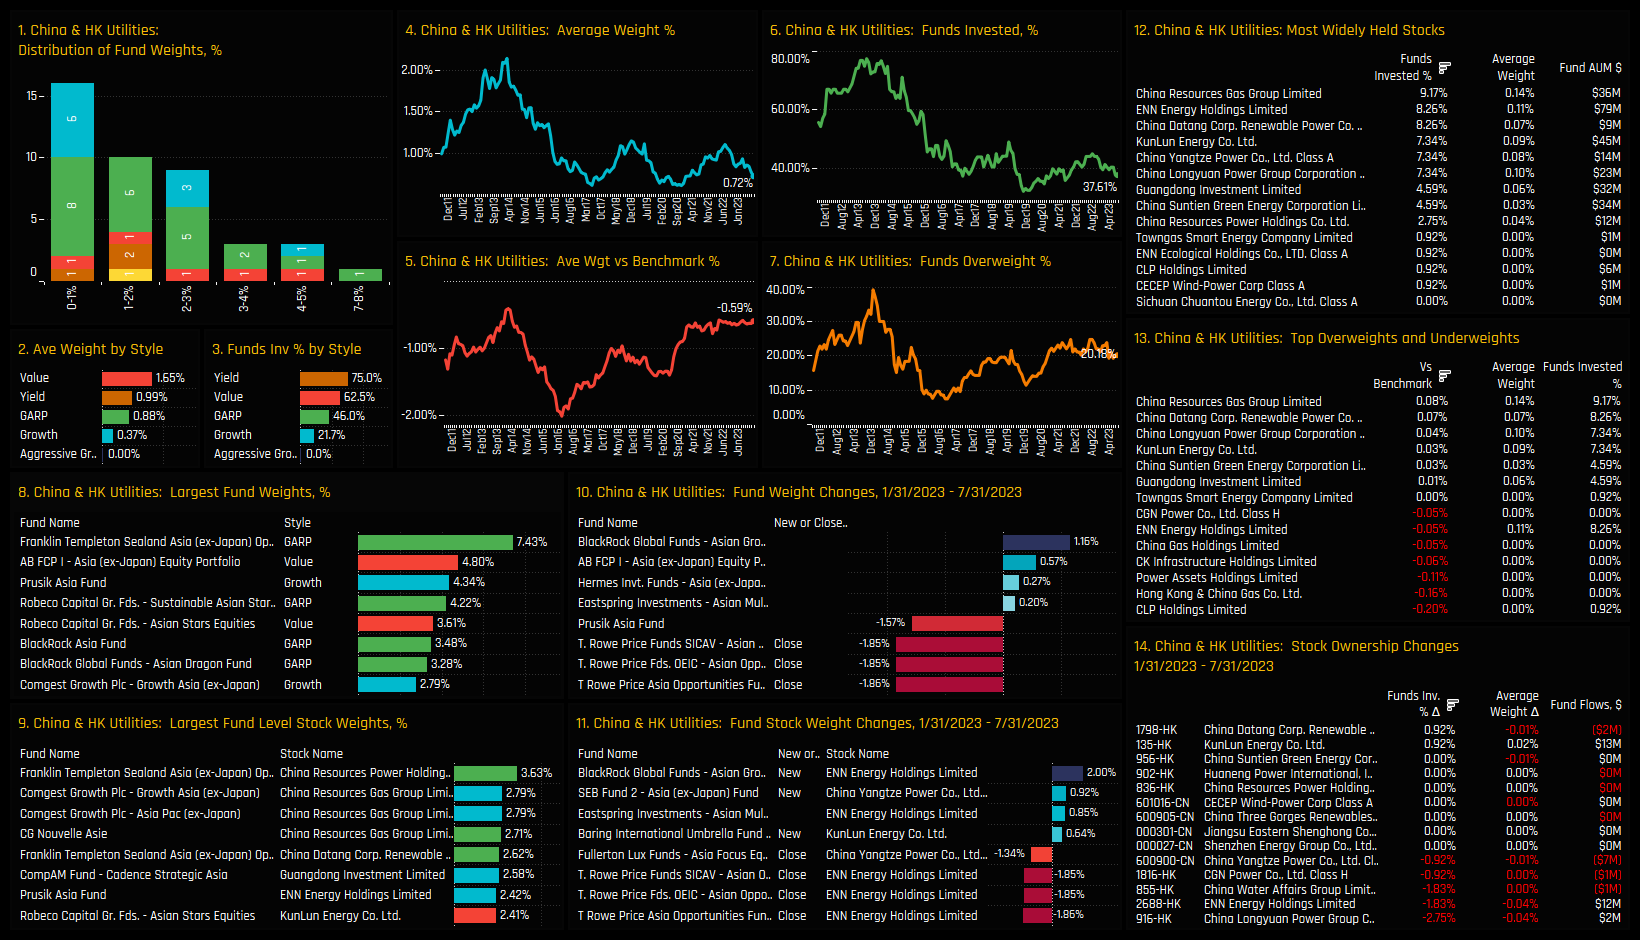
Low Positioning & Low Momentum: China & HK Utilities
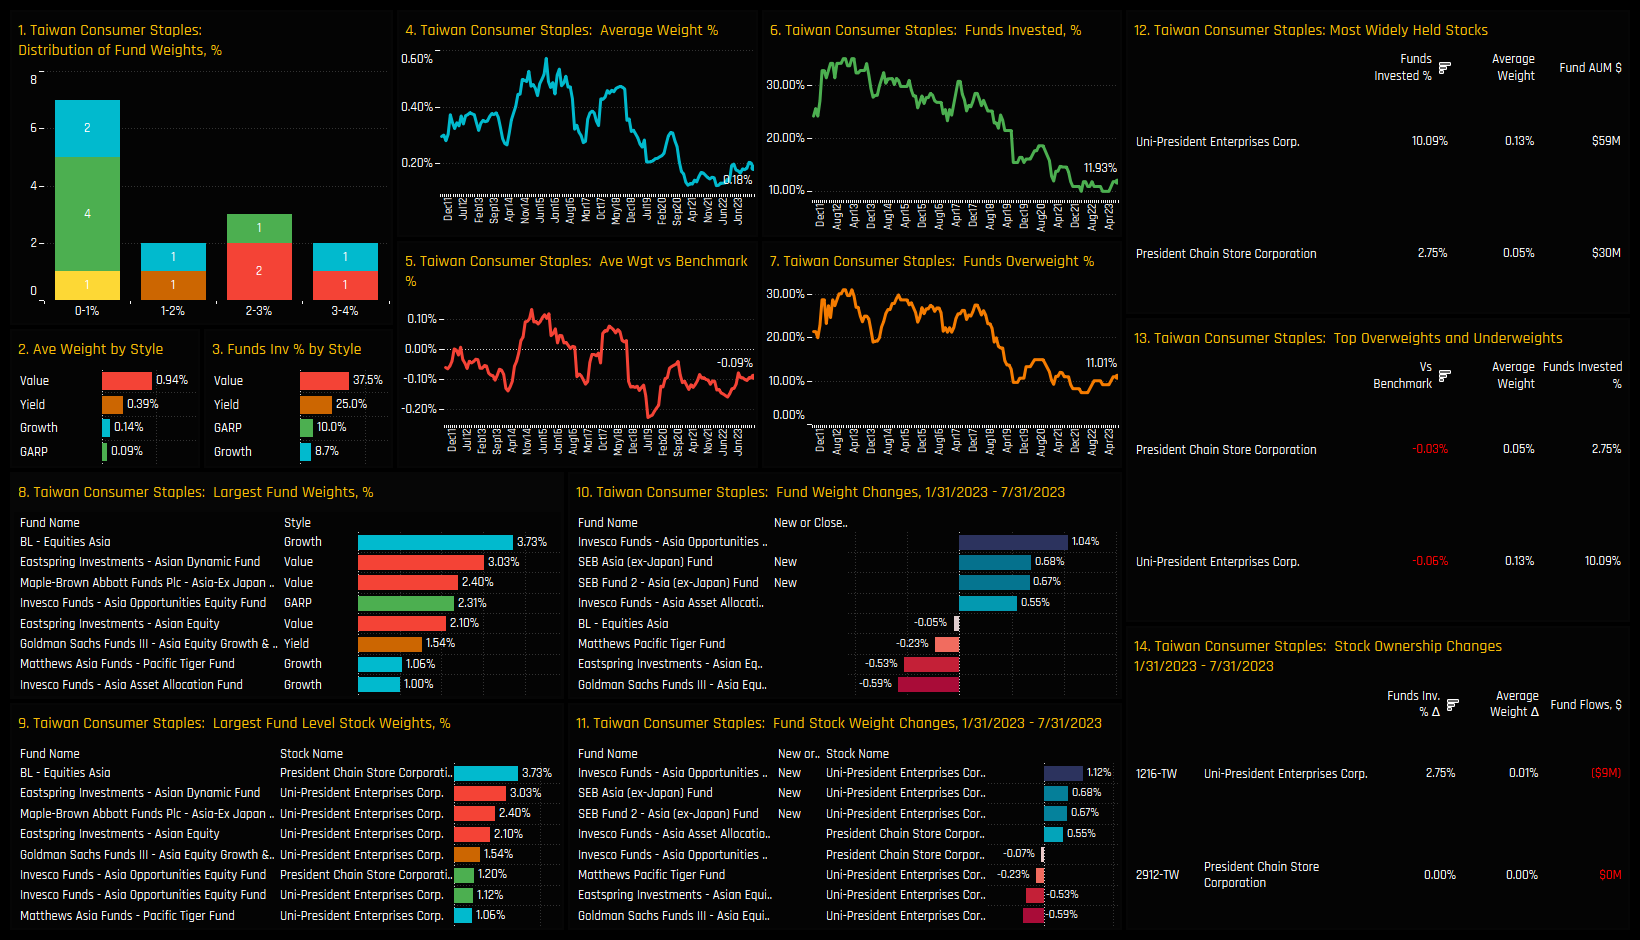
Low Positioning & High Momentum: Taiwan Consumer Staples
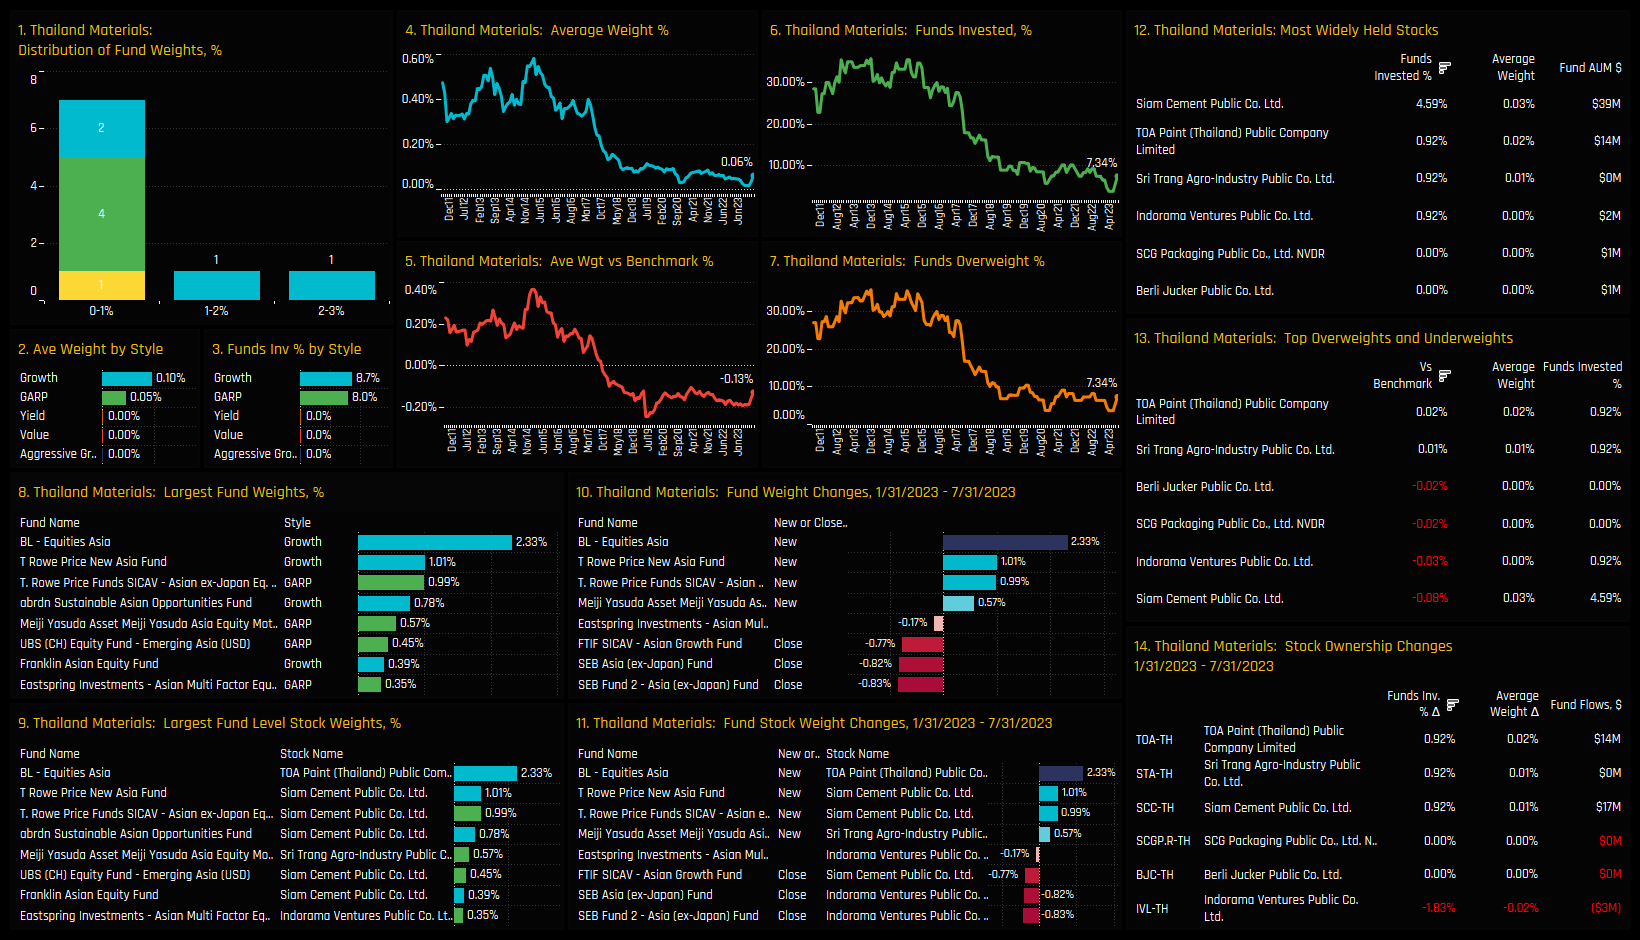
Low Positioning & High Momentum: Thailand Materials
Low Positioning & High Momentum: Singapore Utilities
104 Asia Ex-Japan Funds, AUM $66bn
China & HK. Six Stocks Hit Peak Ownership
We like to screen for stocks at the extreme ends of their ownership range. It highlights to us a particular state of conviction, whether positive or negative among the stocks in our Asia analysis. On this score, a select group of China & HK companies have caught our eye this month.
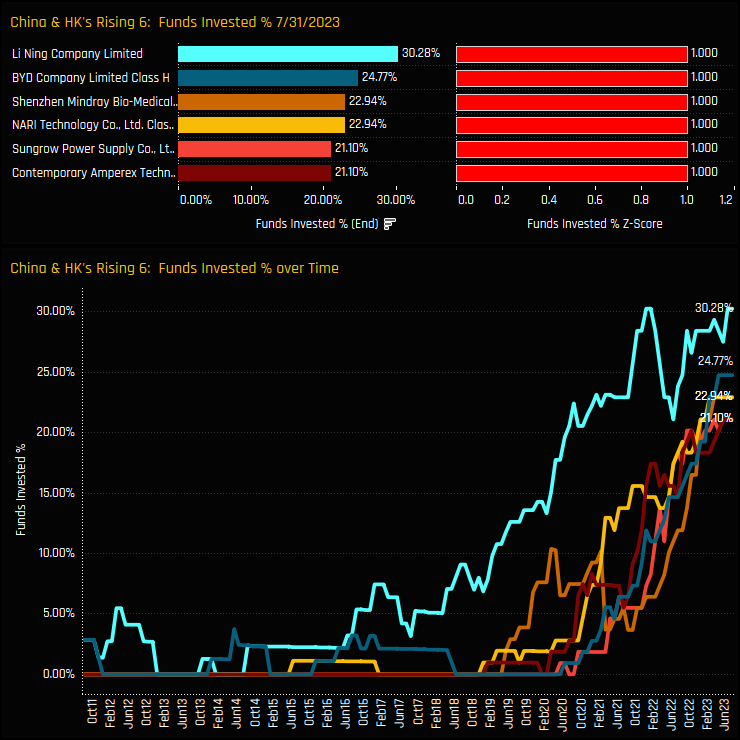
China & HK's Rising Six
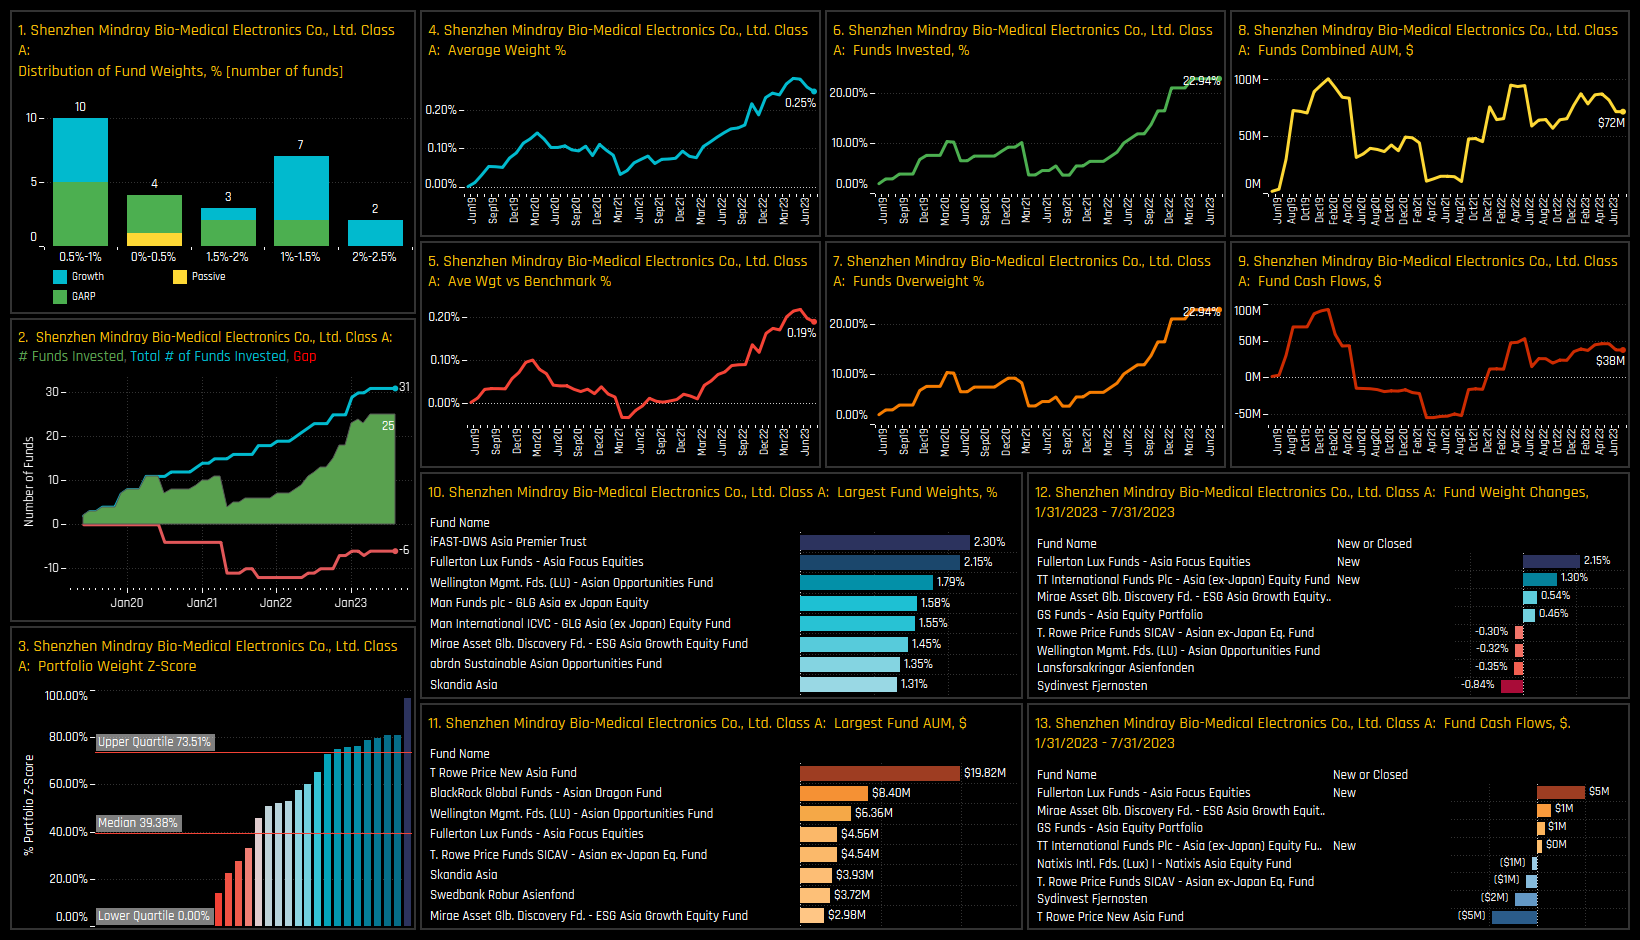
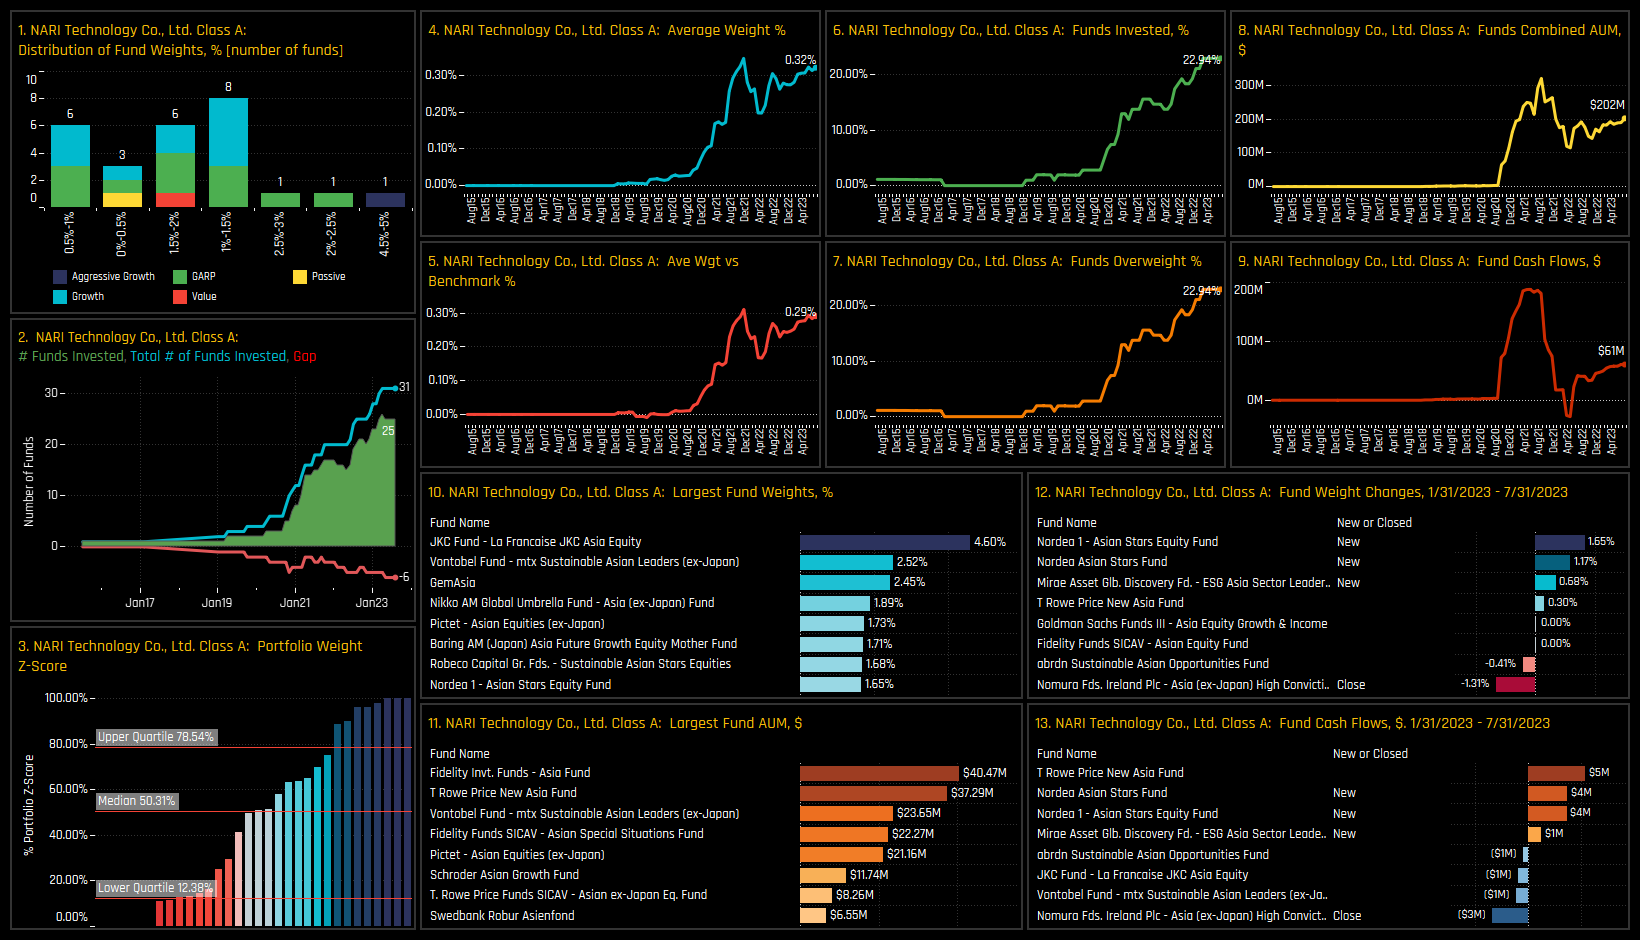
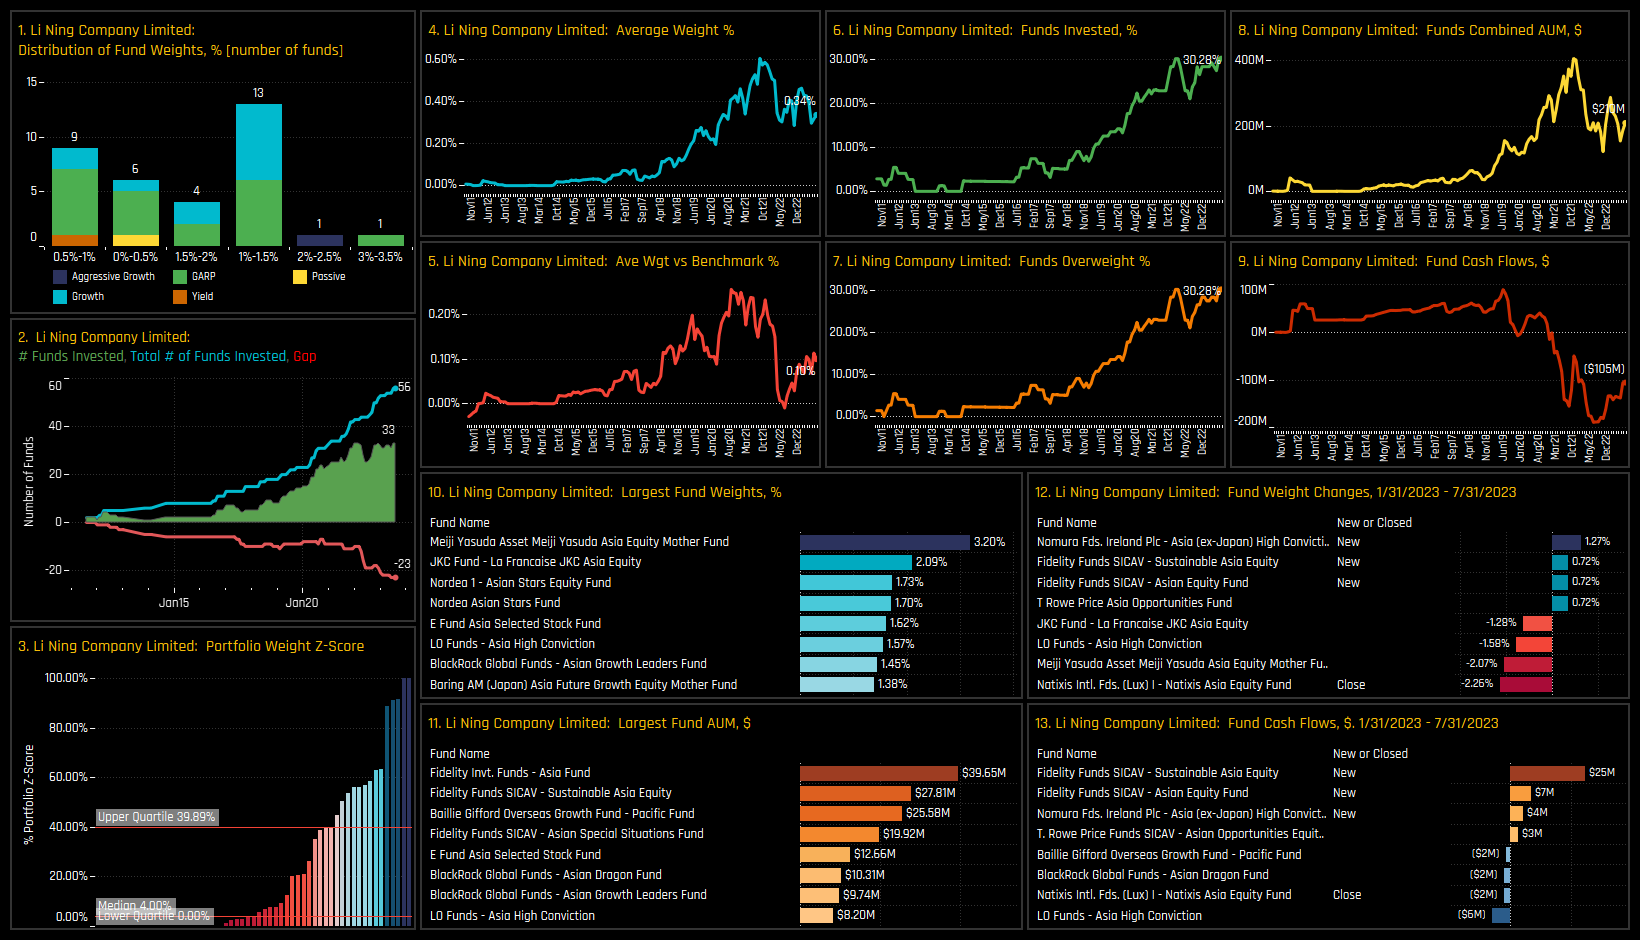
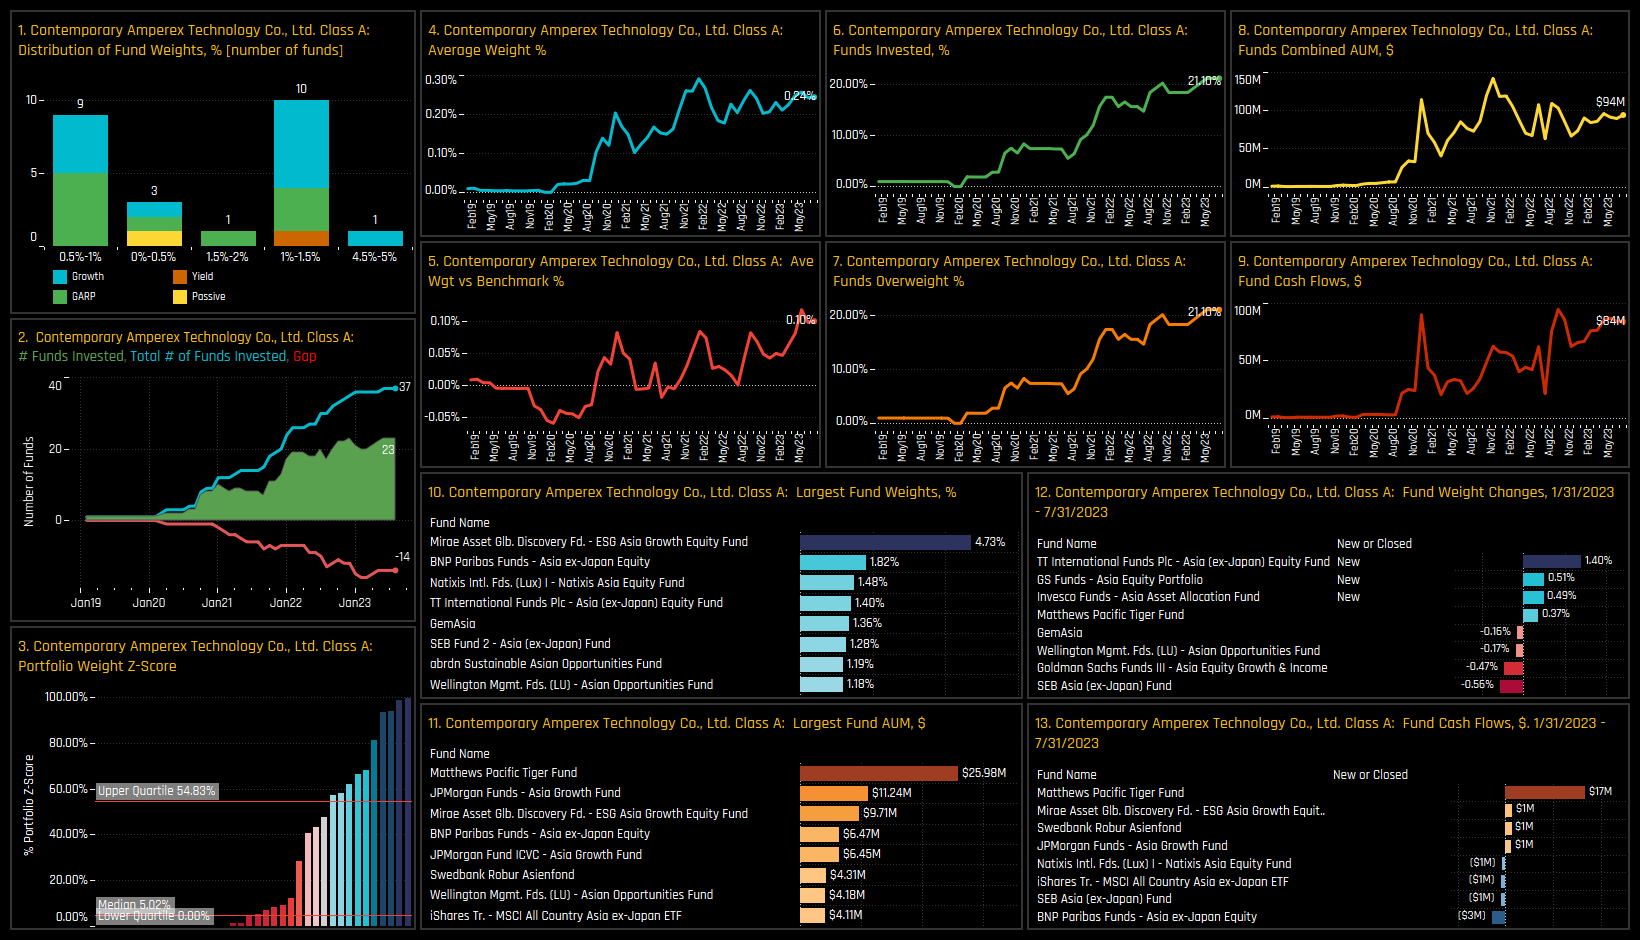
The 6 stocks listed in the top chart below are all at record levels of ownership among the active Asia Ex-Japan funds in our analysis. The top chart below shows the percentage of Asia Ex-Japan funds invested in each stock together with the Z-Score of that level versus history going back to 2011. The bottom chart shows the evolution of the percentage of funds invested over time for each stock. All are at peak levels of ownership, and all but Li Ning Company have seen rapid investment growth over the past 3-years.
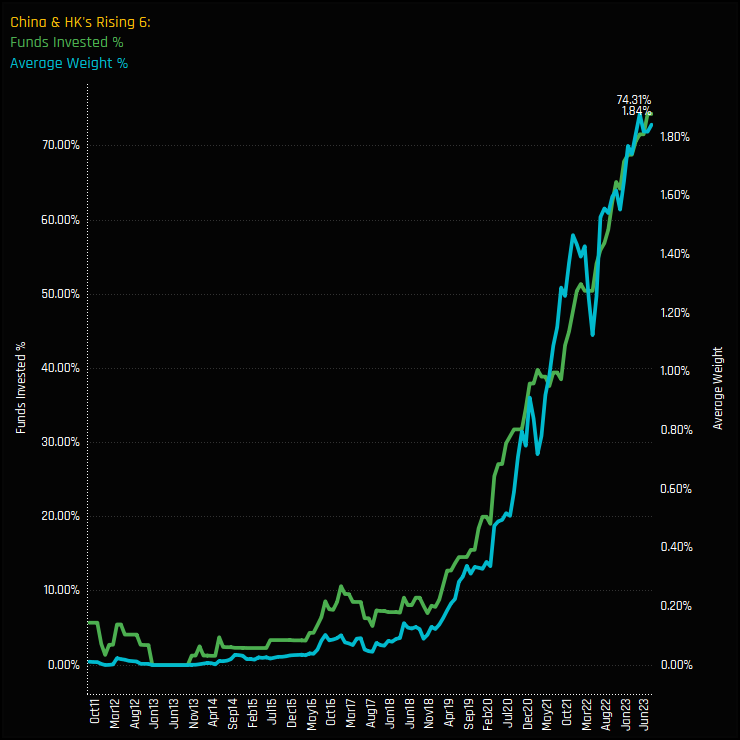
The charts below show how in combination, these 6 stocks have gained in significance within Asia Ex-Japan portfolios in recent years. The combined average weight has spiked higher to 1.84%, with 74.3% of funds holding at least 1 of the 6 companies listed. To provide the granular detail behind these moves, scroll down for profiles of the 6 companies listed, which show the key holders, the funds opening new positions and the major fund flows over the last 6-months.
For more analysis, data or information on active investor positioning in your market, please get in touch with me on steven.holden@copleyfundresearch.com
Investor Positioning Report — Copley Fund Research Ltd · Last updated: July 2026 · Registered in England and Wales
1. Who we are
Copley Fund Research Ltd provides proprietary institutional fund intelligence to listed companies and investor relations professionals. These terms govern every purchase of an Investor Positioning Report. By completing a purchase you confirm you have read, understood, and agreed to these terms in full.
2. What you are purchasing
The Investor Positioning Report is a bespoke PDF report mapping the institutional fund universe around your stock. It covers current investors, past investors, competitor investors, and white space investors. Every report is built from scratch for the specific company ordered and is not a standardised or templated product.
3. Delivery and process
Following payment or invoice issuance, Copley Fund Research will contact you within one working day to agree your competitor set. Production begins once the competitor set is confirmed in writing. The completed report will be released to you within 48 hours of production starting, provided payment has been received in full; where payment is outstanding, the report will be withheld until payment clears. If the requested company falls outside our covered fund universes, or a competitor set cannot be agreed, Copley Fund Research will issue a full refund or cancel the outstanding invoice.
4. Competitor set agreement
The competitor set is agreed with you in writing prior to production, and the report is built to that agreed specification. Requests to amend the competitor set after delivery, based on a change of preference rather than an error, may be treated as a new order.
5. Refund policy
Because each report is produced individually for your company, orders are non-refundable once production has begun, except as set out in clauses 3 and 5a below. By purchasing, you agree not to dispute the charge with your card provider on the basis that the service was not as described, provided the report has been delivered to the agreed specification or corrected under clause 5a.
5a. Quality remedy
If a delivered report contains a material error caused by Copley Fund Research — for example, an incorrect company analysed, a competitor omitted from the agreed set, or content missing from the specification in clause 2 — Copley Fund Research will correct and redeliver the report at no additional charge, within a reasonable timeframe. This is your sole remedy for such errors.
6. Data and accuracy
All fund positioning data in the report reflects holdings as disclosed at the most recently available reporting date at the time of compilation. The timing of fund holdings disclosures is determined by regulatory requirements applicable to each fund and is outside the control of Copley Fund Research Ltd. This data may not reflect current fund positions. Copley Fund Research takes reasonable care to ensure accuracy but makes no warranty, express or implied, as to the completeness or current accuracy of the underlying data — though this does not affect the quality remedy in clause 5a for errors in how that data was analysed or presented. Past fund positioning is not indicative of future fund behaviour or investment decisions.
7. Not investment advice
The Investor Positioning Report is produced for investor relations intelligence purposes only. It does not constitute investment advice, financial advice, or a recommendation to buy, hold, or sell any security. The data reflects historical fund positioning and must not be relied upon as a prediction of future fund behaviour or investment decisions. Copley Fund Research Ltd is not authorised or regulated by the Financial Conduct Authority for the provision of investment advice.
8. Permitted use and confidentiality
The report is licensed for internal use by the purchasing organisation only. You may share it with employees and directors of your organisation. You may not: reproduce, redistribute, publish, or resell the report or any part of it; share it with any third party outside your organisation without prior written consent; use the fund or portfolio manager names contained in the report to approach those individuals on behalf of Copley Fund Research or in a manner that could damage Copley Fund Research's relationships with those funds; or use the data for any purpose other than your own investor relations strategy. The data, analysis, and methodology contained in the report are the intellectual property of Copley


