In this issue:
Istanbul or Bust: The Decline of Turkish Investor Positioning
GEM Funds Country/Sector Radar
Climbing the Ranks: Record Ownership in Taiwan's Emerging Six
372 emerging market Funds, AUM $423bn
Istanbul or Bust: The Decline of Turkish Investor Positioning
• Turkish fund ownership falls to record lows after significant rotation
• Value managers sell down stakes but remain largest allocators. Aggressive Growth funds all but close out holdings
• No single company owned by more than 10% of managers. BIM and Koc Holdings the most widely held.
• Turkey falls to 9th largest country allocation in EMEA.
Time Series & Country Activity
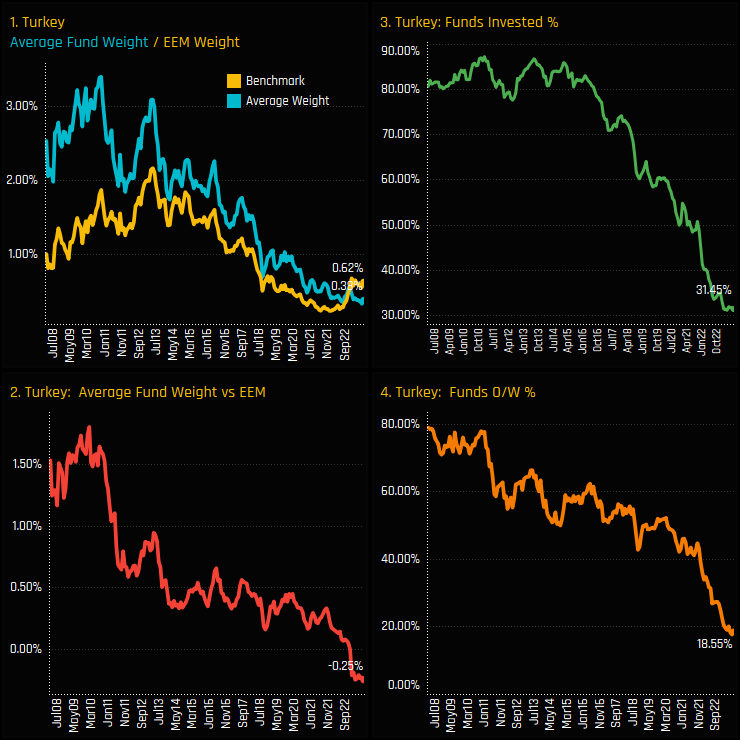
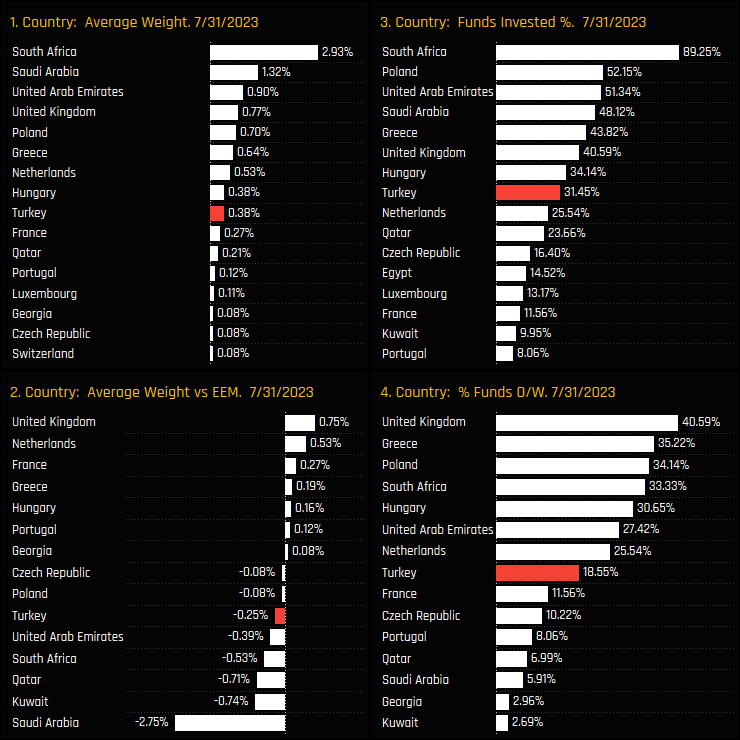
Ownership levels in Turkish equities have fallen to new lows among active Emerging Market equity funds. The percentage of funds invested in Turkey stands at an all-time low of 31.45%, pushing average holding weights to new lows of just 0.38%. For the first time since 2008, active managers are now running an underweight in Turkey, with just 18.6% of funds positioned ahead of the iShares MSCI Emerging Markets ETF.
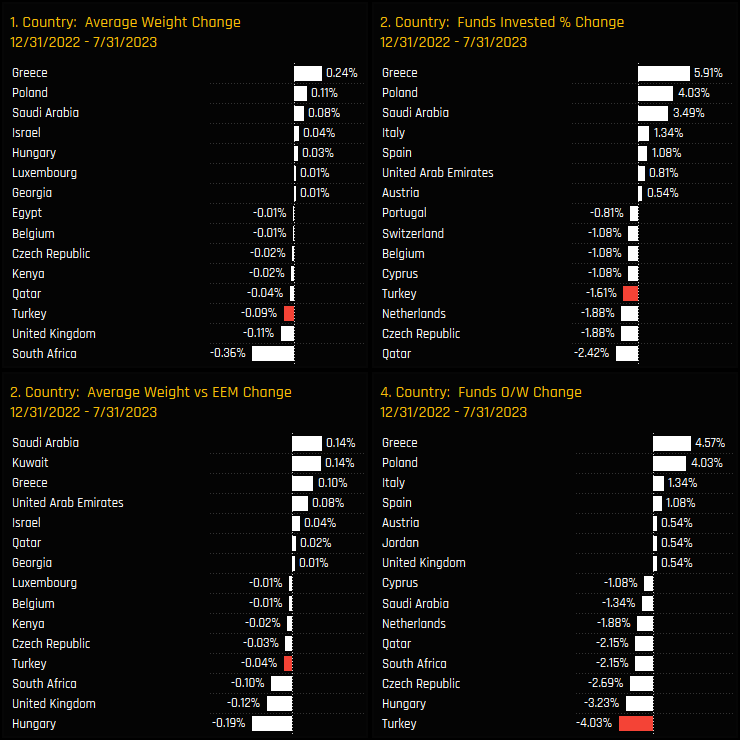
Fund activity through 2022 has extended the downward trajectory witnessed over the last decade. The below charts show the change in our ownership metrics for EMEA countries between 12/31/2022 and 07/31/2023. Turkey has been a key casualty of outward fund rotation, with all 4 measures of ownership moving lower over the period. Active GEM managers instead increased their Greek, Polish and Saudi Arabian allocations.
Fund Activity & Style Trends
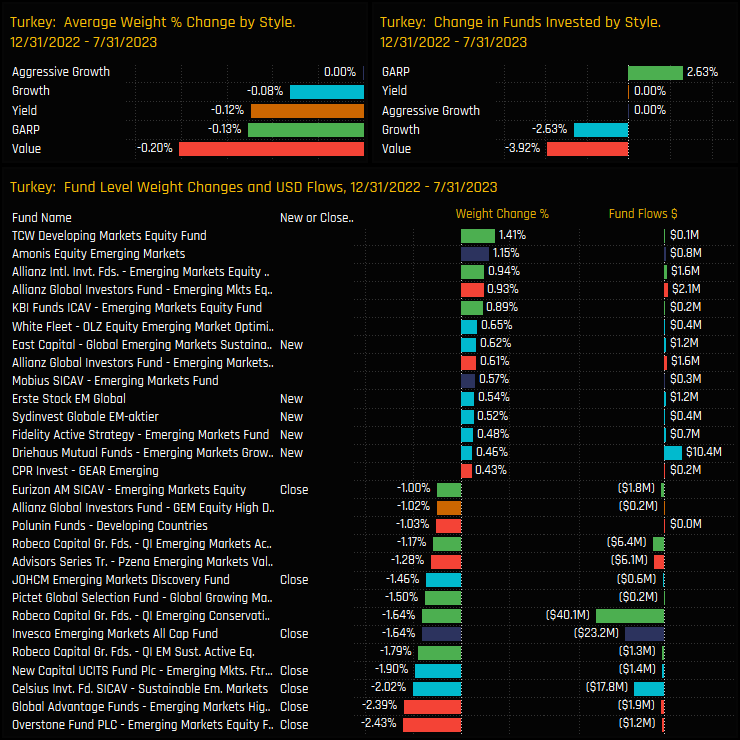
The charts below show the aggregate changes in Turkish allocations by fund Style (top) and the individual fund level changes (bottom), over the course of 2023. Value funds saw the largest drop in the percentage of funds invested and average weight, led by closures from Overstone EM Equity (-2.4%) and Global Advantange EM High Value (-2.4%). This wasn’t a slam dunk exodus though, with selected funds increasing weights or opening up new exposures.
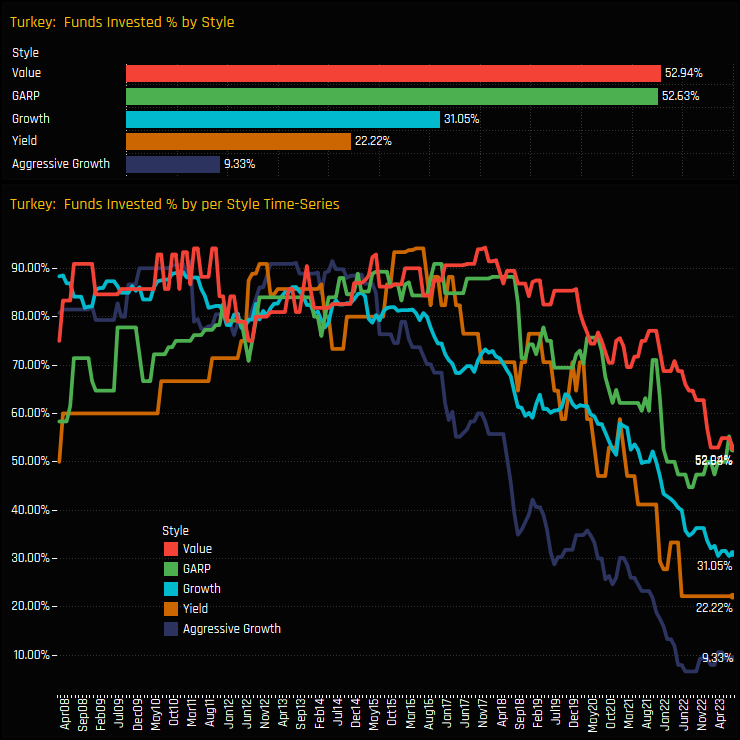
Despite the drawdown in Value fund allocations, they remain the most heavily invested Style group, with 52.9% of funds invested compared to 31% of Growth funds and just 9.3% of Aggressive Growth funds. Over time, the percentage of funds invested has fallen for all Style groups, but the most prominent move has been among Aggressive Growth strategies, who no longer view Turkey as a viable investment destination.
Fund Holdings & Stock Positioning
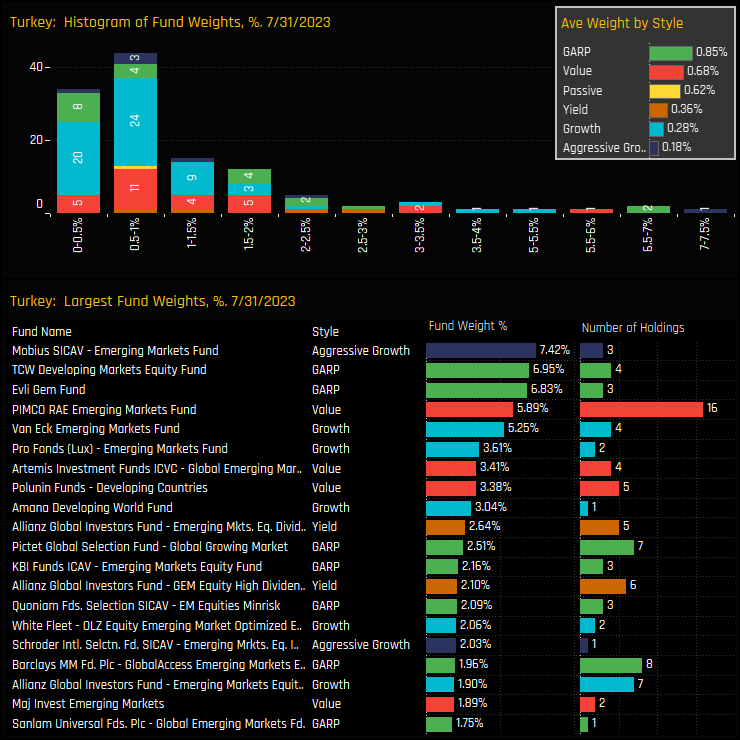
The histogram chart below shows the distribution of fund weights in Turkey for the 31.4% of funds who hold exposure. The majority of funds hold less than a 2% weight, with the extended tail to the right-hand side capping out at 7.4% for the Mobius EM Fund. GARP and Value funds are among the larger holders and stand as the only Style groups positioned overweight the iShares MSCI EM ETF.
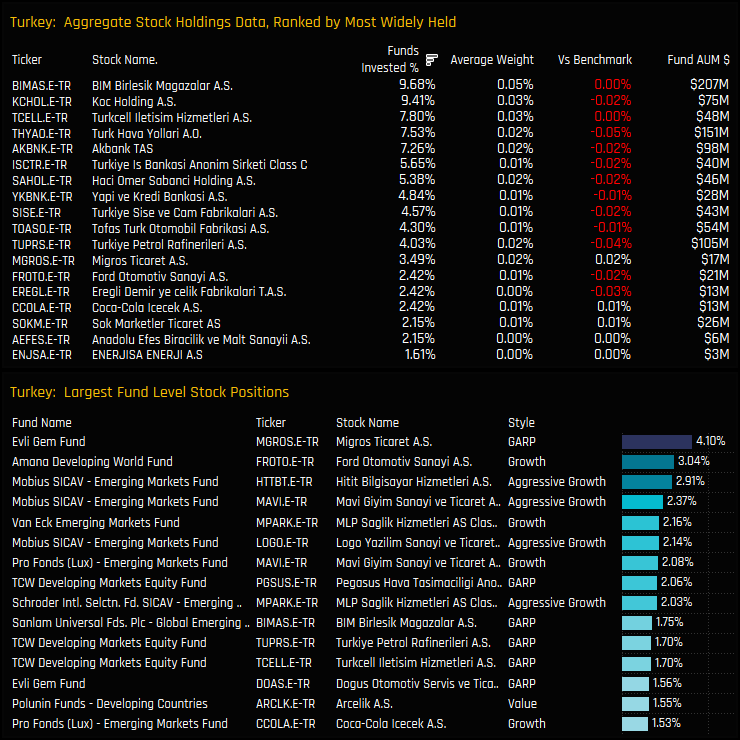
With ownership levels in Turkey at all-time lows, it’s little surprise that ownership in individual stocks is light. The most widely held companies are BIM Birlesik and Koc Holding, owned by 9.7% and 9.4% of funds respectively. The once widely owned banks are almost totally avoided, with Akbank the most popular holding with 7.5% of funds holding a position.
Conclusions & Links
The sad demise of Turkey is no more evident when we look at the latest country positioning in the EMEA region. Once the 3rd largest country allocation in EMEA, Turkey has fallen down to 9th, with Hungary, Greece and the UK held by more funds. With index weights diminishing in line with active weights, the underweight of -0.25% is small in comparison to the larger benchmark countries of Saudi Arabia, Kuwait and Qatar.
So with both active weights and benchmark weights so small, the risks of not holding a Turkey position are diminishing for the average active manager. Only 16 of the 373 funds in our analysis hold more than a 2% allocation – To bet big on Turkey here is a significant non-consensus call.
Click below for the extended data report on Turkish EM investor positioning.
Investment levels among the key country/sectors in the investible Emerging Markets universe differ greatly. Some country/sectors are widely owned, others largely avoided with ownership levels changing every month. We combine current and historical positioning against shorter-term manager activity to get a handle on where sentiment lies for every country/sector in our EM analysis. We highlight 11 country/sectors at the extreme ends of their own positioning ranges whilst also seeing significant changes in fund ownership.
Country/Sector Sentiment
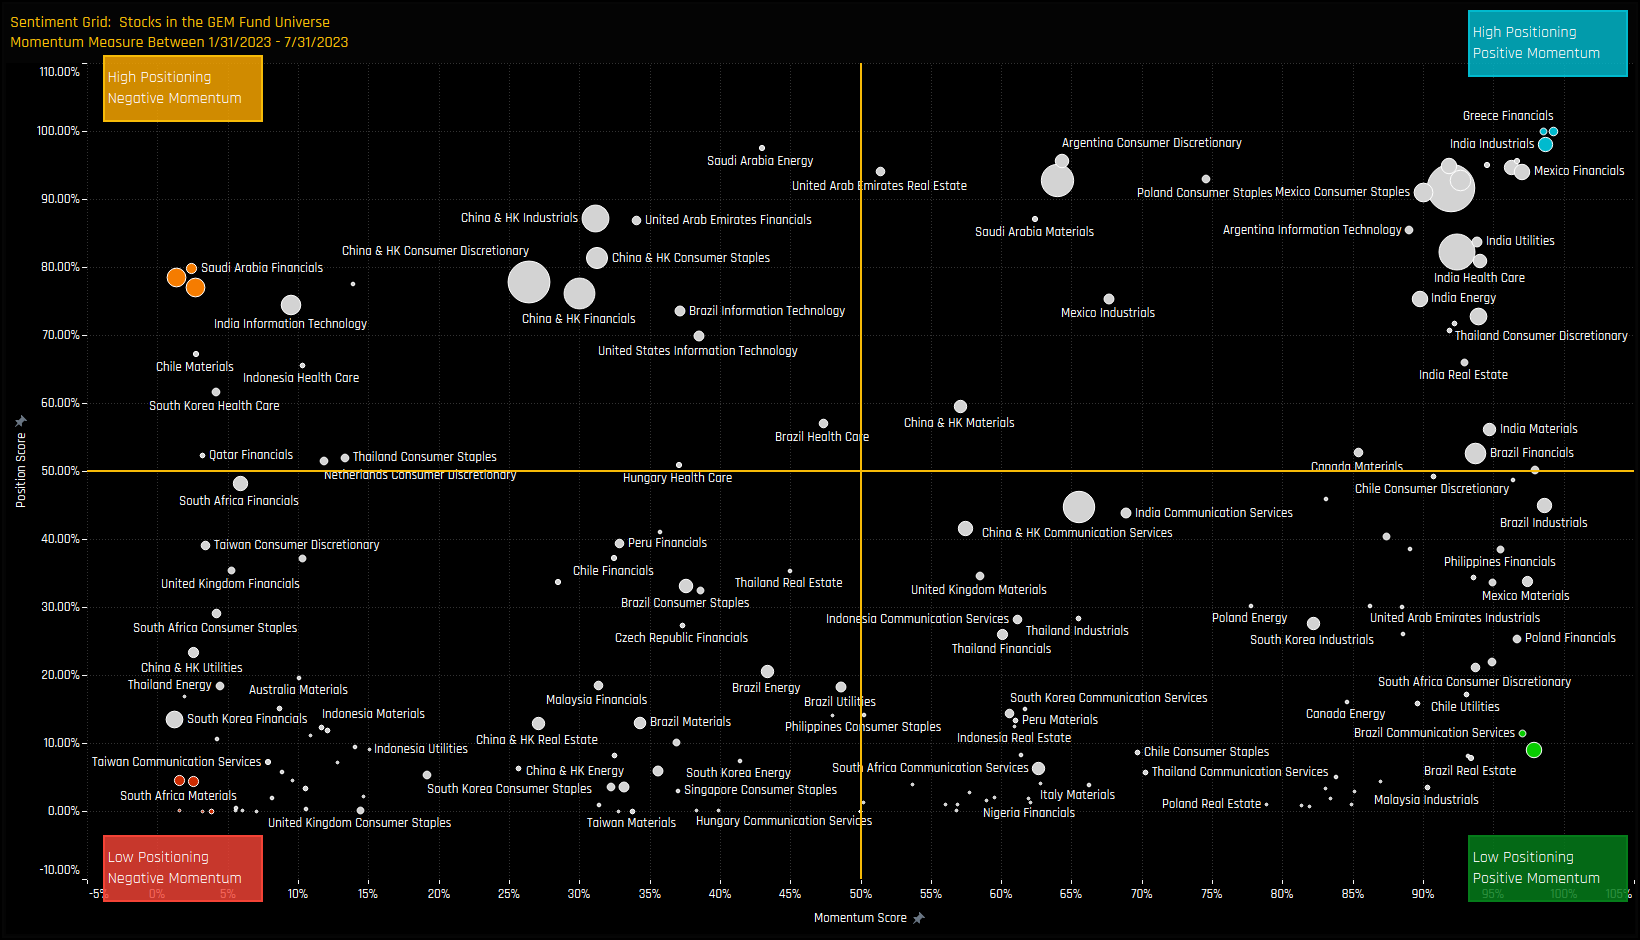
The Sentiment Grid below is designed to visualize the interplay between current fund positioning, long-term fund positioning and shorter-term fund manager activity for all country/sectors in the GEM fund active universe. The Y-axis shows the ‘Position Score’, a measure of current positioning in each country/sector compared to its own history going back to 2008 on a scale of 0-100%. It takes in to account the percentage of funds invested in each country/sector versus history, the average fund weight versus history and the percentage of funds overweight the benchmark versus history. The higher the number, the more heavily a country/sector is owned by active EM managers compared to its own history.
The X-Axis shows the ‘Momentum Score’, a measure of fund manager activity for each country/sector between 1/31/2023 and 07/31/2023 on a scale of 0% (maximum negative activity) to 100% (maximum positive activity). The Momentum Score takes in to account the change in the percentage of funds invested in each country/sector over the period, the change in average weight and the change in the percentage of funds overweight. The chart also highlights the country/sectors at the extreme ends of each quadrant by colour, which will shall explore in more detail below.
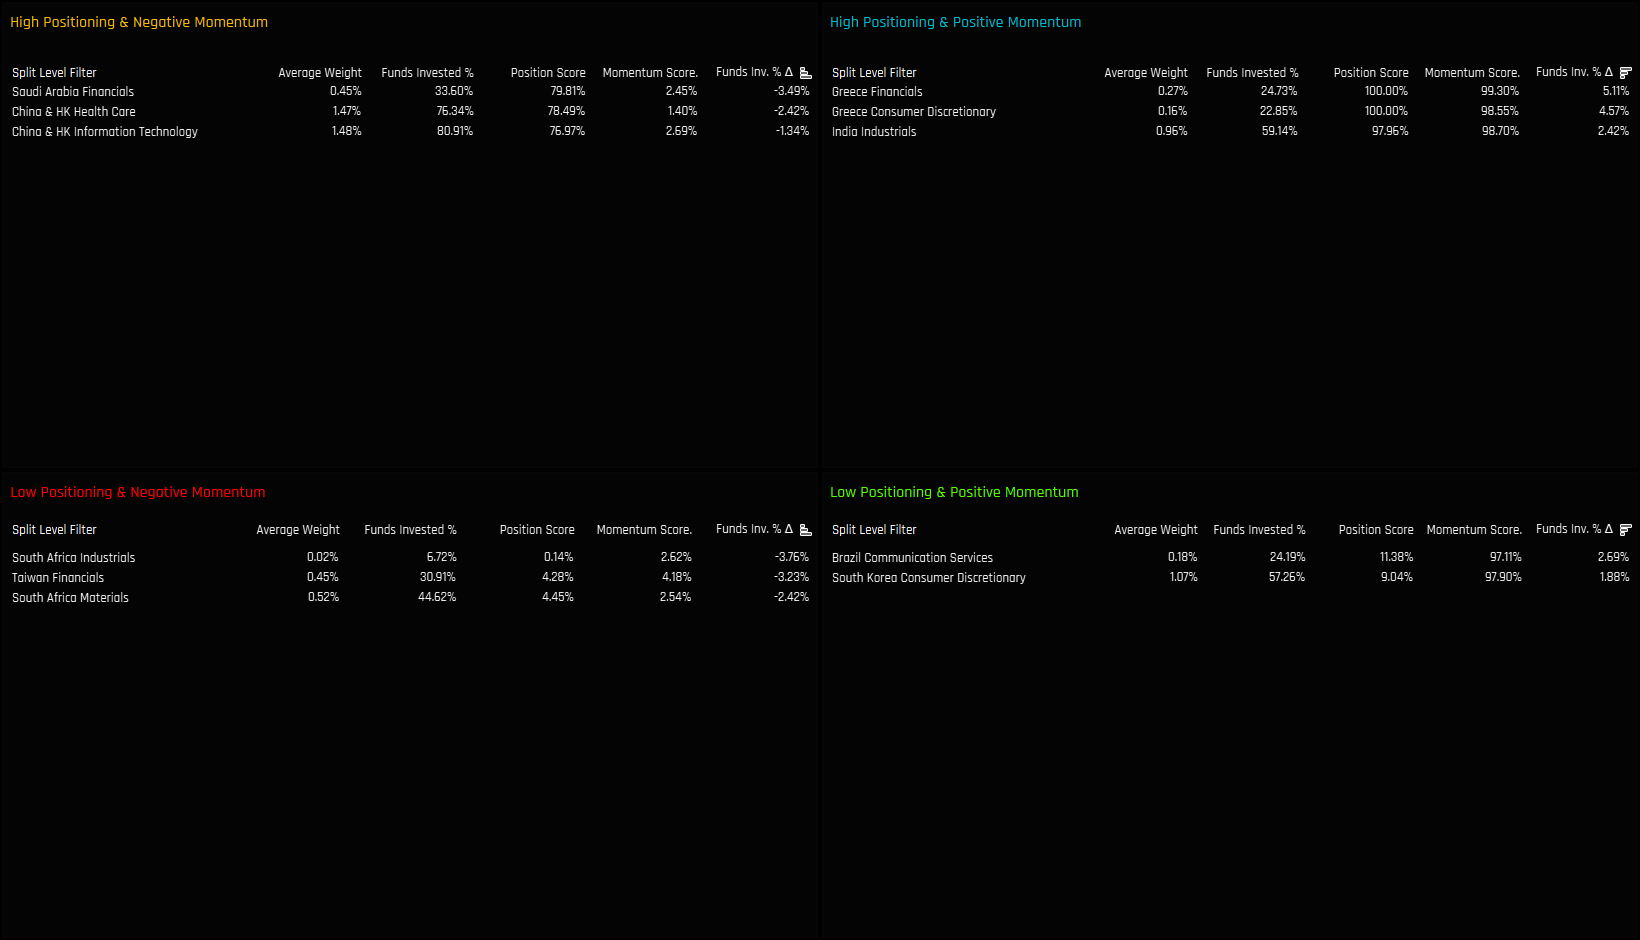
Extreme Country/Sectors
The tables below list the country/sectors in the extreme corners of each quadrant. The screening methodology is as follows:
High Positioning & Negative Momentum: Position Score > 75%. Momentum Score < 5%
High Positioning & Positive Momentum: Position Score > 95%. Momentum Score > 98%
Extreme Country/Sectors
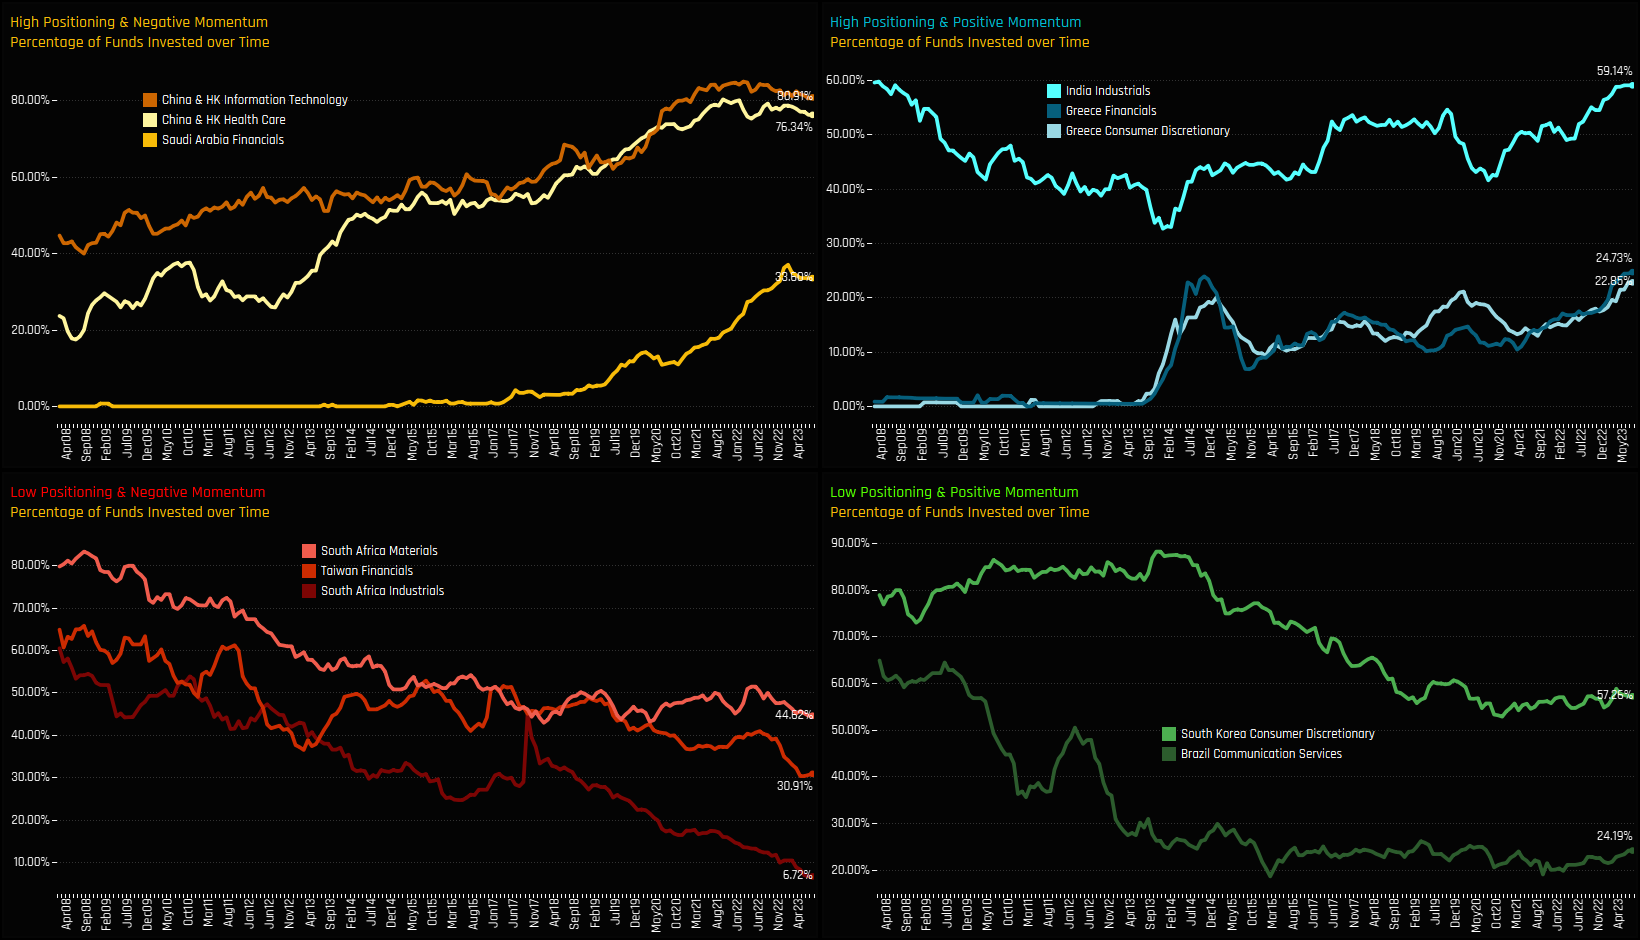
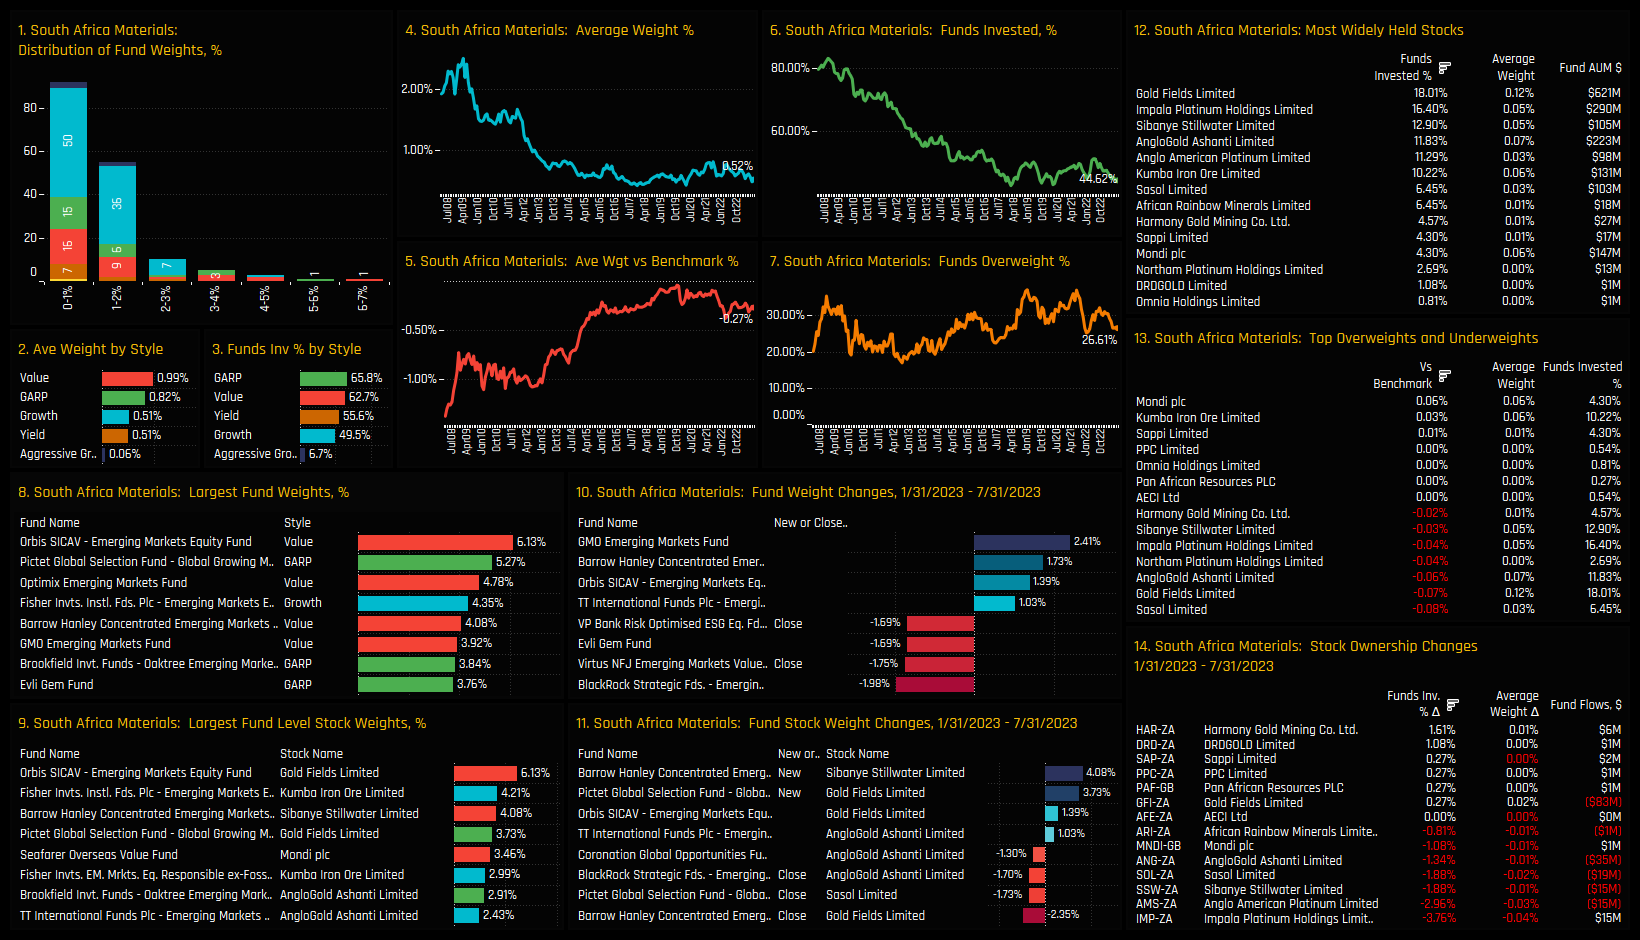
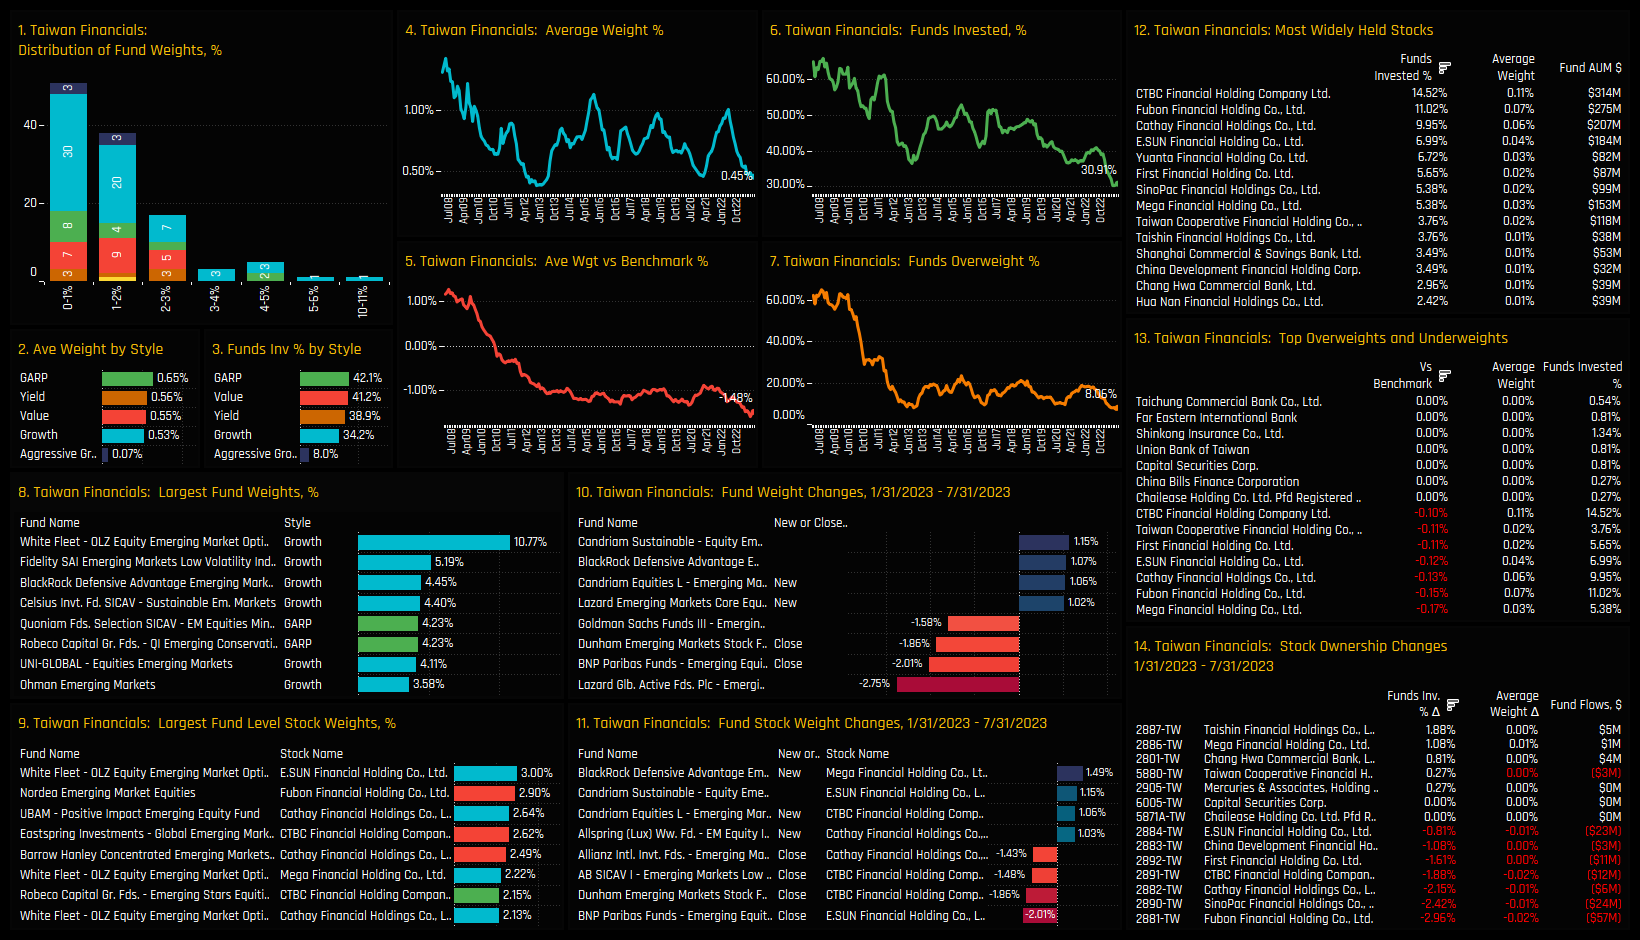
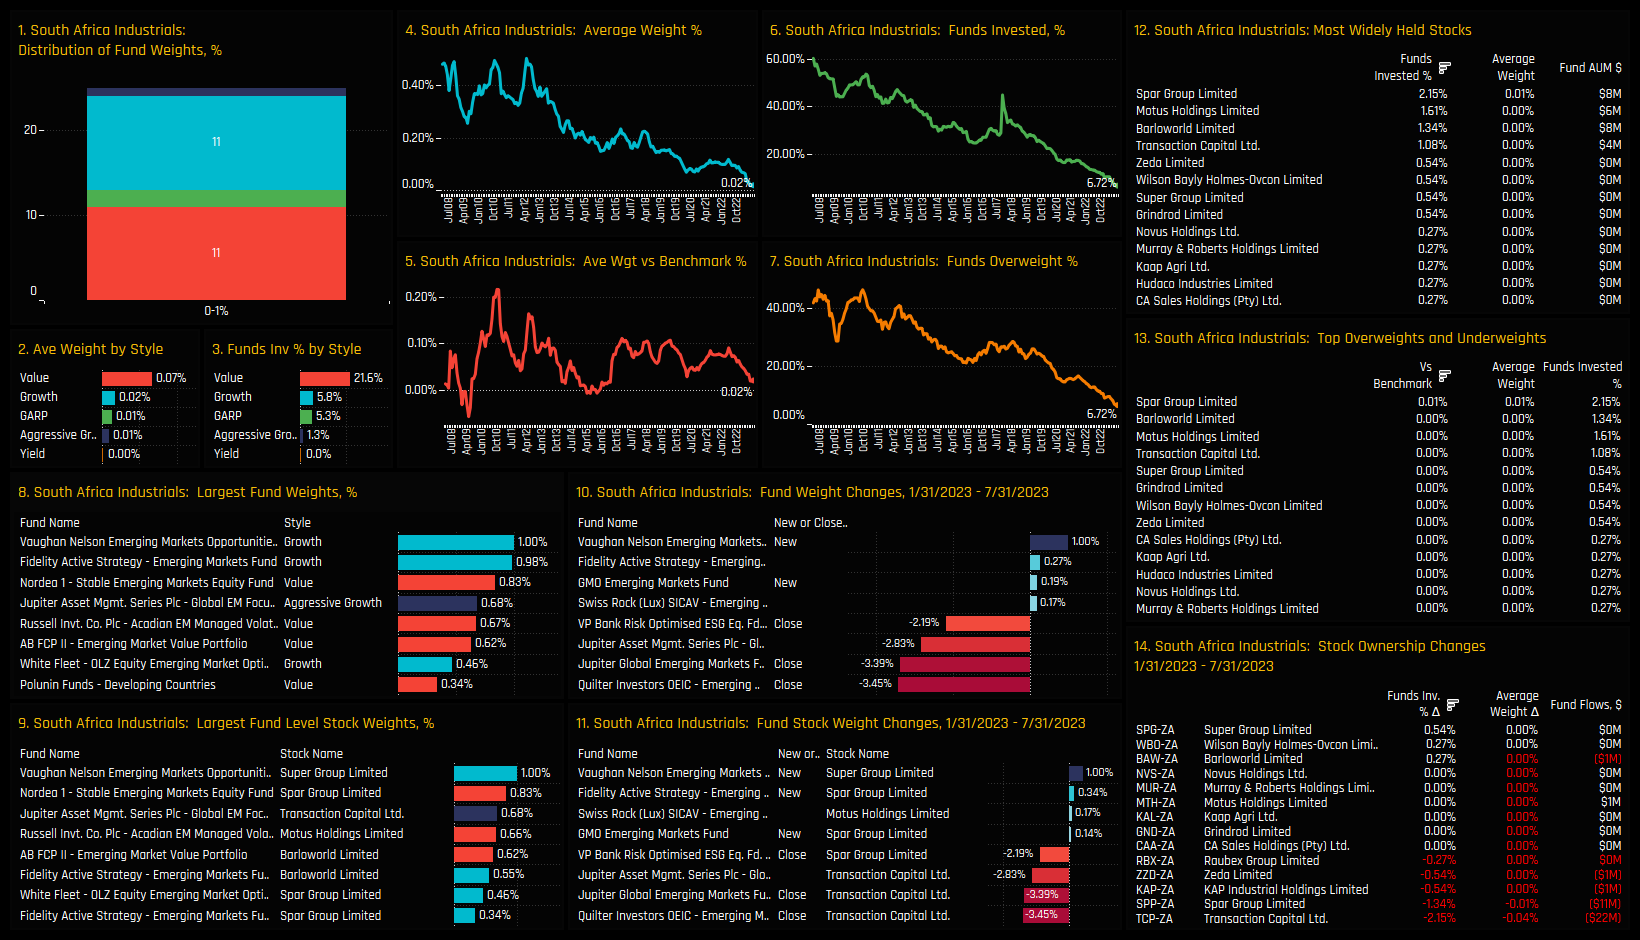
The following charts illustrate the proportion of active funds invested in each of the country/sectors listed above over time. This visualization provides an additional perspective how the Sentiment Grid works. For China & HK Tech, China & HK Health Care and Saudi Arabian Financials (top left), ownership has been on an upward path for number of years but we have past the peak as managers start to consolidate positions. For South African Materials, Taiwan Financials and South African Industrials (bottom left), ownership levels have been in multi-year declines, with recent selling pushing exposure levels to all-time lows.
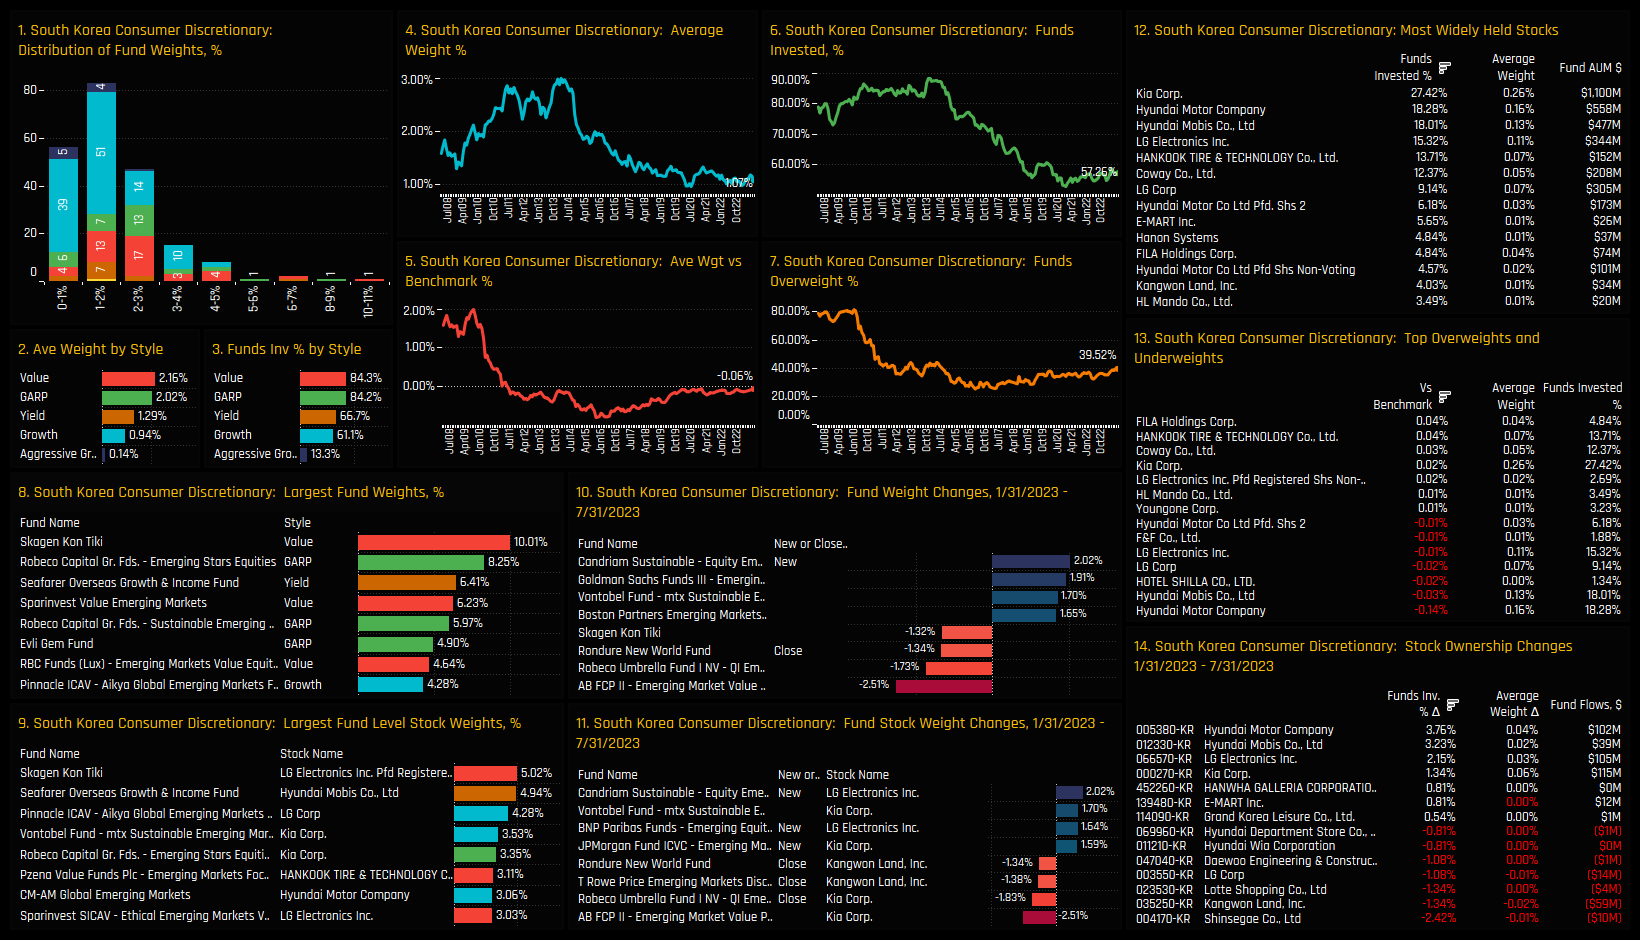
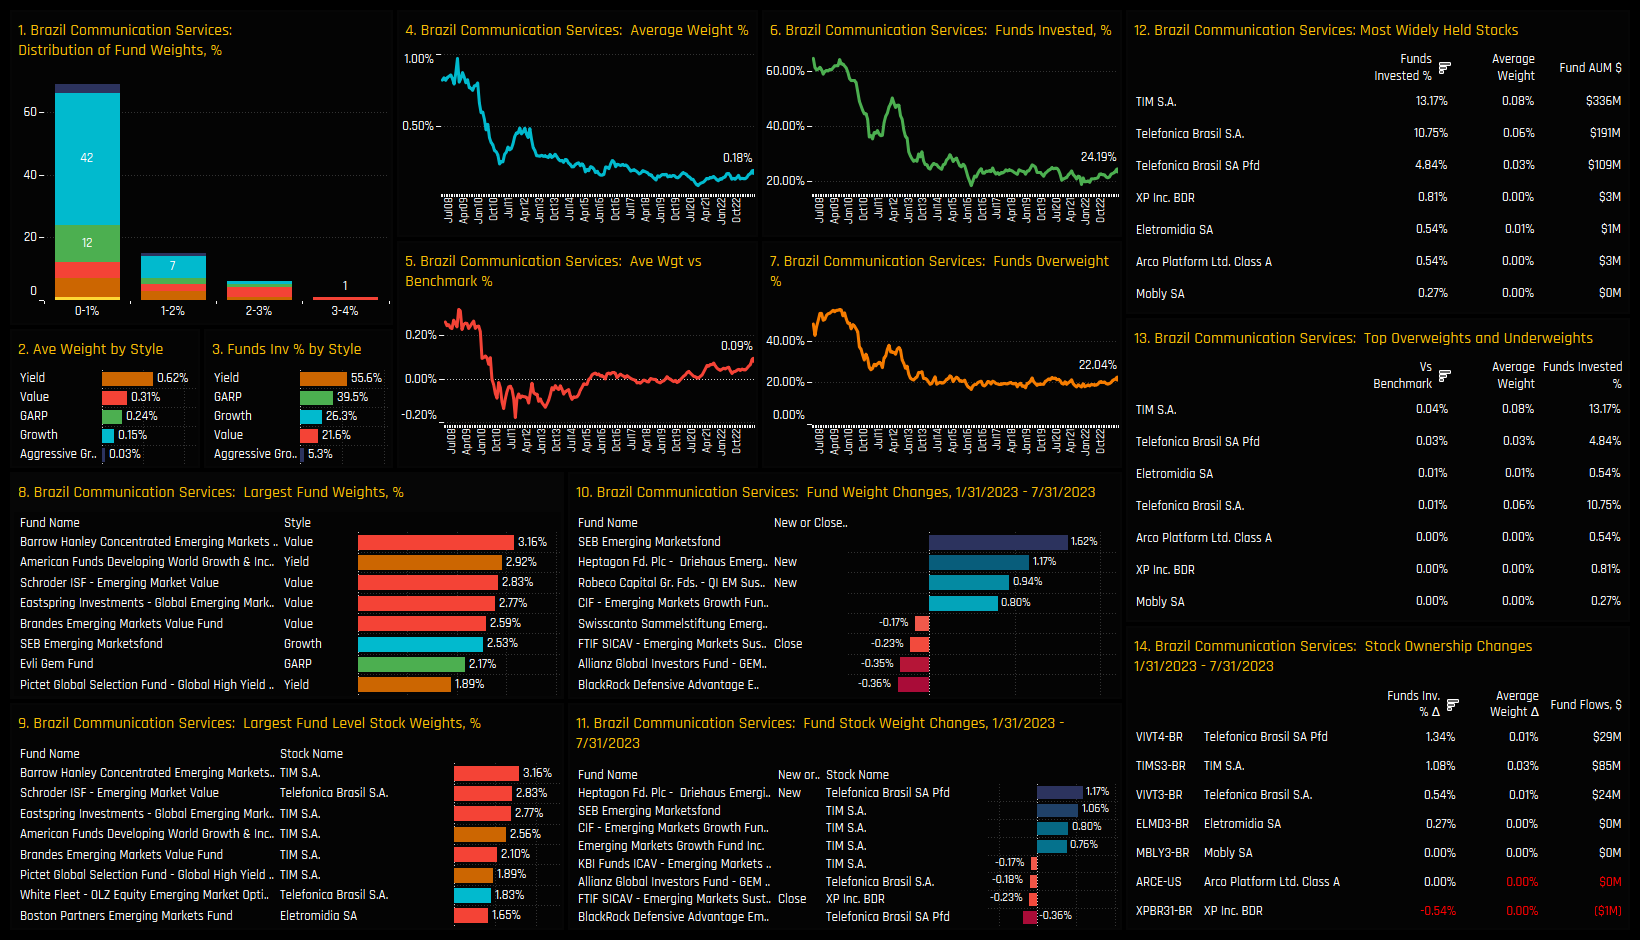
For Indian Industrials, Greek Financials and Greek Consumer Discretionary, ownership levels are at all-time highs after sustained increases in exposure among active EM managers (top right). Finally, for South Korean Consumer Discretionary and Brazilian Communication Services stocks, ownership levels are at historical lows but recent activity has been skewed to the buy side – something in the investment case has changed. Please scroll down for more detailed profiles of each country/sector to understand the funds and stocks behind the country/sector positioning.
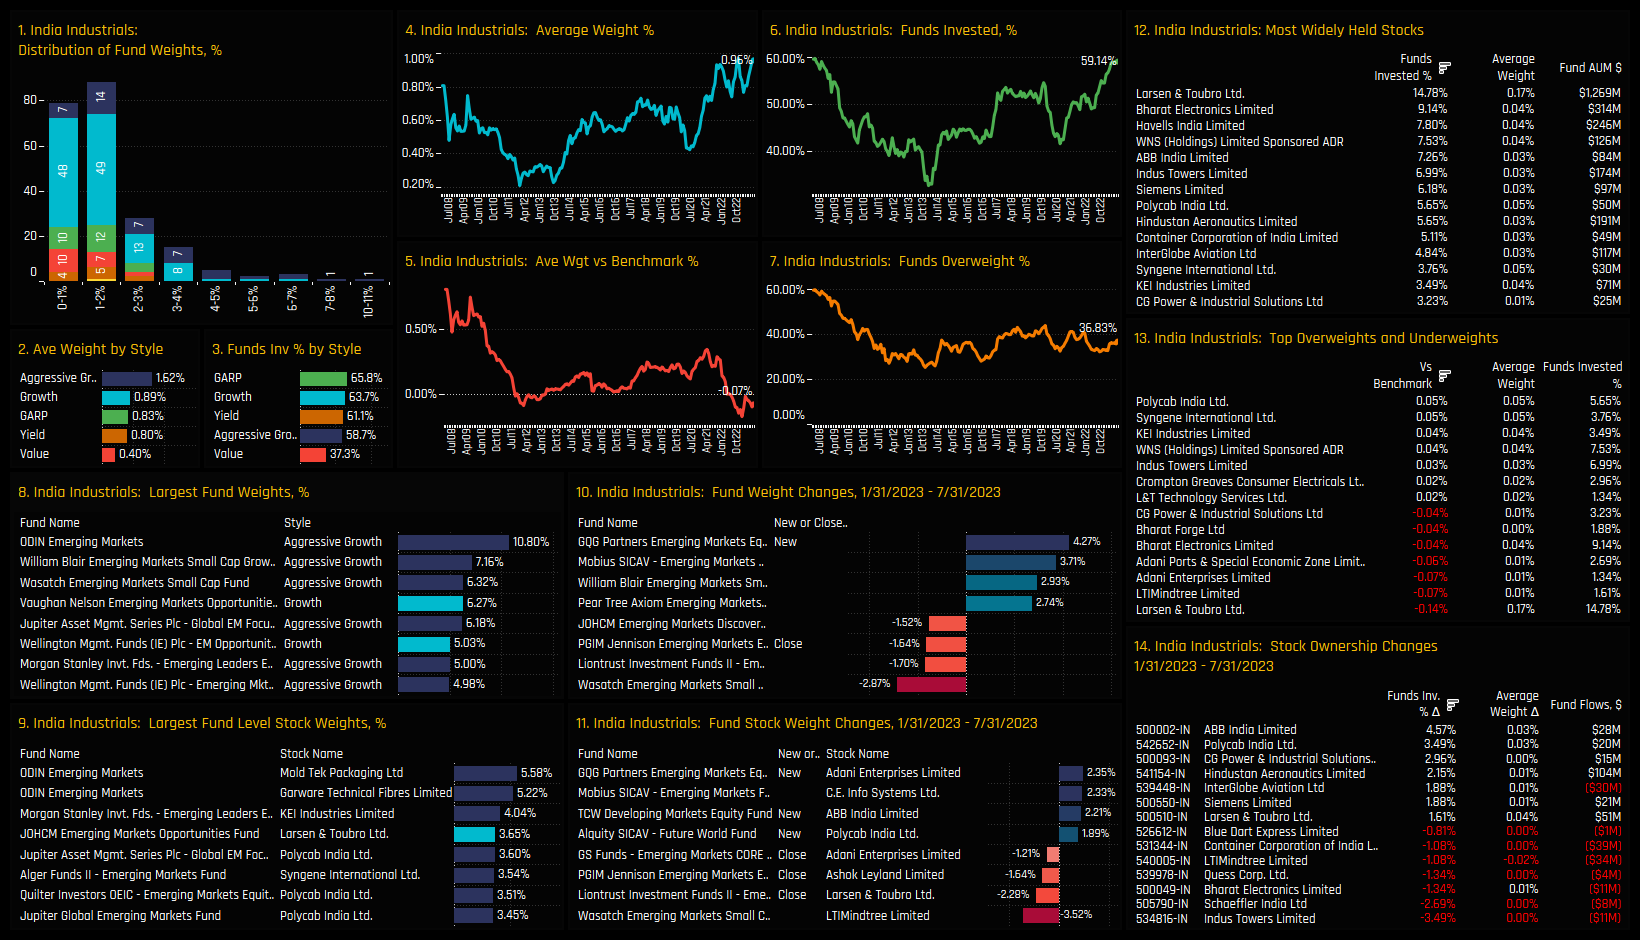
High Positioning & High Momentum: Indian Industrials
Chart 1. Histogram of fund weights. The bulk of allocations sit below the 3% level, but with an upside tail that extends to 11%.
Chart 2 & 3. Average weights and the percentage of funds invested in Indian Industrials by Style. Value funds are the obvious under-allocators, whilst Aggressive Growth sit on top.
Chart 4. The equally weighted average holding weight in Indian Industrials. The current weight of 0.96% is the highest on record.
Chart 5. The equally weighted average holding weight minus the iShares MSCI EM Weight. Active funds are marginally underweight, on average.
Chart 6. The percentage of funds invested in Indian Industrials, again at all-time highs of 59.14%.
Chart 7. The percentage of funds overweight the Indian Industrials sector.
Chart 8. The largest holders in India Industrials, with ODIN, William Blair and Wasatch the key allocators.
Chart 9. The largest fund level stock holdings in the Indian Industrials sector, led by ODIN’s positions in Mold Tek Packaging and Garware Technical Fibres.
Chart 10. The largest weight changes in Indian Industrials between 01/31/2023 – 07/31/2023. GQG’s new position of 4.27% is the standout move.
Chart 11. The largest individual fund level stock weight changes over the same period. GQG’s opening position in Adani Enterprises is the largest opening position.
Chart 12. Aggregated Stock Holdings, ranked by the most widely held stocks in the sector. Larsen & Toubro is the most widely held, owned by 14.8% of EM fund managers.
Chart 13. The top overweight and underweight stock holdings in the sector. Overweights led by Polycab India, underweights by Larsen & Toubro.
Chart 14. The largest aggregate changes in stock ownership. Indian Industrials surge driven by increases in ABB India, Polycab and CG Power fund ownership.
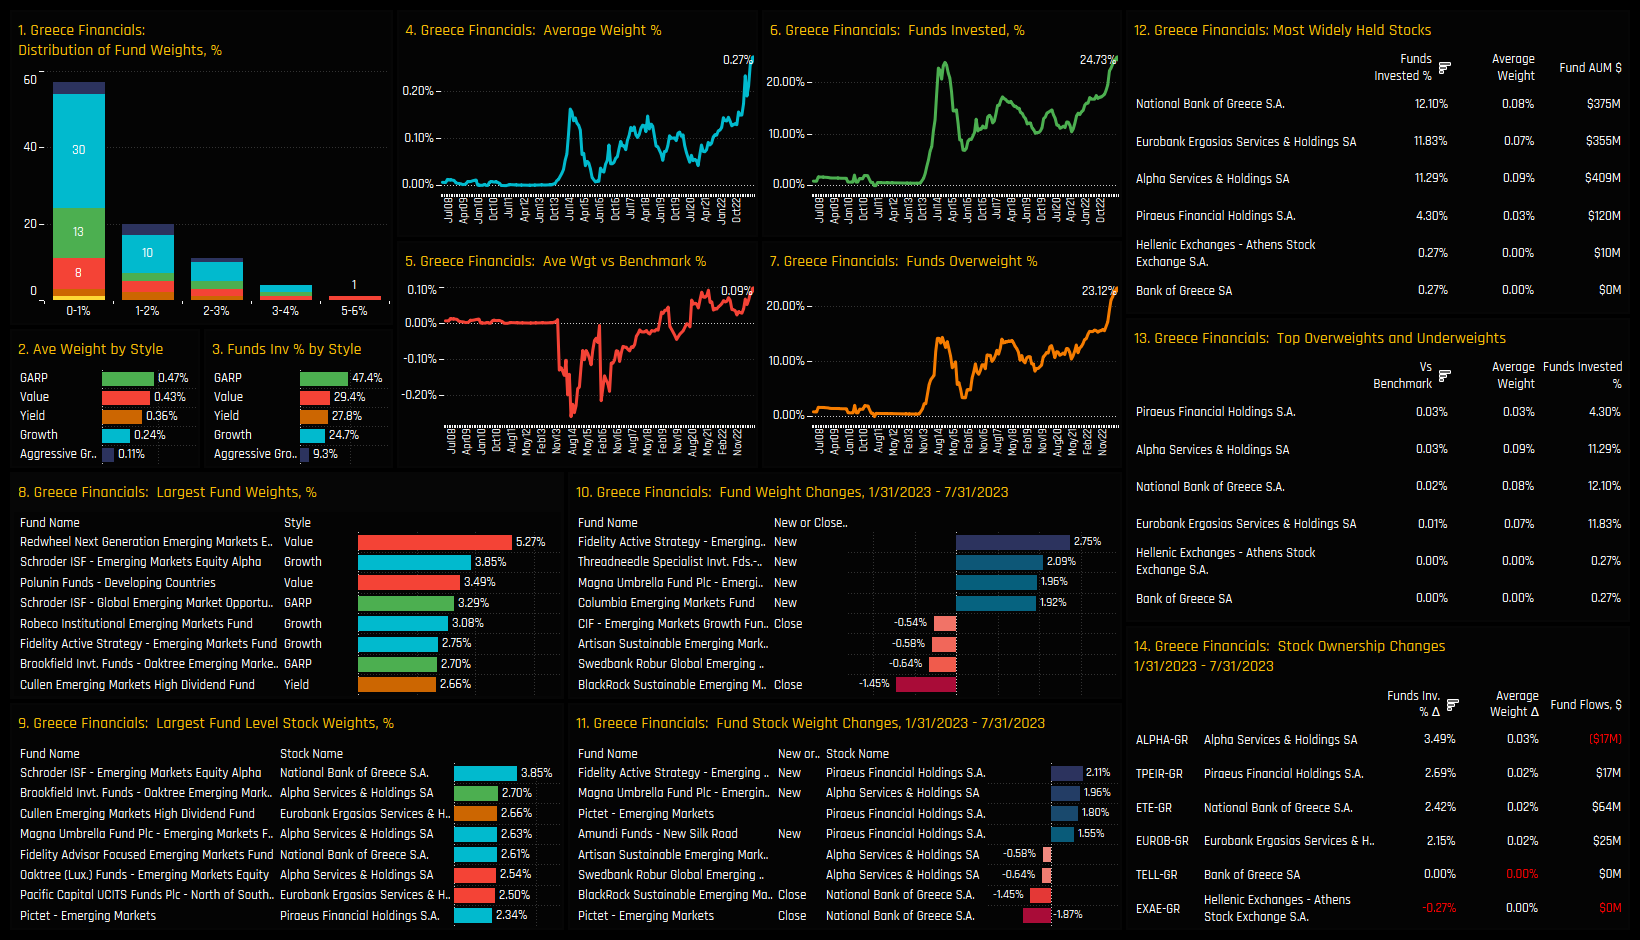
High Positioning & High Momentum: Greece Financials
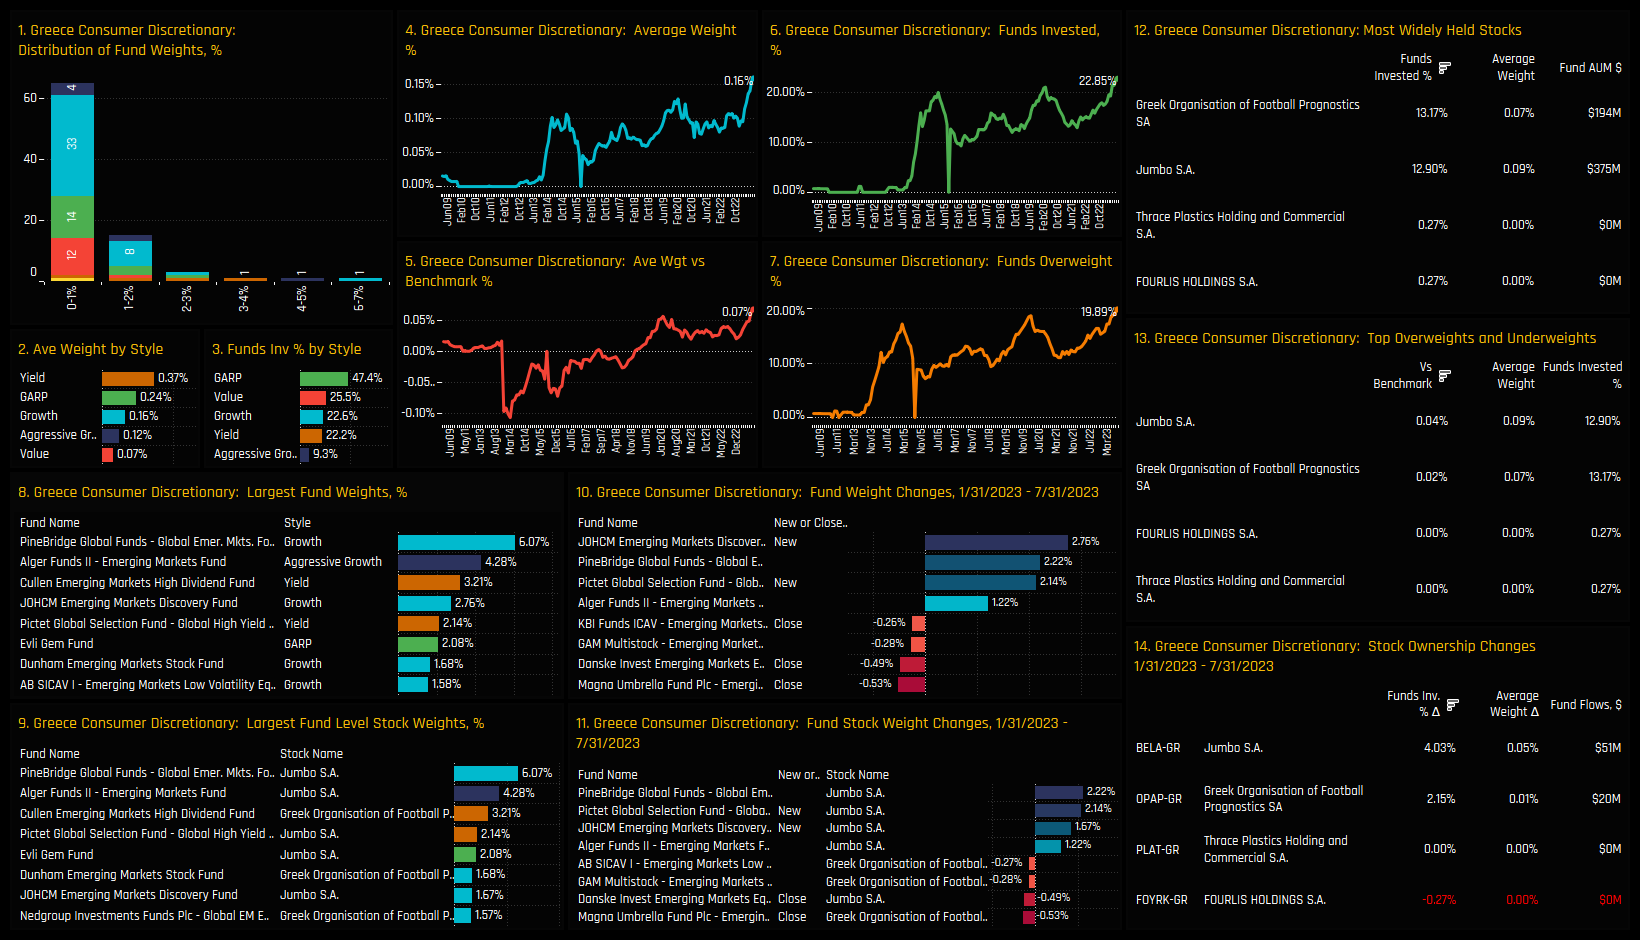
High Positioning & High Momentum: Greece Consumer Discretionary
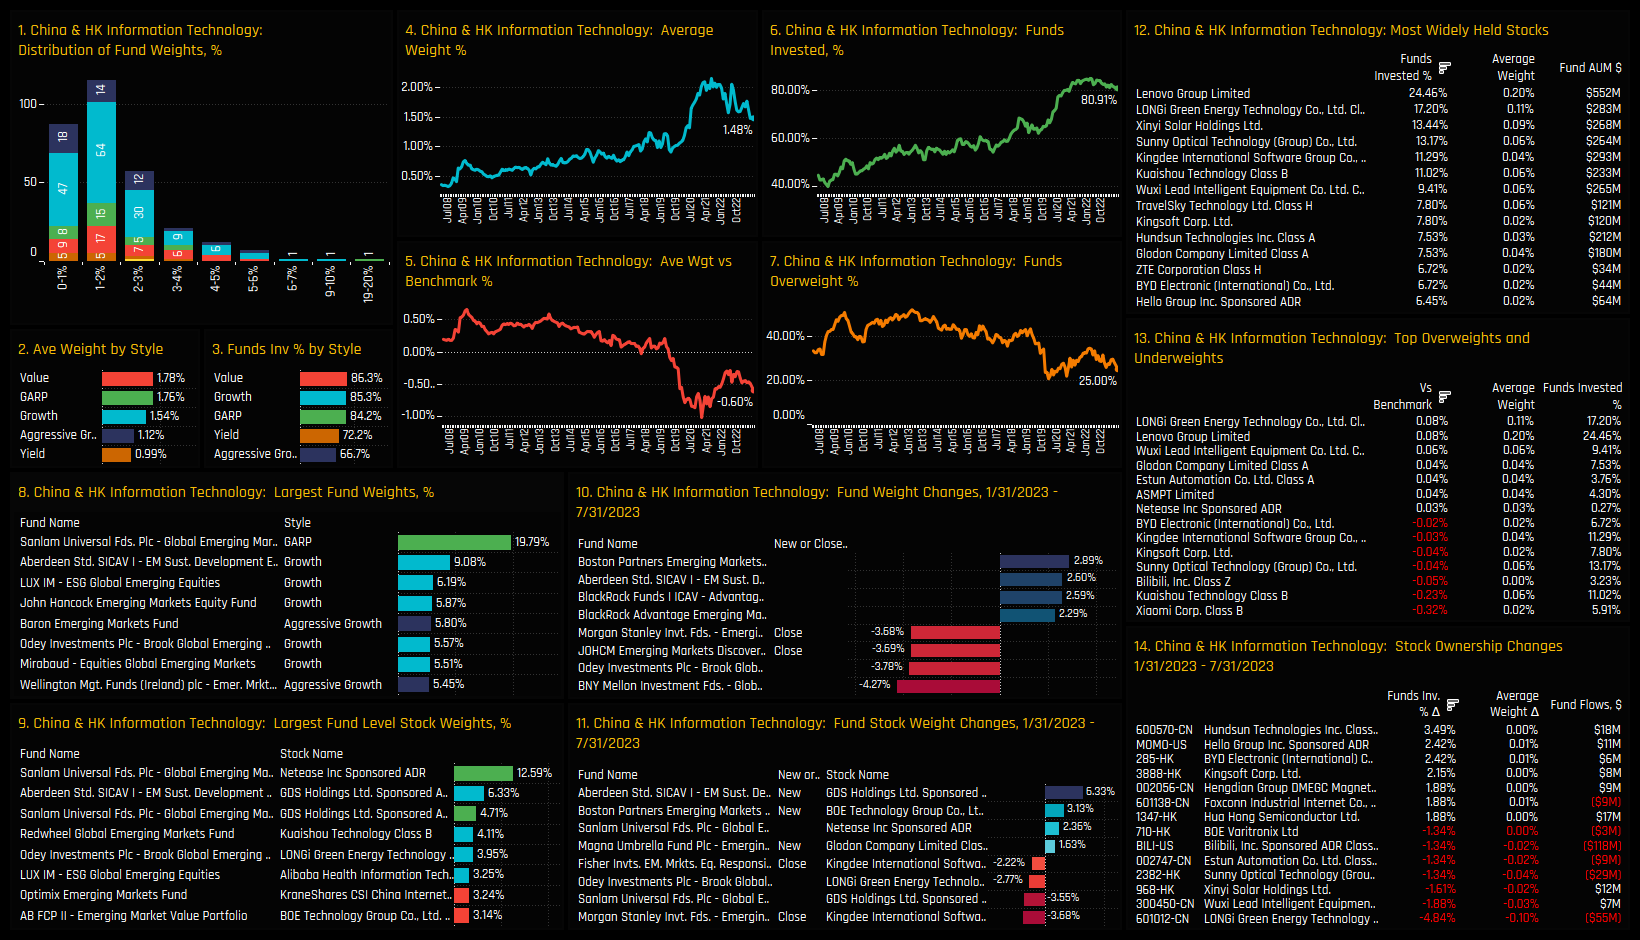
High Positioning & Low Momentum: China & HK Information Technology
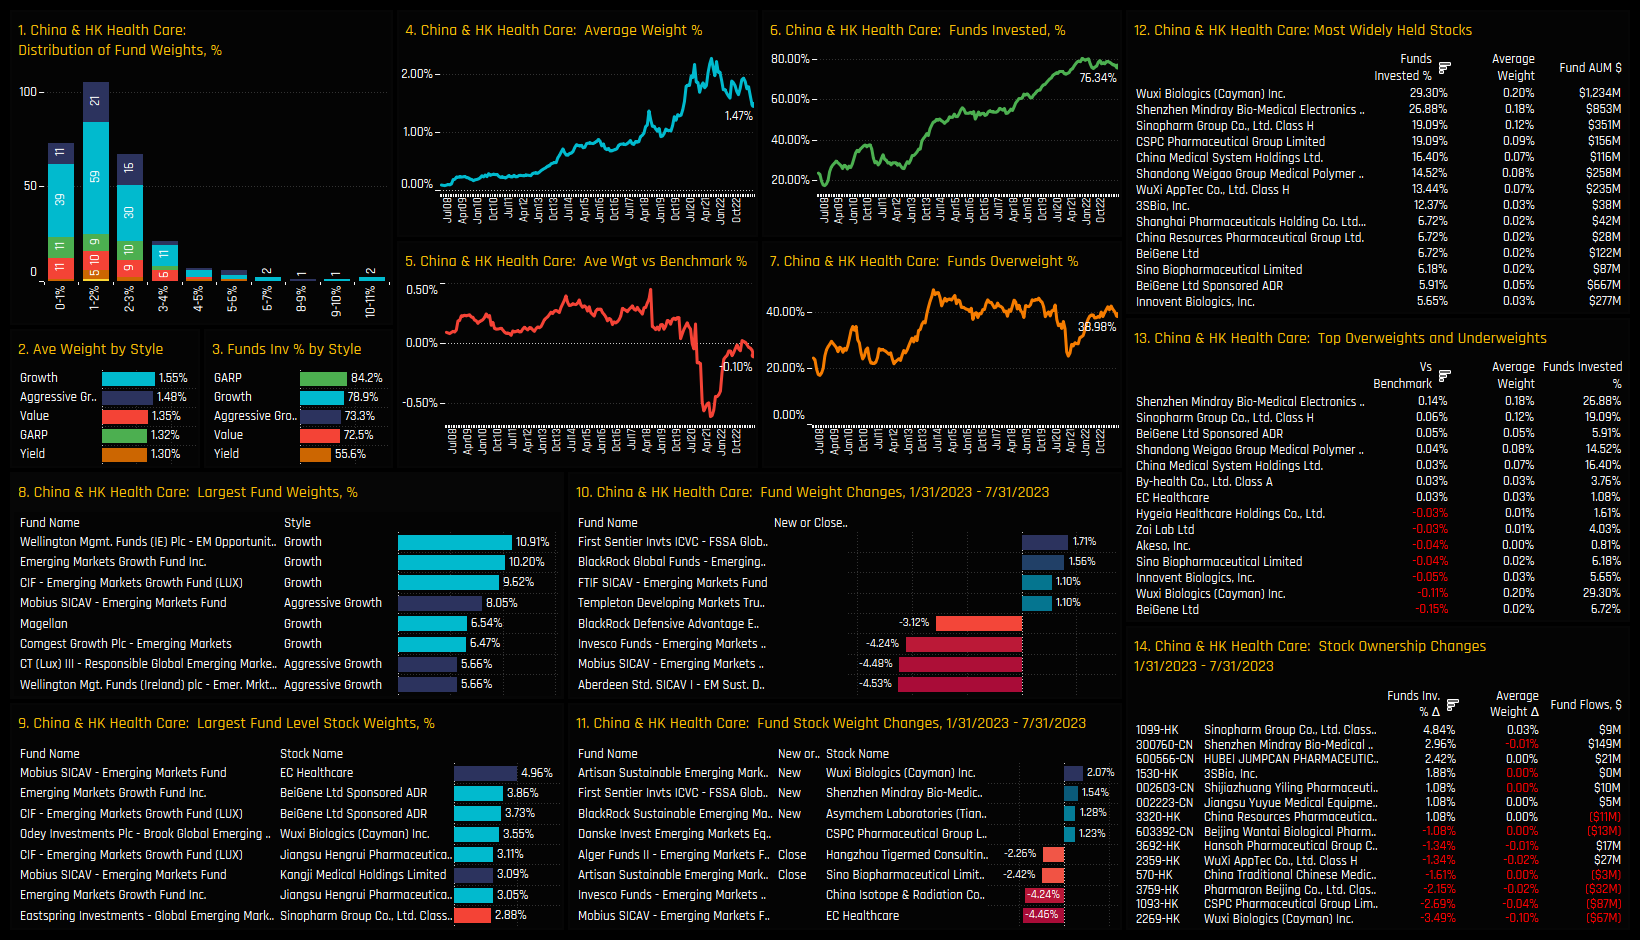
High Positioning & Low Momentum: China & HK Health Care
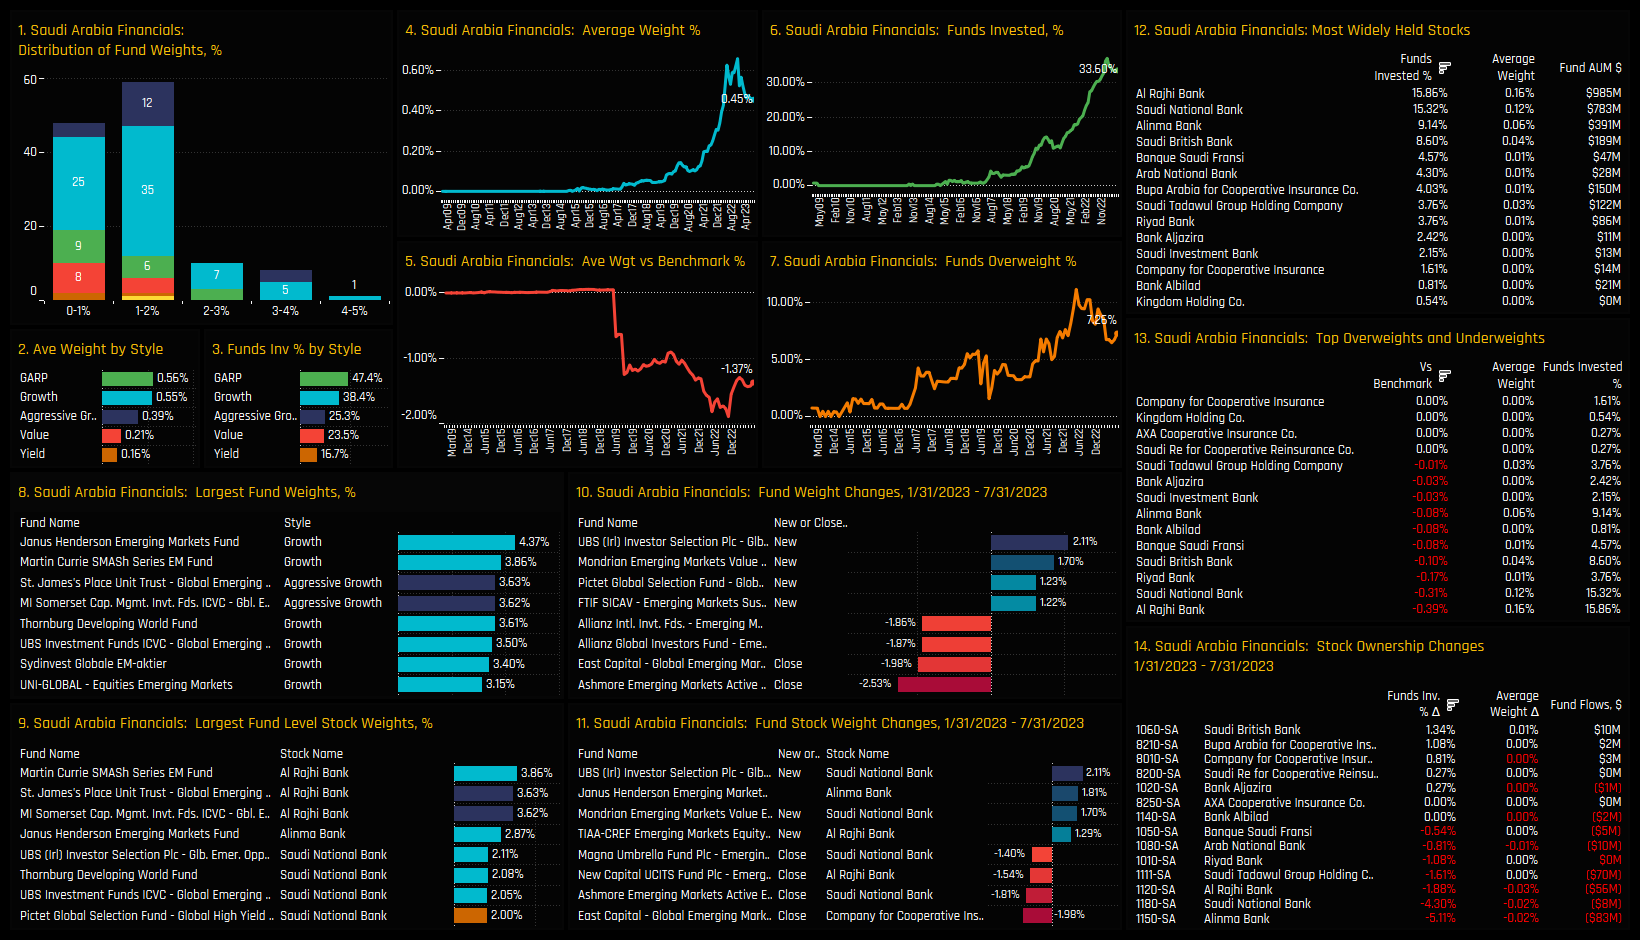
High Positioning & Low Momentum: Saudi Financials
Low Positioning & Low Momentum: South African Materials
Low Positioning & Low Momentum: Taiwan Financials
Low Positioning & Low Momentum: South Africa Industrials
Low Positioning & High Momentum: South Korea Consumer Discretionary
Low Positioning & High Momentum: Brazil Communication Services
372 emerging market Funds, AUM $423bn
Climbing the Ranks: Record Ownership in Taiwan's Emerging Six
We like to screen for stocks at the extreme ends of their ownership range. It highlights to us a particular state of conviction, whether positive or negative among the stocks in our EM analysis. On this score, a select group of Taiwanese companies have caught our eye this month.
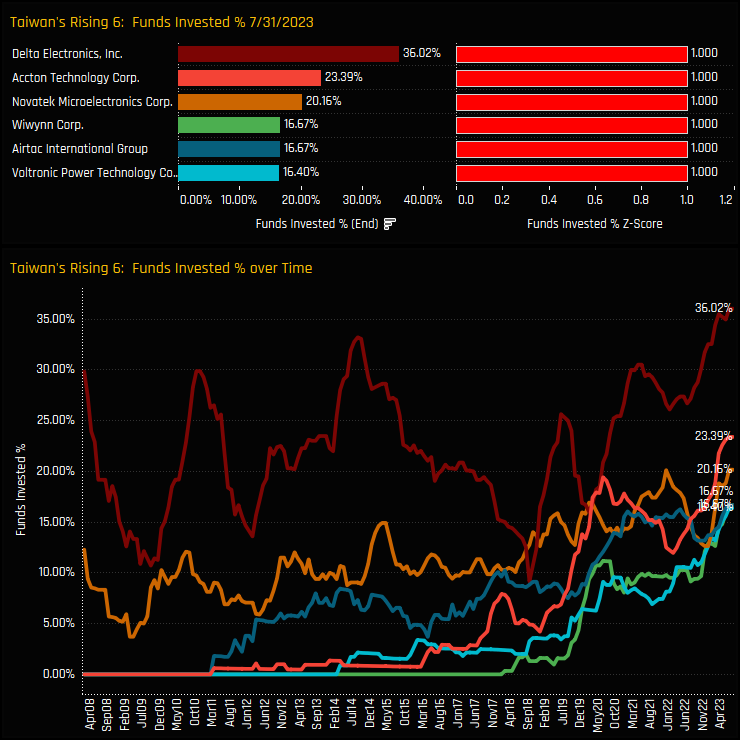
Taiwan's Emerging Six
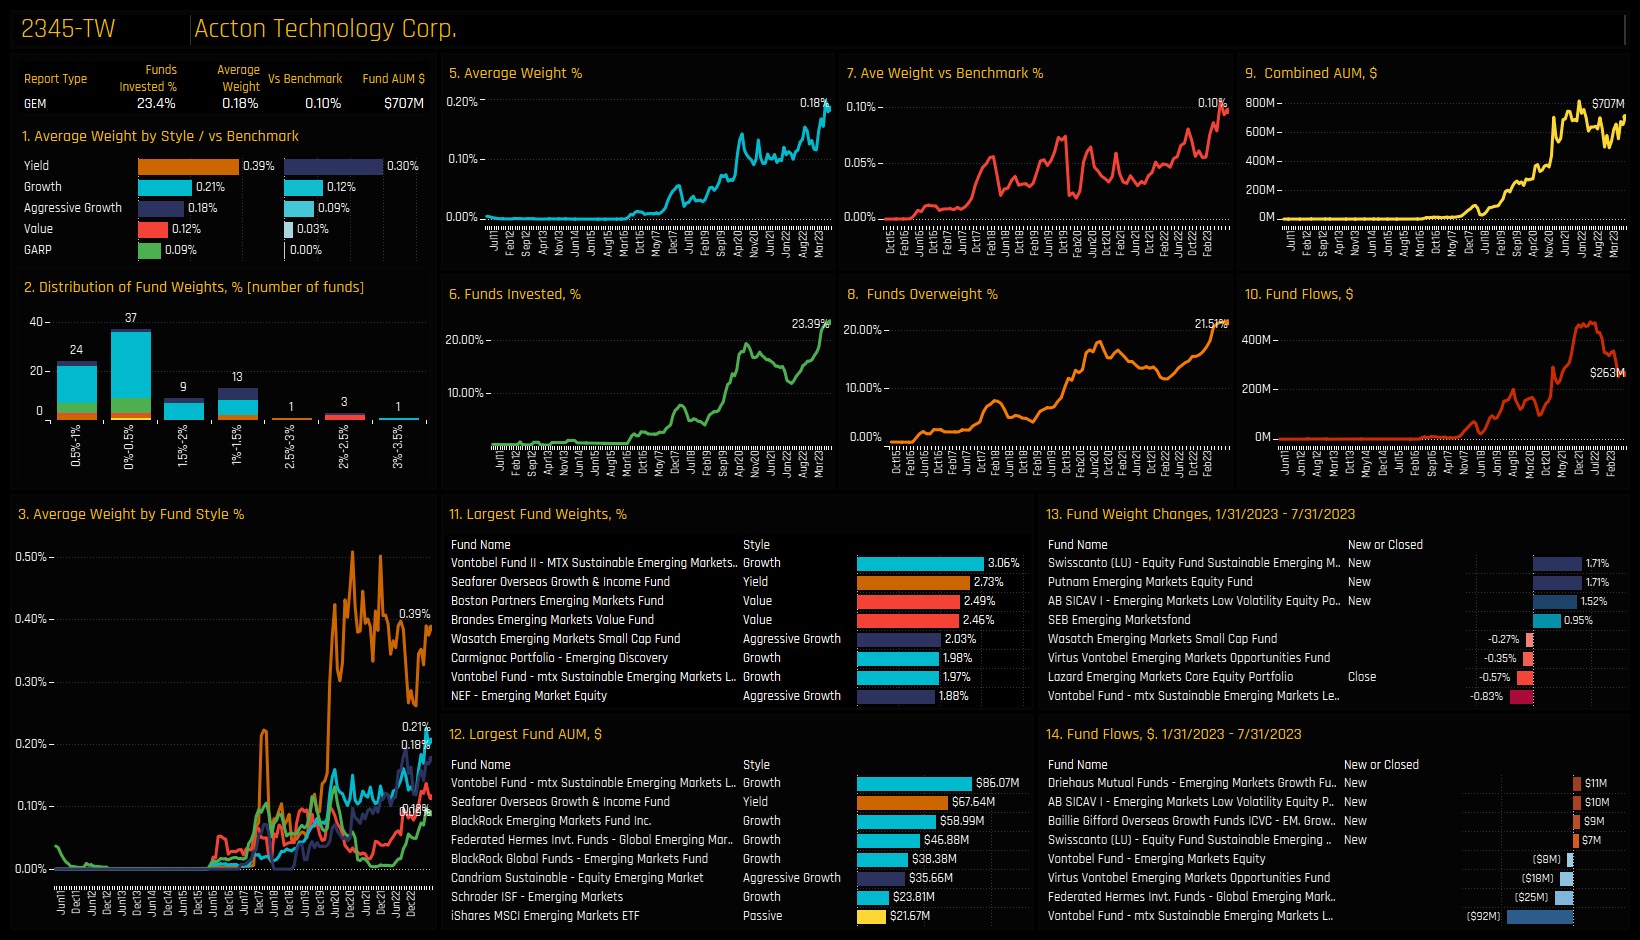
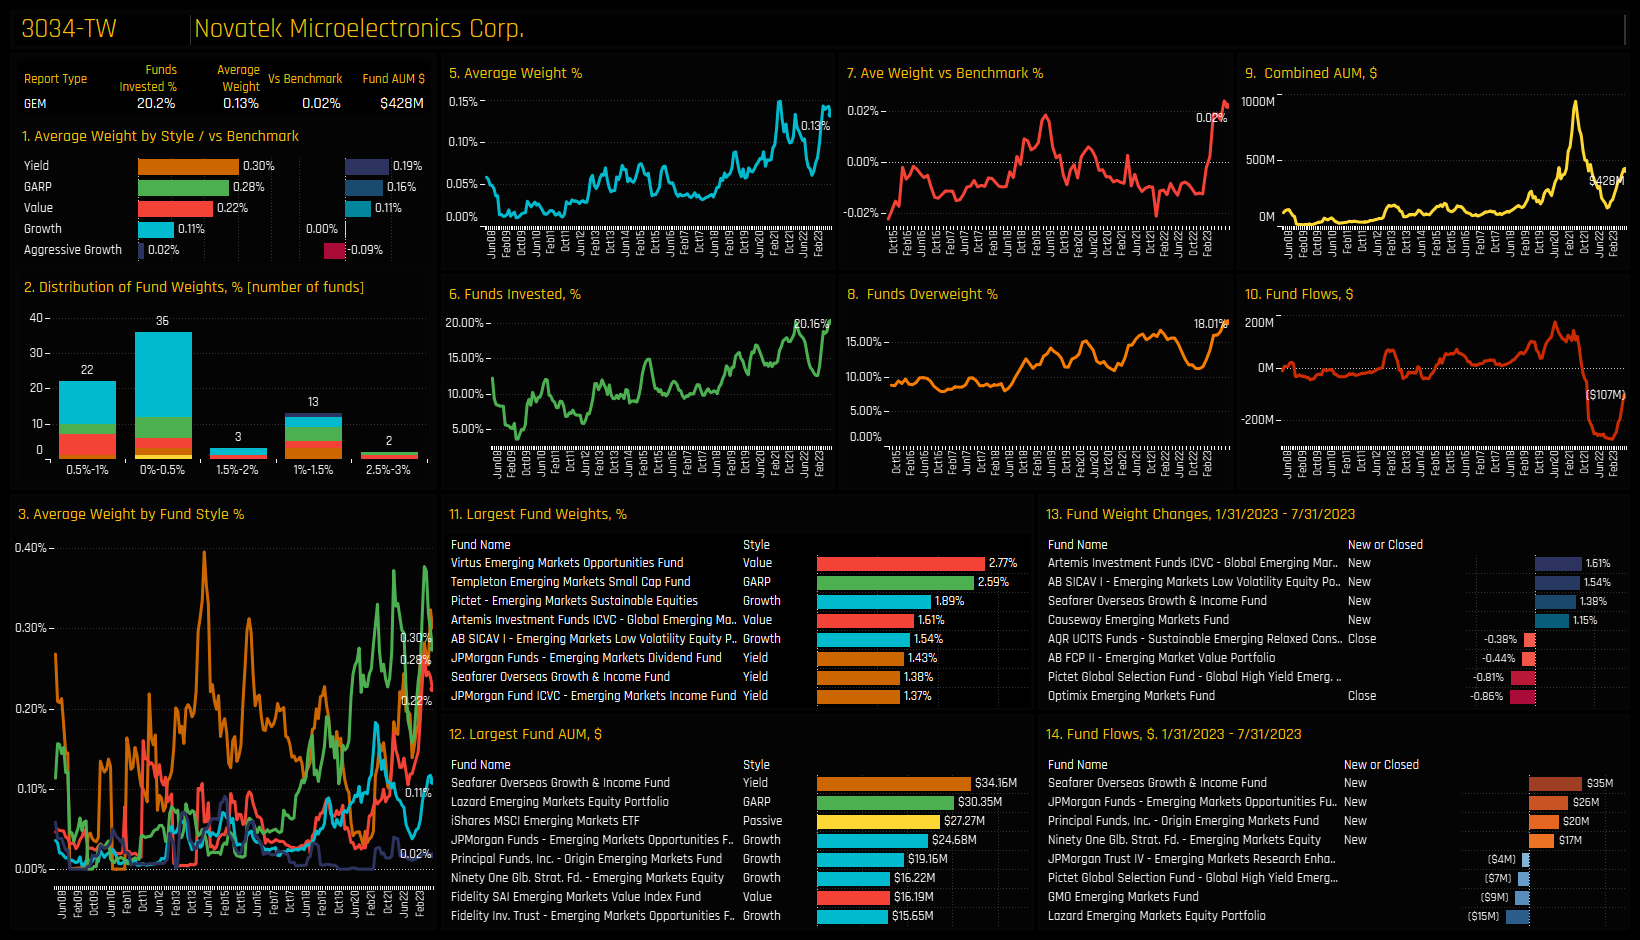
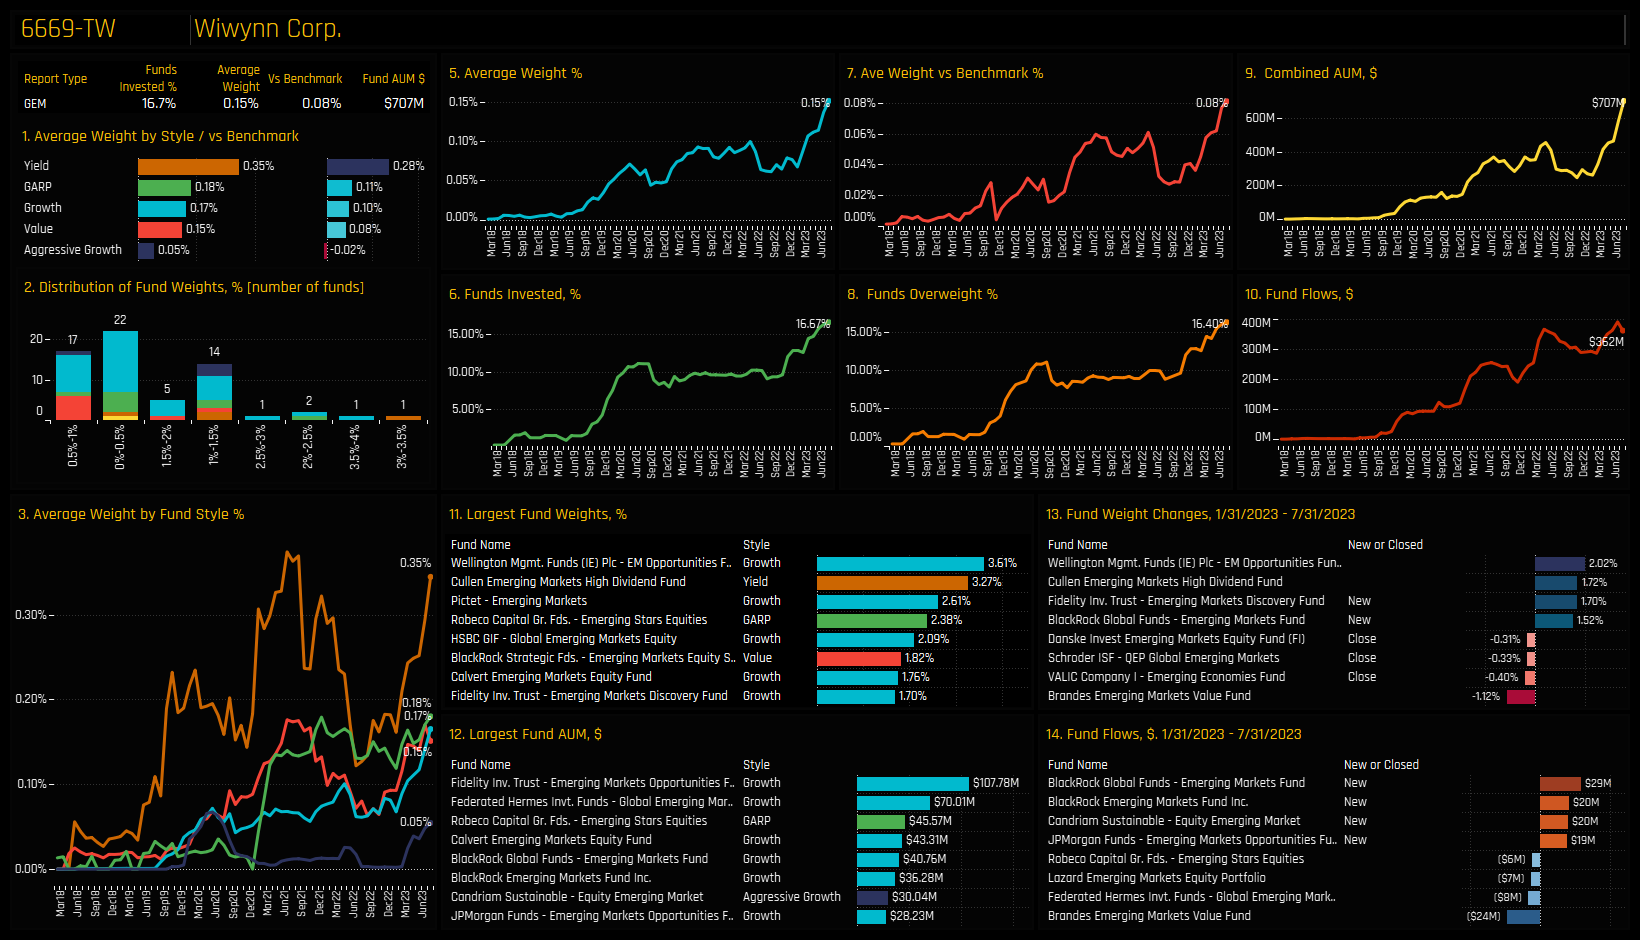
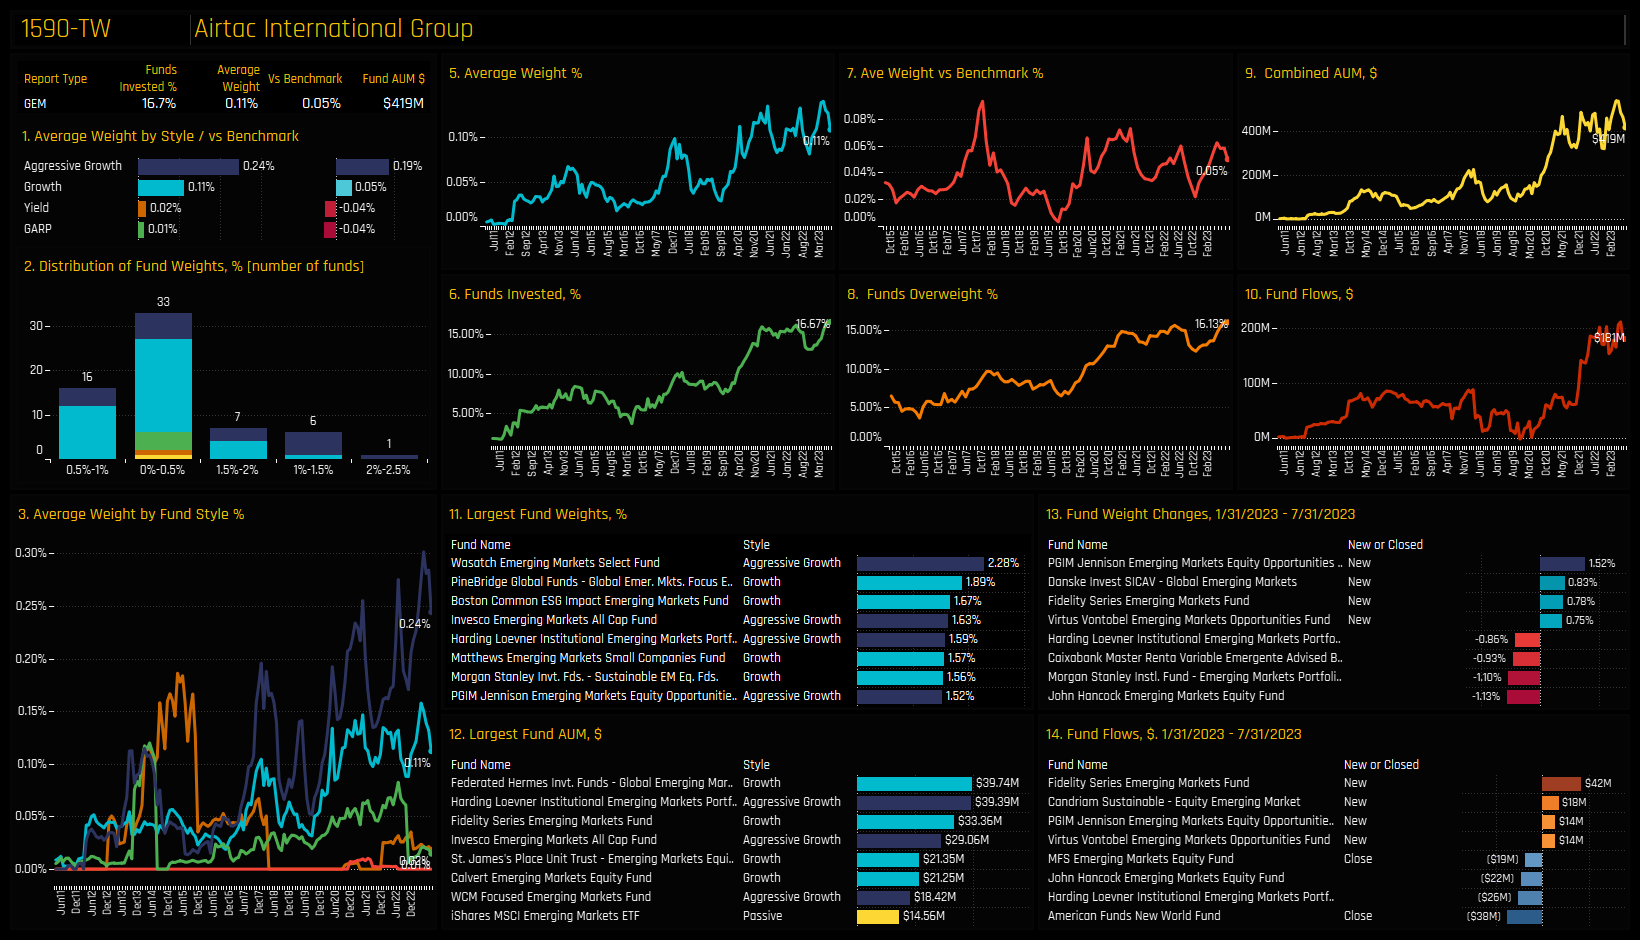
The 6 stocks listed in the top chart below are all at record levels of ownership among the active GEM funds in our analysis. They are led by Delta Electronics, a company owned by a record 36% of funds and with a recent surge of buying breaking through the previous ownership highs of 2014. Wiwynn Corp and Voltronic Power Technology Co have seen the path of investment growth move higher over a much shorter period. But to make this list, all must have captured investment from funds who have never invested before, and all must have seen an excess of opening positions over closing positions in recent months.
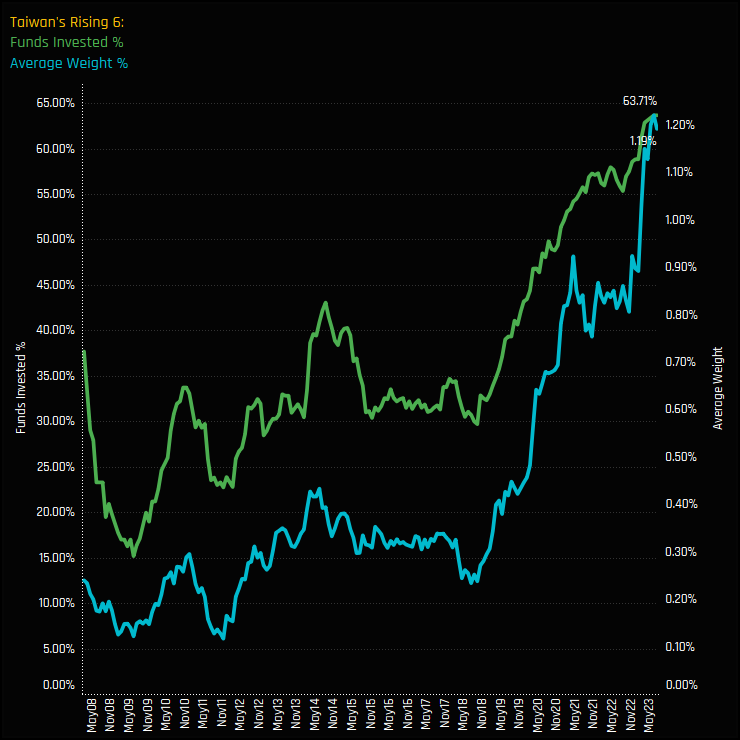
The charts below show how in combination, these 6 stocks have gained in significance within EM portfolios in recent years. The combined average weight has spiked higher to 1.19%, with 63.7% of funds holding at least 1 of the 6 companies listed. To provide the granular detail behind these moves, scroll down for profiles of the 6 companies listed, which show the key holders, the funds opening new positions and the major fund flows over the last 6-months.
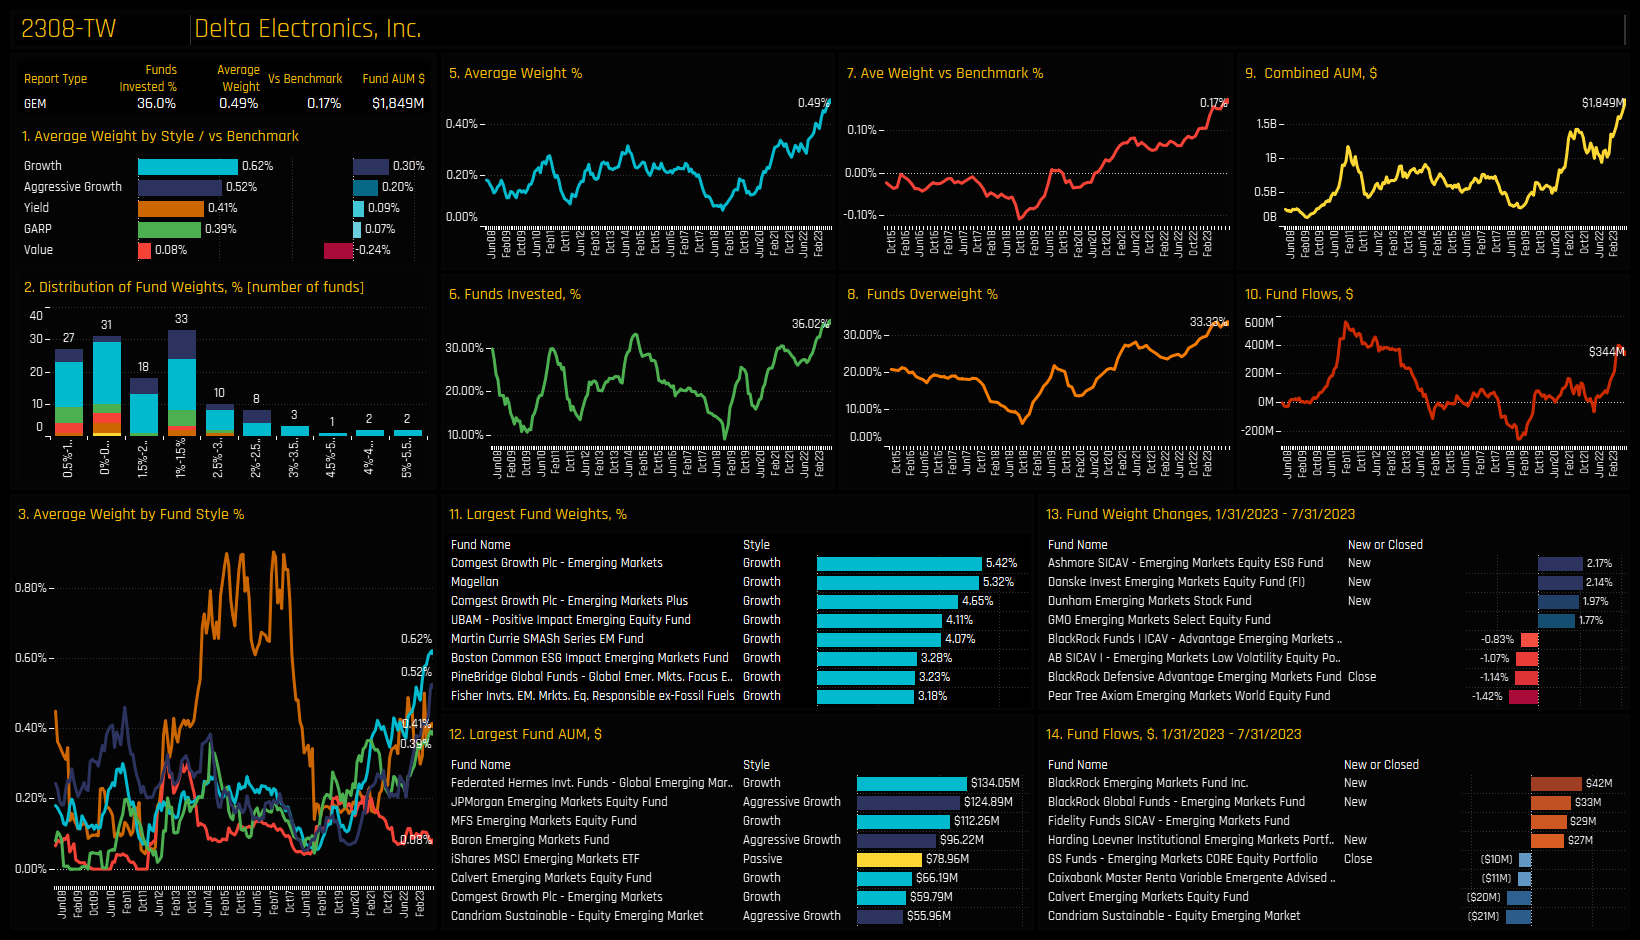
Stock Profile: Delta Electronics
Stock Profile: Accton Technology
Stock Profile: Novatek Microelectronics
Stock Profile: Wiwynn Corp
Stock Profile: Airtac International Group
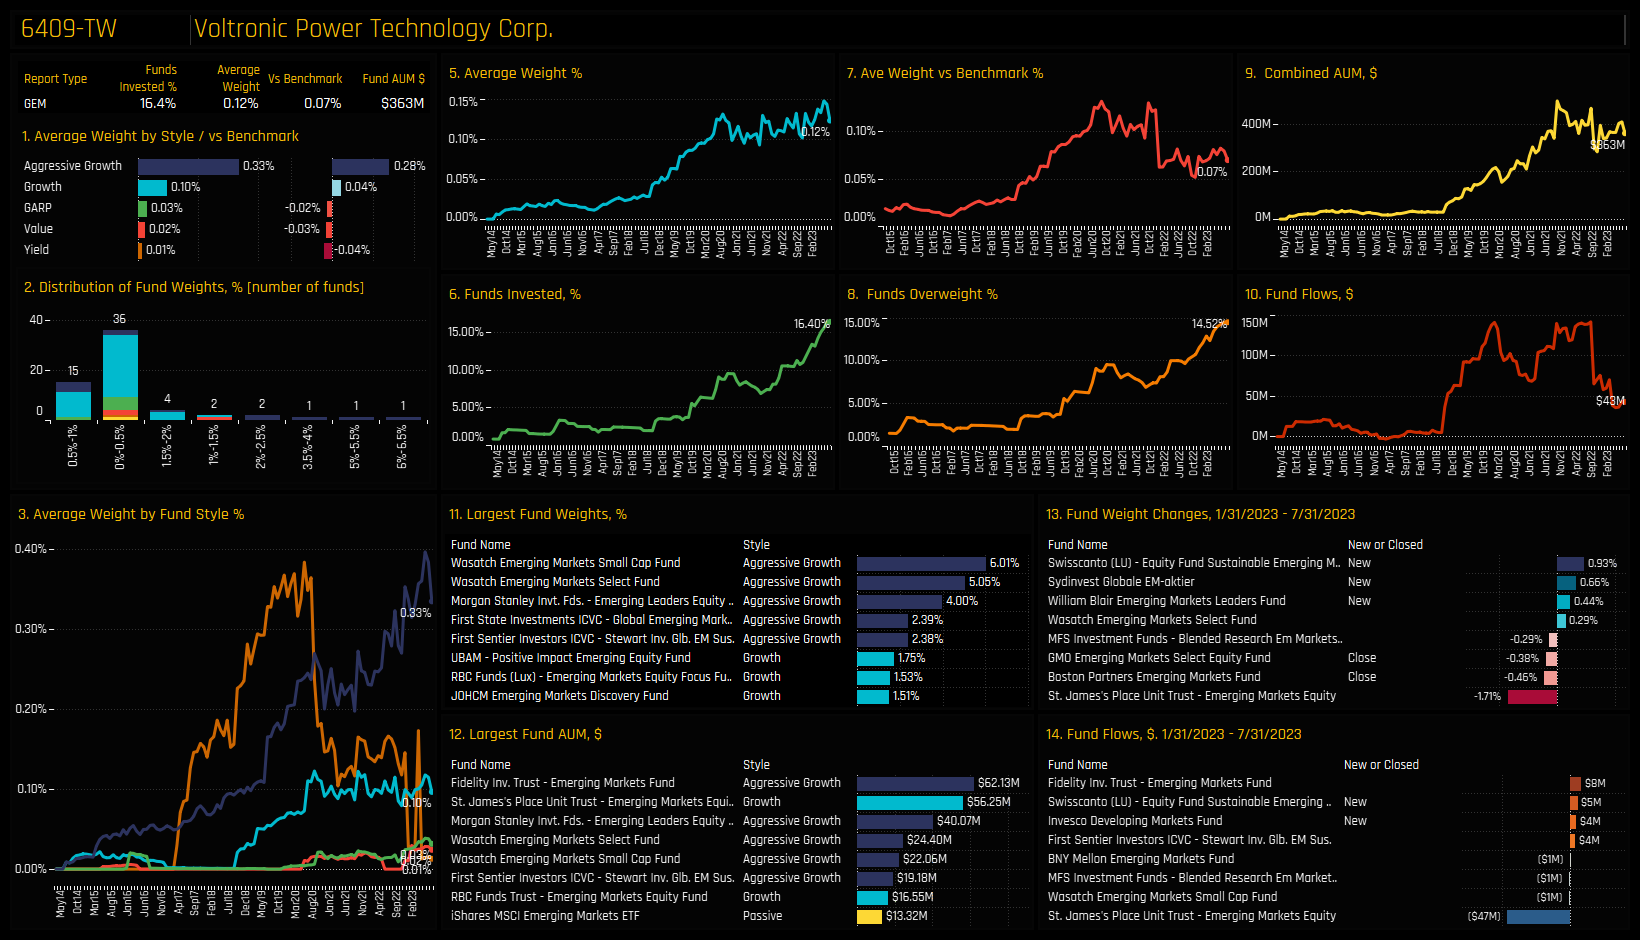
Stock Profile: Voltronic Power Technology Corp
372 emerging market Funds, AUM $423bn
GEM Active Funds Ownership Report
Please click on the link below for the full data report on Global EM active fund positioning
For more analysis, data or information on active investor positioning in your market, please get in touch with me on steven.holden@copleyfundresearch.com
Investor Positioning Report — Copley Fund Research Ltd · Last updated: July 2026 · Registered in England and Wales
1. Who we are
Copley Fund Research Ltd provides proprietary institutional fund intelligence to listed companies and investor relations professionals. These terms govern every purchase of an Investor Positioning Report. By completing a purchase you confirm you have read, understood, and agreed to these terms in full.
2. What you are purchasing
The Investor Positioning Report is a bespoke PDF report mapping the institutional fund universe around your stock. It covers current investors, past investors, competitor investors, and white space investors. Every report is built from scratch for the specific company ordered and is not a standardised or templated product.
3. Delivery and process
Following payment or invoice issuance, Copley Fund Research will contact you within one working day to agree your competitor set. Production begins once the competitor set is confirmed in writing. The completed report will be released to you within 48 hours of production starting, provided payment has been received in full; where payment is outstanding, the report will be withheld until payment clears. If the requested company falls outside our covered fund universes, or a competitor set cannot be agreed, Copley Fund Research will issue a full refund or cancel the outstanding invoice.
4. Competitor set agreement
The competitor set is agreed with you in writing prior to production, and the report is built to that agreed specification. Requests to amend the competitor set after delivery, based on a change of preference rather than an error, may be treated as a new order.
5. Refund policy
Because each report is produced individually for your company, orders are non-refundable once production has begun, except as set out in clauses 3 and 5a below. By purchasing, you agree not to dispute the charge with your card provider on the basis that the service was not as described, provided the report has been delivered to the agreed specification or corrected under clause 5a.
5a. Quality remedy
If a delivered report contains a material error caused by Copley Fund Research — for example, an incorrect company analysed, a competitor omitted from the agreed set, or content missing from the specification in clause 2 — Copley Fund Research will correct and redeliver the report at no additional charge, within a reasonable timeframe. This is your sole remedy for such errors.
6. Data and accuracy
All fund positioning data in the report reflects holdings as disclosed at the most recently available reporting date at the time of compilation. The timing of fund holdings disclosures is determined by regulatory requirements applicable to each fund and is outside the control of Copley Fund Research Ltd. This data may not reflect current fund positions. Copley Fund Research takes reasonable care to ensure accuracy but makes no warranty, express or implied, as to the completeness or current accuracy of the underlying data — though this does not affect the quality remedy in clause 5a for errors in how that data was analysed or presented. Past fund positioning is not indicative of future fund behaviour or investment decisions.
7. Not investment advice
The Investor Positioning Report is produced for investor relations intelligence purposes only. It does not constitute investment advice, financial advice, or a recommendation to buy, hold, or sell any security. The data reflects historical fund positioning and must not be relied upon as a prediction of future fund behaviour or investment decisions. Copley Fund Research Ltd is not authorised or regulated by the Financial Conduct Authority for the provision of investment advice.
8. Permitted use and confidentiality
The report is licensed for internal use by the purchasing organisation only. You may share it with employees and directors of your organisation. You may not: reproduce, redistribute, publish, or resell the report or any part of it; share it with any third party outside your organisation without prior written consent; use the fund or portfolio manager names contained in the report to approach those individuals on behalf of Copley Fund Research or in a manner that could damage Copley Fund Research's relationships with those funds; or use the data for any purpose other than your own investor relations strategy. The data, analysis, and methodology contained in the report are the intellectual property of Copley


