In this issue:
Q1 Performance & Attribution
Internet Retail: EM Funds Raise Overweights
Poland: Momentum Building
TSMC: Crowded Trade?
384 emerging market Funds, AUM $400bn
Q1 Performance & Attribution
The latest stats on performance and the drivers of performance for Q1 2023.
Q1 Performance Summary
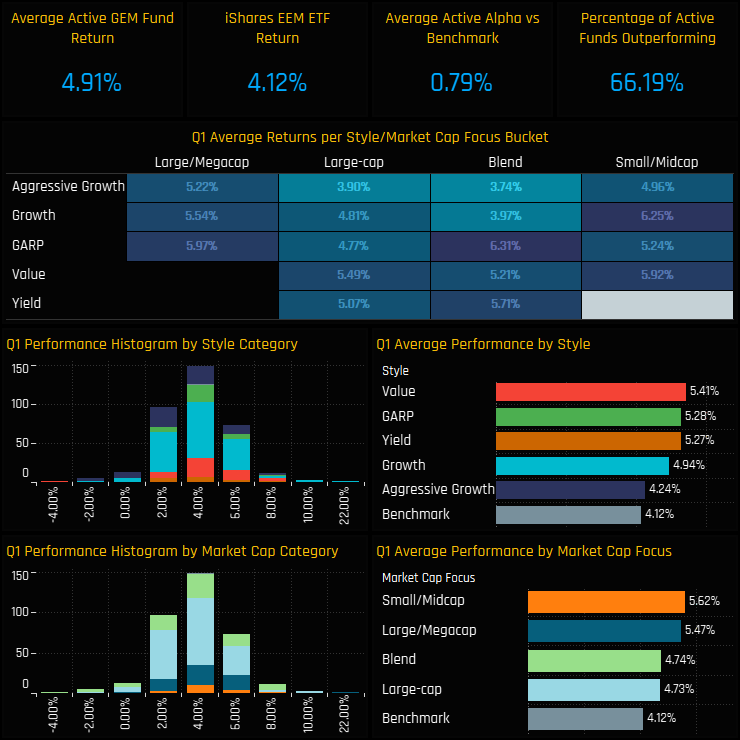
Active GEM managers have had a good start to the year. Average fund returns came in at 4.91%, ahead of the iShares EEM ETF by +0.79% and with 66.2% of the funds in our analysis outperforming. Returns were correlated to Style, with Value funds generating 5.41% on average versus Aggressive Growth 4.24%. On a Market Cap basis, Small/Midcap strategies and Large/Megacap were the best performers.
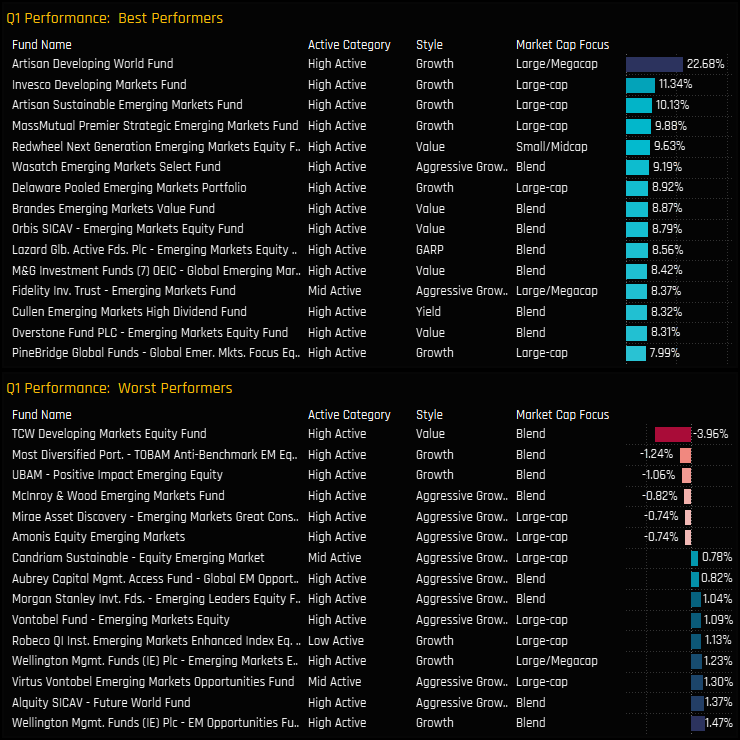
The range of returns was mainly contained between 2% and 8% on the quarter, but there were a small number of funds who fell either side of that range. Artisan Developing World was a significant outlier on the upside, posting 22.7% returns, whilst TCW Developing Markets failed to break even, losing -3.96% over the period.
Portfolio Contribution
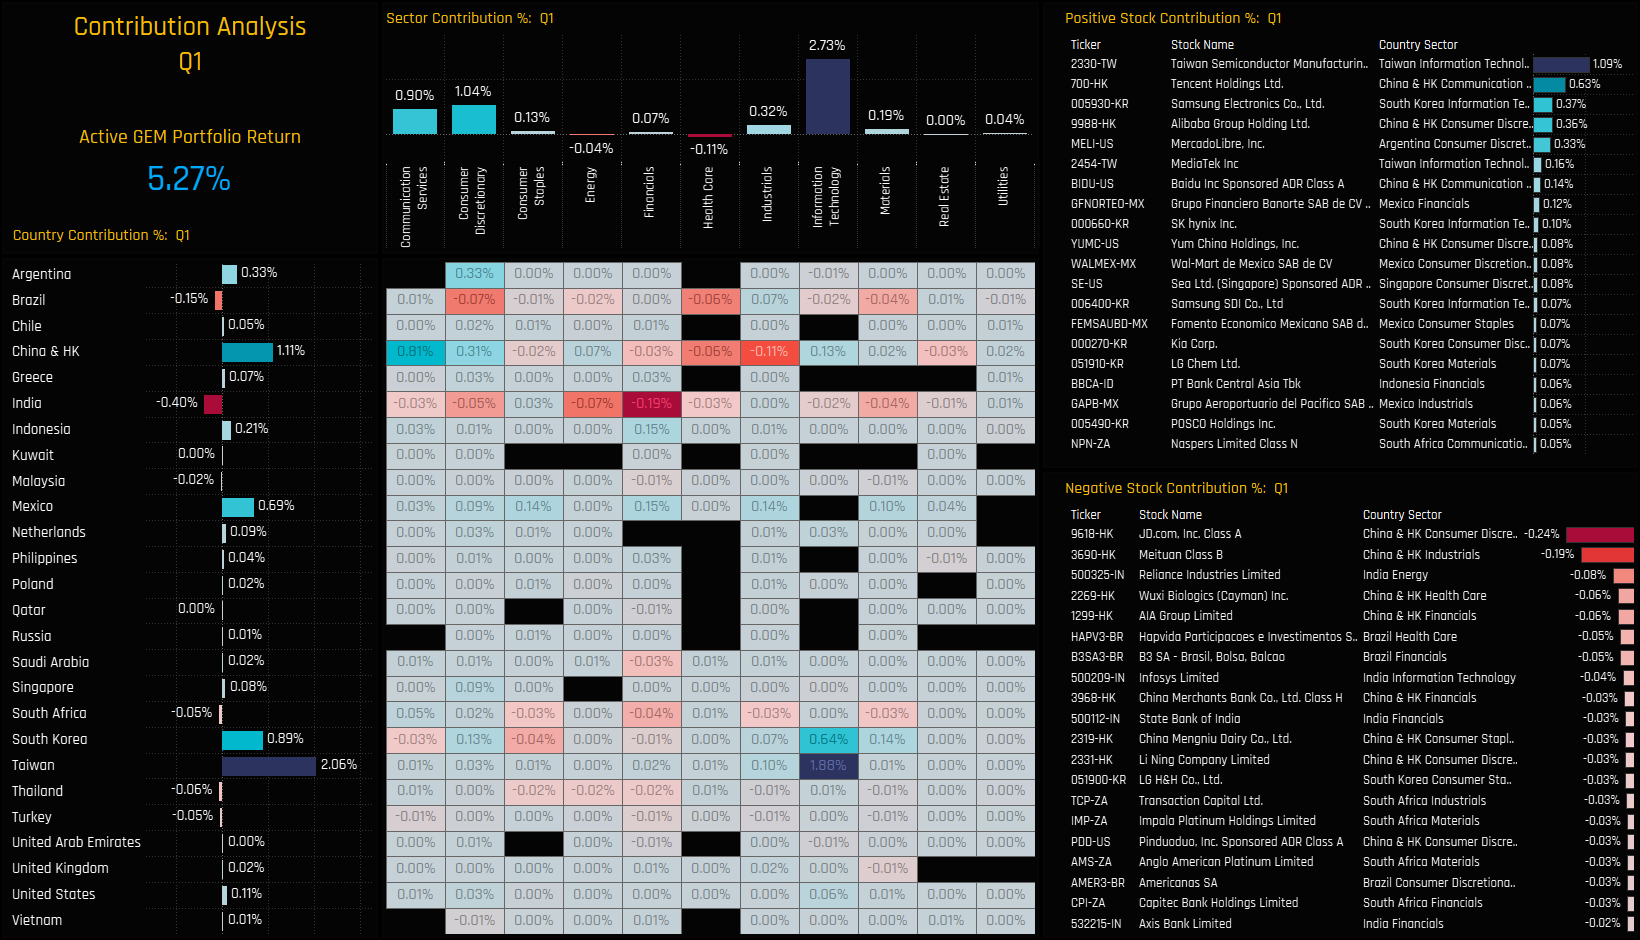
What were the drivers of these returns on the quarter across countries, sectors and stocks? The chart set below breaks down the performance of a portfolio based on the average holdings of the 384 active GEM funds in our analysis. This theoretical portfolio returned 5.27% in Q1, driven by Taiwan exposure (+2.06%), China & HK (+1.1%), South Korea (+0.89%) and Mexico (+0.69%). India (-0.4%) and Brazil (-0.15%) were the main detractors of performance. On a sector level, Information Technology contributed +2.73% to total returns, followed by Consumer Discretionary (+1.04%) and Communication Services (+0.9%).
Drilling down a level further, costly country/sectors were India Technology (-0.19%), China & HK Industrials (-0.11%) and Brazil Consumer Discretionary (-0.07%). The trio of Taiwan Tech (+1.88%), South Korean Tech (+0.64%) and China & HK Communication Services (+0.81%) accounted for 63% of total returns on the quarter. The key stocks driving performance can be seen in the right hand charts below, led by TSMC (+1.09%), Tencent (+0.63%) and Samsung Electronics (+0.37%) on the positive side, and JD.Com (-0.24%), Meituan (-0.19%) and Reliance Industries (-0.08%) on the negative.
Portfolio Attribution
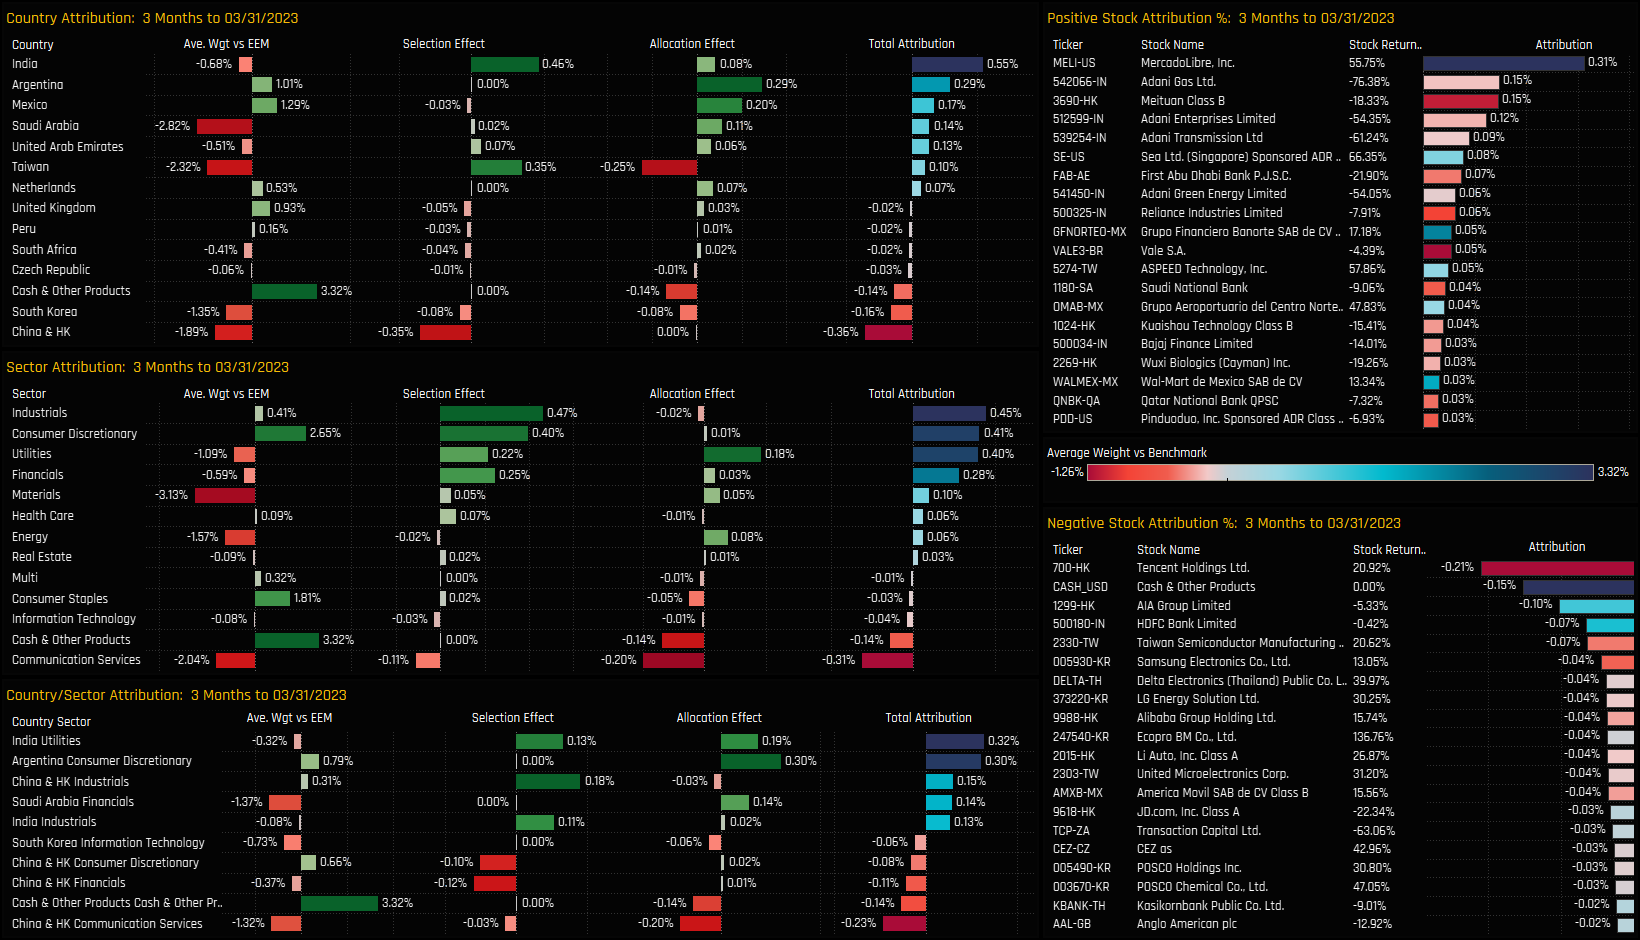
We perform attribution analysis on this portfolio versus a representation of the benchmark based on the iShares MSCI Emerging Markets ETF. The portfolio outperformed by +1.26% in Q1 2023, a summary of the key drivers are documented below.
What worked:
Underweights in Energy, Materials, India Utilities, Saudi Financials.
Overweights in Argentina and Mexico.
Stock selection in Consumer Discretionary, Industrials, India, Taiwan.
Underweights in Adani Group of Companies, Meituan, First Abu Dhabi Bank.
Overweights in MercadoLibre, Sea Ltd, Grupo Financiero Banorte.
What didn’t:
Underweights in Comm’ Services, Taiwan, South Korea
Overweights in India Financials, Cash, Consumer Staples
Stock Selection in China Industrials, Singapore, South Korea
Overweights in AIA Group, HDFC Bank Limited.
Underweights in Tencent, TSMC, Samsung Electronics
384 emerging market Funds, AUM $400bn
Internet Retail: EM Funds Raise Overweights
The percentage of funds positioned overweight the Internet Retail sector hits record highs
Time-Series & Industry Positioning
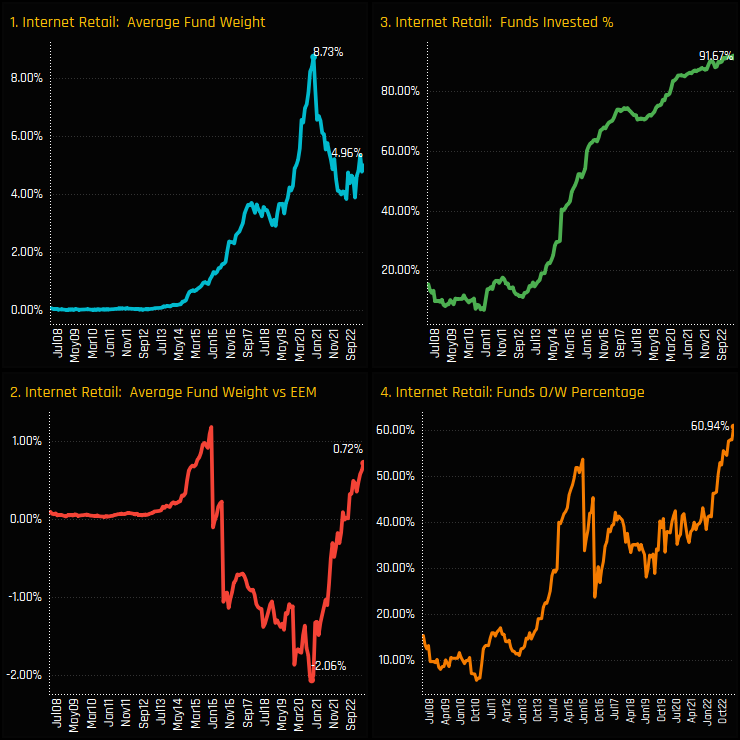
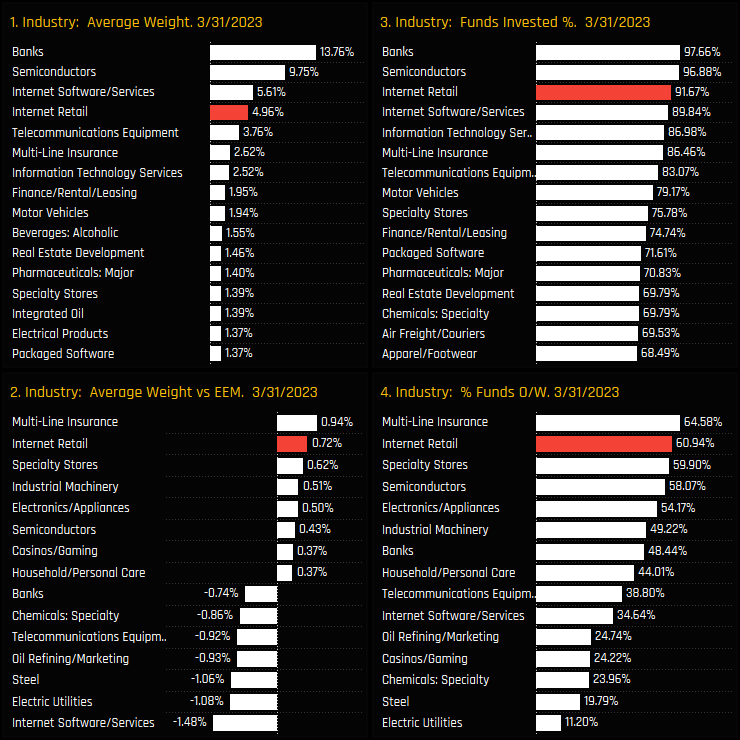
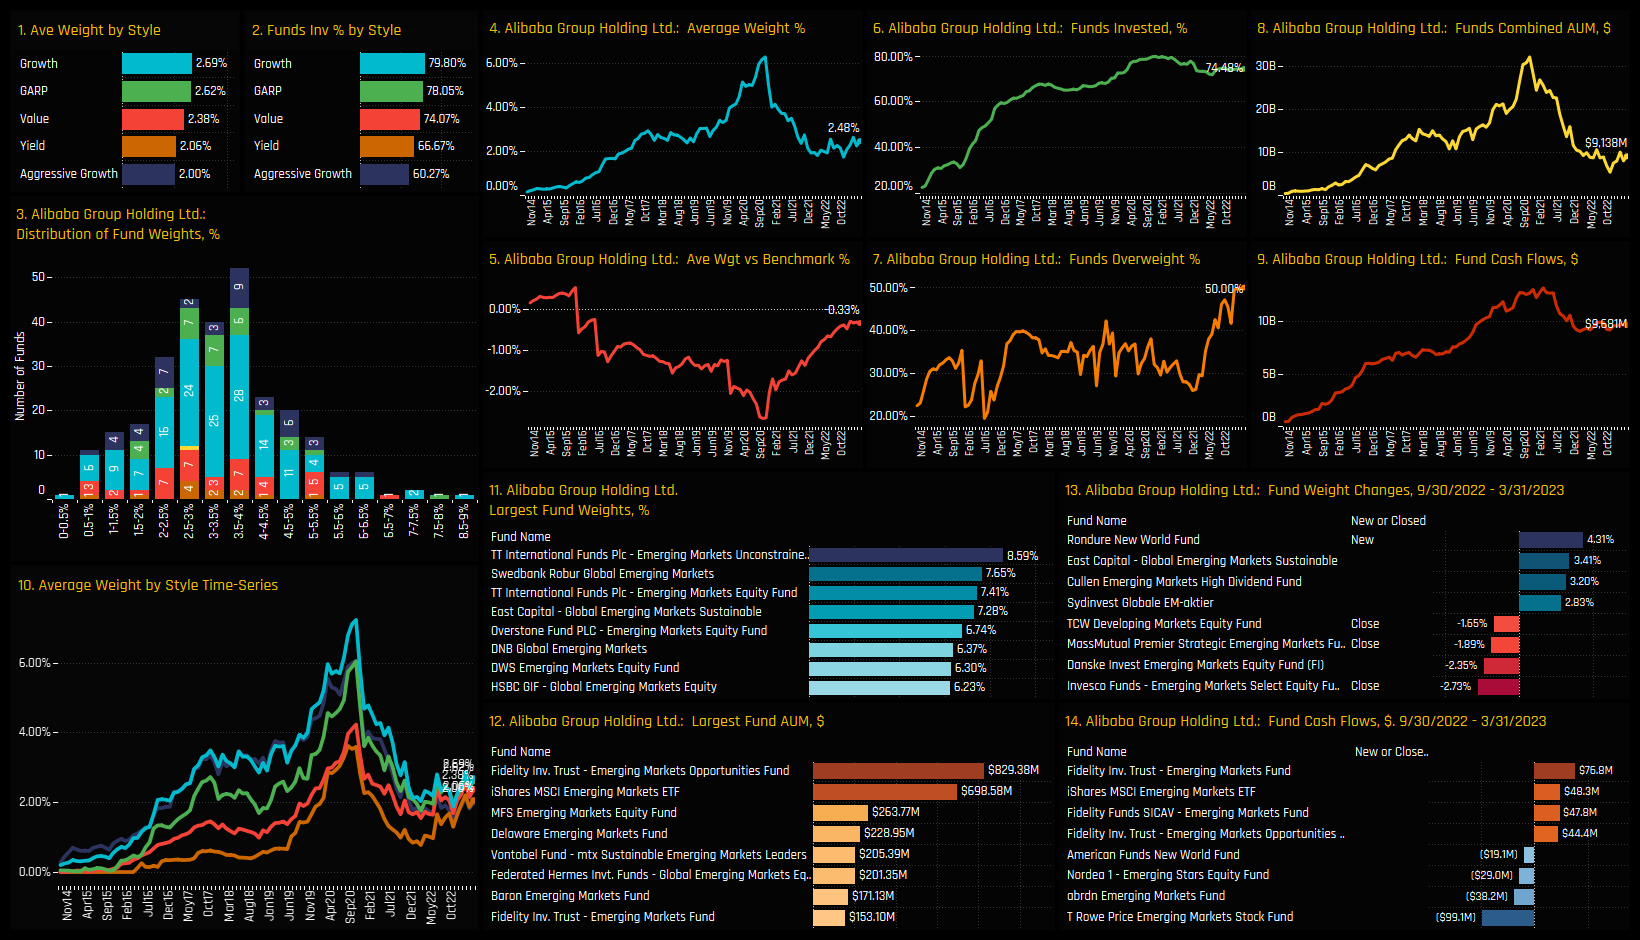
The percentage of funds overweight the Internet Retail sector is at record highs. Active EM managers have moved from a net underweight of -2.04% in September 2020 to an overweight of +0.72% at the end of last month (ch2), with 60.9% of funds overweight the iShares EEM ETF benchmark – an all-time high (ch4). Outright ownership of 91.7% is also the highest on record (ch2), though average weights are some way from the peak of 8.7% in October 2020.
Internet Retail is in the top echelons of industry positioning among active EM funds on both an absolute and relative basis. It is the 3rd most widely held industry group after Banks and Semiconductors (ch3) and the 4th largest average weight after Internet Software/Services (ch1). After Multi-Line Insurance, Internet retail is the second largest overweight industry group among active EM investors.
Fund Holdings & Activity
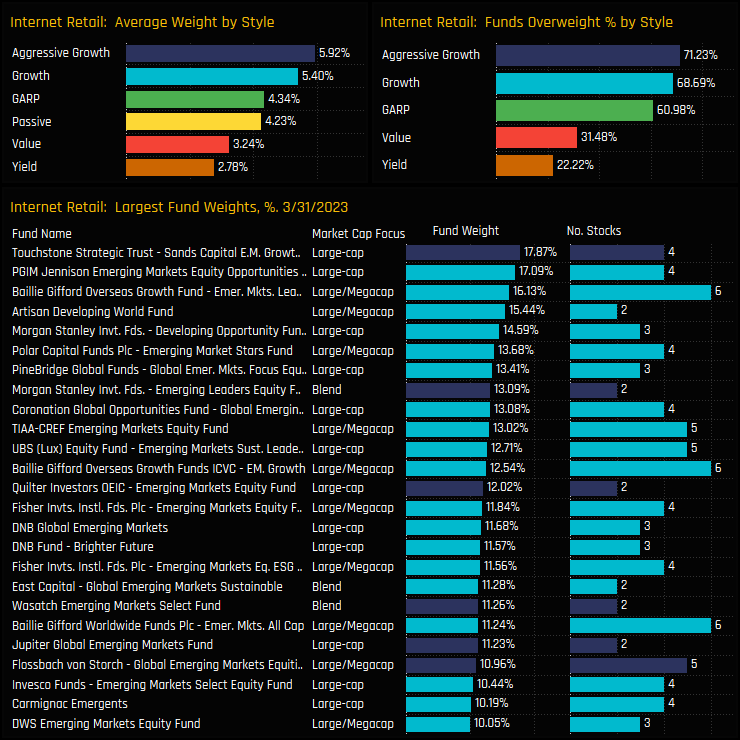
Fund exposure to the Internet Retail sector is highly correlated to Style, with Aggressive Growth and Growth funds ahead of Value and Yield on both a funds overweight % and average weight basis. Top holders are led by Touchstone Sands EM Growth (17.9%) and PGIM Jennison EM Opportunities (17.1%), who head a long list of high growth strategies with significant overweight positions in the sector.
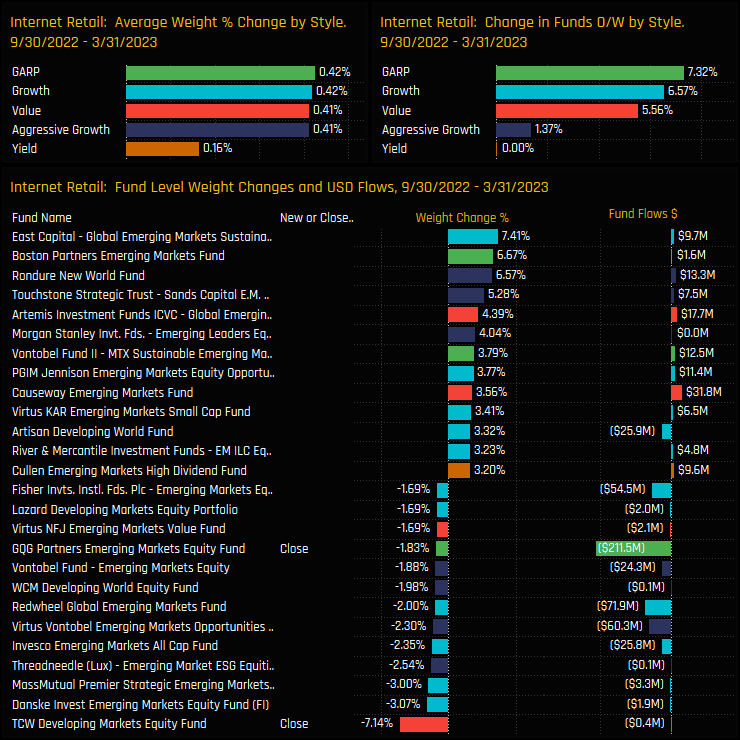
Over the last 6-months, average weights increased across all Style groups, with all but Yield funds seeing an increase in overweight positioning. The larger increases were led by East Capital EM Sustainable (+7.41%) and Boston Partners EM (+6.7%), though closures from TCW Developing Markets (-7.14%) and GQG Partners (-1.8%) provided some balance.
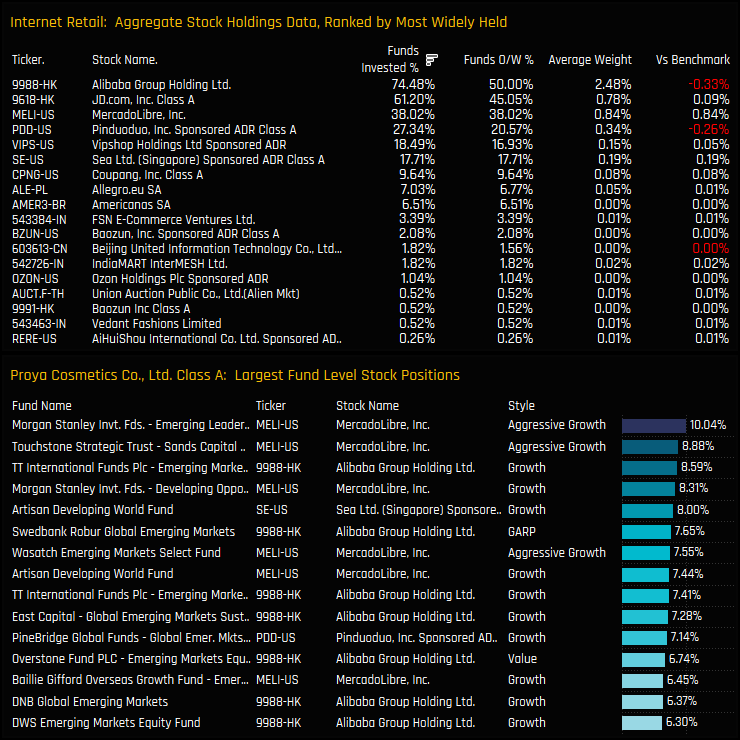
Stock Holdings & Activity
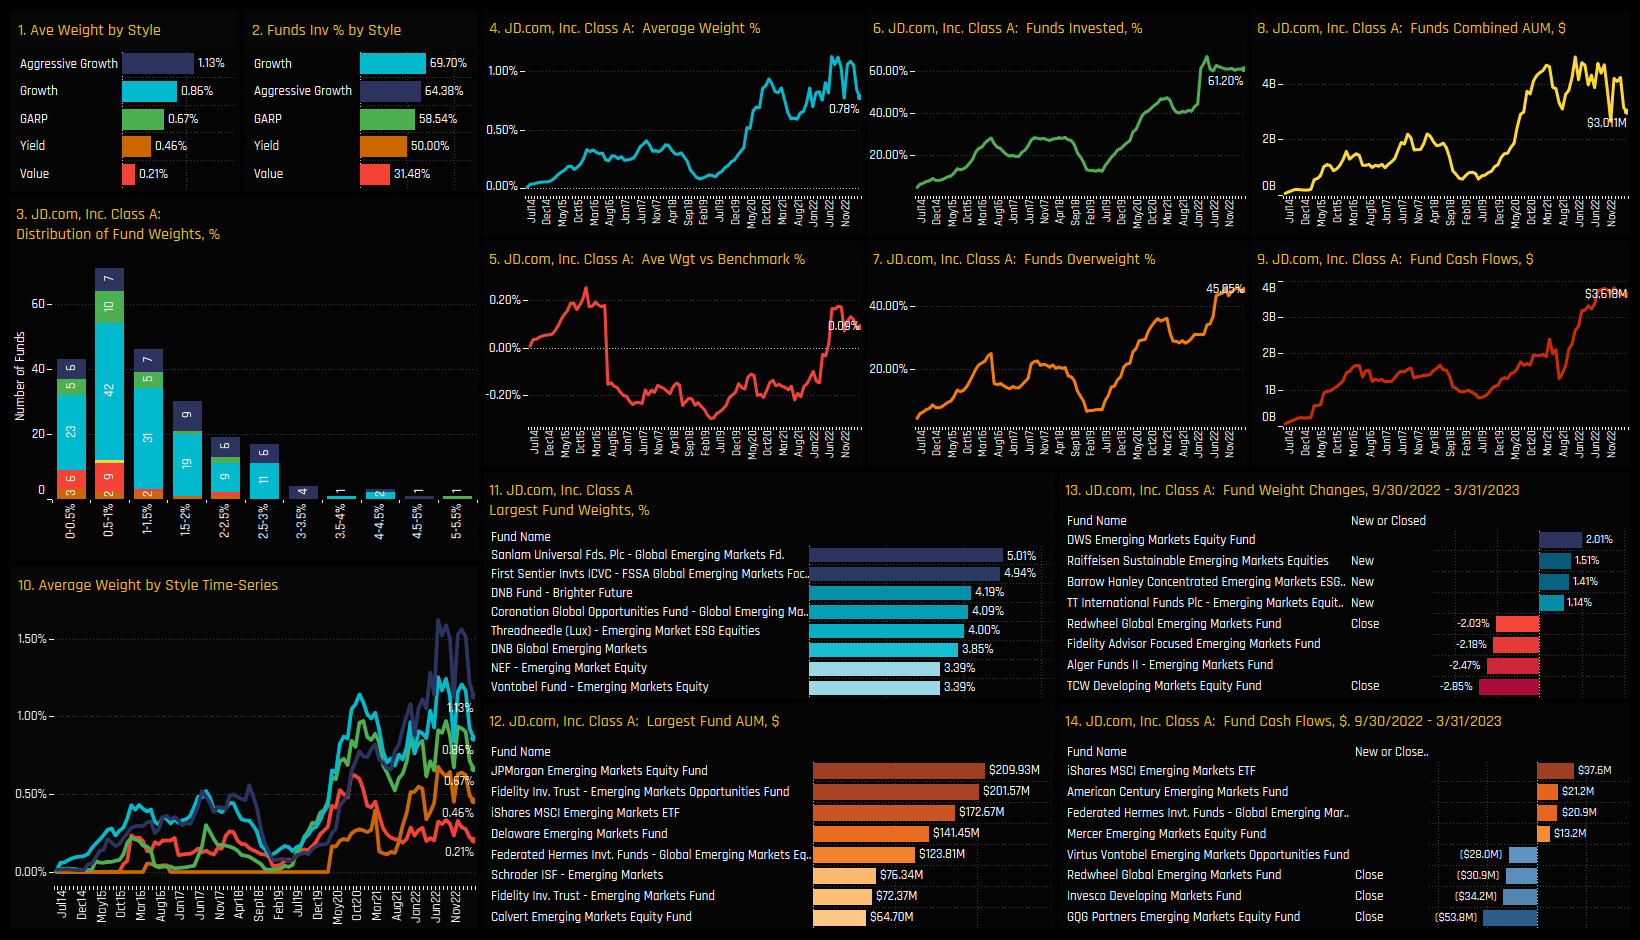
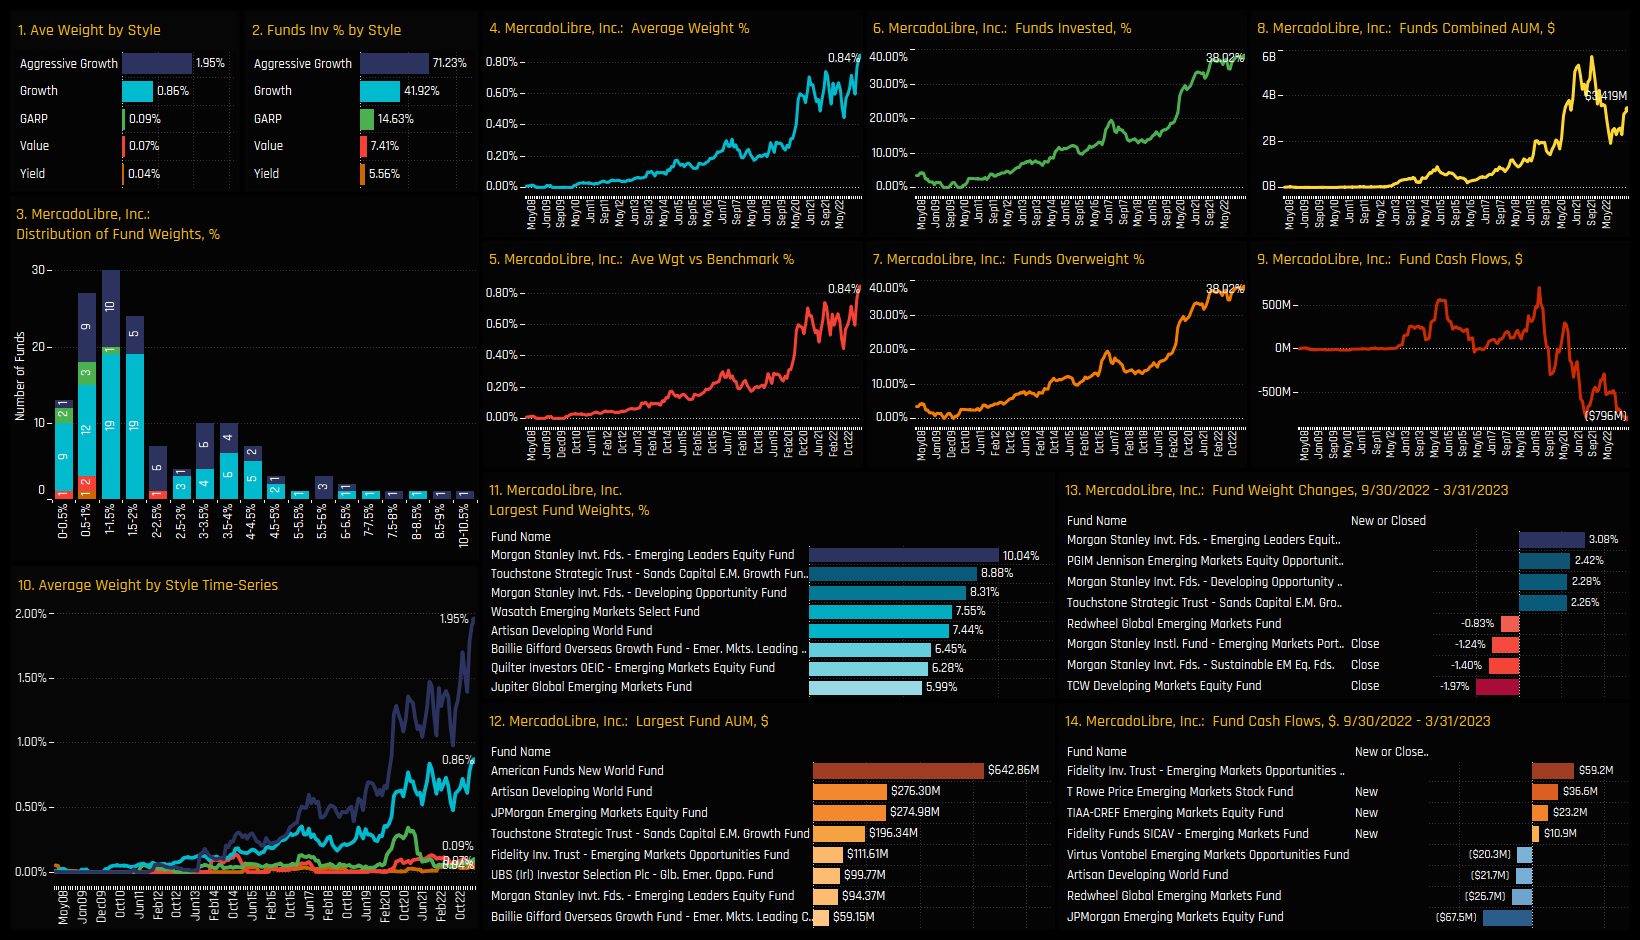
The most widely held stock in the Internet Retail space is Alibaba Group Holdings by quite a distance. It is held by 74.5% of funds at an average weight of 2.48%. JD.Com is held by 61.2% of funds but at a lower weight of 0.78%. MercadoLibre is held by fewer funds but at a higher average weight of 0.84% due to some large positions from individual funds, led by Morgan Stanley EM Leaders (10%) and Touchstone Sands EM Growth (8.9%).
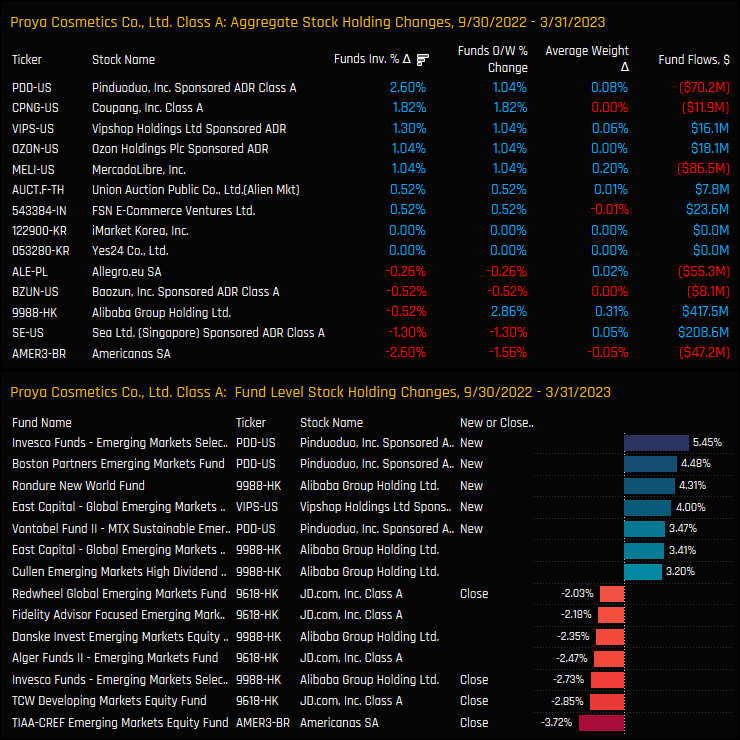
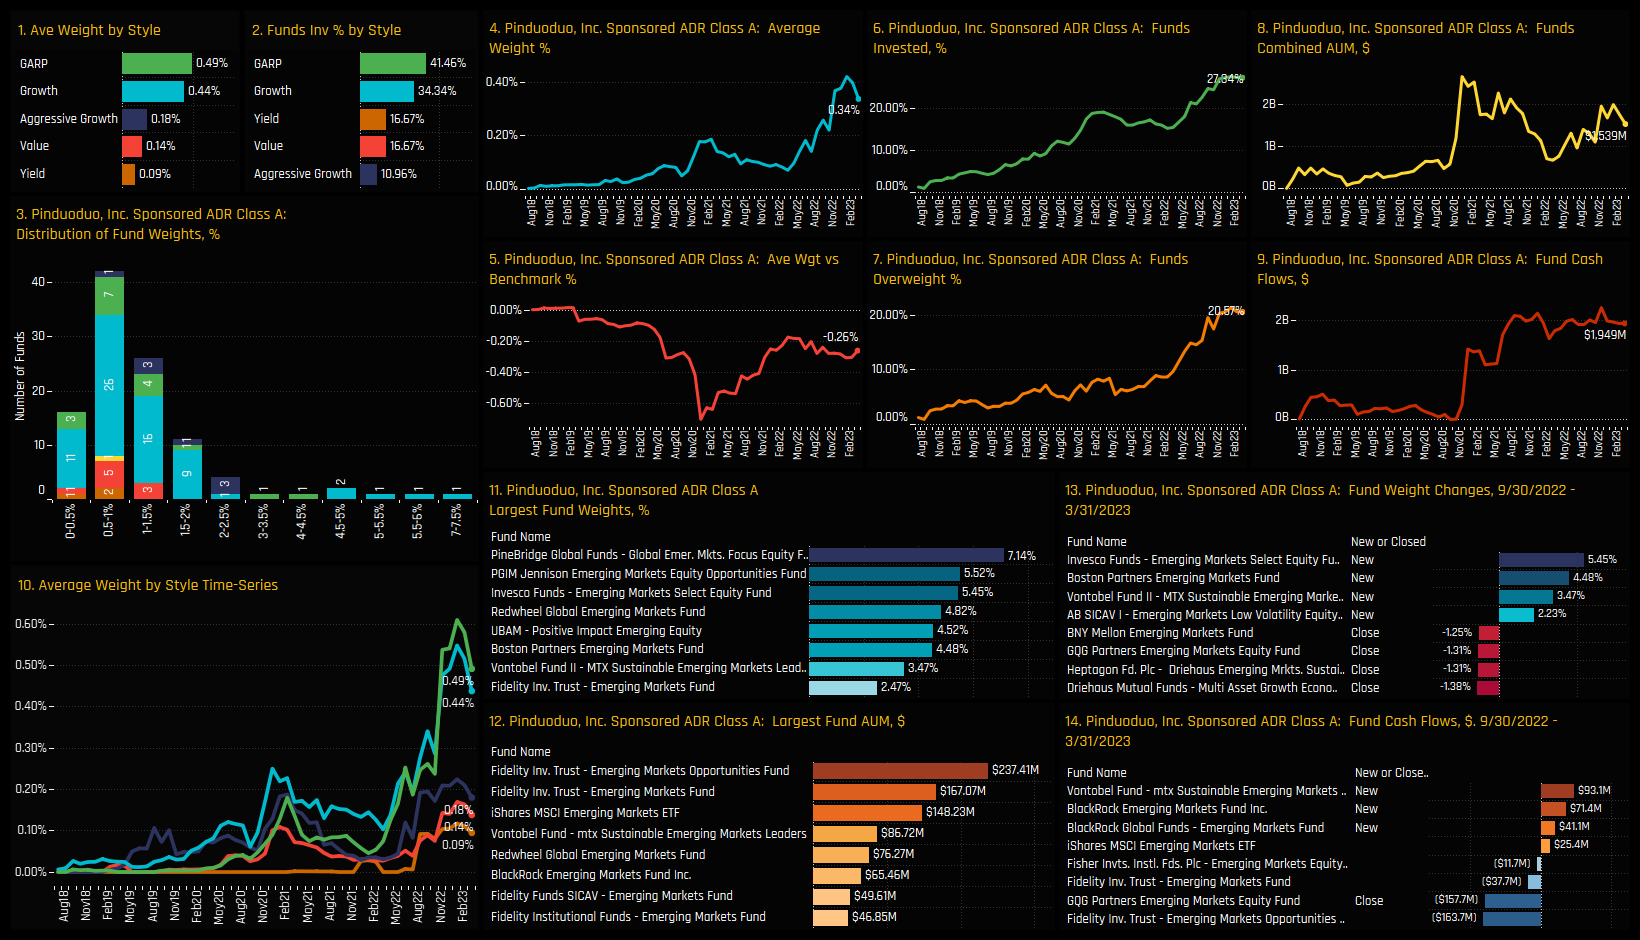
Activity between 09/30/2022 and 03/31/2023 favoured Pinduoduo Inc and Coupang Inc, with a further +2.6% and +1.8% of the funds in our analysis opening positions. Indeed, the larger individual fund opening positions were in Pinduoduo Inc from Invesco EM Select (5.5%) and Boston Partners EM Equity (4.5%). On the sell side, Americanas and Sea Ltd saw ownership levels fall.
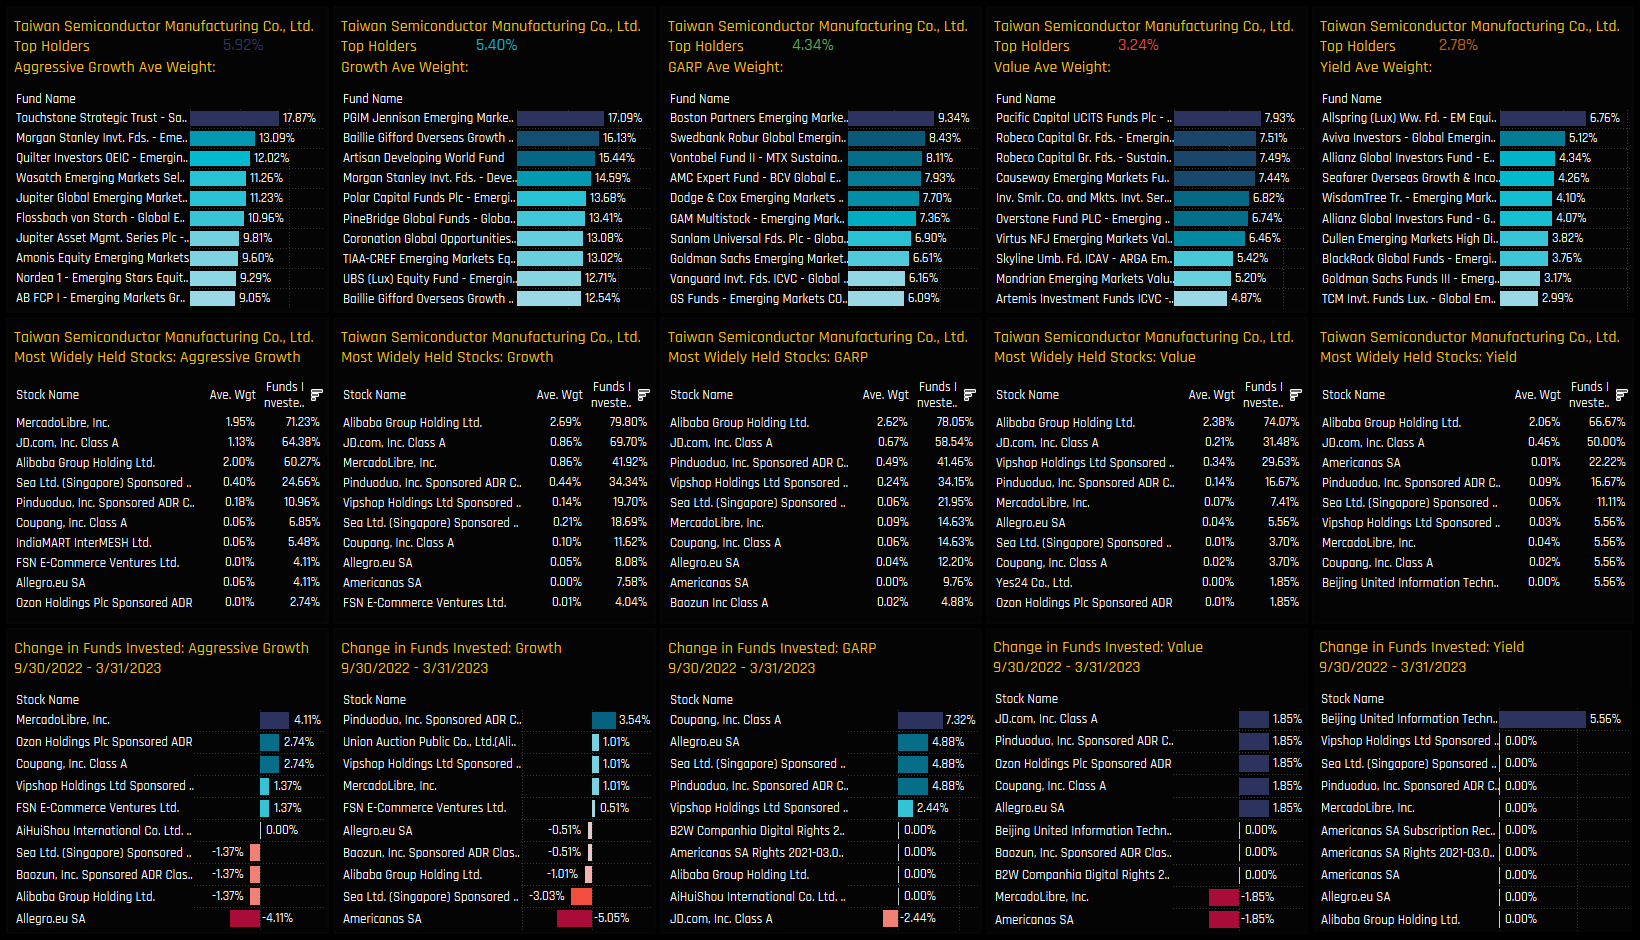
Stock Holdings by Style
Breaking down our aggregate stock holdings data by fund Style reveals some similarities and some difference between Value and Growth investors within the Internet Retail sector. Alibaba Group Holdings and JD.Com are widely held across the Style spectrum. they are the two most widely owned stocks among Yield, Value, GARP and Growth investors.
Mercadolibre is where funds start to differ. It is the most widely held stock among Aggressive Growth managers, held by 71% of funds, but ownership levels start to drop off the further we move towards Value. Only 7.4% of Value funds and 5.6% of Yield funds hold a position.
Conclusions & Links
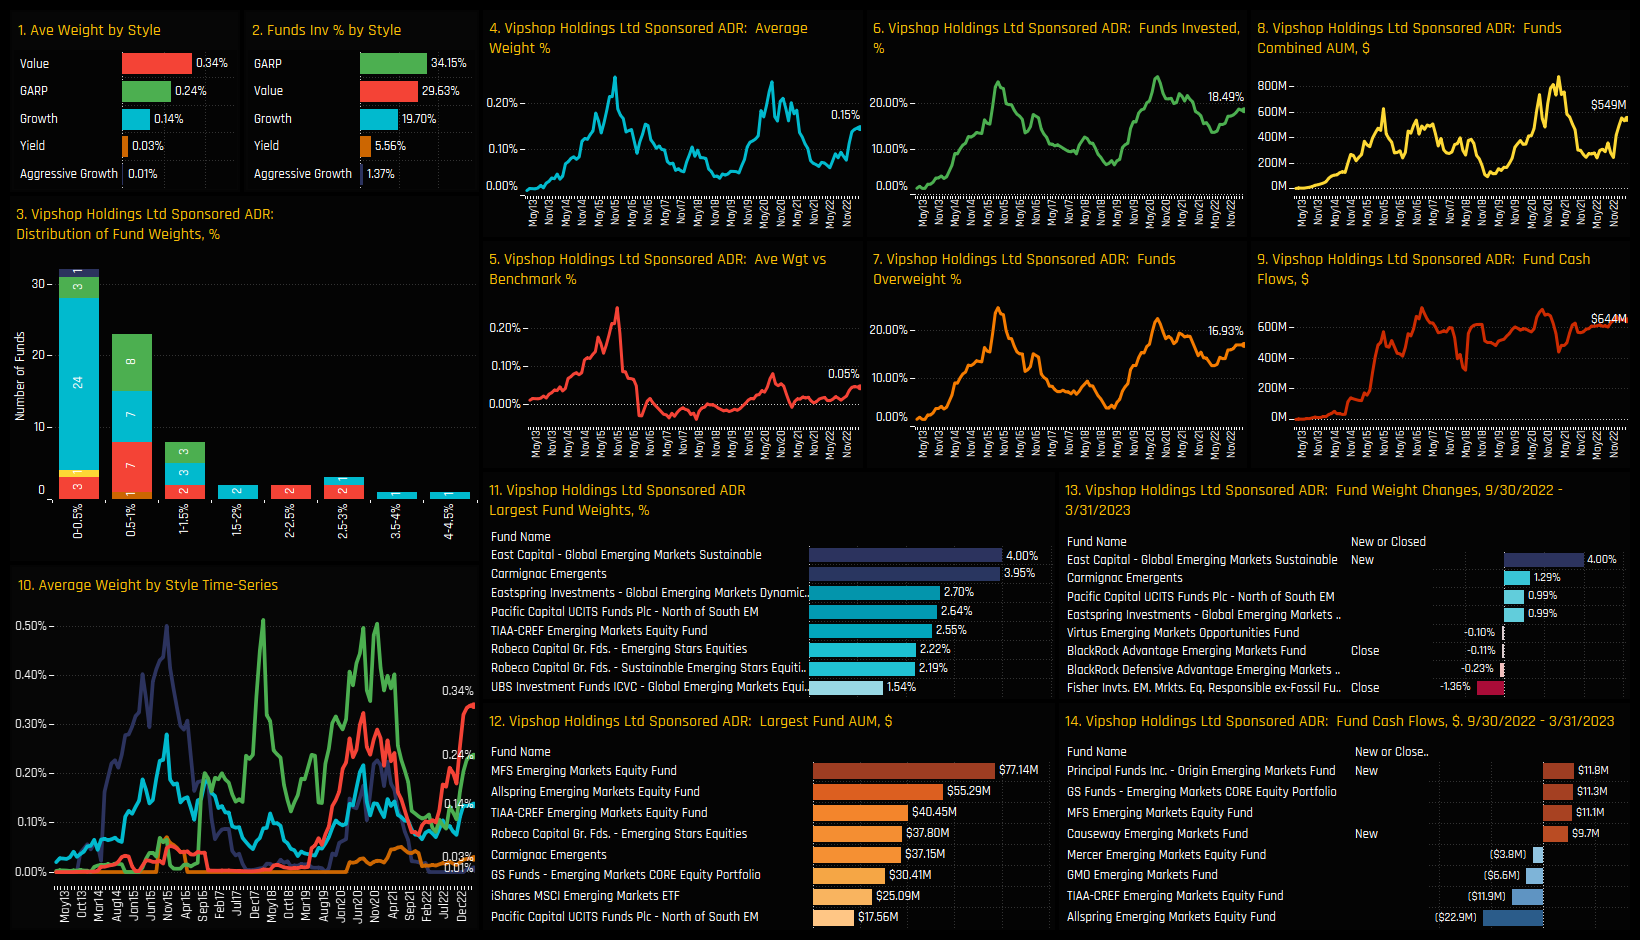
Active EM Funds are growing in confidence that Internet Retail stocks will deliver outperformance in the months ahead. A record 60.9% of funds are positioned overweight, with Alibaba Group Holdings, JD.Com and MercadoLibre the popular holdings among managers.
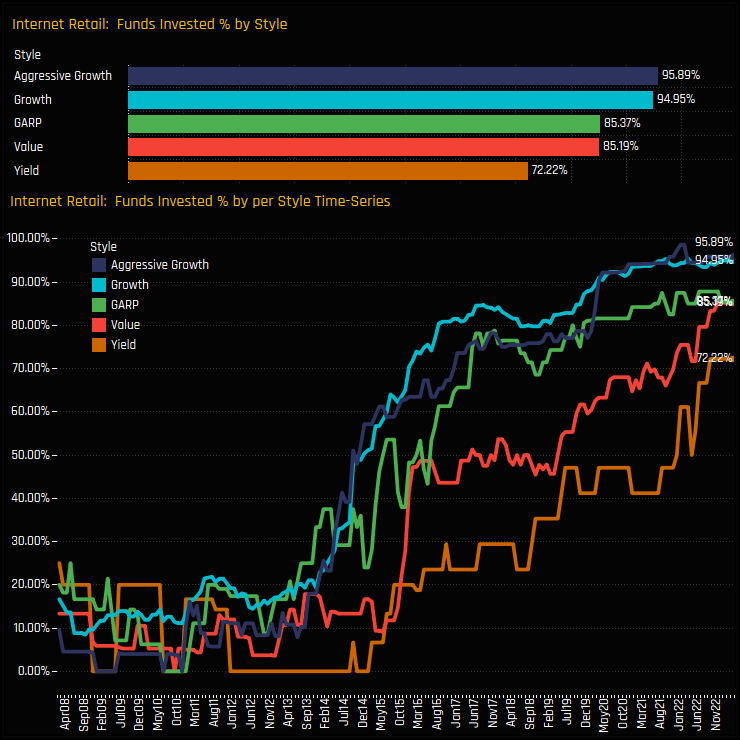
From a Style perspective, Growth investors continue to view Internet Retail as a promising area for growth, but recent price declines have prompted the Value segment of the market to take notice. The charts opposite show the percentage of funds invested in the Internet Retail sector by Style (top) and the trends over the last 15-years (bottom). They highlight the growing appeal of Internet Retail stocks to the Value and Yield community over the last 3 years, with investment levels catching up to their Growth peers.
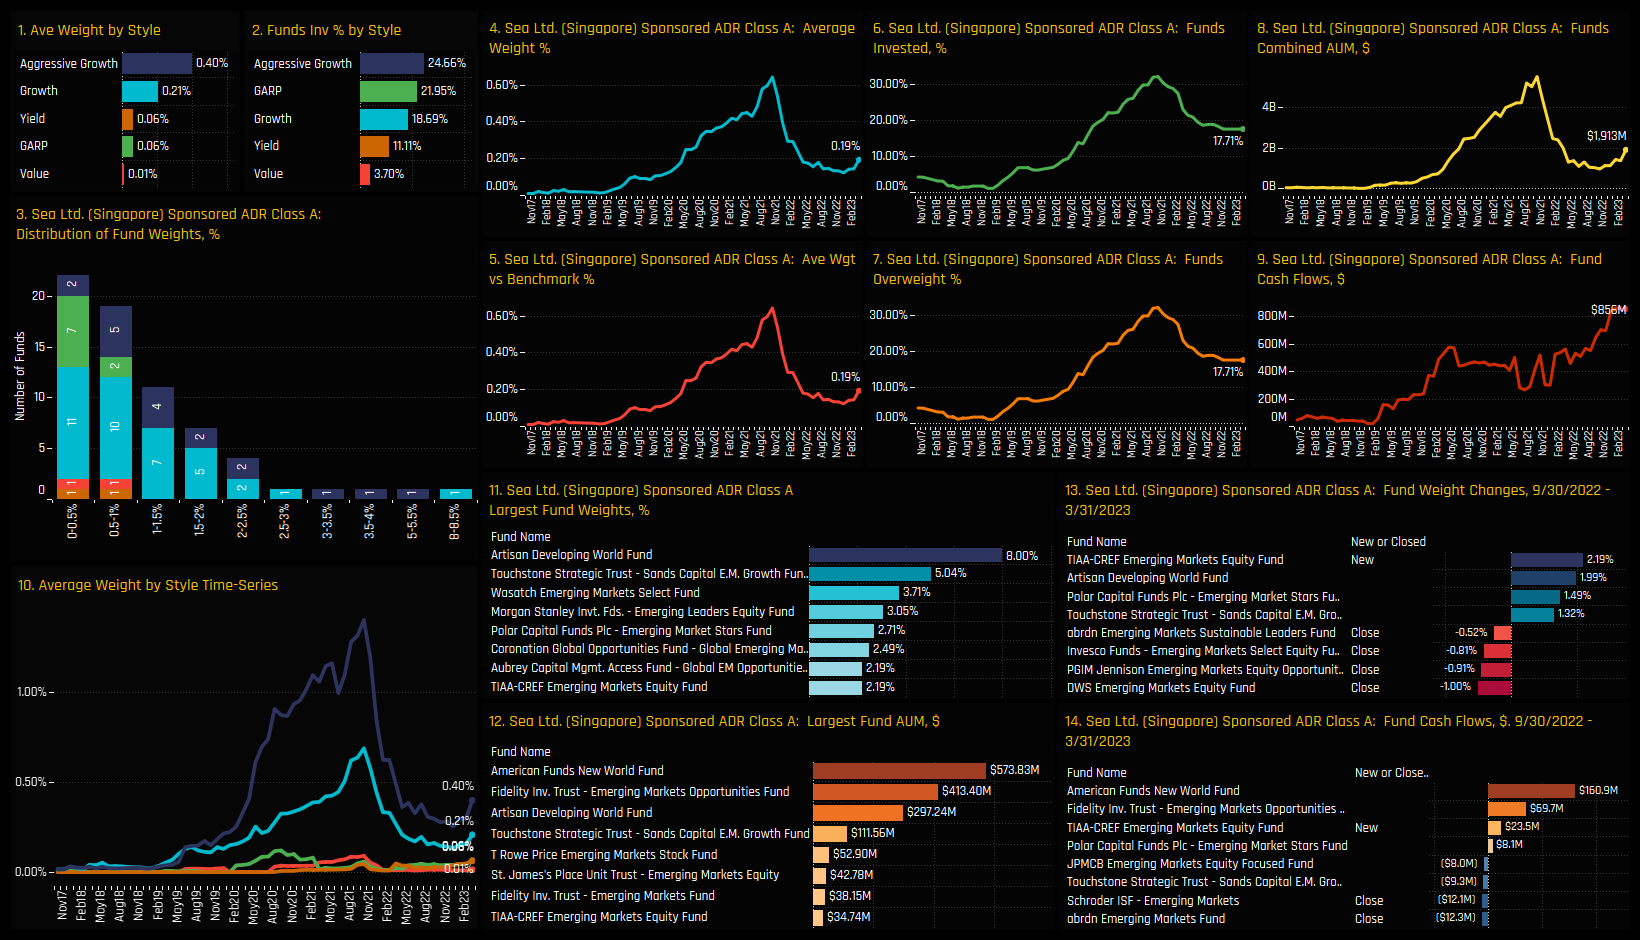
Click below for an extended data report on Internet Retail positioning among the active EM funds in our analysis. Scroll down for profiles on Alibaba, JD.Com, MercadoLibre, VIP Shop, Pinduoduo and Sea Ltd.
Exposure to Poland has drifted lower over the last decade, but there are signs that sentiment is on the turn. One stock in particular is catching the attention of EM active managers.
Time-Series and Country Activity
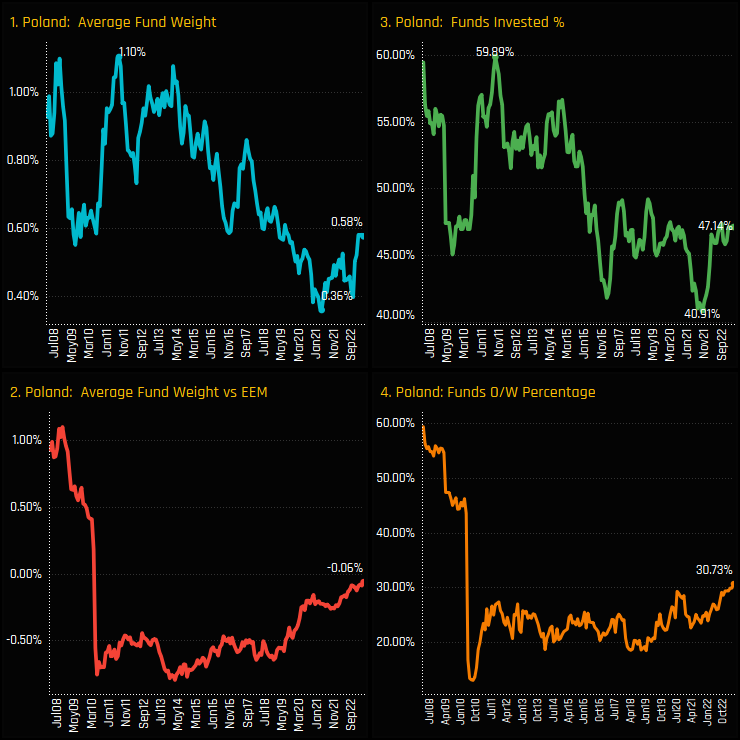
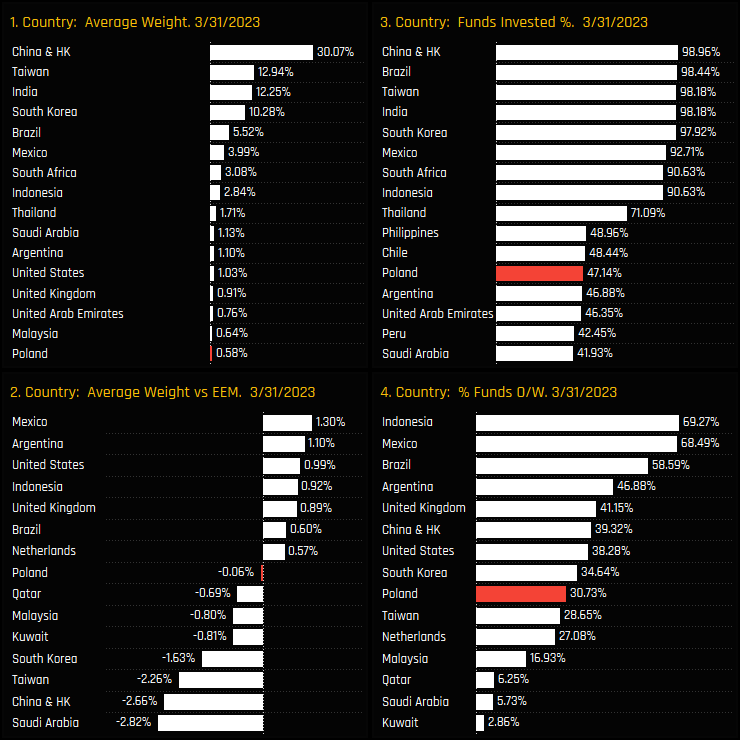
Among active Emerging Market funds, Poland has become a marginal holding over the last decade. Average fund weights fell from a high of 1.1% in 2011 to a low of 0.35% in early 2021, with the percentage of funds invested falling from 60% to 41% over the same period. Since those lows, investment levels have started to recover, with more funds adding exposure and/or moving to overweight.
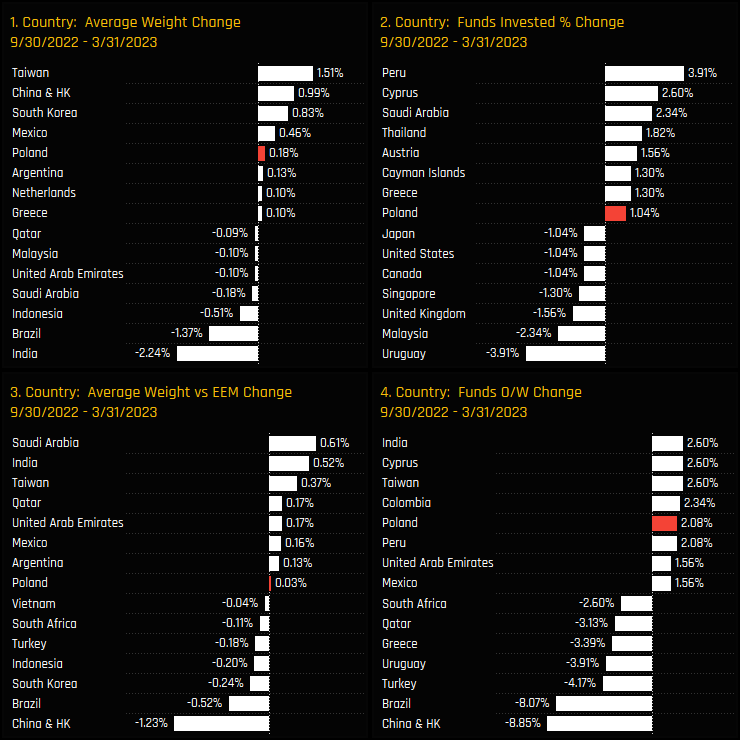
Over the last 6-months, Poland has been the beneficiary of rotation among country peers. Alongside larger weight increases in Taiwan, China and South Korea, Polish weights increased by +0.18%, the 5th highest country move, with a further +1.04% of funds opening exposure and +2.08% moving to overweight. The fact that all 4 ownership metrics moved higher reflects the active nature of the rotation and a clear shift in sentiment among EM managers.
Country Positioning & Sentiment
Yet despite these moves, Poland remains well down the pecking order of EM country exposures. It is the 17th largest weight and the 12th most widely held country across global EM. It joins a host of well known countries that are now owned by less than 50% of the funds in our analysis (ch3). These are non-essential exposures for the majority.
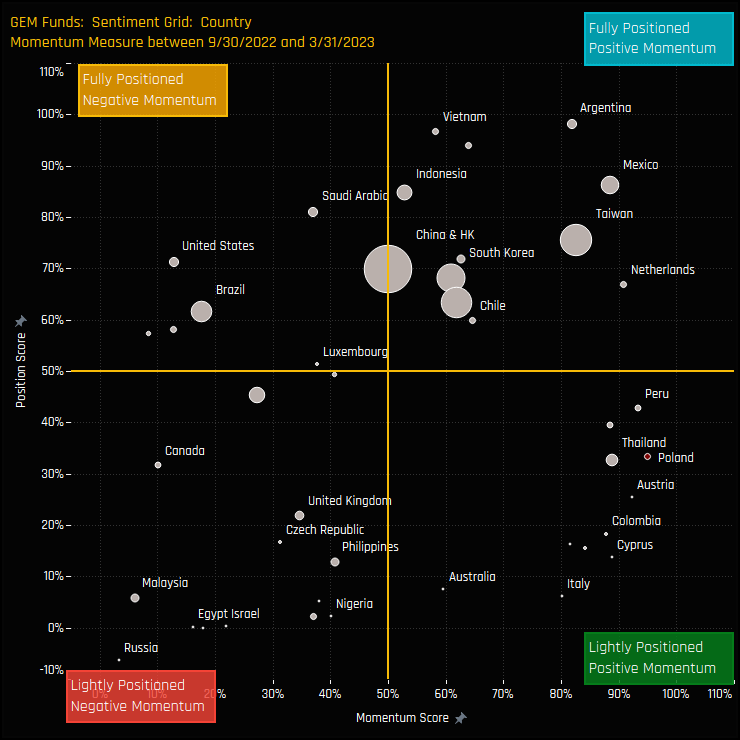
The sentiment grid below shows where current positioning in each EM country sits versus its own history going back to 2008 on a scale of 0-100% (y-axis), against a measure of fund activity for each country between 09/30/2022 and 03/31/2023 (x-axis). Poland sits in the bottom-right quadrant, indicative of it’s combination of low positioning and positive rotation.
Fund Positioning & Activity
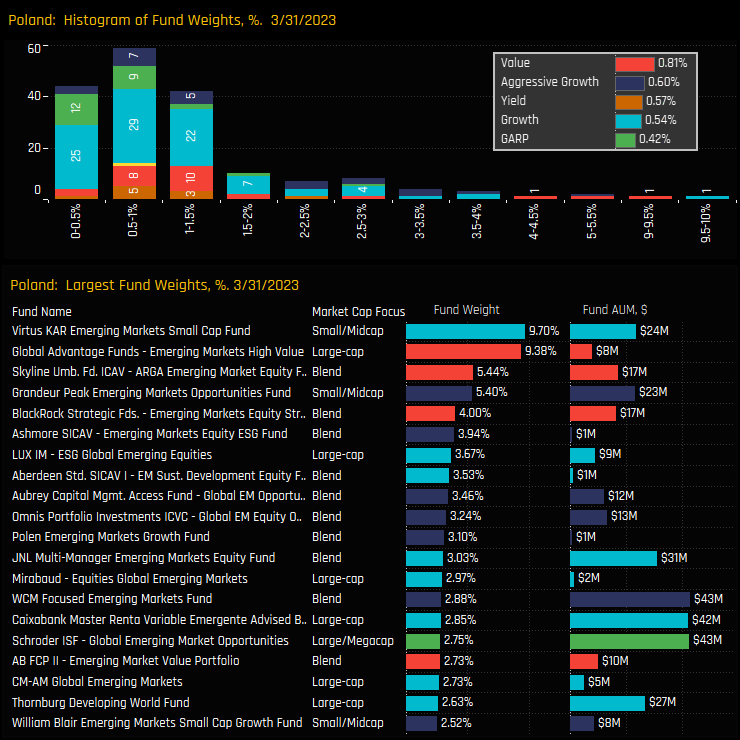
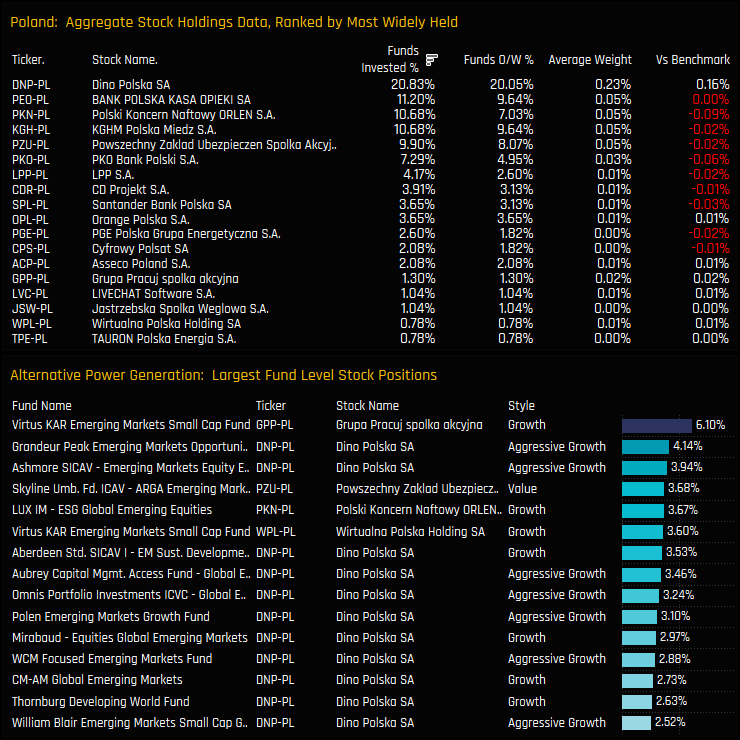
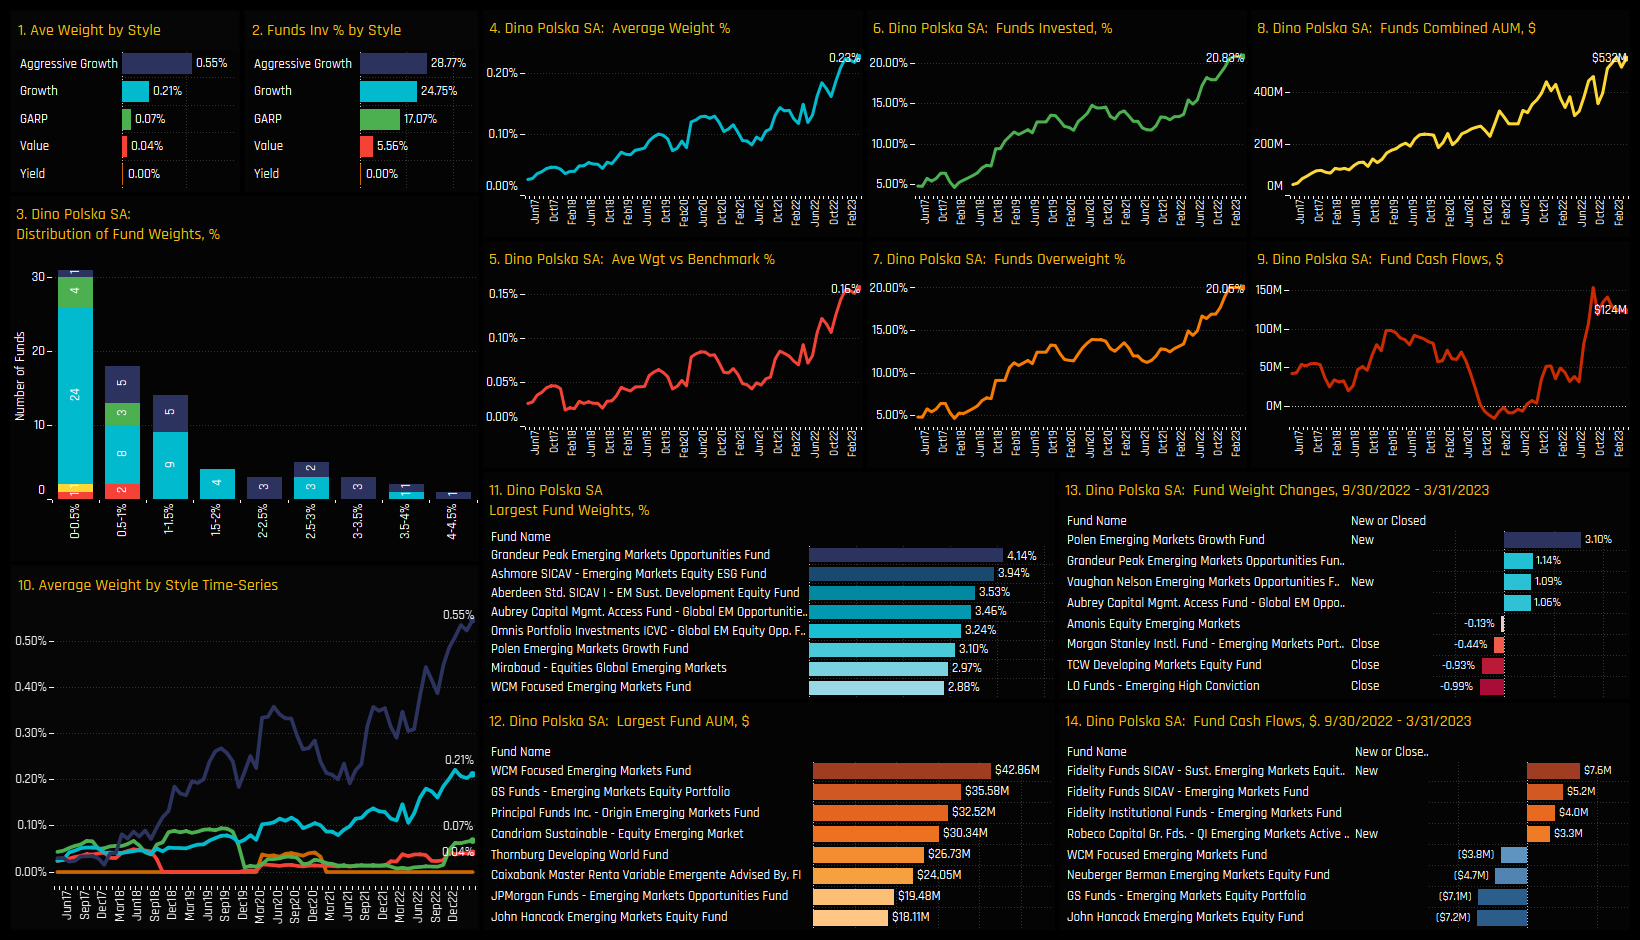
The histogram chart of Polish fund weights is shown in the top chart below and highlights the bulk of fund weights sit below 1.5%, albeit with a long tail to the upside. Value funds and Aggressive Growth funds are the larger allocators on average, with Virtus KAR EM Small Cap (9.7%) and Global Advantage High Value (9.4%) heading the list.
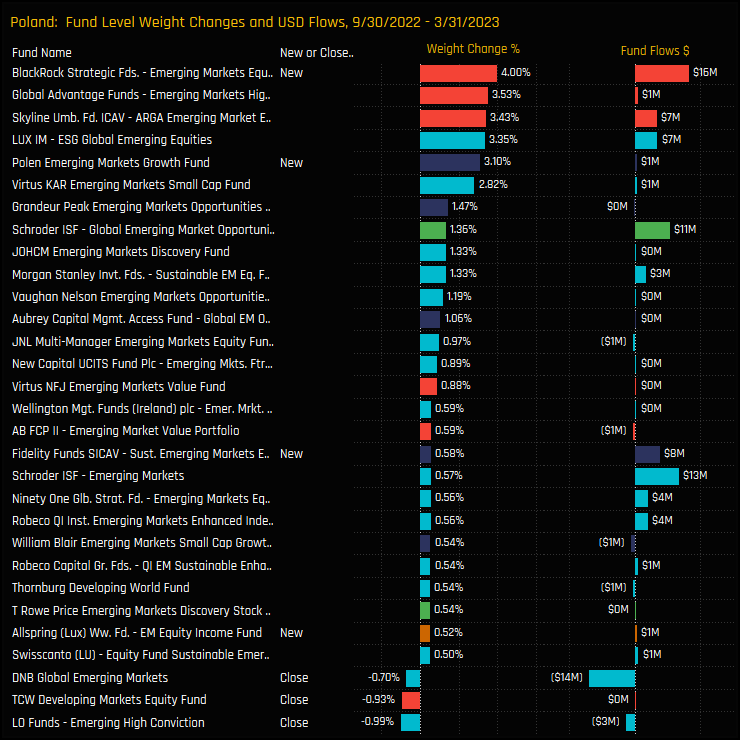
Fund activity over the last 6-months reflects the top down positive rotation, with new positions from Blackrock EM Equity Strat (+4%) and Polen EM Growth (+3.1%) complimenting some sizeable increases from Global Advantage High Value (+3.5%) and Skyline ARGA EM Equities (+3.4%). It wasn’t all one-way traffic though, with smaller closures from DNB, TCW and LO Funds.
Stock Holdings & Activity
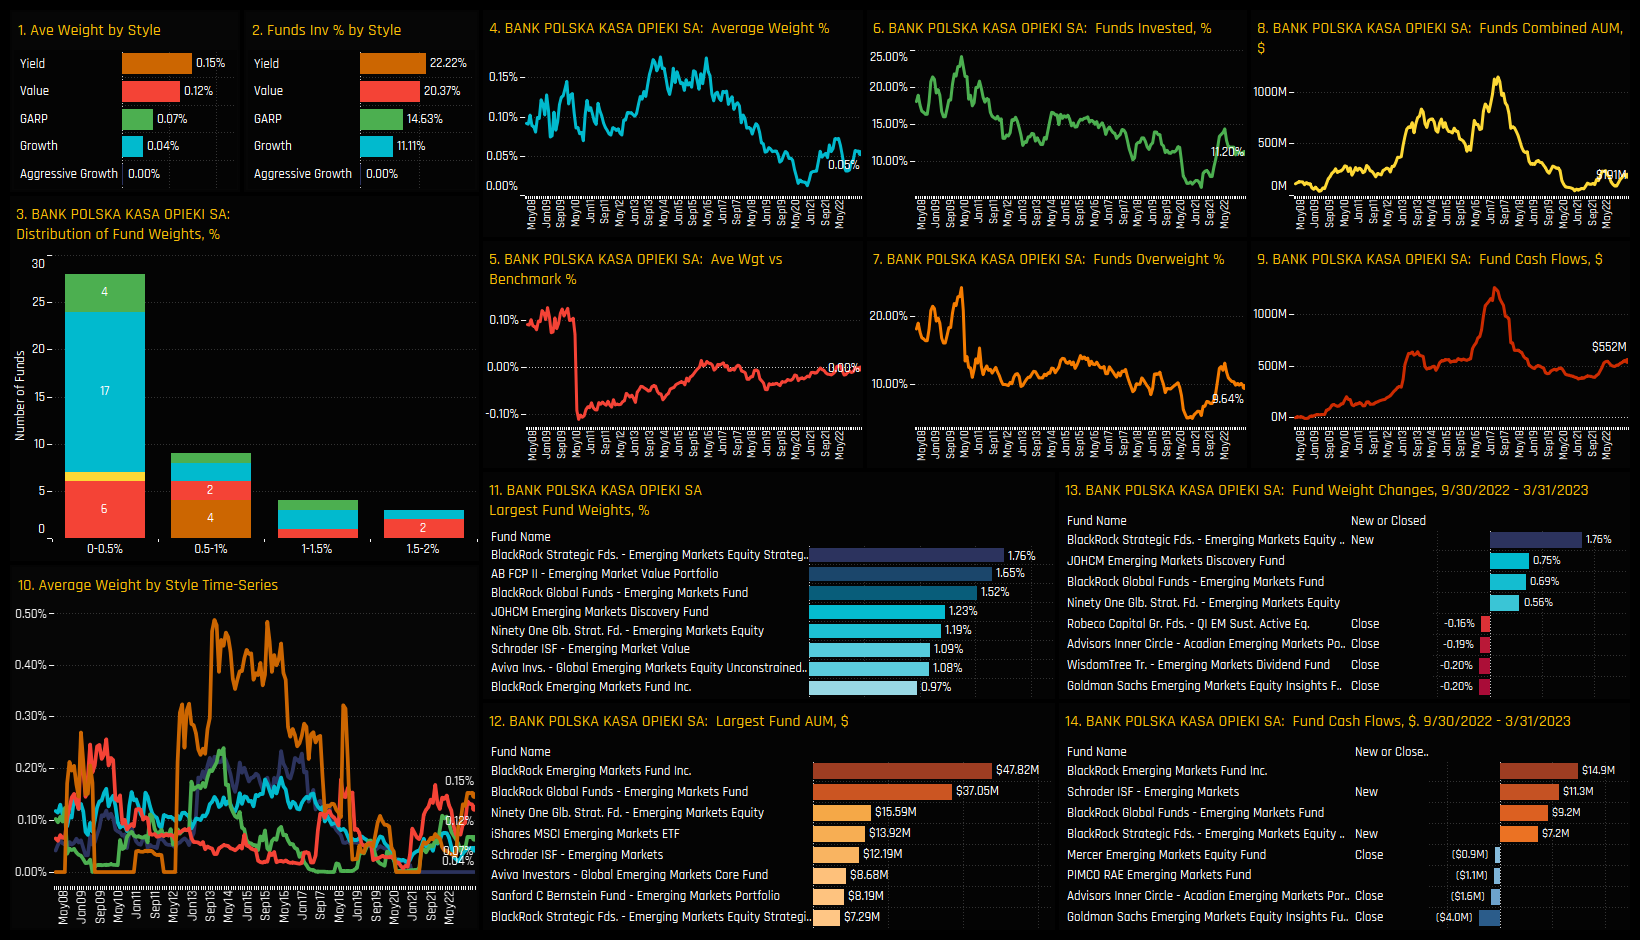
A new Polish champion has emerged in the face of Dino Polska, now comfortably the largest and most widely held stock in Poland. It is owned by 20.8% of the funds in our analysis at an average weight of 0.23%, or overweight +0.16% compared to benchmark. The ownership gap to the 2nd tier names, led by Bank Polska Kasa and Polski Koncern Naftowy is significant, with all held by around 10% of funds at much lower average weights.
Over the last 6-months, the ownership base for Dino Polska grew by a further +2.86% of funds, joining Polski Koncern Naftowy and PZU as the stocks driving the positive country rotation. Again though, stock activity wasn’t all one-way, with 4.4% of funds closing PGN positions and 2.60% LPP. On an individual fund level in the bottom chart, new positions were much larger in size then closures.
Conclusions & Links
Sentiment towards Poland has taken a turn for the better. Rising from the lows of late 2021, fund rotation has continued over the last 6-months with all measure of fund ownership moving higher. However, with just 47% of funds invested in Poland, it remains a country that most managers find easy to avoid. Active EM funds appear to take a bottom up approach to portfolio construction, judging stocks on their merit rather than trying to achieve a broader country diversification.
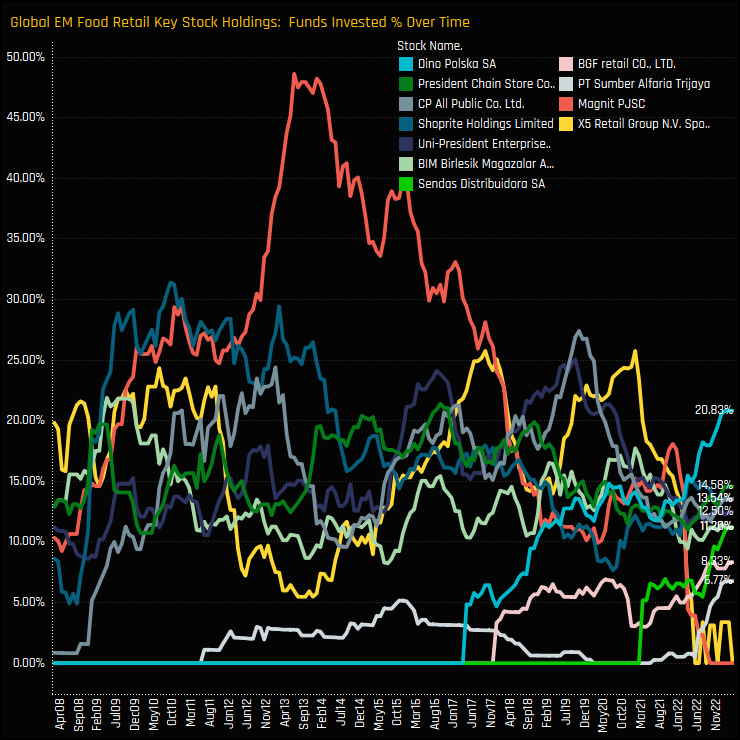
One stock that clearly has appeal to stock pickers is Dino Polska. Ownership is at record levels (see profile below) and now accounts for 40% of the total Polish allocation. The chart to the right shows the percentage of funds invested in the key EM Food Retail stocks since 2008. Dino Polska has emerged as the most widely held Food Retail company across Global EM, partially filling the void left by Magnit and X5. It goes to show that ownership can move higher from here, with Magnit once held by 49% of managers. Given the lack of appetite for Poland’s ‘old guard’, it looks like the stock most likely to drive EM fund allocations in Poland going forwards.
Click below for an extended data report on Poland positioning among the active EM funds in our analysis. Scroll down for profiles on Dino Polska and Bank Polska Kasa Opieki.
Active EM managers are heavily positioned in TSMC. It is the largest portfolio holding for 64% of funds, with an average weight double that of its nearest rivals. But is the risk of not holding TSMC greater than playing the contrarian?
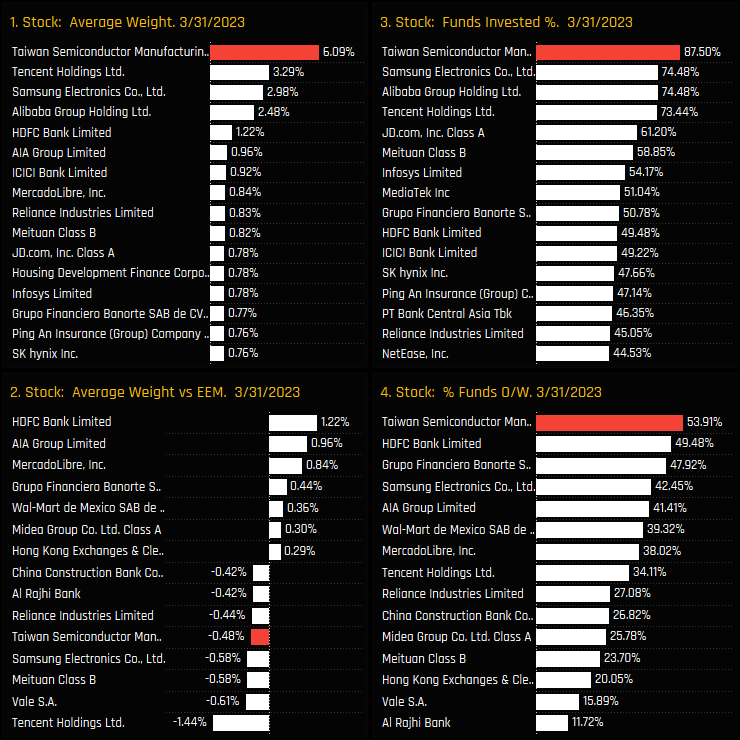
Taiwan Semiconductor Manufacturing Company (TSMC) is by far the most dominant stock holding among active EM investors. It is owned by 87.5% of the funds in our analysis (ch2) at an average weight of 6.1% (ch1), almost double the weight of Tencent Holdings, Samsung Electronics or Alibaba Group Holdings. On average, this represents an underweight of -0.48% versus the iShares MSCI Emerging Markets index (ch3), though the majority of funds hold TSMC as an overweight position (ch4).
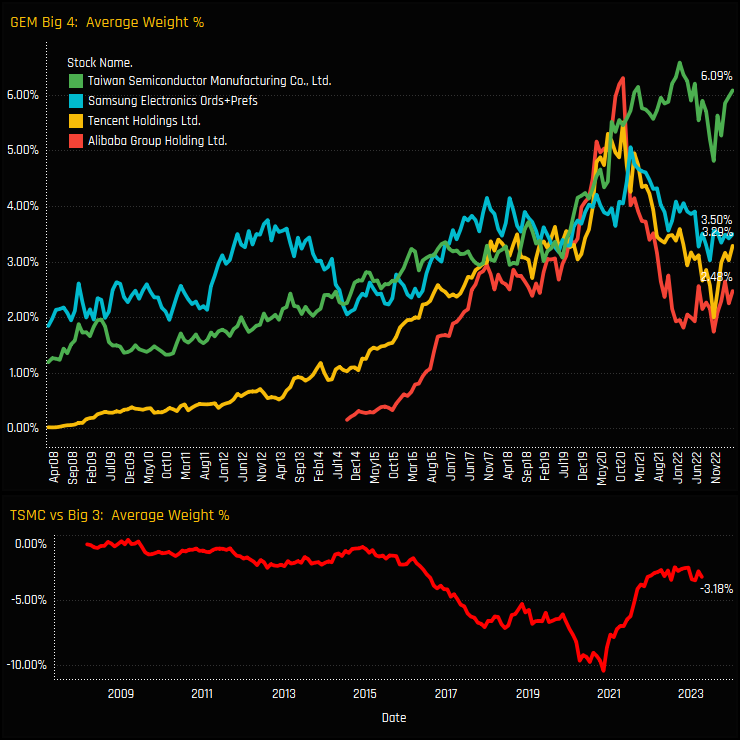
The top chart below shows the time series of average fund weights for the ‘big 4’ stocks of TSMC, Samsung Electronics (ords+prefs combined), Alibaba Group Holdings and Tencent Holdings. Between 2008 and 2018, Samsung Electronics and TSMC traded places as the dominant fund weight, with Alibaba briefly holding top spot in October 2020. But following the China ‘Tech Crackdown’ of late 2020, TSMC’s share price remained strong in the face of serious underperformance from Alibaba, Tencent and Samsung. As such, the gap between TSMC’s weight and the remaining 3 has closed towards levels last seen in 2016, when both Alibaba and Tencent were in their ownership infancy.
Fund Holdings
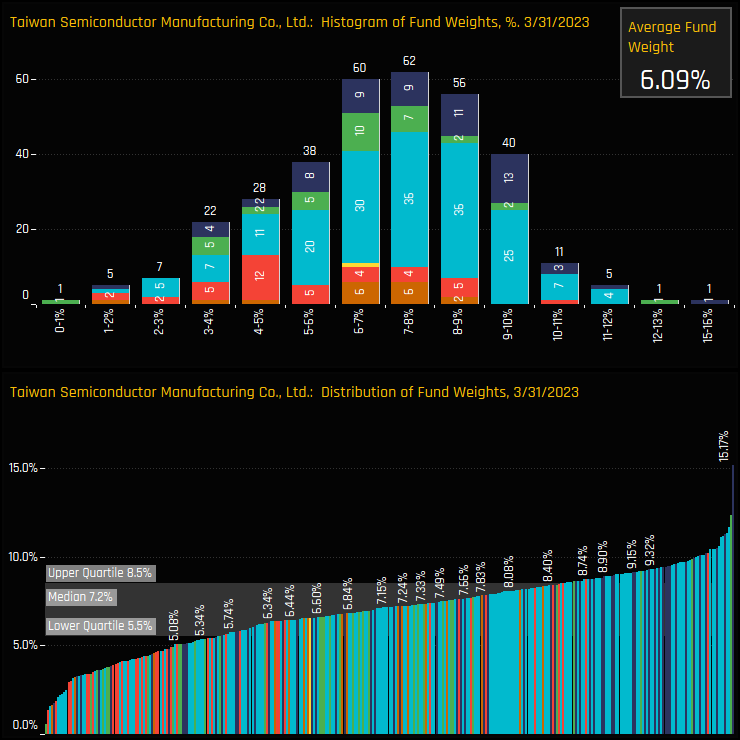
The charts below show the histogram and distribution of fund weights in TSMC as of the end of last month. The bulk of the distribution sits at between 6% and 10%, with 218 of the 337 holders allocating within this band. Outside of this range the distribution is skewed to the left-hand side, with 101 funds holding less than 6% and 18 funds holding more than a 10% allocation.
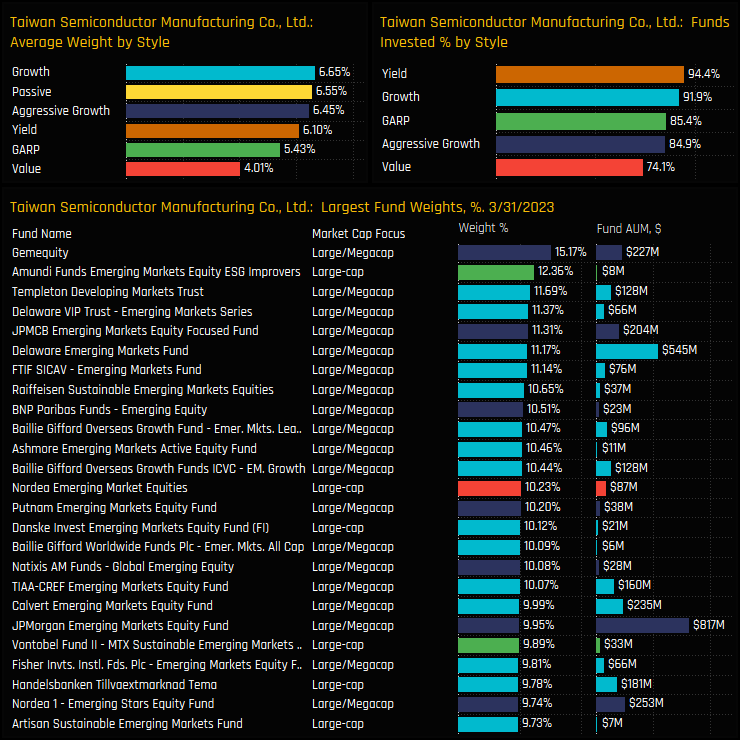
Those at the top of the distribution are led by Gemequity (15.2%), Amundi ESG Improvers (12.4%) and Templeton Developing Markets Trust (11.7%). Allocations are correlated to the Style of the fund, with Growth and Aggressive Growth funds more heavily and widely allocated than their Value peers. Yield managers are the exception, with 94.4% of the Yield funds in our analysis holding a position at an average weight of 6.1%.
Historical and Peer Group Positioning
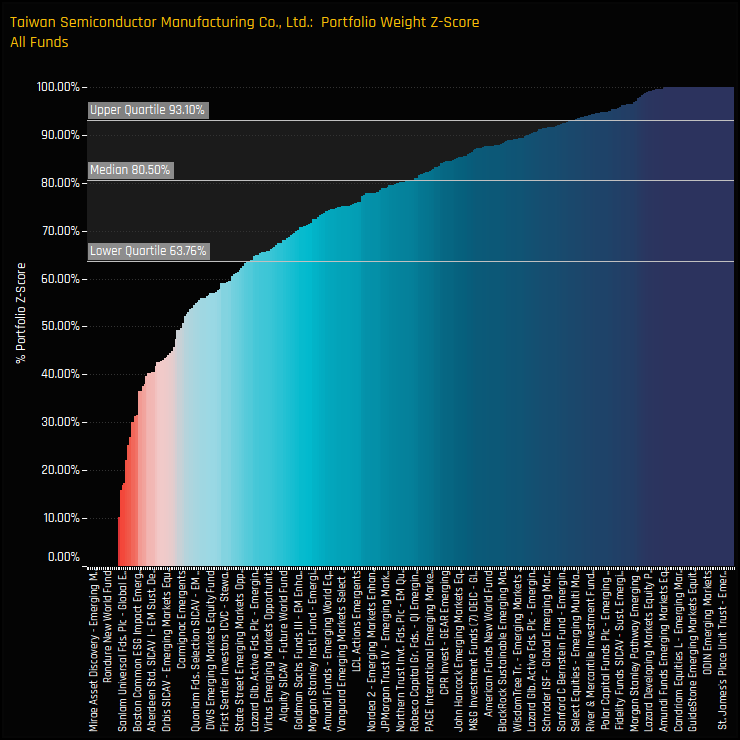
Absolute levels of positioning are high as we have seen above, with 87.5% of funds owning TSMC at an average weight of 6.1%. Furthermore, positioning data from the EM funds in our analysis implies that fund managers are expressing unprecedented levels of confidence in TSMC’s ability to generate returns, compared to historical levels. The chart below shows The Z-Score of current portfolio weights versus history for all current and previous holders of TSMC. A value of 100% means today’s weight is the highest on record for that fund, zero the lowest. Over half of the managers in our analysis have a Z-Score of above 80% in TMSC and 3/4 above 63.7%. In short, they are heavily positioned versus their own history.
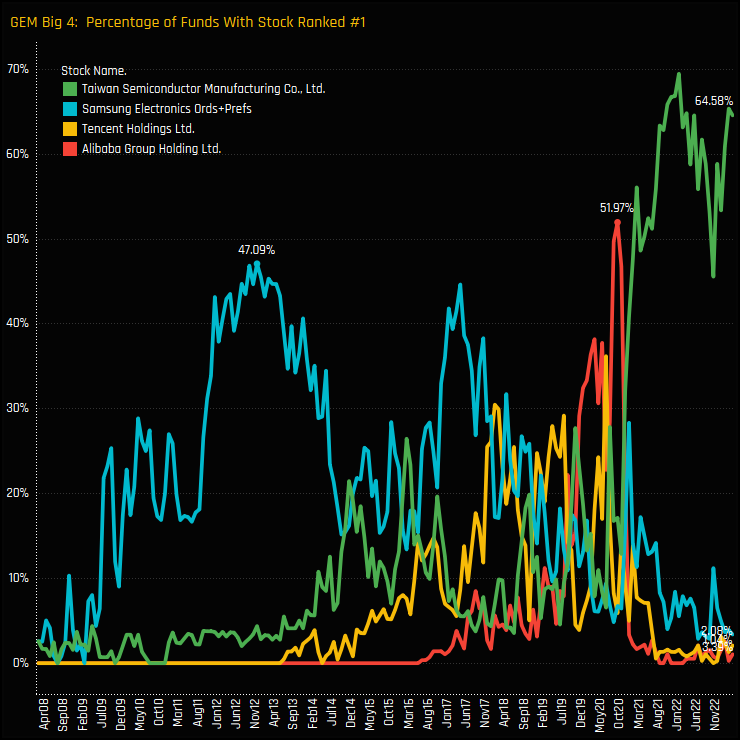
But perhaps the most telling statistic is highlighted in the chart below, which shows the percentage of funds in our analysis that have held either of the Big 4 GEM stocks as their largest position over the last 15-years. For example, in late 2012, 47.1% of EM funds held Samsung Electronics (Prefs+ords combined) as their largest holding, and just before the ‘Tech Crackdown’ in late 2020, Alibaba Group Holdings was the largest position for 52% of managers. But none of those gets close to where TSMC is today, which is held as the largest position in 64.6% of the 384 funds in our analysis (i.e 248 funds). Not quite the highest on record for TSMC, but still totally eclipsing the remaining Big 4.
Conclusions & Links
Whilst we cast no opinions on whether TSMC is worthy of such extreme positioning, there is no denying that the majority of active EM managers are hoping for TSMC to outperform. But this is nothing new, with the ownership gap to Tencent, Alibaba and Samsung Electronics in place for the last 18-months. There are certainly no obvious catalysts in our data to suggest that managers are looking to scale back positions.
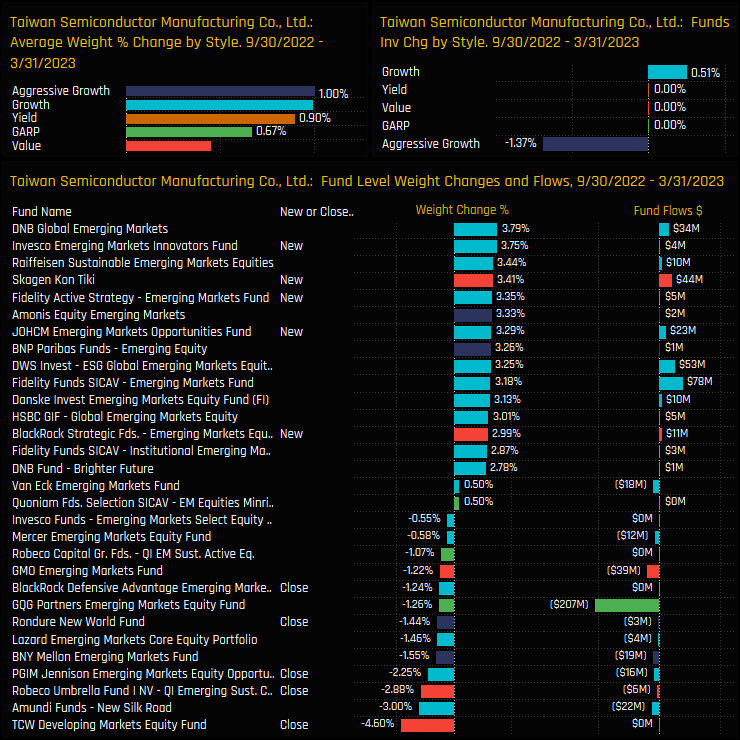
The chart to the right shows the changes in TSMC ownership split by Style and by individual Funds over the last 6-months. Average weights increased across all Style groups as TSMC outperformed (top left), and there was an even balance of opening and closing positions over the period (bottom chart).
Is TSMC overcrowded? It’s hard to argue that it’s not, with the majority of managers exposed to TSMC at weights far higher than any other stock in EM. In addition, most managers are close to their highest ever allocation. But with index weights at 6.5% and fellow active managers heavily positioned, its easy to see why most are sticking with their exposure. The risk of not holding TSMC may be greater than playing the contrarian. Whichever way you look at it, to avoid TSMC is one of the largest non-consensus stock trades in EM today.
Click below for the extended data report on TSMC among the active GEM funds in our analysis.
For more analysis, data or information on active investor positioning in your market, please get in touch with me on steven.holden@copleyfundresearch.com


