In this issue:
Saudi Arabia Financials: New Highs
Thailand Health Care Recovery
India Technology: Vulnerable
Construction Materials: Rock Bottom
278 Active GEM Funds, AUM $312bn
Saudi Arabia Financials: New Highs
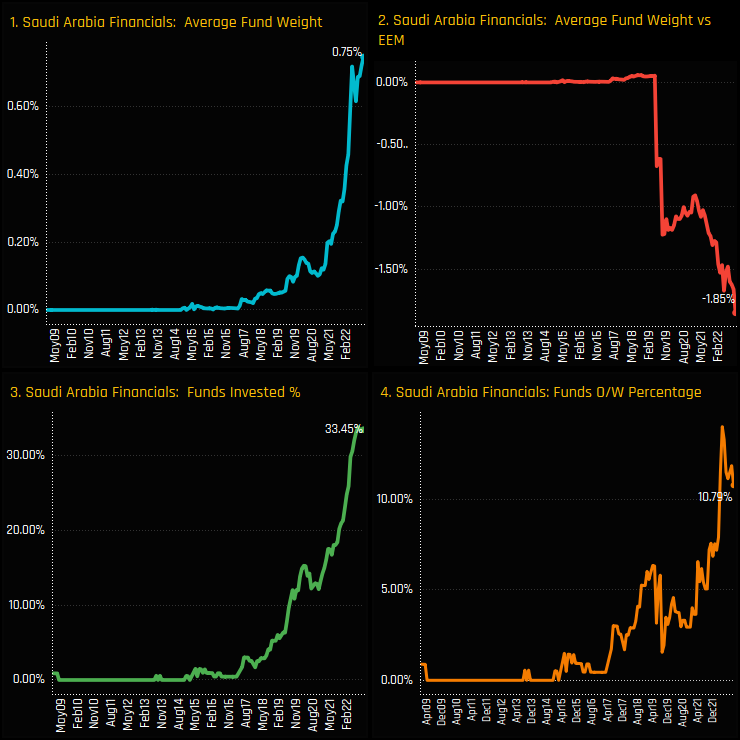
Ownership levels in Saudi Arabian Financials have hit new highs. Exposure among active EM funds has charted an aggressively upward trajectory since early 2020, culminating in 33.5% of funds owning a position at an average weight of 0.75%. Despite this strong momentum, EM funds have failed to keep up with increases in benchmark weight, with the current underweight of -1.85% the highest on record.
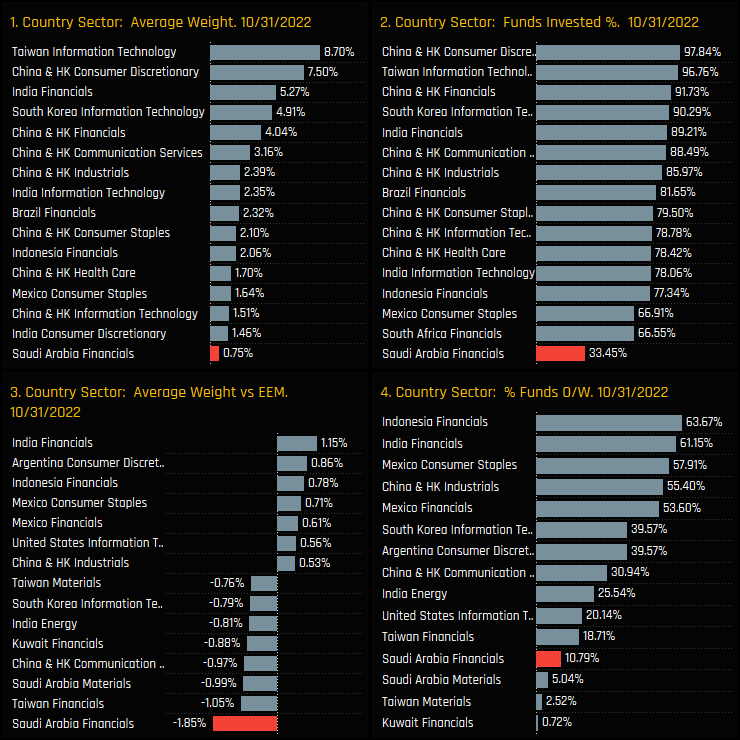
Versus country/sector peers, Saudi Arabian Financials are still a relative minnow and far from a widespread holding compared to selected sectors across the key Asian economies. Versus the benchmark iShares MSCI EM ETF however, Saudi Arabian Financials really standout. The underweight of -1.85% is the largest by some margin, and with just 10.8% of EM investors positioned overweight they represent a key benchmark risk for active EM managers.
Fund Holdings & Style Analysis
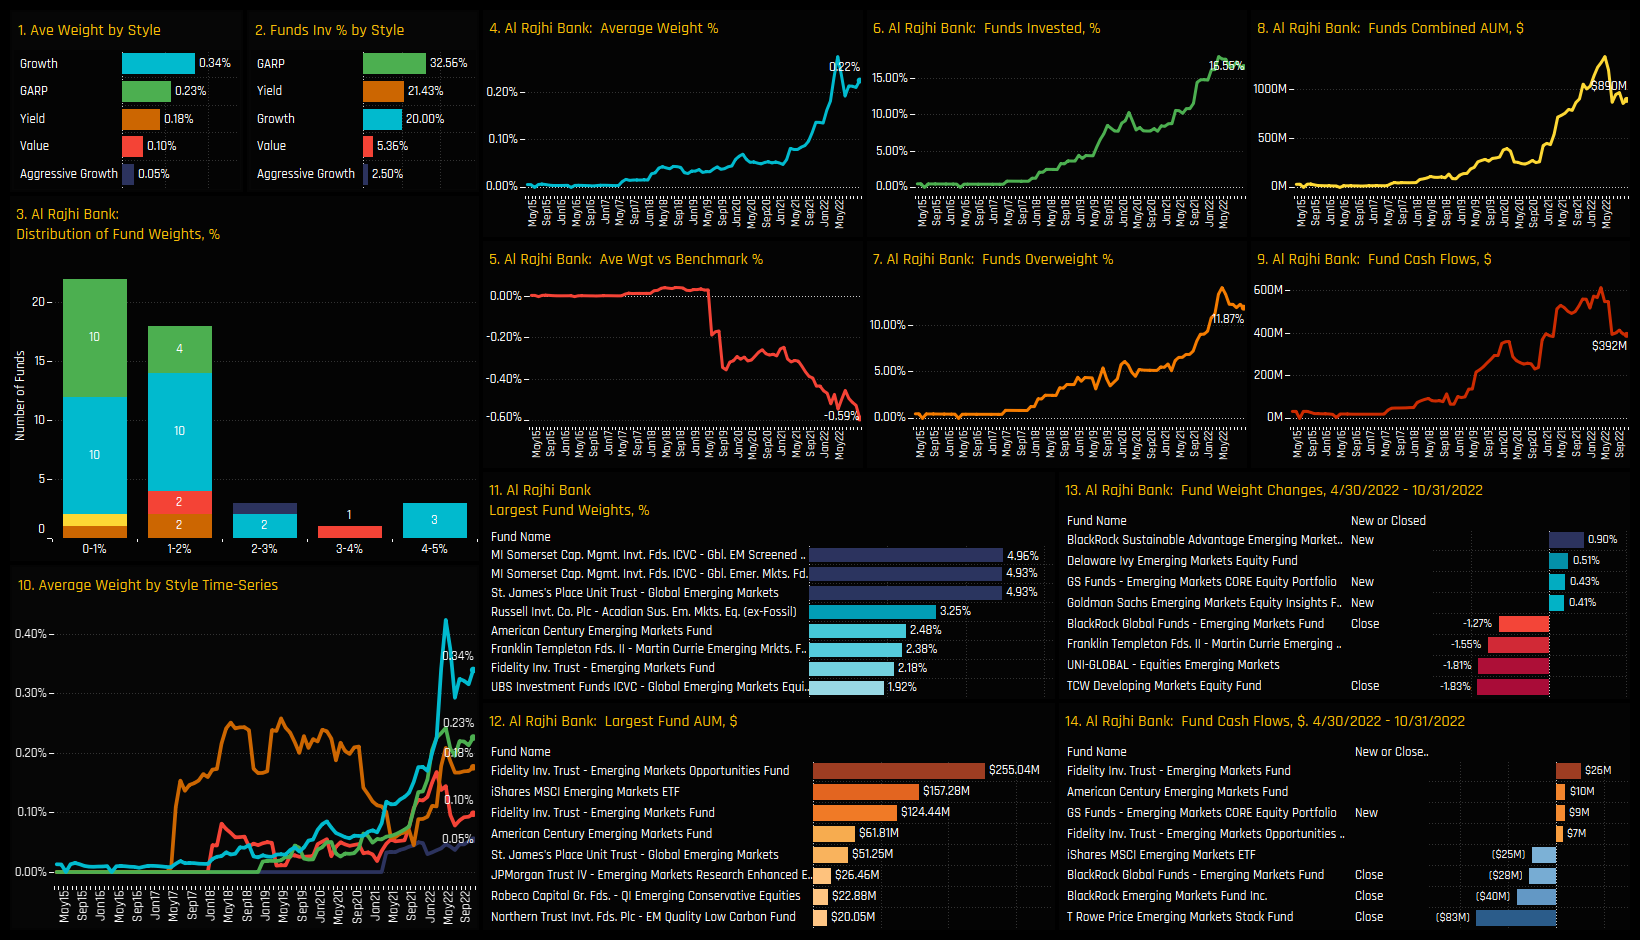
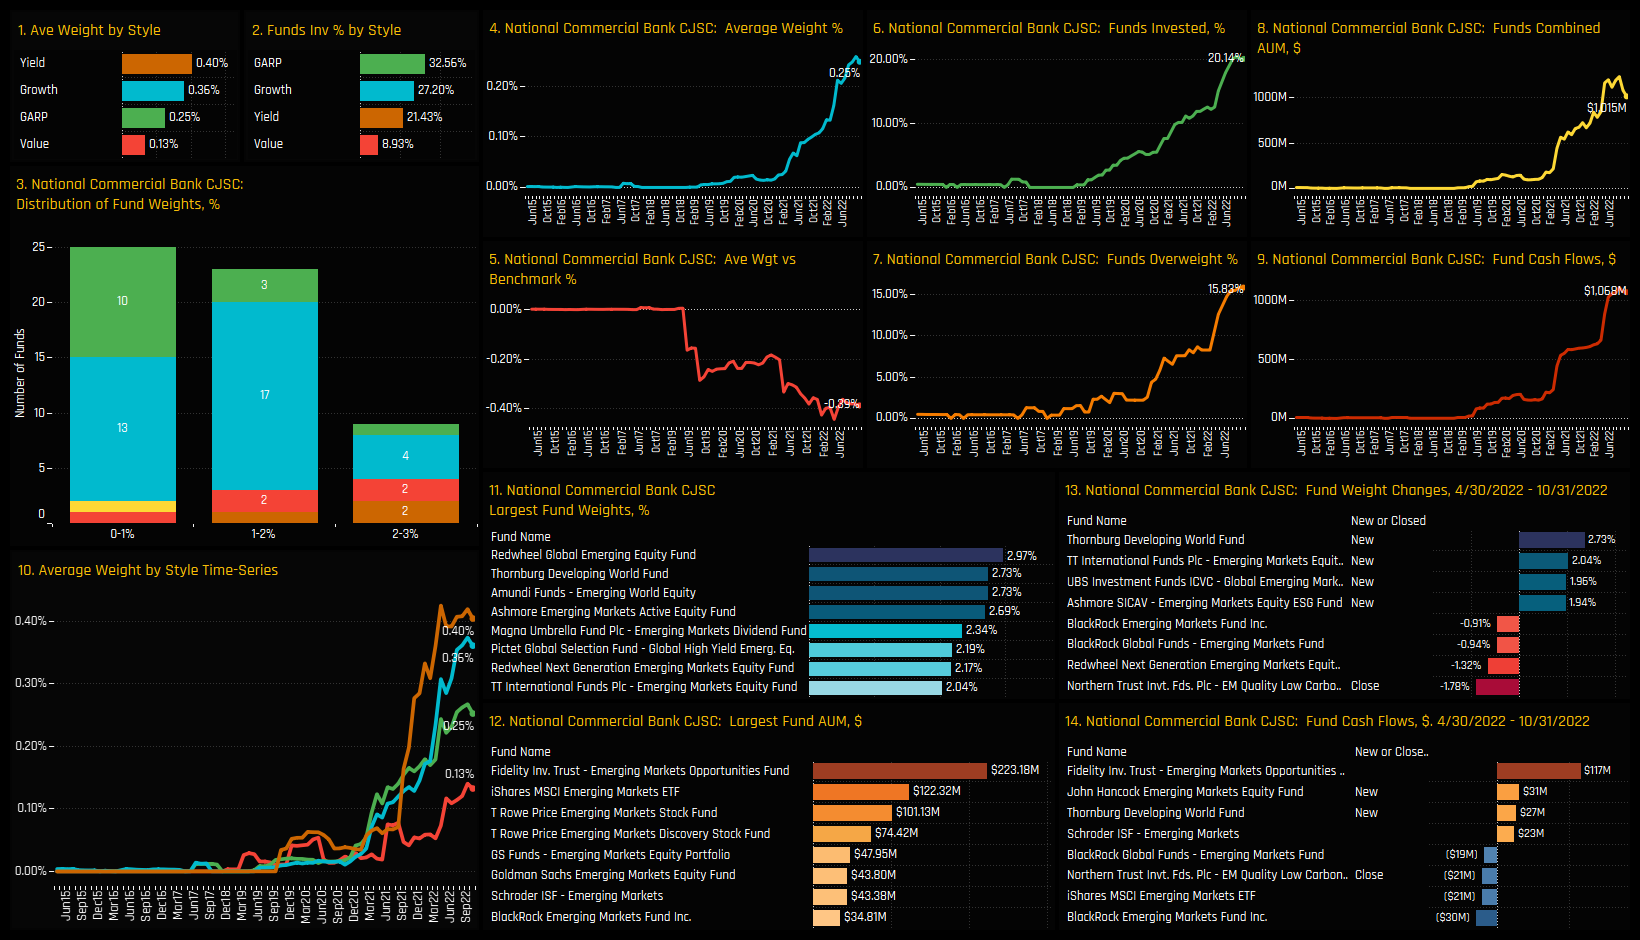
The charts below provide granular detail on the make-up of Saudi Financials positioning among EM active funds. Chart 3 shows the distribution of fund weights, with the main cluster between 1% and 3% and 17 strategies above that. Top holders in Chart 4 are dominated by Growth investors, though Acadian’s EM Sustainable strategy (Value) tops the list at 8.75%. New positions and large weight changes between 04/30/2022 and 10/31/2022 back up the large increase in the net Saudi Financials weight over the period, with Thornburg Developing World (+2.73%), John Hancock EM Equity (+2.66%) and TT EM Equity (+2.04%) among those opening positions (ch5).
Chart 7 shows the long term trends in Saudi Financials weight split by Style, with Aggressive Growth managers slower to invest than their GARP and Growth peers. Chart 8 shows the portfolio Z-Score for the Saudi Finacials sector for each fund in our analysis. Each bar represents a fund, with a score of 100% indicating today’s weight is the highest on record for that fund, and 0% the lowest. Over half of those who own Saudi Financials are in their 95th percentile weight, with funds such as Acadian EM Managed Volatility and JP Morgan Research Enhanced Equity at their maximum ever allocations.
Stock Holdings & Activity
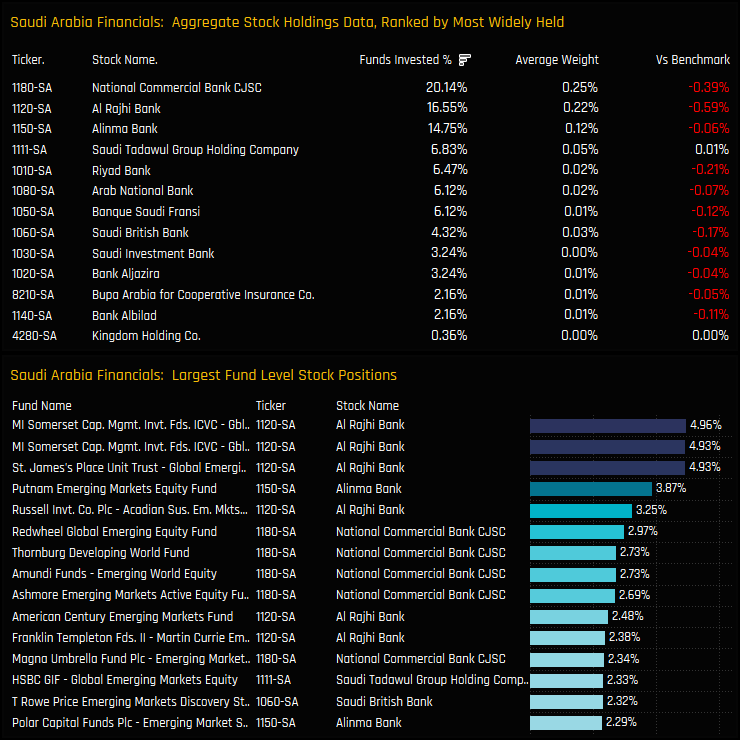
Of the 13 Saudi Arabian Financial companies that have found investment from the EM funds in our analysis, the top 3 of National Commercial Bank, Al Rajhi Bank and Alinma Bank are the clear favourites. They are owned by more funds and at a higher average weight than peers, though all are held underweight on average versus the iShares EEM benchmark. High conviction positions are led by Somerset and St. James Place 4.9%+ positions in Al Rajhi Bank.
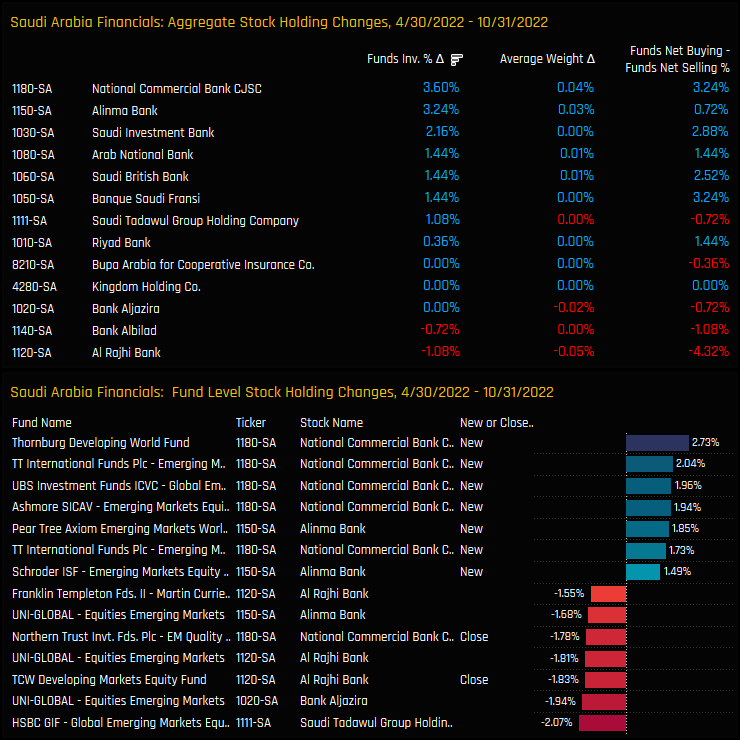
Changes in stock ownership over the last 6-months have been overwhelmingly positive, led by National Commercial Bank and Alinma Bank who attracted investment from a further 3.6% and 3.24% of funds respectively. Investor favourite Al Rajhi Bank saw holdings fall, with TCW and Uni Global scaling back exposures.
Conclusions & Data Report
The ownership picture for Saudi Arabian Financial stocks is changing. The addition of Saudi Arabia to the MSCI Emerging Markets index, high oil prices, China concerns and a pullback in Tech have all worked in Saudi’s favour over the last couple of years.
Yet despite this seemingly positive picture, the fact remains that 66.5% of managers have zero exposure and 89.2% are positioned underweight. It’s not clear which signal is the strongest – the rising ownership or the high levels of investor apathy!
One things is clear though, the majority of active EM managers are not positioned for future outperformance of the Saudi Arabian Financials sector.
Please click on the link below for an extended data report on the Saudi Arabia Financial sector among EM active equity funds. Scroll down for ownership profiles on Al Rajhi Bank and National Commercial Bank and for more analysis on EM fund positioning.
Fund allocations in the Thailand Health Care sector have soared to all-time highs this month. Outright ownership in the sector hit a recent bottom of just 7.7% of funds back in October 2020 (ch3), but has risen aggressively to 20.14%, helping to close net underweights and push average holding weights to a record 0.22%.
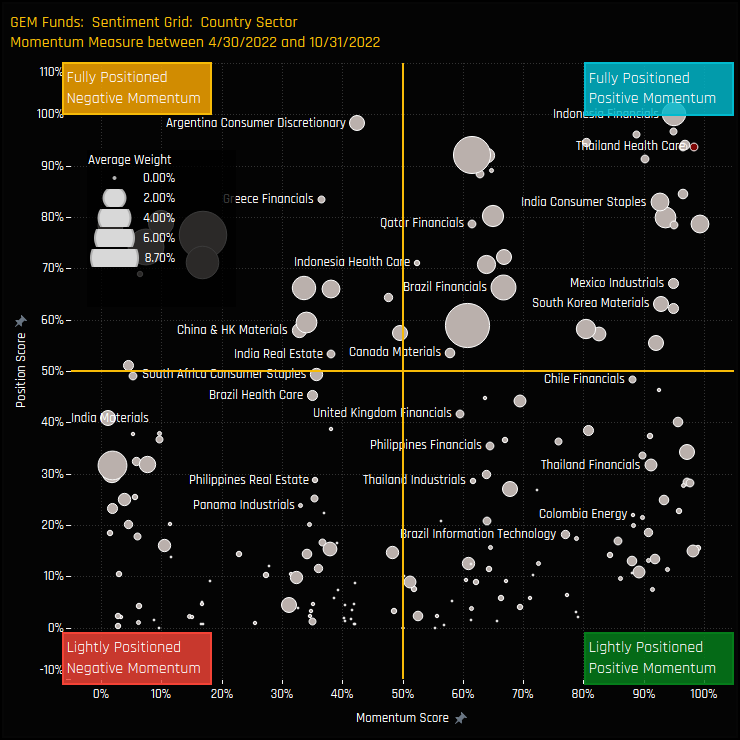
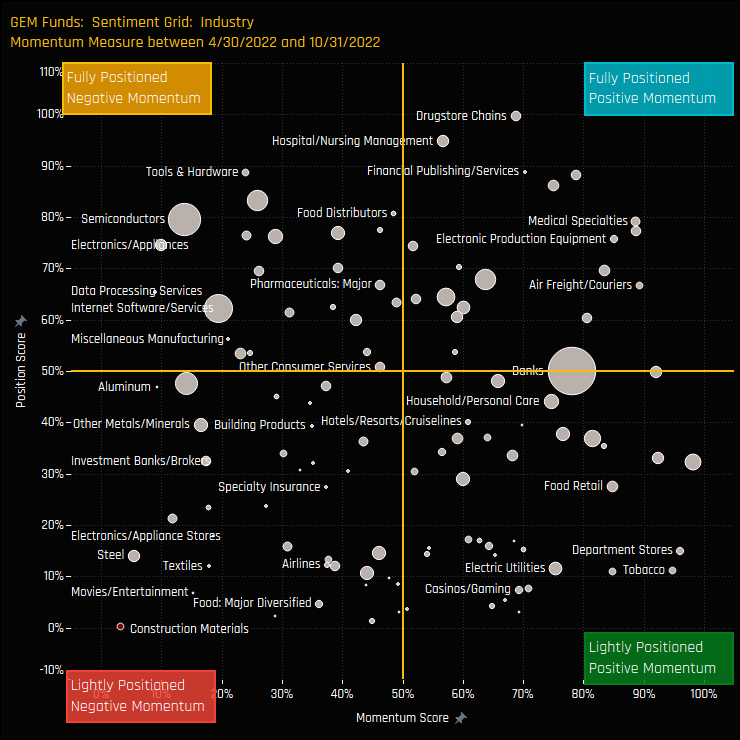
The sentiment grid below shows where current positioning in each country/sector sits versus its own history going back to 2008 on a scale of 0-100% (y-axis), against a measure of fund activity for each country/sector between 04/30/2022 and 10/31/2022 (x-axis). Thailand Health Care sits in the top-right quadrant, indicative of near record positioning and strong manager rotation.
Fund Holdings & Style Analysis
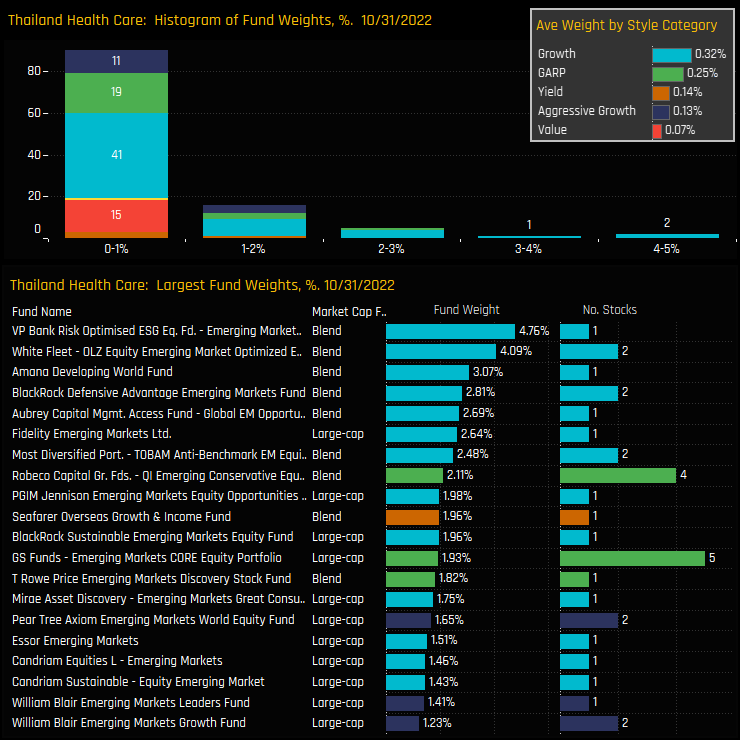
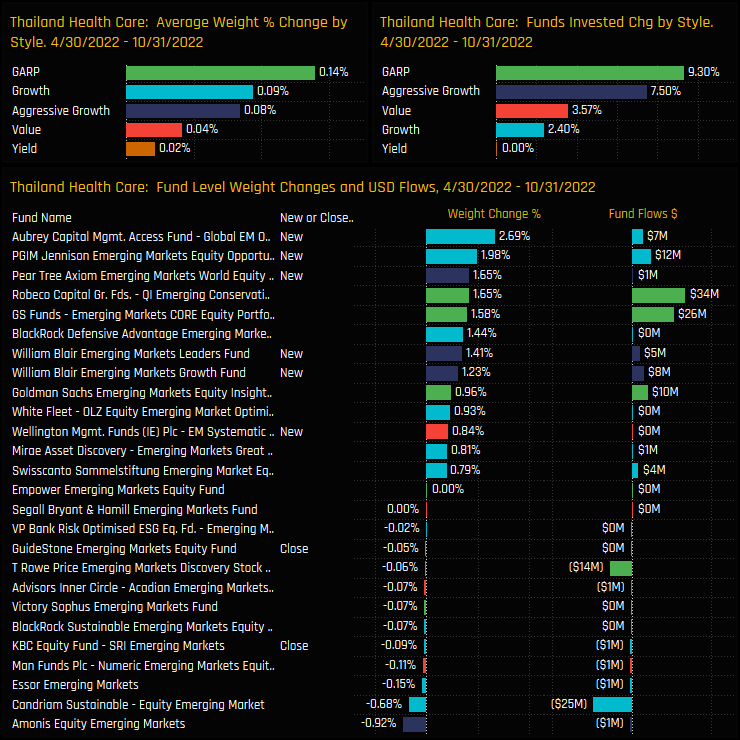
On a fund level, Thailand Health Care commands a relatively small allocation in the majority of EM portfolios. The bulk of fund weights sits below 1%, with a right-sided skew that tops out at 4.76% for the VP Bank Risk Optimised ESG Fund. Growth and GARP managers are the key allocators, with Value managers largely absent from the holdings picture.
Over the last 6-months, all Style groups save for Value saw net ownership levels increase, with +9.3% of GARP funds and +7.5% of Aggressive Growth funds opening exposure. The largest new positions were from Aubrey Capital Global EM Opportunities (+2.69%), PGIM EM Equity Opportunities (+1.98%) and Pear Tree Axiom EM World Equity (1.65%)
Stock Holdings & Activity
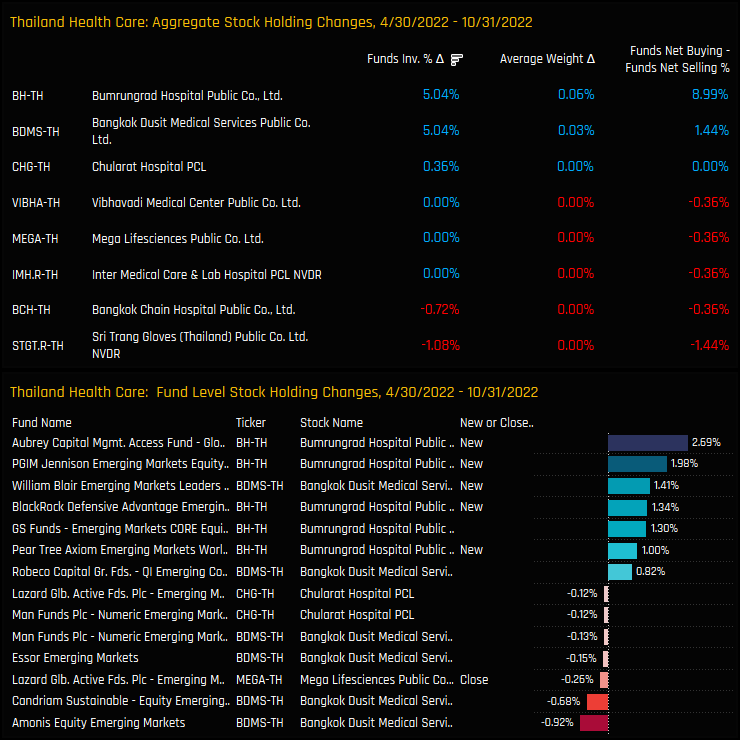
Two stocks were responsible for the majority of the Thailand Health Care rise. Over the last 6-months, the percentage of funds invested in both Bumrungrad Hospital and Bangkok Dusit Medical Services increased by 5.04%. Both stocks dominate the list of fund level stock increases over the period too.
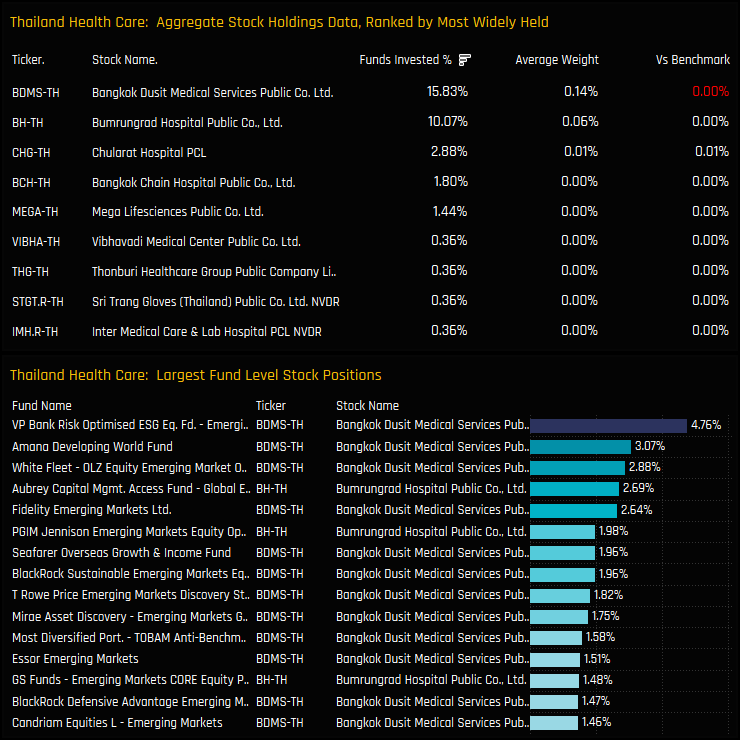
This leaves both Bumrungrad Hospital and Bangkok Dusit Medical Services as the 2 most widely held stocks in the sector by some margin. Of the 2, Bangkok Dusit edges it in terms of funds invested, average weight and its dominance among the high conviction positions.
Conclusions & Data Report
EM investors are warming to the Thailand Health Care sector. Rising conviction levels among active managers have been reflected in increased ownership over the past 2-years, specifically in Bumrungrad Hospital and Bangkok Dusit Medical Services.
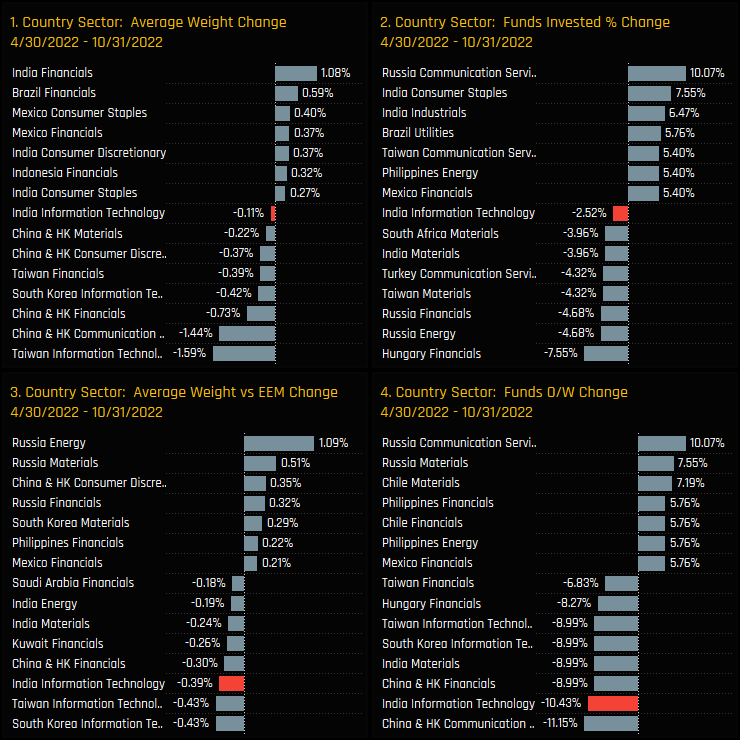
The chart to the right shows the country level ownership changes for the Health Care sector over the last 6-months. Within the sector, Thailand has been the go-to rotation, capturing the largest increase in funds invested, funds overweight and average weight over the period. Such a strong shift in sentiment could open the door for further investment from the 80% of managers who are yet to hold a position.
Please click on the link below for an extended data report on the Thailand Health Care sector among GEM active equity funds. Scroll down for ownership profiles on Bumrungrad Hospital and Bangkok Dusit Medical Services and for more analysis on EM fund positioning.
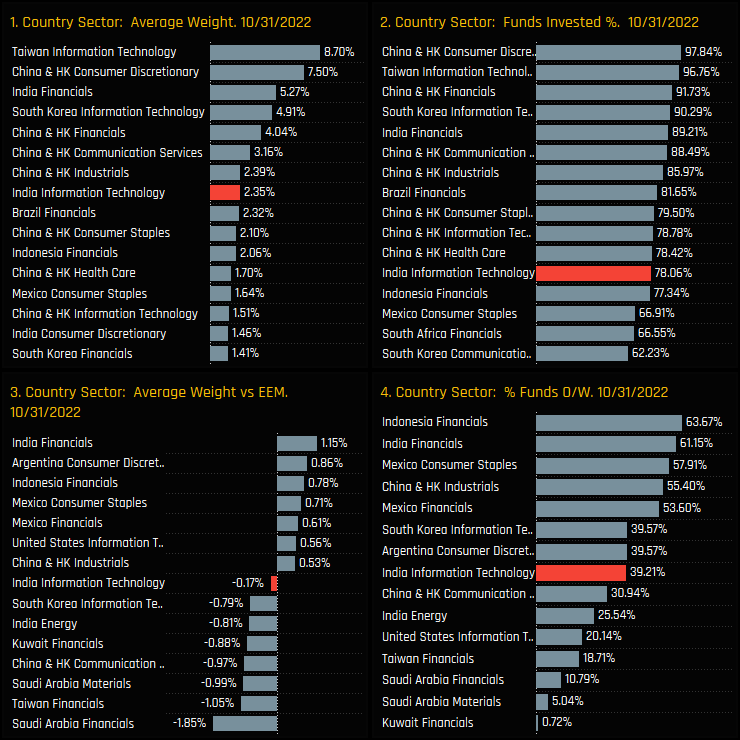
India’s Technology sector is suffering something of a mini-crisis of confidence. All 4 of our ownership metrics reached their peak at varying points over the last 12 months and have since moved lower. Of particular note is the move from a net overweight of +0.5% to net underweight of -0.17% (ch2) and the fall in the percentage of funds invested from a peak of 81% to 78%.
Compared to country/sector peers, ownership decreases in India Tech have been among the worst over the last 6-months. Again, the fall in relative to benchmark positioning stands out, with -10.43% of funds moving to underweight and weights versus the iShares EEM ETF falling by -0.39%.
Peer Group Positioning & Sentiment
India Technology is still a key exposure for active EM managers. It is the 8th largest country/sector in terms of average weight and the 12th most widely held.
The sentiment grid below highlights Indian Technology in the top-left quadrant, indicative of near record positioning combined with negative manager momentum.
Fund Holdings & Style Analysis
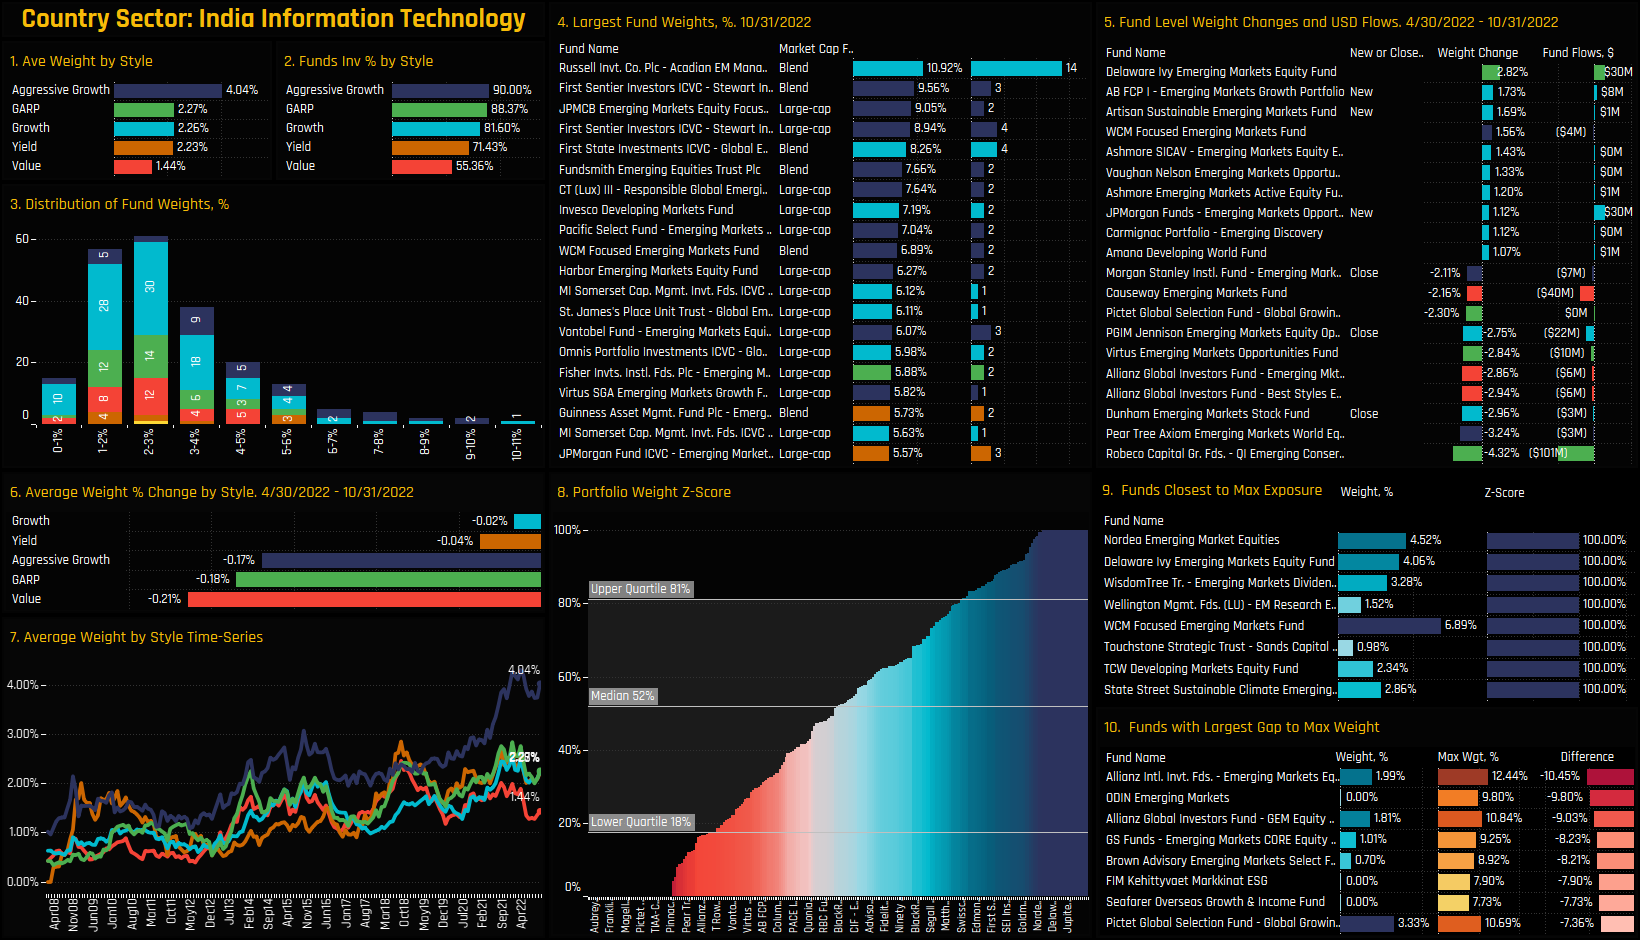
Indian Technology allocations are propped up by the Aggressive Growth funds in our analysis. Average weights of 4.04% with 90% of funds invested are head and shoulders above the other Style groups. Indeed, whilst the bulk of the weight distribution sits between 1% – 5%, the long tail to the upside is dominated by high growth strategies.
The larger fund level changes over the last 6-months are on the sell-side, but there has been two-way activity. New positions from AB EM Growth and Artisan Sustainable EM are offset by closures from Dunham EM Stock Fund and PGIM Jennison EM Equity Opportunity. Indeed, positioning is somewhat split, with a number of funds at their maximum allocations but plenty at either zero, or with large gaps to their maximum ever exposure (ch9&10).
Stock Holdings & Activity
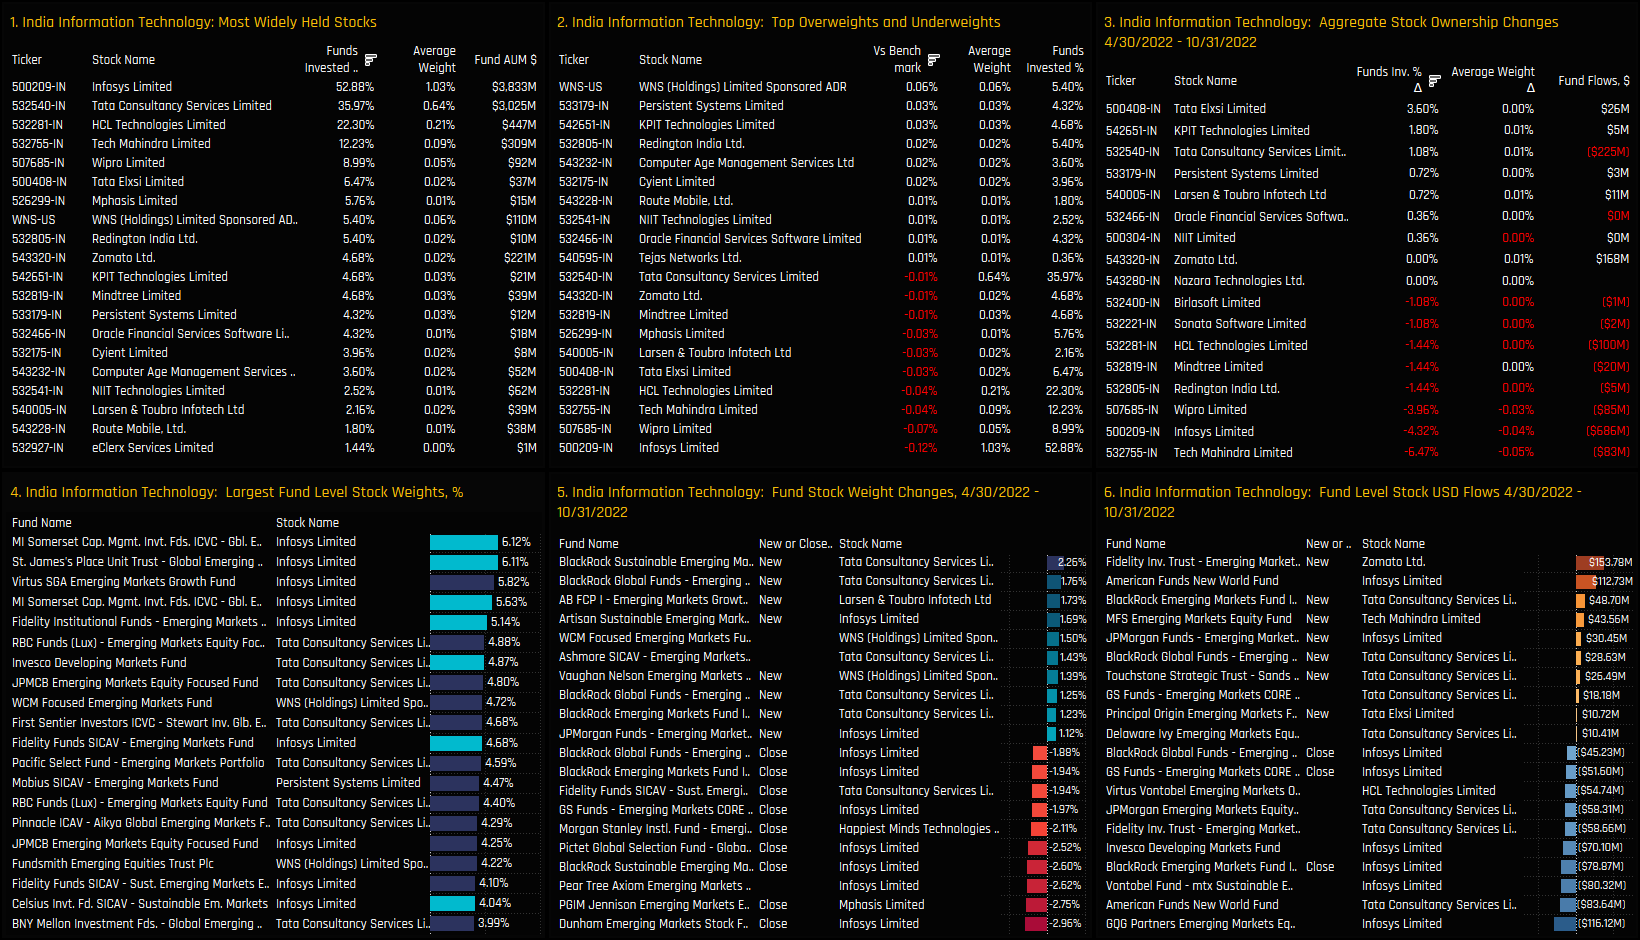
On a stock level, Infosys Limited is the most widely held company, owned by 52.9% of managers at an average weight of 1.03%. It also accounts for the bulk of the high conviction holdings in the sector, led by 6%+ positions from Somerset and St James Place. Tata Consultancy Services and HCL Technologies Limited form the 2nd tier, with Infosys, Wipro Limited and Tech Mahindra the key underweights.
Stock activity between 04/30/2022 and 10/31/2022 is heavily skewed to the sell-side. Infosys Limited and Tech Mahindra Limited lost 4.3% and 6.5% of investors respectively, led by closures from Dunham EM, BlackRock Sustainable EM and Pictet Global Growing Markets. Of the few positives, Tata Consultancy Services saw ownership levels rise after a number of BlackRock strategies opened up new exposures.
Conclusions & Data Report
Our ownership data shows a change in sentiment for the Indian Technology sector. Since the onset of the COVID-19 pandemic in early 2020, ownership levels had been on an upwards trajectory, and we are now starting the see the first signs of that running out of steam.
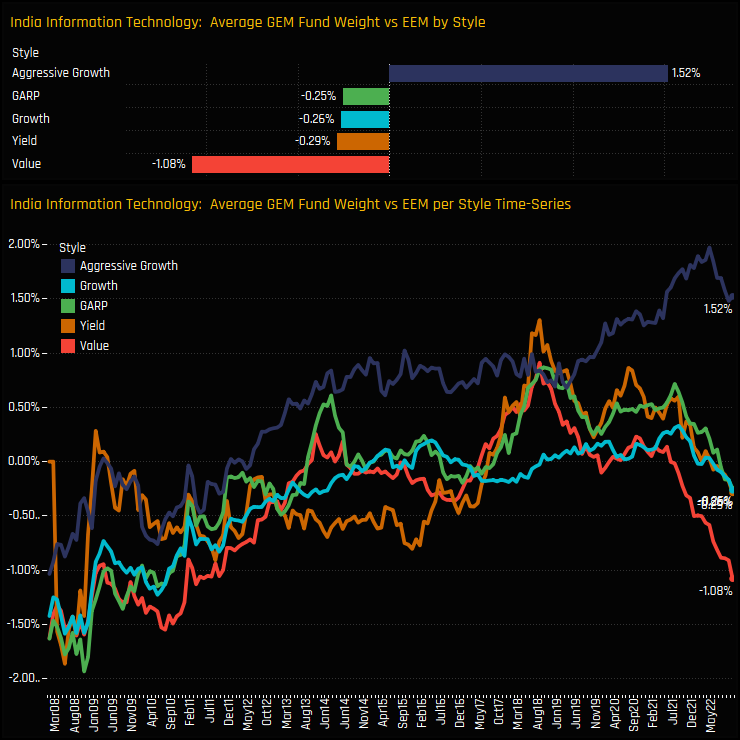
The chart to the right shows the time-series of relative weights in Indian Technology for each Style group. The most notable trend is that of Value investor positioning, who moved from a 1% overweight to a -1% underweight over the last 3 years, and sit close to their maximum ever underweight. If Indian Technology stocks no longer offers value to Value investors, then they need to offer growth for Growth investors. With fund positioning still high in relation to history, Indian Technology stocks look vulnerable if Growth expectations start to disappoint.
Please click on the link below for an extended data report on the Indian Technology sector among GEM active equity funds. Scroll down for ownership profiles on Infosys and Tech Mahindra and for more analysis on EM fund positioning.
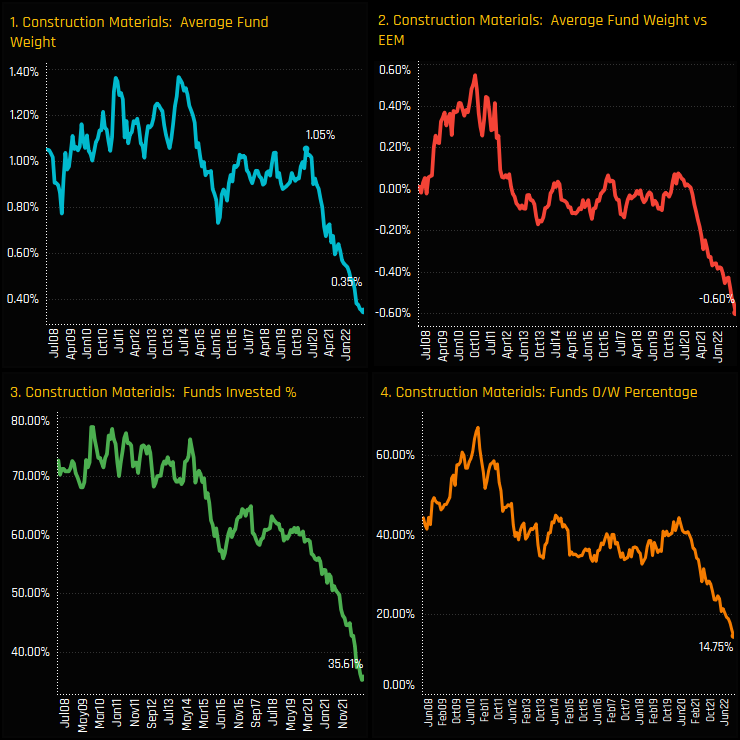
Allocations in the Construction Materials industry group are at rock bottom. All of our ownership metrics have been in decline since the late part of 2019, breaking out of the long-term range in 2020 and plunging to new depths through 2022.
The below charts show the change in our ownership metrics for each industry group from the start of the decline in December 2019 to the end of last month. Construction Materials saw the largest decline in funds invested over the period and the largest drop in the funds positioned overweight. This has been a large-scale rotation.
Fund Holdings & Activity
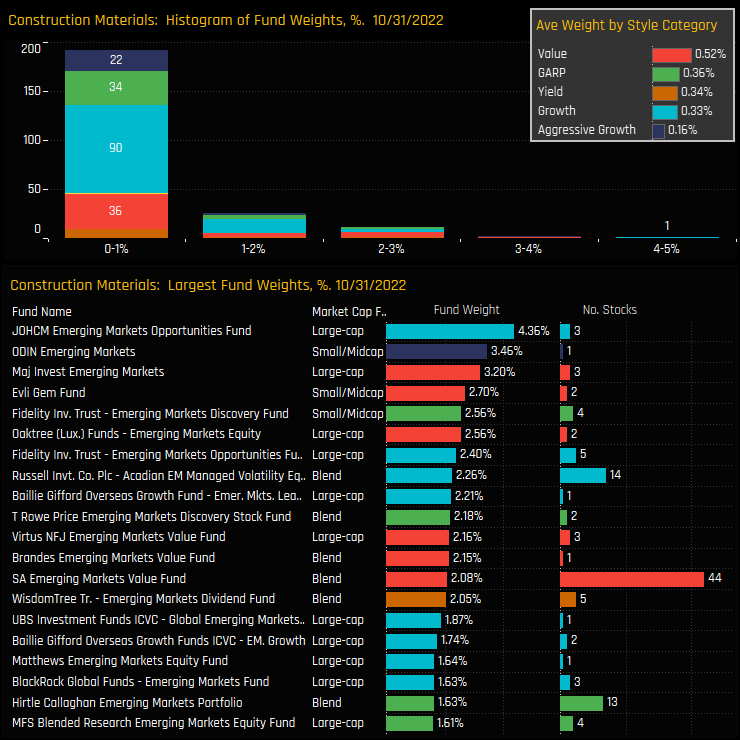
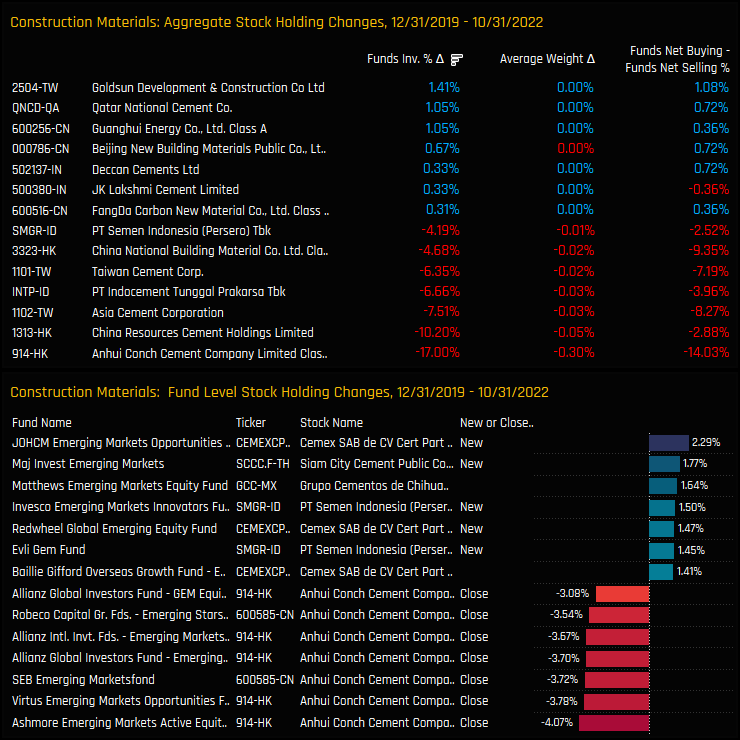
On a Style basis, Value and GARP managers reduced exposure the most, with the percentage of funds invested in each group falling by 32.6% and 25.3% respectively. Closing positions far outweighed openings, led by Harbor EM Equity (-4.97%), Principal Origin EM (-4.61%) and TT EM Unconstrained (-4.51%).
This leaves EM investors lightly positioned, with the majority holding less than a 1% stake save for a small group of funds allocating more than 2%. Value investors are the most aggressively positioned, but only by a small margin.
Stock Holdings & Activity
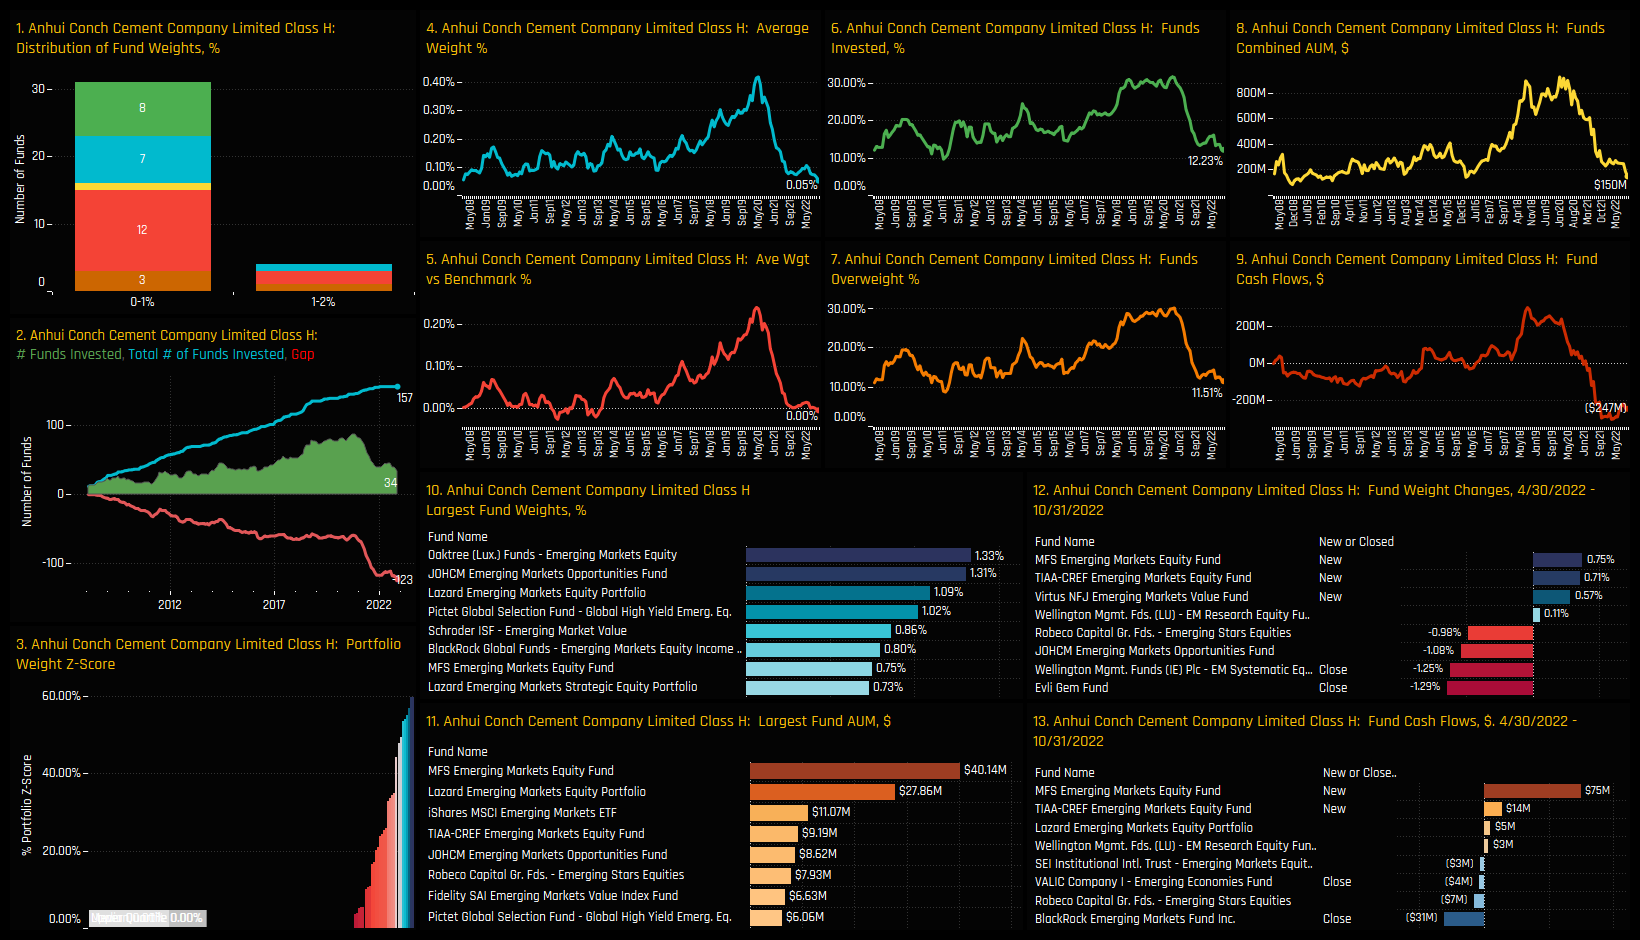
Stock activity between 2019 and today reflects the massive reallocation away from the industry group. Anhui Conch Cement bore the brunt of the selling, with 17% of the funds in our analysis closing exposure, causing weights to fall by -0.30%. China Resources Cement, Asia Cement Corporation and PT Indocement Tunggal all saw investment levels drop, but to a lesser degree.
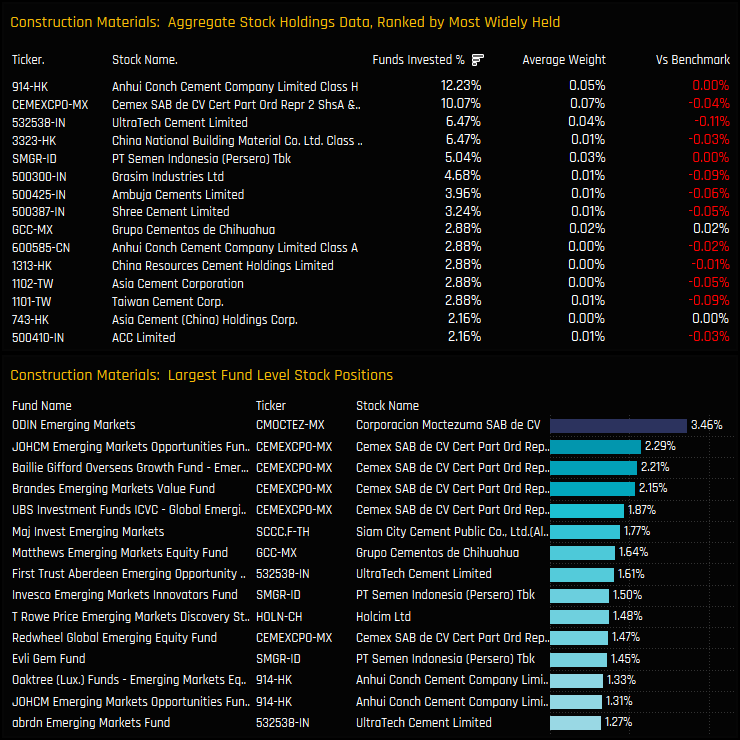
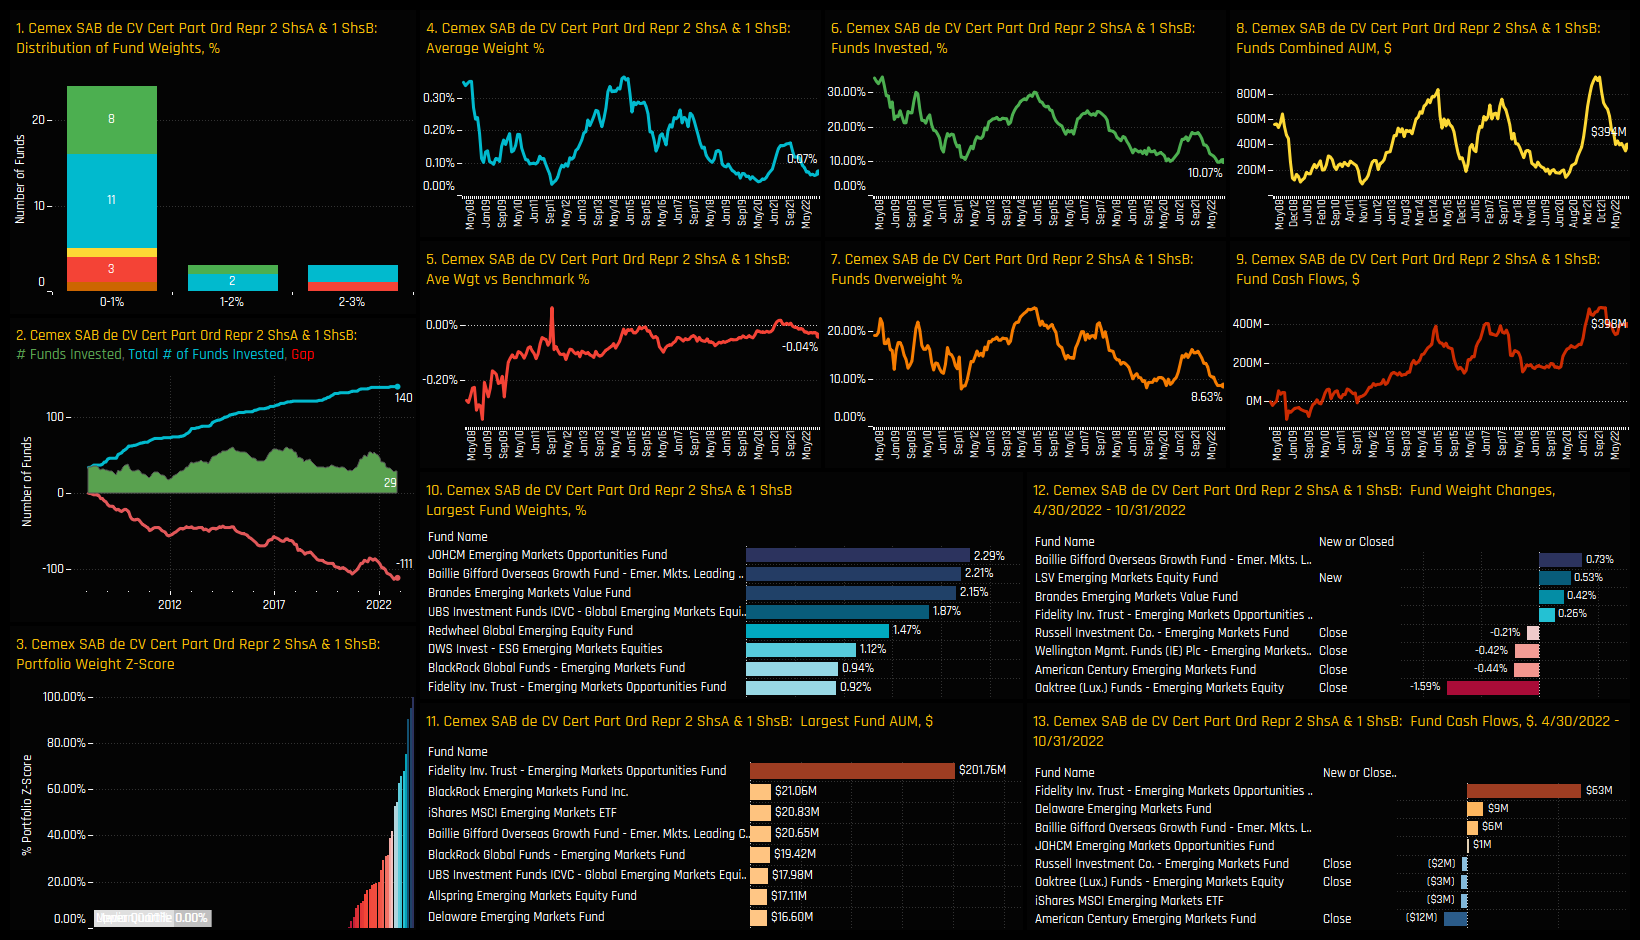
This leaves stock investment in the Construction Materials industry group at extremely low levels. The most widely held stock is Anhui Conch Cement with just 12.2% of funds invested, followed by Cemex SAB on 10%. High conviction positions are concentrated in the Mexican names of Corporacian Moctezuma and Cemex SAB.
Conclusions & Data Report
The slump in exposure in the Construction Materials sector has been relentless. Starting in late 2019, fund holdings have seen month on month declines, leaving investors positioned at their lowest levels in well over a decade.
As it stands, EM funds are not positioned for a turnaround. With 65% of funds holding no exposure and 85% positioned underweight, sentiment is as rock bottom as it gets (see Sentiment Grid opposite). With the recent headlines on a government support package for the Real Estate sector, now could be an opportune time to reassess the investment case.
Please click on the link below for an extended data report on the Construction Materials sector among GEM active equity funds. Scroll down for ownership profiles on Anhui Conch Cement and Cemex SAB. Scroll to the bottom of the report for the latest edition of the GEM Equity Fund Ownership Report.
For more analysis, data or information on active investor positioning in your market, please get in touch with me on steven.holden@copleyfundresearch.com


