In this issue:
UK Energy: Investors Split as Tentative Rotation Begins
UK Airlines: How Low Can They Go?
UK Apparel/Footware Surge
The Vodafone Exodus
276 Active UK Funds, AUM $161bn
UK Energy: Investors Split as Tentative Rotation Begins
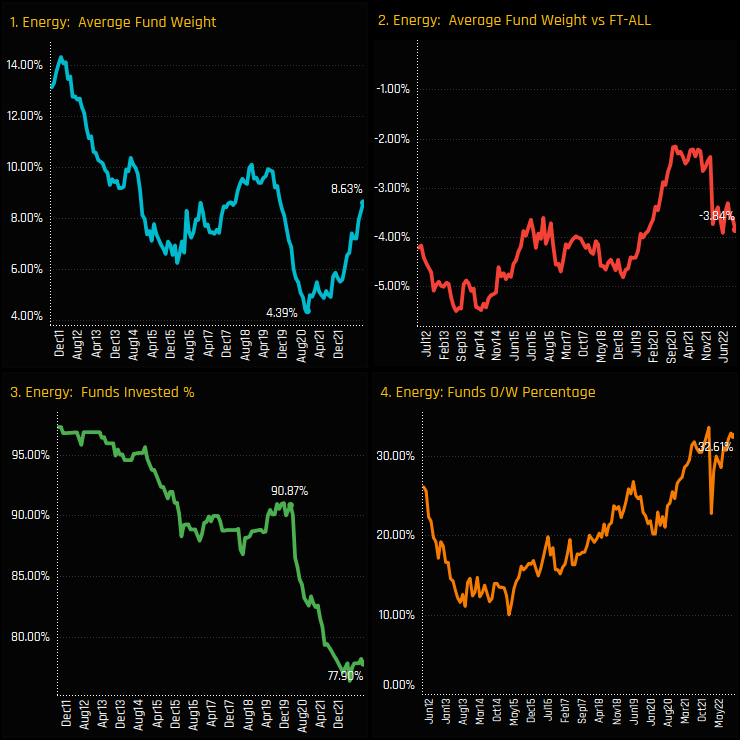
Average holding weights in the UK Energy sector are on a surge. Among the 276 funds in our analysis, the average portfolio allocation stands at 8.63%, the highest level in 3-years and nearly double the low of 4.39% back in October 2020 (ch1). Whilst this may seem positive on first glance, other ownership metrics tell a different story. Chart 3 shows the percentage of funds with exposure to the Energy sector, falling from 90.9% of funds in February 2020 to just 77.9% today and not seeing the same v-shaped recovery. Charts 2 and 4 highlight the average Energy weight versus the SPDR FTSE All Share ETF, with Energy held underweight by -3.84% on average and just 32.6% of funds positioned overweight.
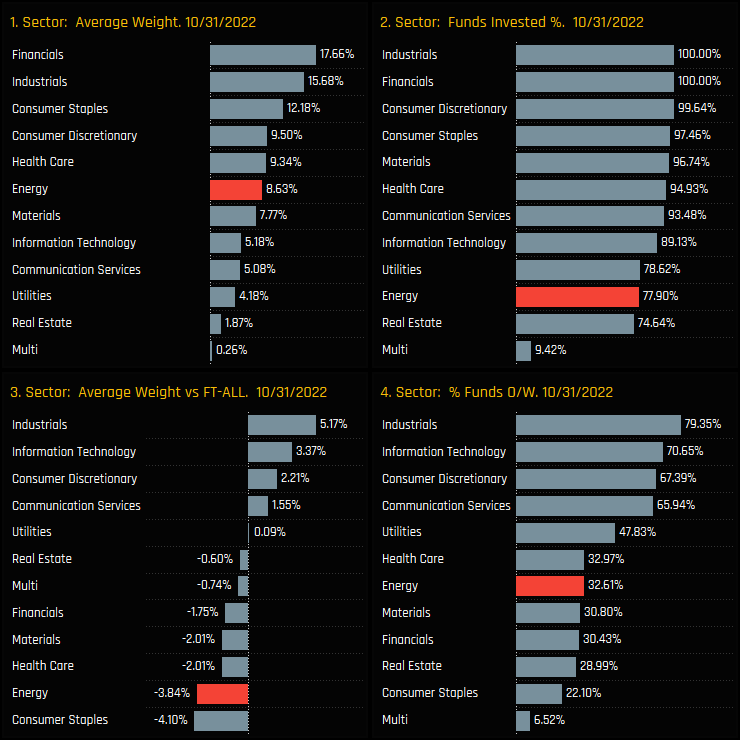
Energy represents the 6th largest portfolio allocation on an average weight basis (ch1), yet is the 10th most widely held (ch2). Energy stocks are owned by fewer funds than Utilities stocks and only marginally more than Real Estate. In contrast, at the top of the tree the Industrials and Financials sectors are held by every single fund in our analysis. On a relative to benchmark basis, the net Energy underweight of -3.84% is 2nd only to the Consumer Staples sector, offset by significant overweights in the Industrials, Information Technology and Consumer Discretionary sectors (ch3).
Sector Activity & Sentiment
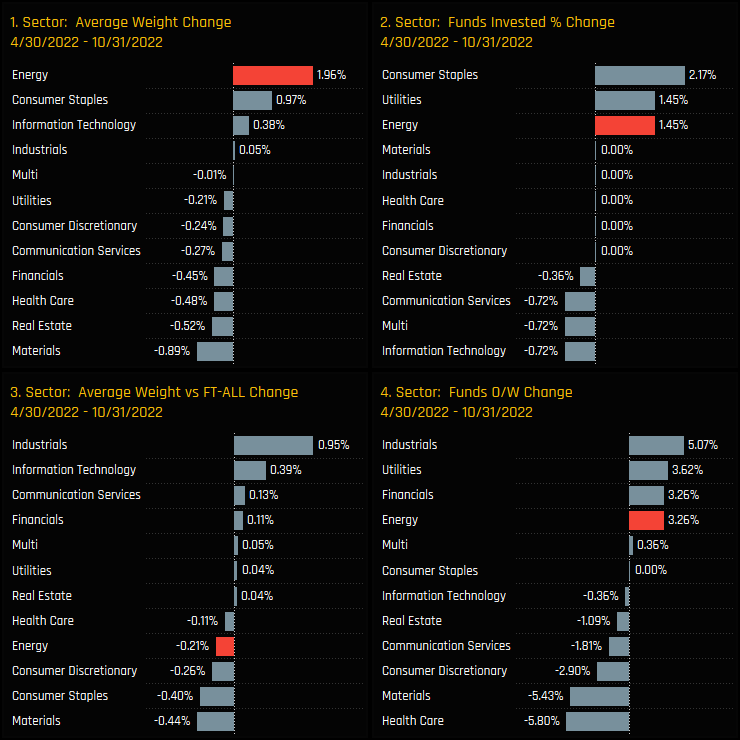
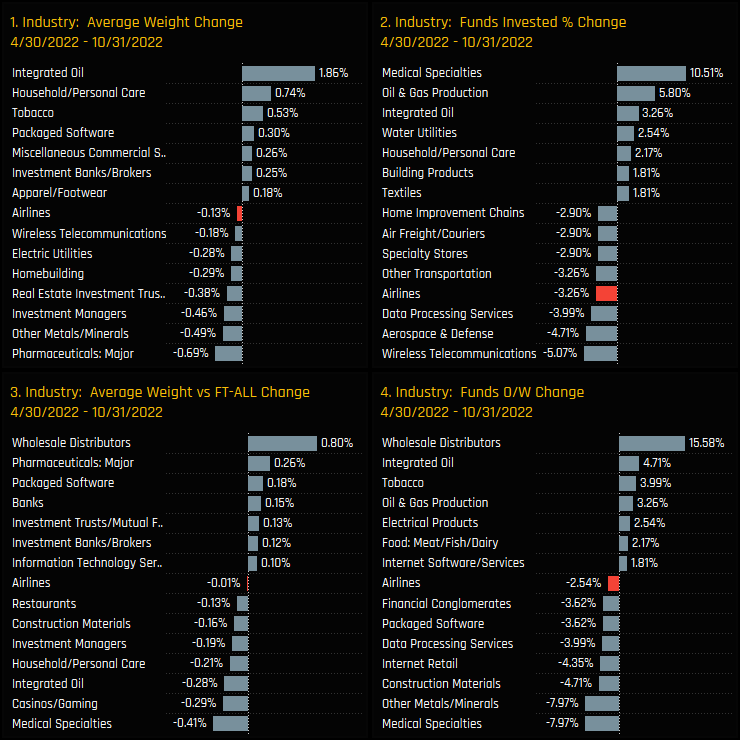
If we hone in on sector activity over the last 6-months, there are signs that sentiment is beginning to turn for the Energy sector. Ownership changes between 04/30/2022 and 10/31/2022 show the percentage of funds invested rising by a moderate +1.45% (ch2) and +3.26% of funds switching from underweight to overweight (ch4). Average weight increases were the most of any sector by a margin, driven higher by the outperformance of UK Energy but also by the size of new opening positions from selected managers (more below).
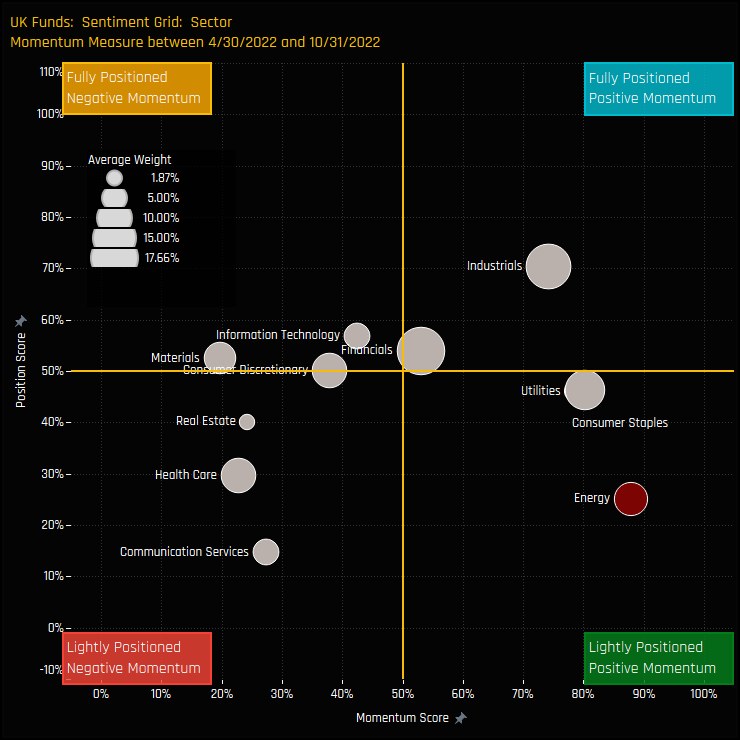
Bringing together current positioning, long-term positioning and more recent manager activity is the Sentiment Grid below. It shows where current positioning in each sector sits versus its own history going back to 2011 on a scale of 0-100% (y-axis), against a measure of fund activity for each sector between 04/30/2022 and 10/31/2022 (x-axis). Energy sits in the bottom right hand quadrant, indicative of a sector that is seeing positive activity among active managers versus other sectors, but also one in which positioning is towards the lower end of history.
Fund Holdings & Style Analysis
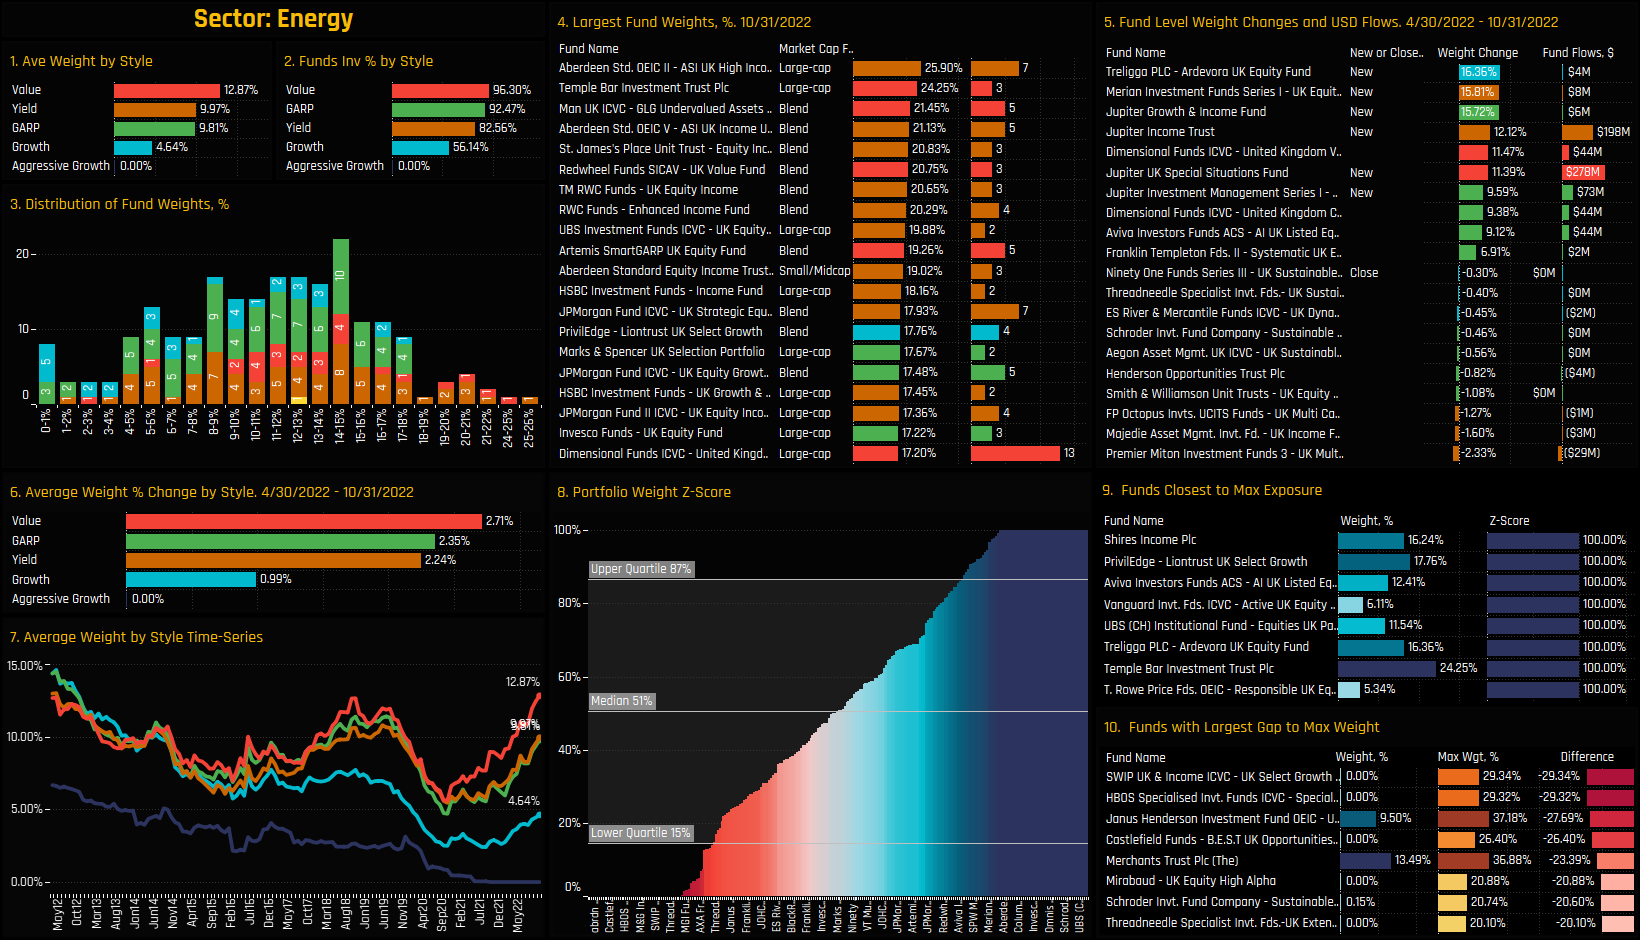
The charts below provide more granular detail on the make-up of Energy positioning among UK active funds. Charts 1-2 show the breakdown of ownership by Style, with Value funds the most heavily allocated. The average Value fund weight of 12.87% and 96.3% of funds invested stands in stark contrast to Growth managers (4.64%, 56.14%) and Aggressive Growth (0%, 0%). Chart 3 shows the distribution of Energy weights, with the main cluster between 8% and 18%. Top holders in Chart 4 are dominated by Yield and Value managers and led by Aberdeen UK High Income (25.9%) and Temple Bar Investment Trust (24.25%). New positions and large weight changes between 04/30/2022 and 10/31/2022 back up the large increase in net Energy weight over the period, with Treligga UK Equity, Merian UK Equity and a host of Jupiter Funds all re-entering the Energy sector in size (ch5).
Chart 6 shows the change in Energy weight over the same period split by Style, with Value once again ahead of the pack. Chart 7 shows the long term Energy weight split by Style, and perhaps the demise of Energy in Growth and Aggressive Growth portfolios is the key metric here. Chart 8 shows the portfolio Z-Score for the Energy sector for each fund in our analysis. Each bar represents a fund, with a score of 100% indicating today’s weight is the highest on record for that fund, and 0% the lowest. We have a bar-bell picture here, with a good number of funds at their maximum exposure and a number at their lowest. Chart 9 shows Shires Income, PrivilEdge UK Select, Vanguard Active UK Equity and many others at their maximum ever exposure, whilst chart 10 lists the funds with significant gaps to their maximum ever exposure – the UK market is clearly split on Energy.
Stock Holdings & Activity
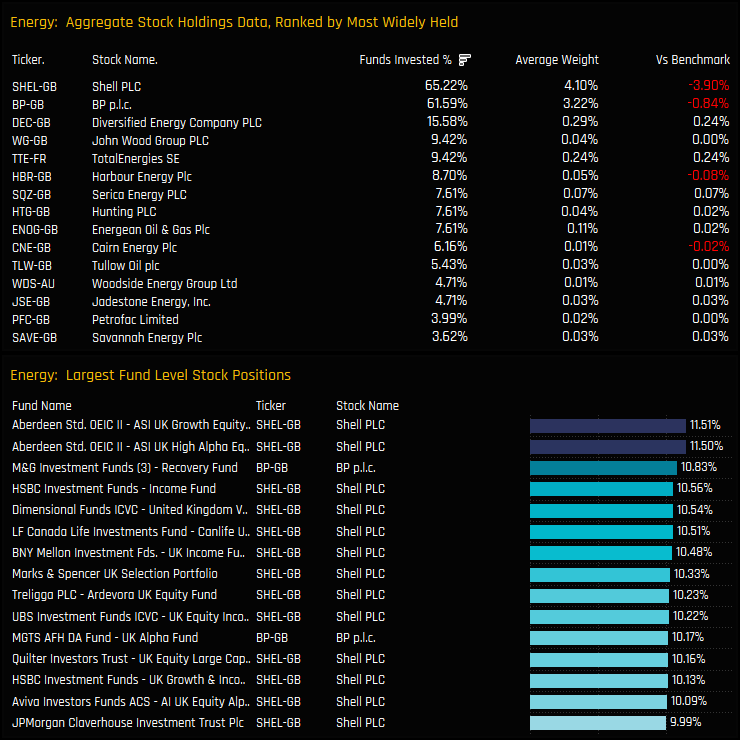
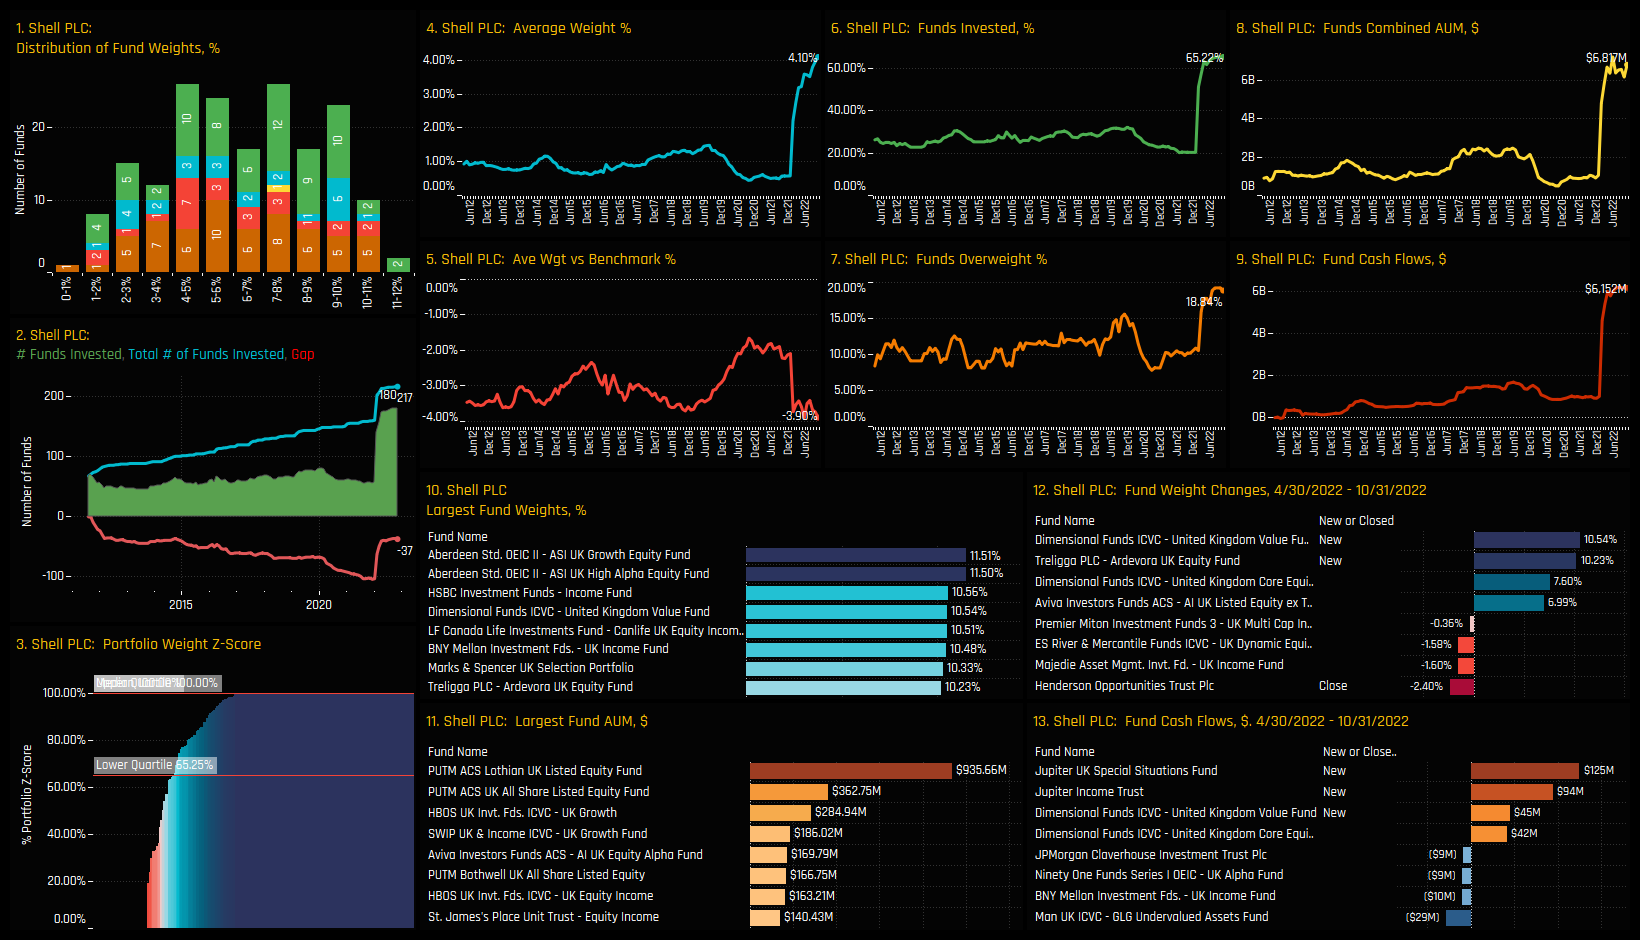
The top chart below breaks down the Energy sector by stock. The first column shows the percentage of funds invested in each stock, the 2nd column the average weight and the 3rd the net weight versus the FTSE All Share index weight. Energy is very much a 2 horse stable, with Shell PLC and BP PLC held by 65.2% and 61.6% of funds respectively and accounting for 7.32% of the total 8.63% net Energy weight. There is a significant ownership gap to the next most widely held stocks of Diversified Energy Company PLC and John Wood Group PLC. The bottom chart shows the largest fund level stock positions in the sector and is dominated by high conviction holdings in Shell PC.
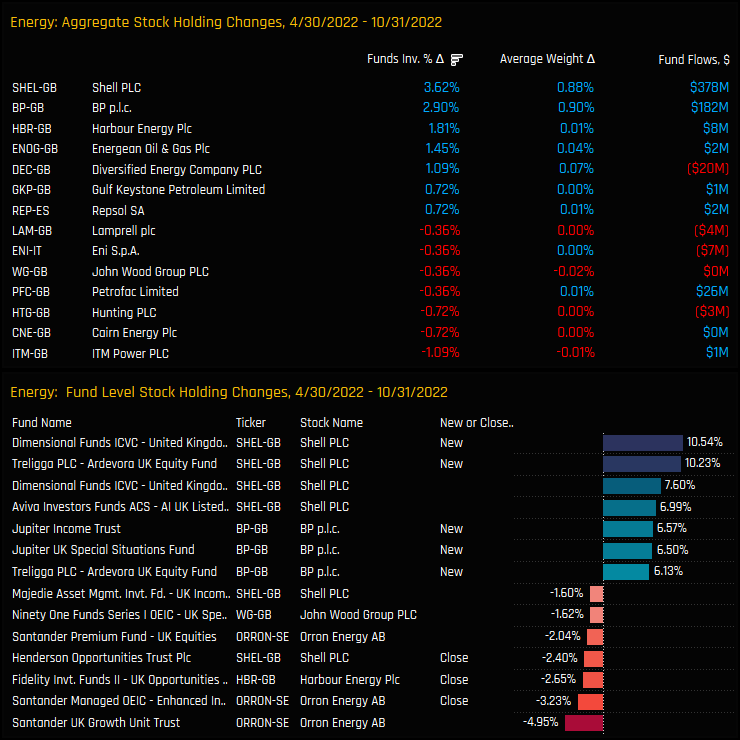
The top chart below shows the aggregate changes in stock positioning among UK managers over the last 6-months. Changes are skewed to the buyside, with the percentage of funds invested in both Shell PLC and BP PLC rising by +3.62% and +2.90% respectively. The bottom chart shows the fund level changes that make up the aggregate changes in the top chart. Opening positions in Shell PLC by Dimensional UK Value and Treligga UK Equity, together with Jupiter Income Trust and Jupiter Special Situations in BP plc are the standouts.
Conclusions & Data Report
With 22.1% of managers having zero exposure to the Energy sector and 67.4% positioned underweight – the majority of active UK managers are not positioned for further outperformance of the energy sector. There is a split, with a number of funds scaling up exposure to the Energy sector and positioned at their highest ever levels, but on balance, those investors who sold out during the early stages of the COVID-19 pandemic have yet to buy back in.
There are tentative signs that this is changing, with ownership levels rising over the last 6-months, driven by Value and Yield funds and mainly in Shell PLC and BP PLC. Missing from the picture is the return of Growth and Aggressive Growth managers, who remain lightly positioned and clearly unconvinced by the investment case at present.
Please click on the link below for an extended data report on the UK Energy sector among UK active equity funds. Scroll down for ownership profiles on Shell PLC and BP PLC and for more analysis on UK fund positioning.
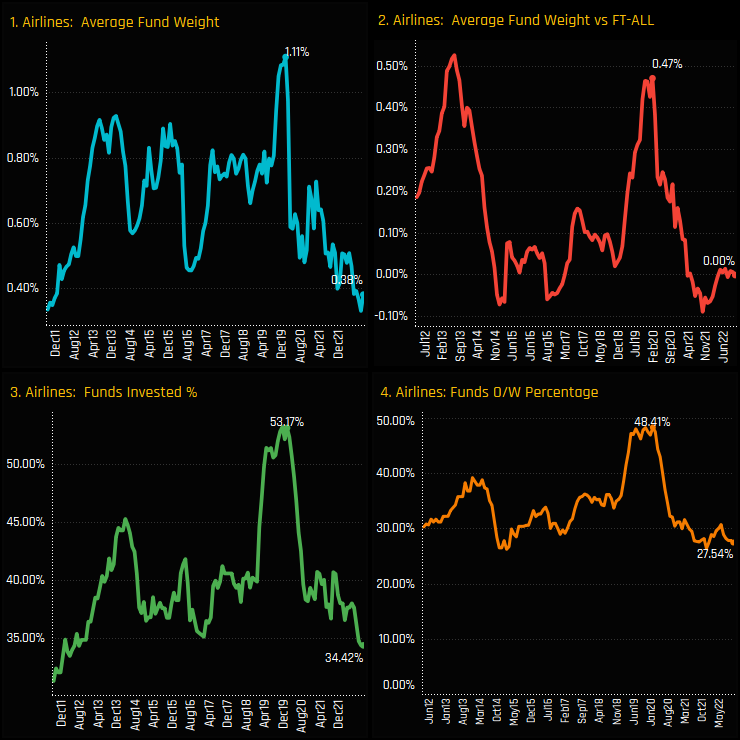
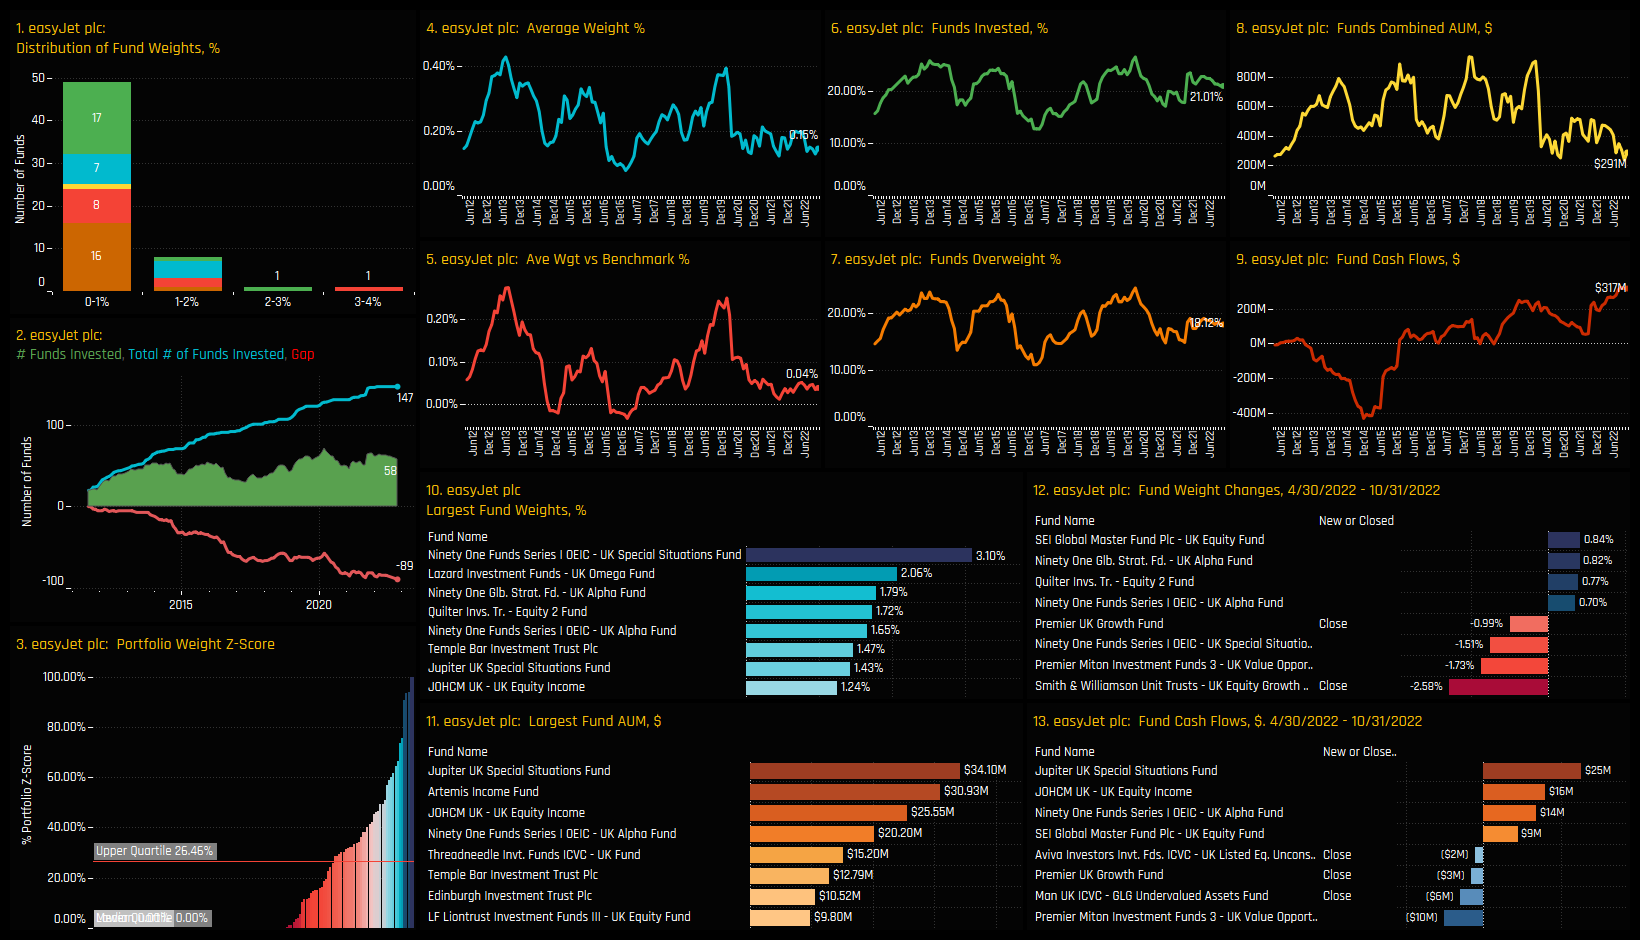
Peak Airlines exposure occurred in the months preceding the COVID-19 pandemic, when 53% of managers were invested at an average weight of 1.11%, or overweight the benchmark by +0.47%. Since then, following worldwide travel disruptions, fund exposure in the Airlines industry group has fallen heavily. Average weights now stand at 0.38% (ch1) and the percentage of funds invested at just 34.4% (ch3), both towards their lowest levels on record.
Fund activity over the last 6-months shows no signs of sentiment improving. All measures of ownership have reduced between 04/30/2022 and 10/31/2022, with -3.26% of funds closing out exposure, -2.54% moving to underweight and average weights falling by -0.13%.
Fund Holdings & Style Analysis
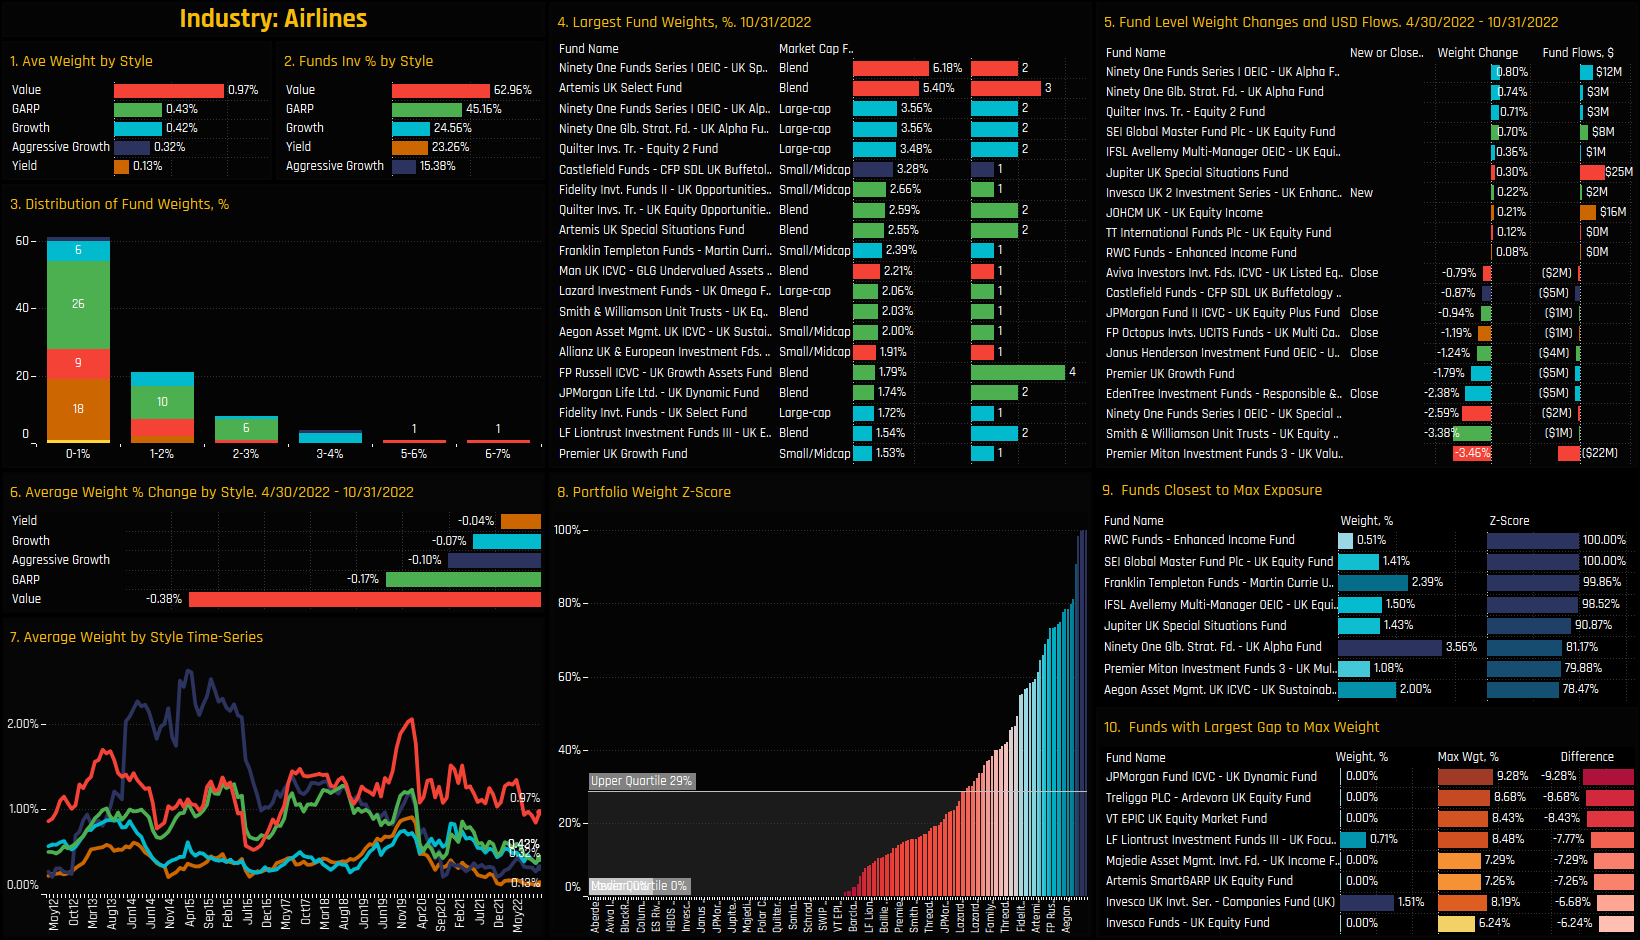
The distribution of fund holdings shows the majority hold between 0% and 2%, with a small tail to the upside led by Ninety One UK Special Situations (6.18%) and Artemis UK Select (5.4%). On a Style basis, Value and GARP managers are the most heavily exposed at present, though all Style groups have seen exposure fall since early 2020 (ch7). Fund level changes over the last 6-months are dominated by those closing out exposure or scaling back weights heavily (ch5).
Chart 8 shows the portfolio Z-Score for the Airlines sector for each fund in our analysis. Each bar represents a fund, with a score of 100% indicating today’s weight is the highest on record for that fund, and 0% the lowest. Over 3/4 of managers have a Z-score of less than 30%, indicative of a low-conviction stance by UK active managers at present.
Fund Holdings & Style Analysis
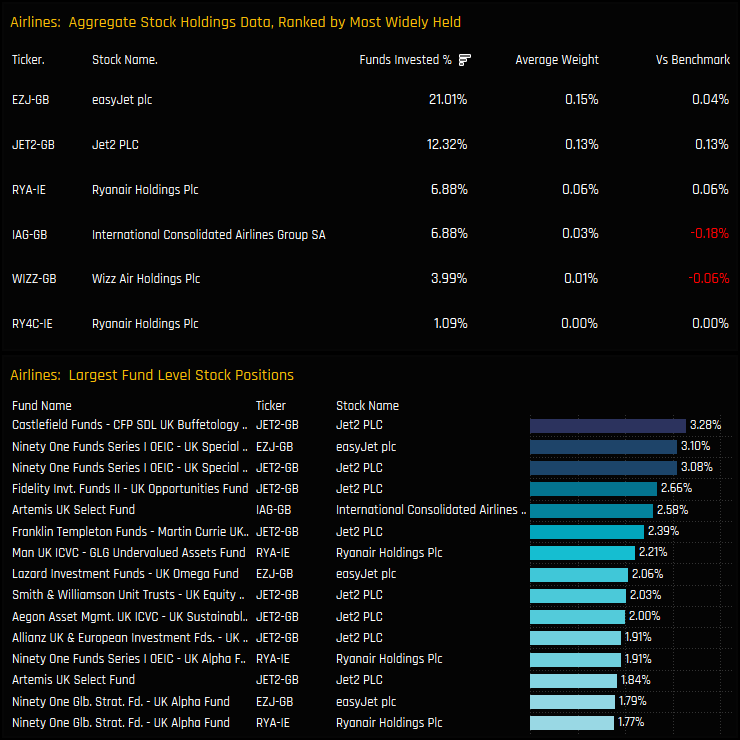
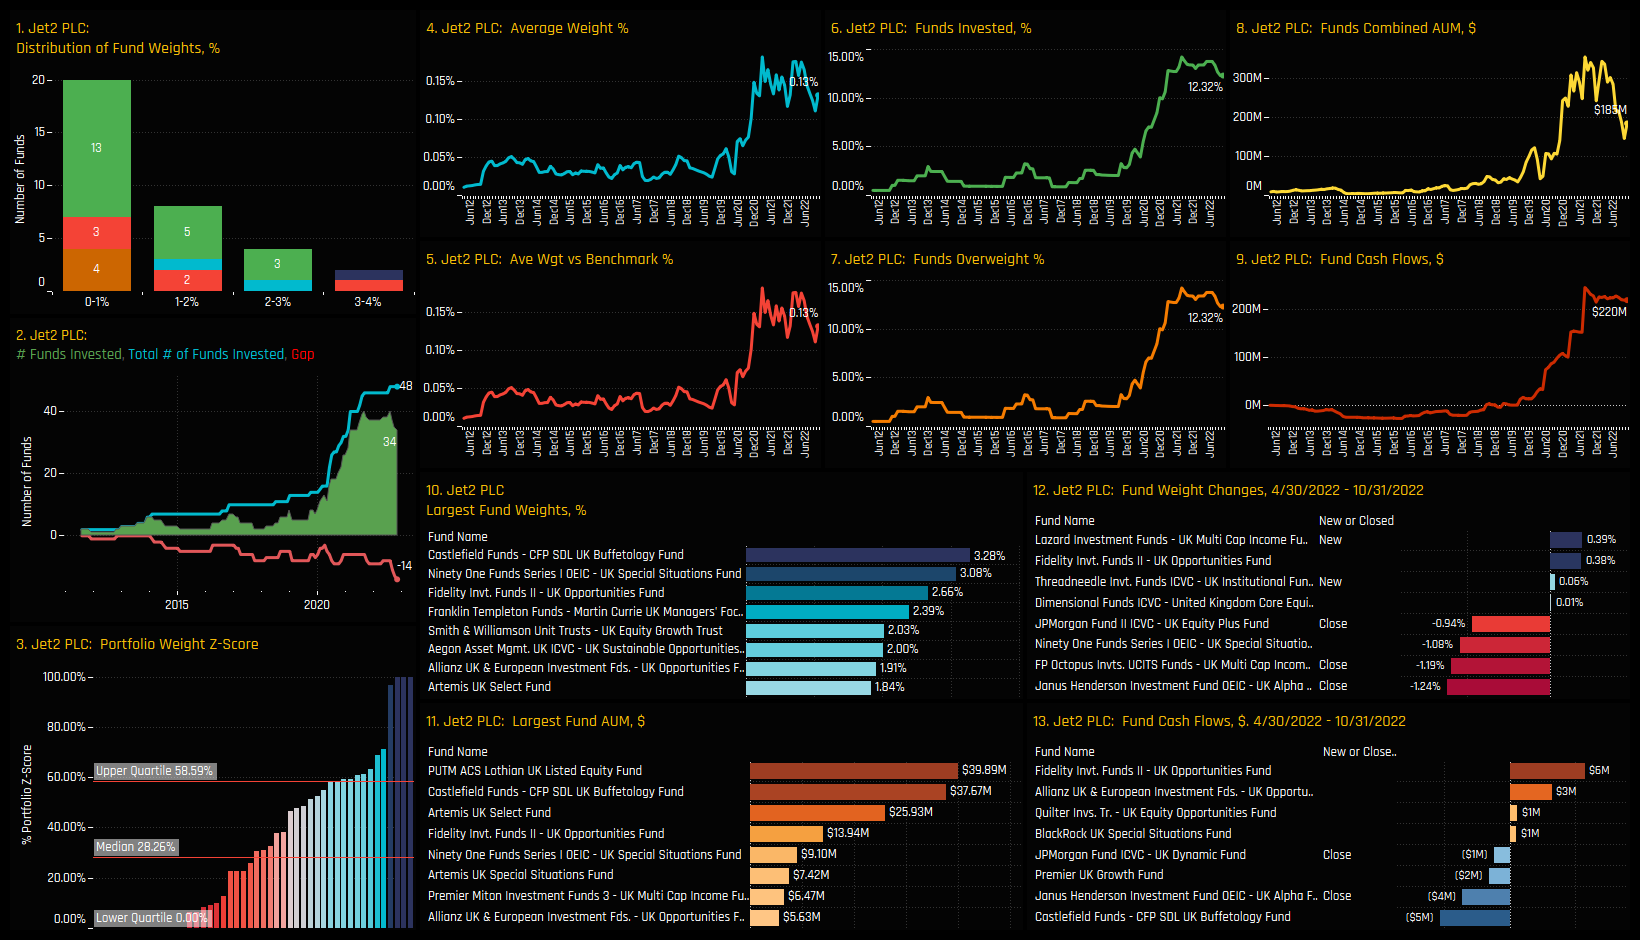
Aggregate stock holdings data is shown in the top chart below, and highlights easyJet plc as the most widely held stock, owned by 21% of managers at an average weight of 0.15%. Despite this, Jet2 PLC is more common among the high conviction holdings in the bottom chart, led by Castlefield Funds UK Buffetology (3.28%) and Ninety One Special Situations (3.08%).
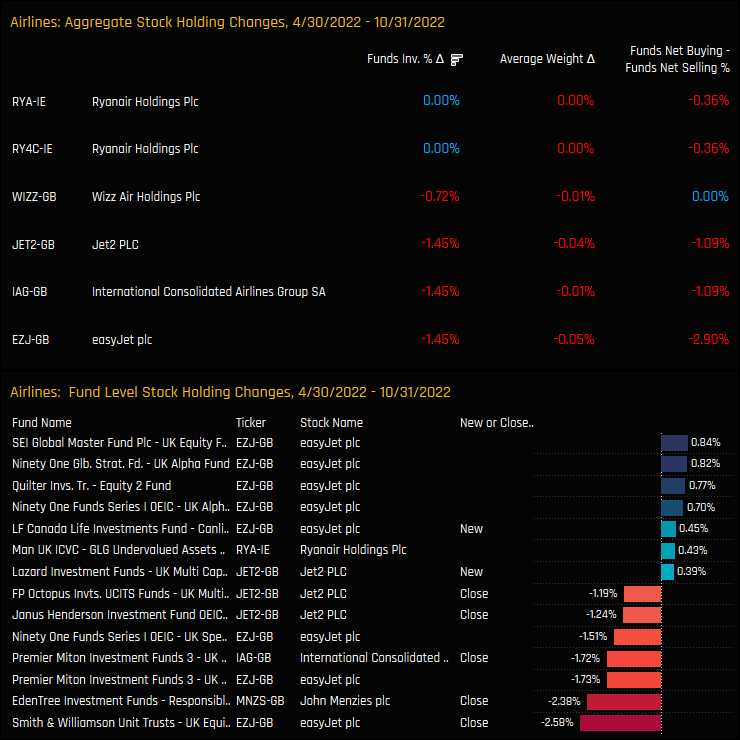
Changes in stock holdings between 04/30/2022 and 10/31/2022 show an exclusively negative picture. The percentage of funds invested in all key names fell over the period, with -1.45% of funds closing holdings in easyJet plc, International Consolidated Airlines Group and Jet2 PLC.
Conclusions & Data Report
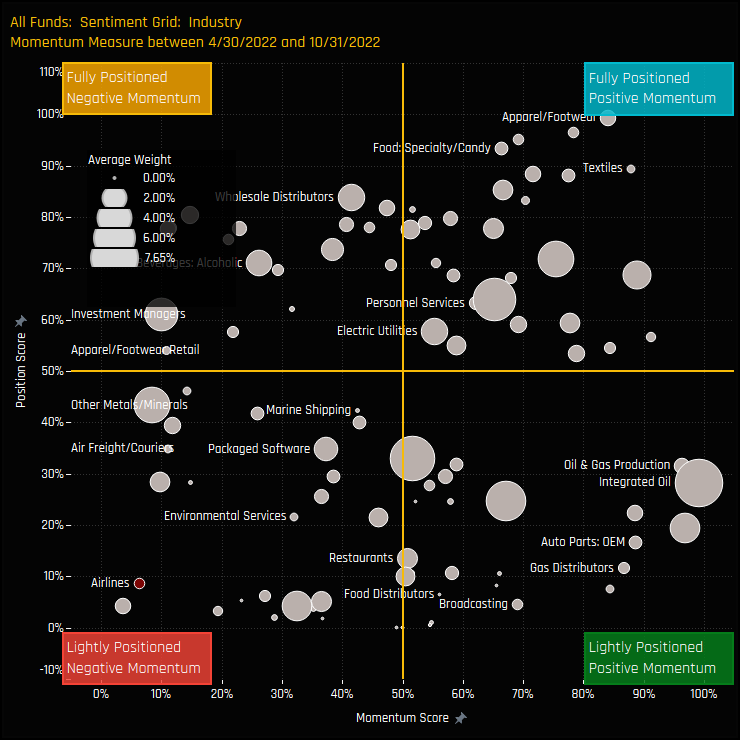
The chart to the right shows the Sentiment Grid for UK Industry groups. It shows where current positioning in each Industry sits versus its own history going back to 2011 on a scale of 0-100% (y-axis), against a measure of fund activity for each industry between 04/30/2022 and 10/31/2022 (x-axis). Airlines sit in the bottom far left quadrant, indicative of an Industry group towards its lowest levels of positioning in history, combined with continued selling and scaling back of exposures.
Sentiment in the Airlines industry group has rarely looked this bad among UK active managers. As per the charts above, most of our ownership metrics are towards their lowest on record, and, rather than any signs of a reversal, the direction of travel appears to be lower. However, with 65.5% of funds not invested in the Airlines industry group, and the majority that are invested allocating less than 2%, one wonders how much lower positioning can actually go?
Please click on the link below for an extended data report on the UK Airlines sector among UK active equity funds. Scroll down for ownership profiles on easyJet PLC and Jet2 PLC and for more analysis on UK fund positioning.
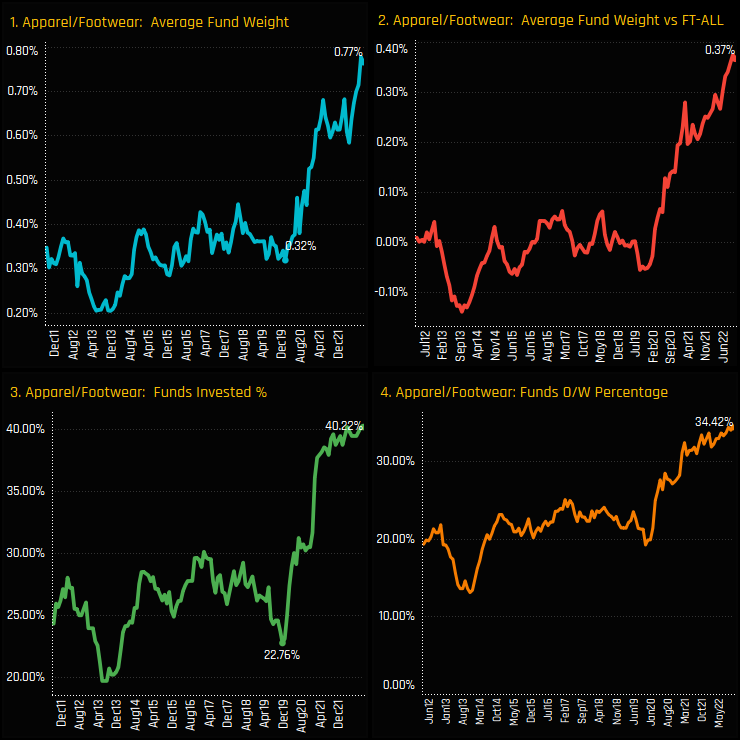
At the other end of the Sentiment spectrum sits UK Apparel & Footwear. Ownership levels have screamed higher among UK active funds, with the initial spike in early 2020 following through in to 2021 and 2022. Today’s average weight of 0.77% (ch1), overweight of +0.37% (ch2), funds invested of 40.22% (ch3) and funds overweight of 34.42% (ch4) are all the highest levels in our fund history.
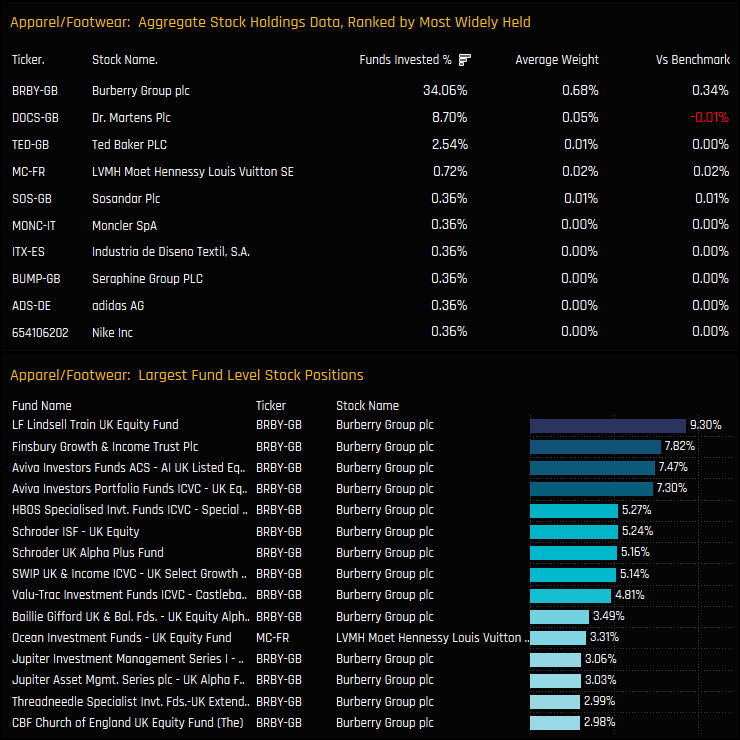
In reality though, when we talk about UK Apparel & Footwear we really mean Burberry Group plc and to a minor extent, Dr. Martens plc. Burberry Group accounts for 0.68% of the total 0.77% weight in the sector and is owned by 34% of UK managers. It also accounts for almost all of the top 20 high conviction positions in the Industry group, led by LF Lindsell Train UK Equity (9.30%) and Finsbury Growth & Income Trust (7.82%).
Burberry Group plc
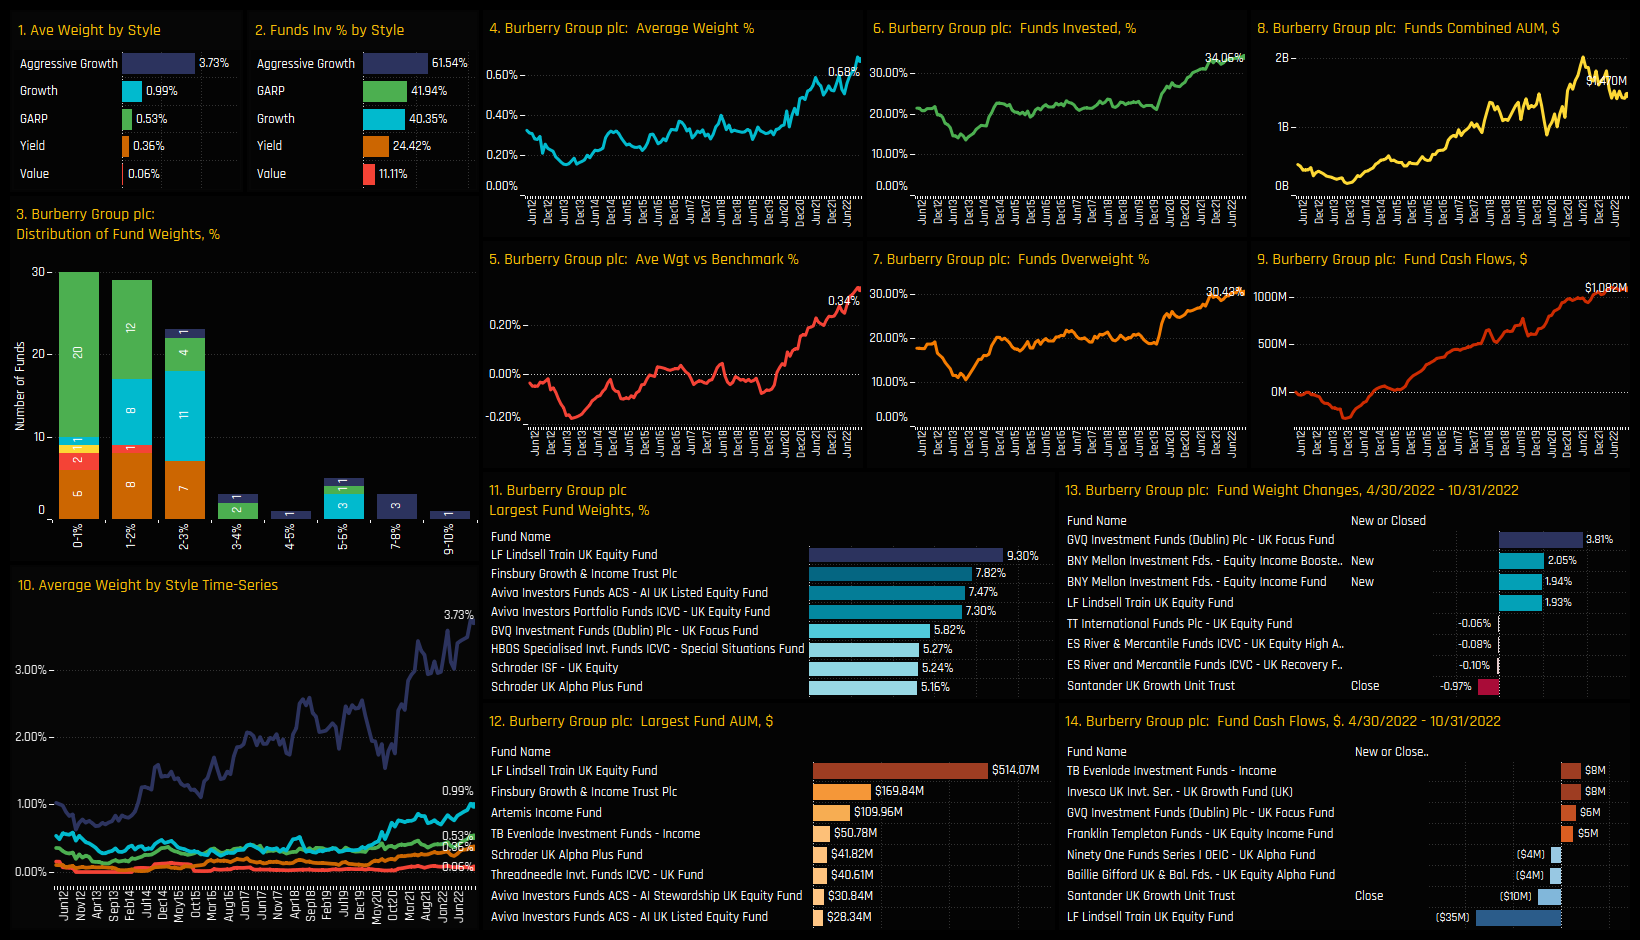
Long-term ownership trends for Burberry Group mirror those for the Industry group as a whole, with a picture of rising exposure and record holdings among UK equity funds. Most Funds hold less than a 3% weight (ch3), with a tail to the upside occupied by a number of Aggressive Growth UK Strategies. In fact, Aggressive Growth strategies have been the driving force behind Burberry’s rise, as shown in chart 10. This leaves a significant gap to other Style groups (ch1&2), most notably versus Value funds who have remained almost totally uninvested up until now.
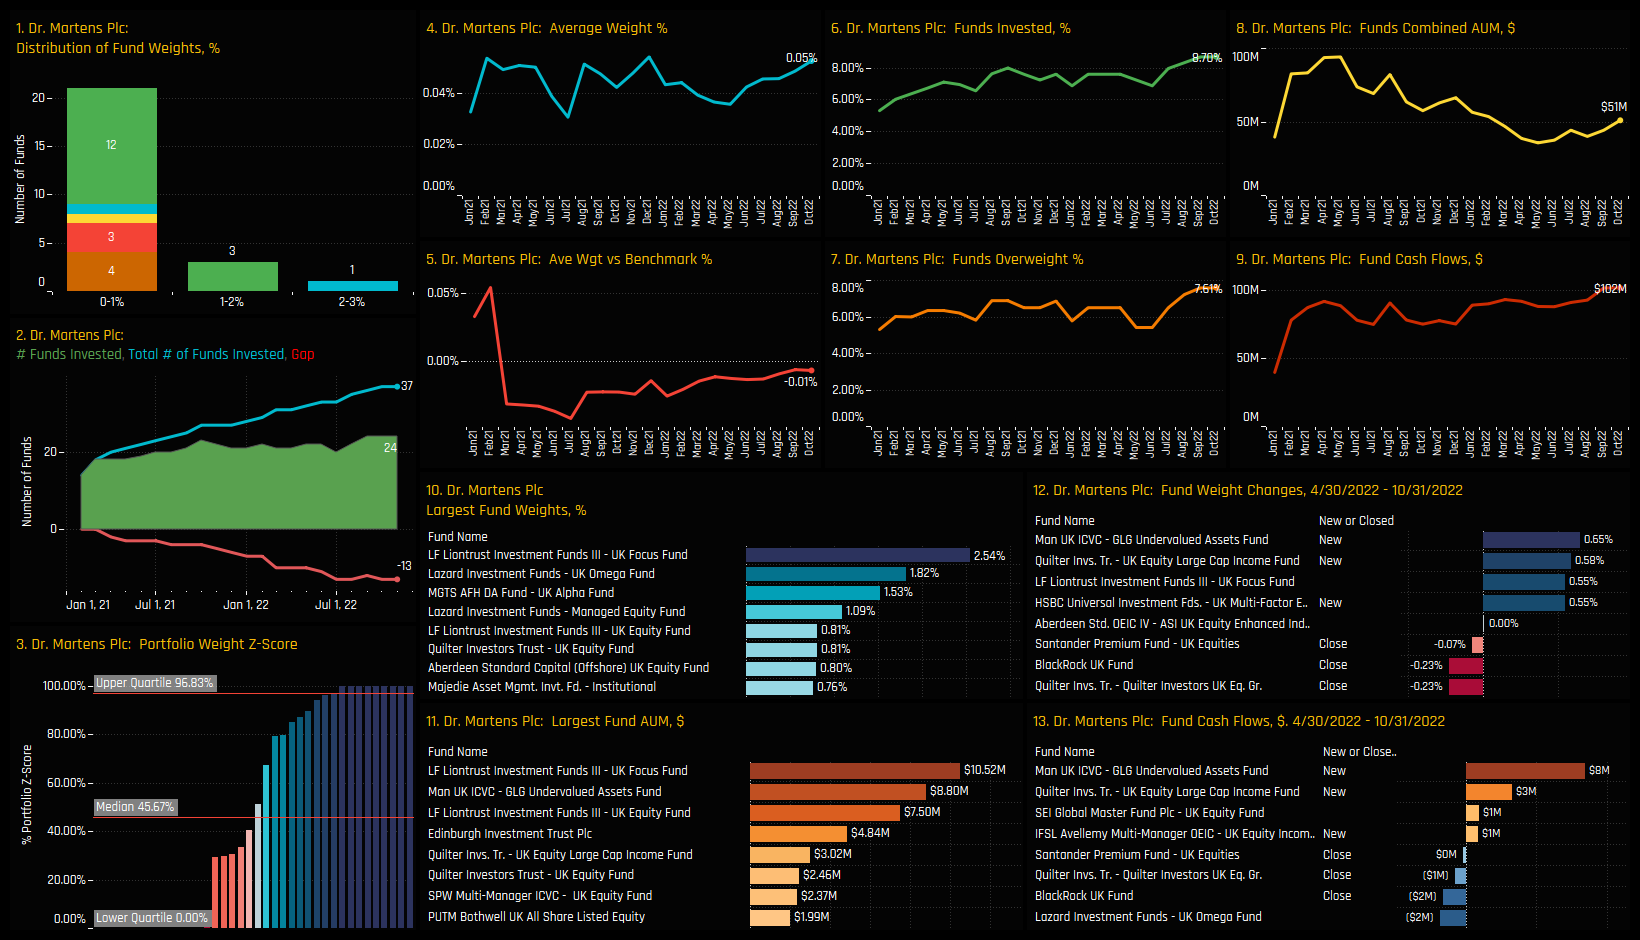
Dr Martens plc
Dr. Martens plc is a minnow by comparison, but nevertheless has maintained a decent ownership base since its listing in 2021. Position sizes are much smaller, topping out at 2.54% for LF Liontrust UK Focus. Fund activity over the last 6-months has been 2-way, with new positions by Man GLG Undervalued Assets and Quilter UK Large Cap Income offset by closures from Quilter UK Equity Growth and BlackRock UK.
Please click on the link below for the full data report on UK Apparel/Footwear positioning among active UK funds.
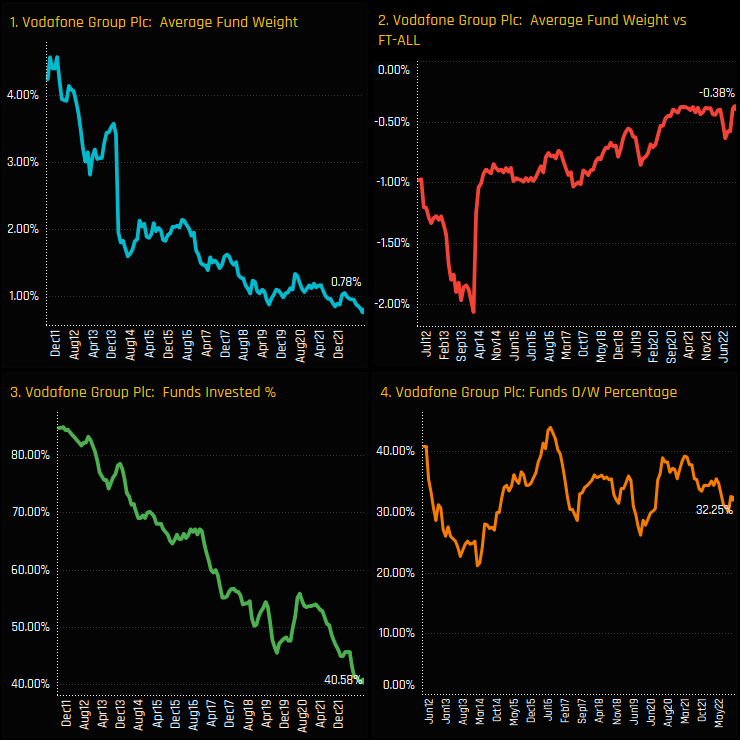
The appetite for UK investors to include Vodafone in their portfolio is dwindling. Once owned by over 80% of UK managers a decade ago, just 40.6% of the UK funds in our analysis now own a position, the lowest level on record (ch3). Average fund weights have fallen to a record low of 0.78%, representing an underweight versus the FTSE All Share ETF of -0.38%.
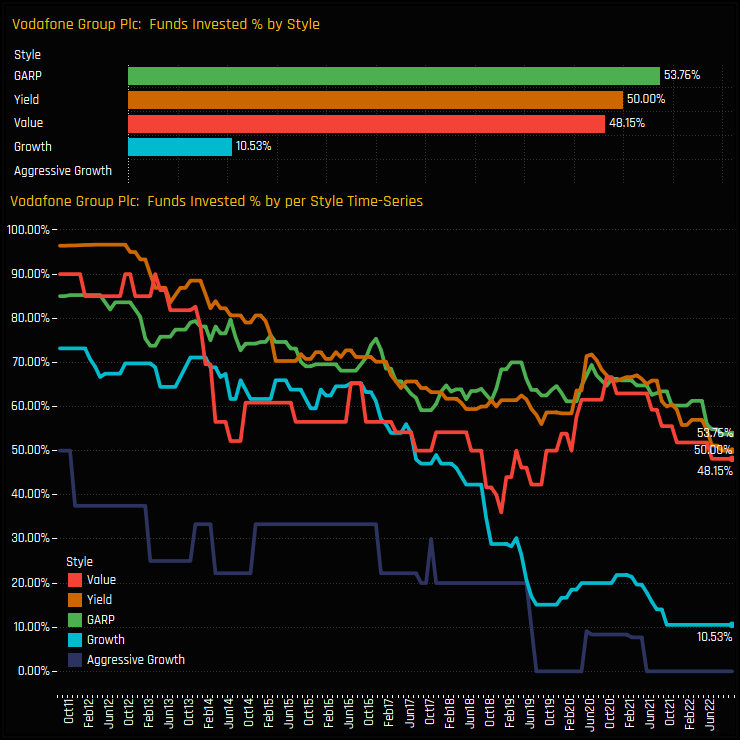
The charts below show the percentage of UK funds in each style group who hold a position in Vodafone (top chart) and the trends over time (bottom chart). The decline in Vodafone exposure has been driven by a massive reduction in positioning among Growth and Aggressive Growth managers. Yet even among Value, Yield and GARP funds ownership levels are close to their lowest levels on record.
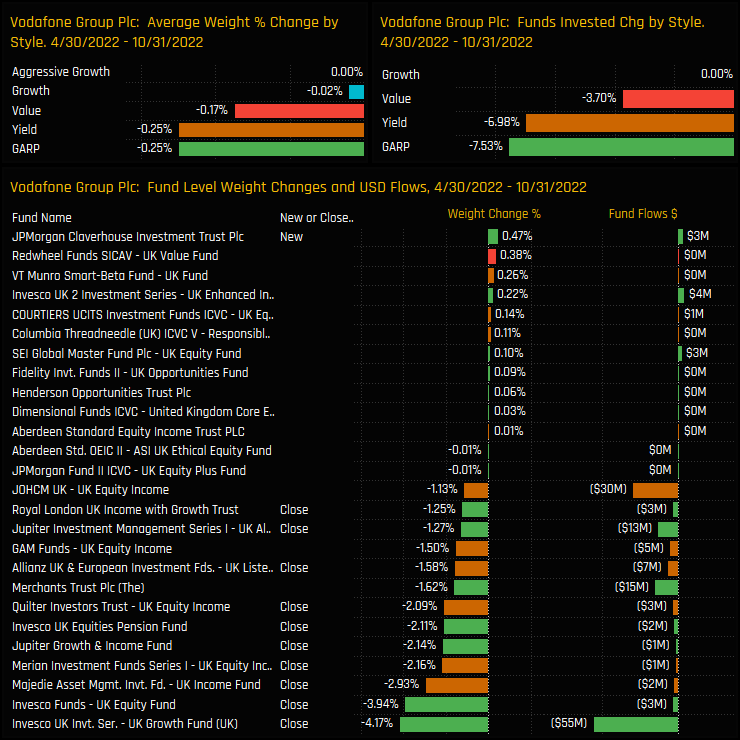
Fund Holding Changes
The below charts look at the changes in Vodafone ownership over the last 6-months. The balance of fund activity is skewed to the sell-side and led by the GARP and Yield style groups, with 7.5% and 6.98% of managers closing exposure over the period, respectively. UK strategies from Invesco, Merian, Majedie, Jupiter and Quilter all closed Vodafone positions between 04/30/2022 and 10/31/2022.
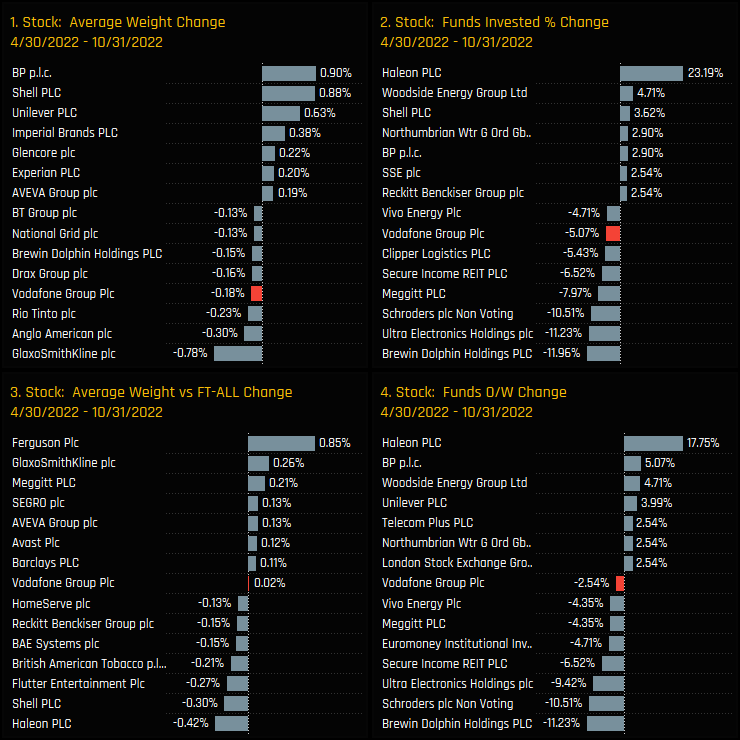
Compared to other stocks in the UK investible universe, Vodafone has been among the worst in terms of ownership declines over the last 6-months. In terms of outright ownership changes in chart 2, Vodafone is the worst if we strip out stock delistings, and the fall in average weight of -0.18% is the 4th largest in the UK. This is an active rotation.
Conclusions & Data Report
In over a decades worth of holdings data for UK active funds, ownership in Vodafone has never looked so bad. Sentiment is at rock bottom, with the number of funds holding a position at all-time lows and an increasing number of funds deciding to throw in the towel. Of particular concern is that as Growth managers head for the exit, they are not being replaced by Value managers, who still have little interest to pick up Vodafone at current valuations.
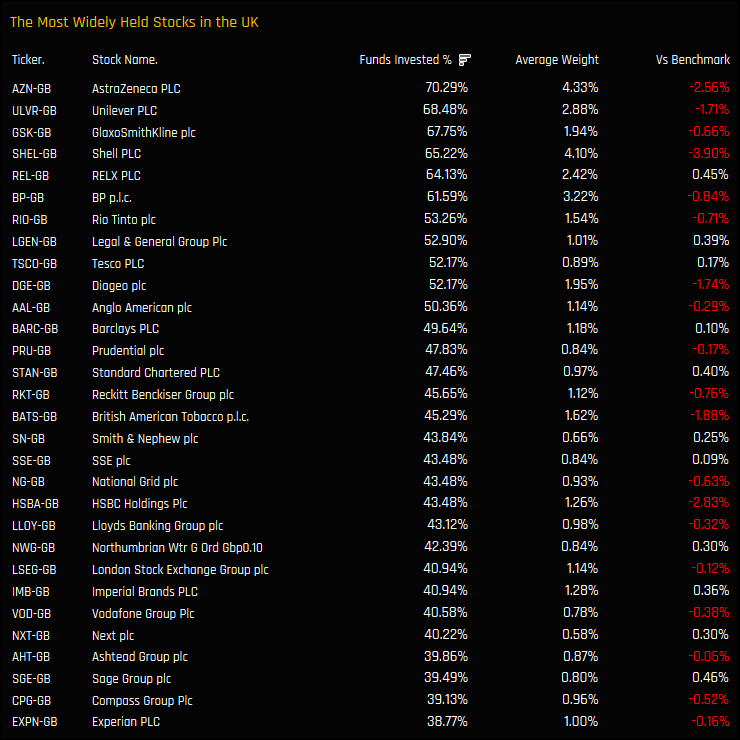
Yet despite this heavy selling, Vodafone remains a well held name, the 25th most widely held stock in the UK as per the chart opposite. There is certainly scope for further selling among active UK managers, and unless something drastically changes to make Vodafone more attractive to UK investors, this feels like the path of least resistance.
For more analysis, data or information on active investor positioning in your market, please get in touch with me on steven.holden@copleyfundresearch.com


