In this issue:
2023 UK Fund Positioning Update
UK Banks: Value Funds Drive Return
SSE Ltd: High Conviction Growth Holding
272 UK Equity Funds, AUM $174bn
2023 UK Fund Positioning Update
In this report, we look at the latest allocations among the 272 active UK funds in our analysis across sectors, industries and stocks. We look at average holdings, weights relative to benchmark and the key changes that occurred through 2022.
Sector Positioning
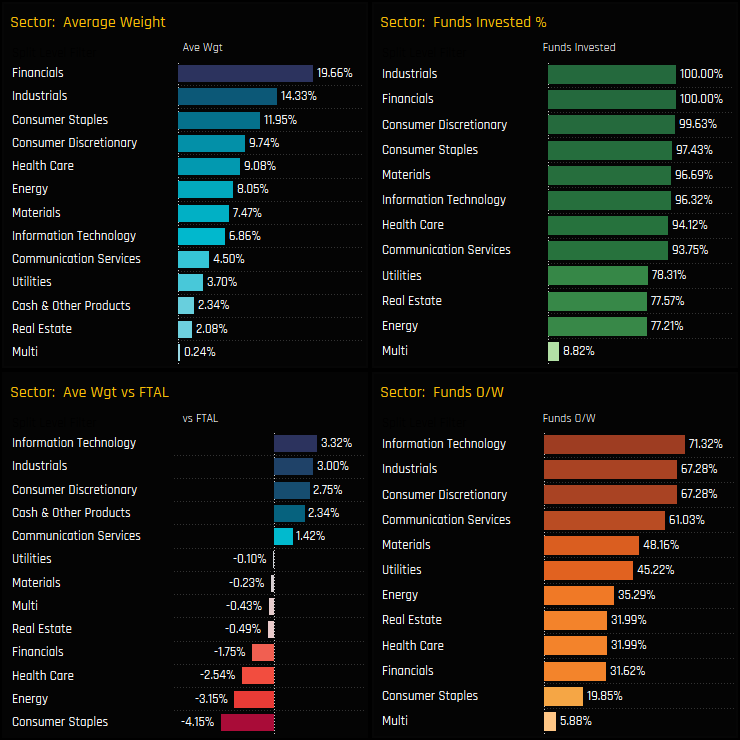
Financials remains the largest sector allocation as we start 2023, with average weights of 19.66% well ahead of Industrials (14.3%) and Consumer Staples (11.95%). Versus the benchmark index, Technology, Industrials and Consumer Discretionary are the consensus overweights, whilst Consumer Staples, Energy, Health Care and Financials are held underweight by the majority. Energy is perhaps the most underowned sector of them all, held by 77% of managers at -3.15% below the SPDRs FTSE UK All Share ETF (FTAL).
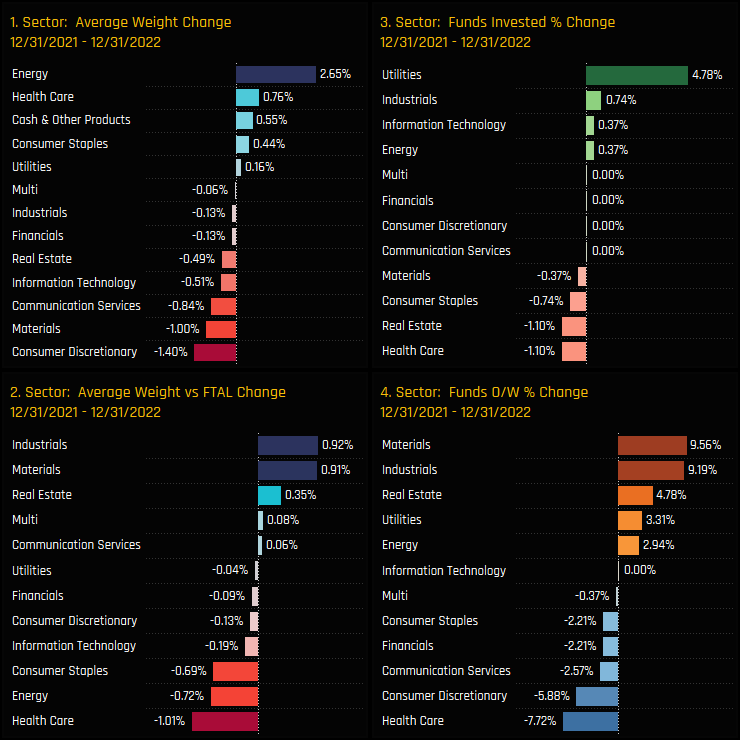
Sector activity through the course of 2022 saw a an increase in Energy weights at the expense of Consumer Discretionary and Materials, though this wasn’t a convincing active rotation. The percentage of funds invested in Energy remained largely the same, and despite +2.94% of UK managers moving to overweight, the average underweight increased by -0.72% on the year. The Utilities sector saw 4.8% of investors open positions, whilst large moves in relative positioning in Industrials and Materials were caused by benchmark adjustments in Ferguson PLC and BHP Billiton.
Sector Sentiment
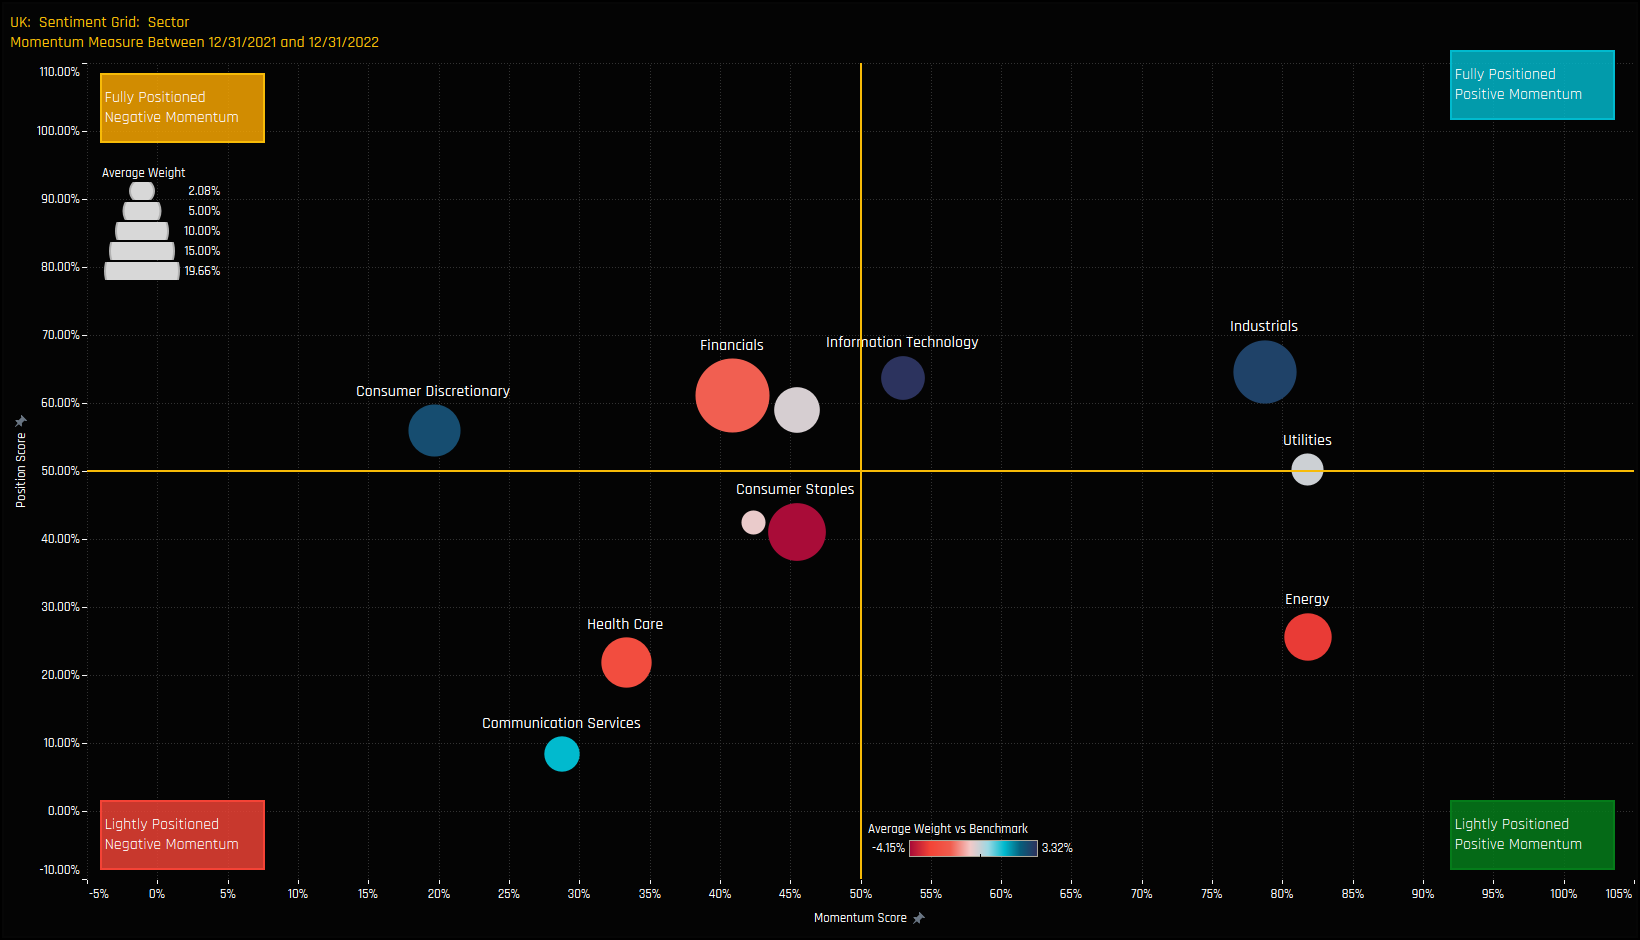
The sentiment grid below shows where current positioning in each Sector sits versus its own history going back to 2012 on a scale of 0-100% (y-axis), against a measure of fund activity for each Sector between 12/31/2021 and 12/31/2022 (x-axis).
The Grid highlights the favorable sentiment towards the Industrials sector, with momentum the among the strongest whilst positioning remains at the higher end of the 10-year range. Energy and Utilities stand out as sectors at the lower end of their positioning ranges whilst attracting inflows from active UK managers. At the other end of the spectrum, Consumer Discretionary allocations continue to fall and Communication Services move to some of the lowest levels of exposure on record.
Energy Focus
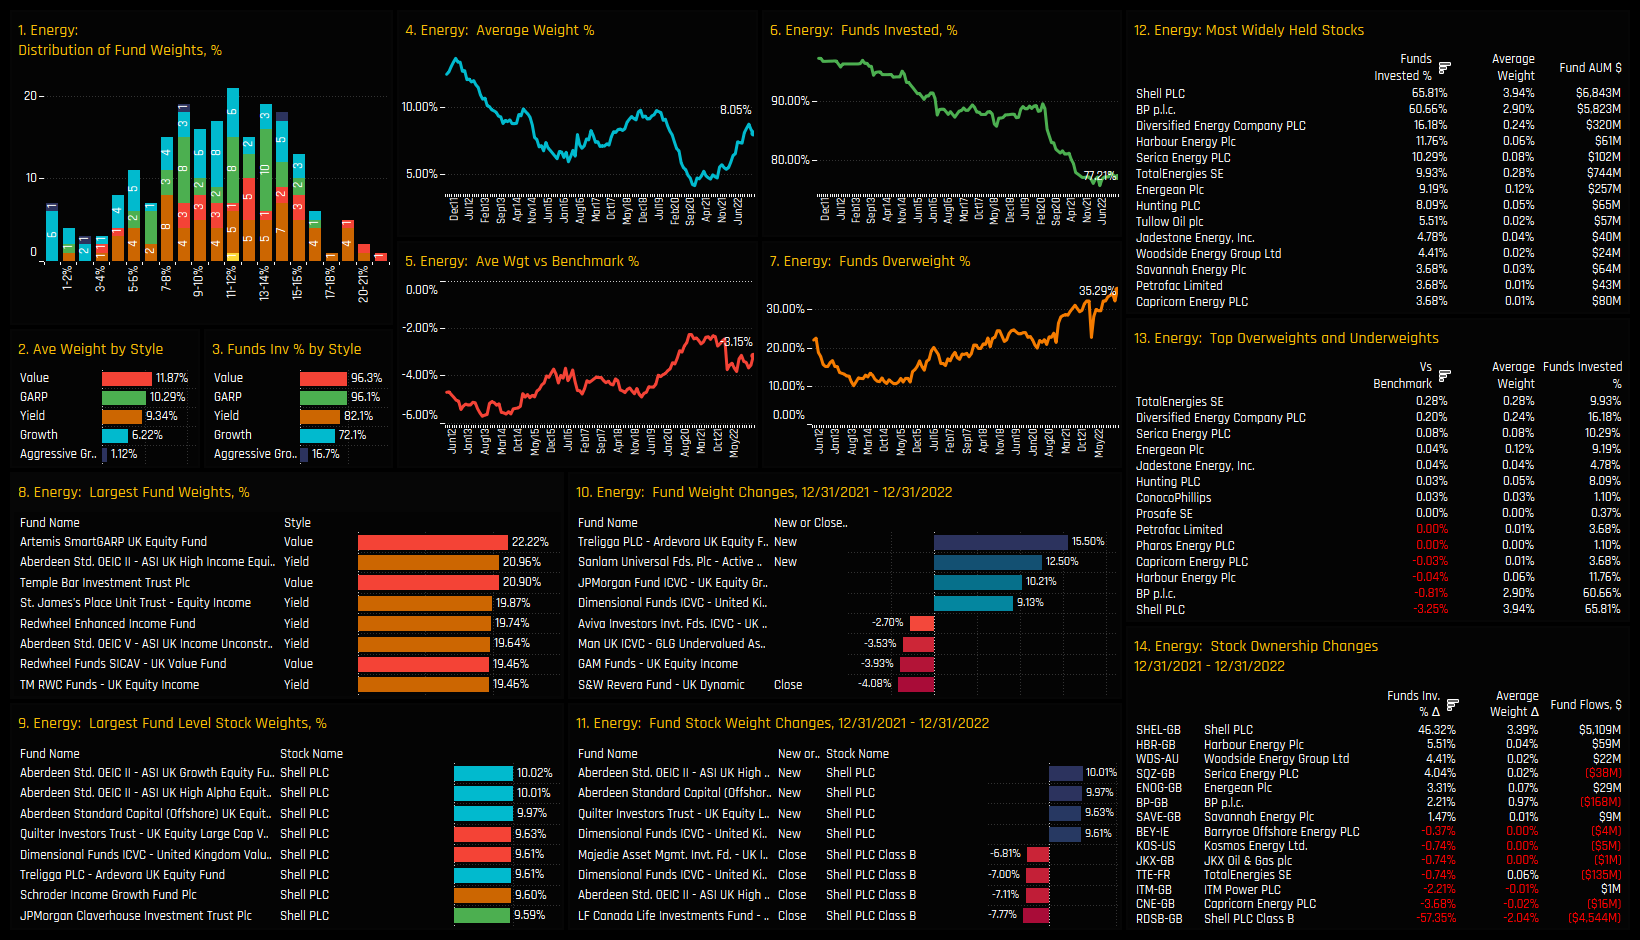
Energy allocations have been on an upward trajectory since hitting the sub 5% lows in late 2020 (ch4). Today’s average holding weight of 8.05% is towards the higher end of the 10-year range, yet it remains a key underweight among active UK investors (ch5). The main reason for the underweight is the absence of 23% of the UK funds in our analysis, with those funds that sold out of the sector in 2020 seemingly reluctant to get back in (ch6). Much of this decline can be attributed to Aggressive Growth investors, who exited the sector en-mass in 2020, leaving only 16.7% of managers invested.
Instead, Value managers are the key allocators with average weights of 11.9% (ch2), led by Artemis SmartGARP (22.2%) and Temple Bar Investment Trust (20.9%). On a stock level, Shell and BP dominate proceedings, held by over 60% of UK managers and accounting for 85% of the total Energy allocation. Aside from the Shell corporate action, stock activity has been marginally skewed to the buyside over the last 12-months, with ownership rising in Harbour Energy, Woodside Energy and Serica Energy.
Industry Positioning
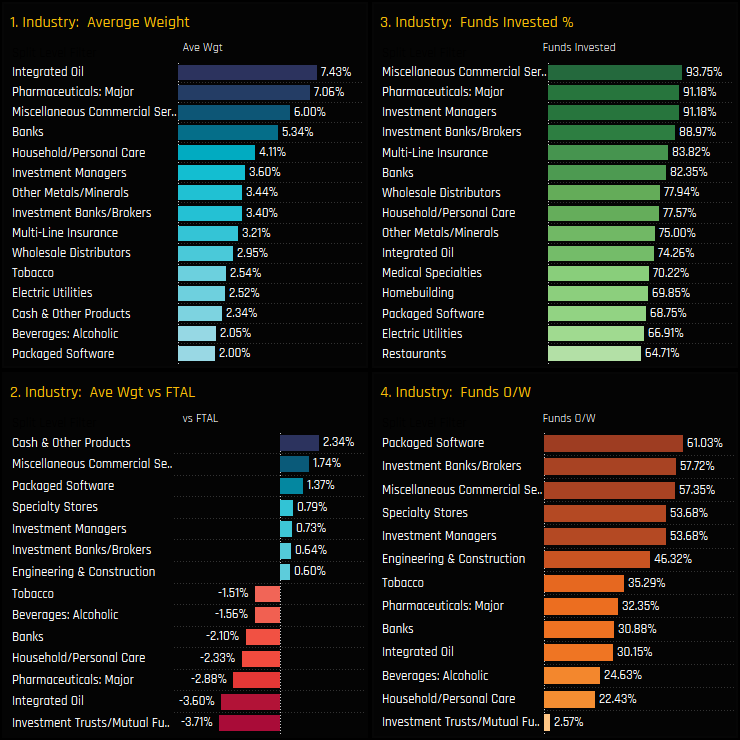
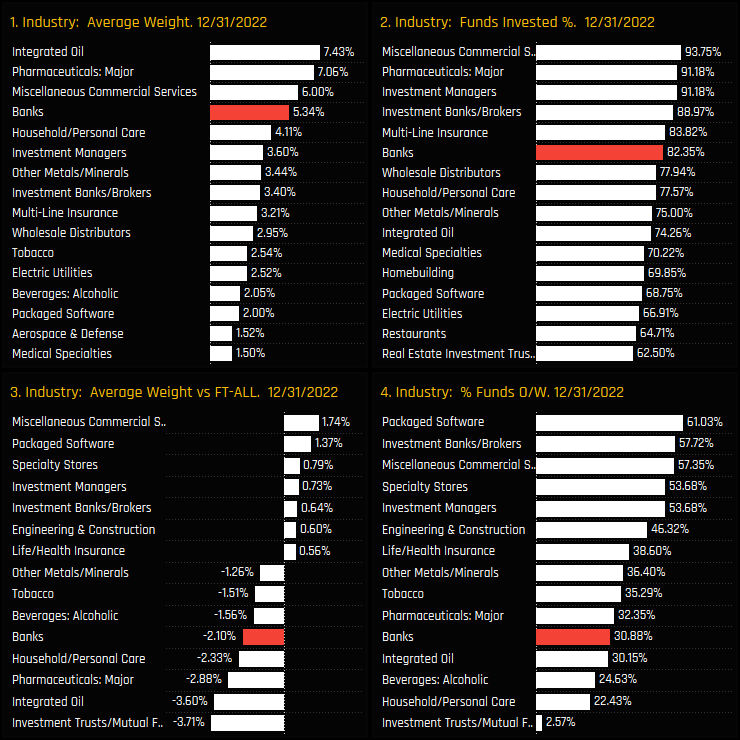
On an industry level, Integrated Oil and Major Pharmaceuticals are the dominant groups, who alongside Misc’ Commercial Services and Banks account for a quarter of total UK fund allocations (ch1). Relative to benchmark, Investment Trusts/Mutual Funds and Integrated Oil are significant underweights (ch2), whilst the majority of UK investors are overweight Packaged Software and Investment Banks/Brokers.
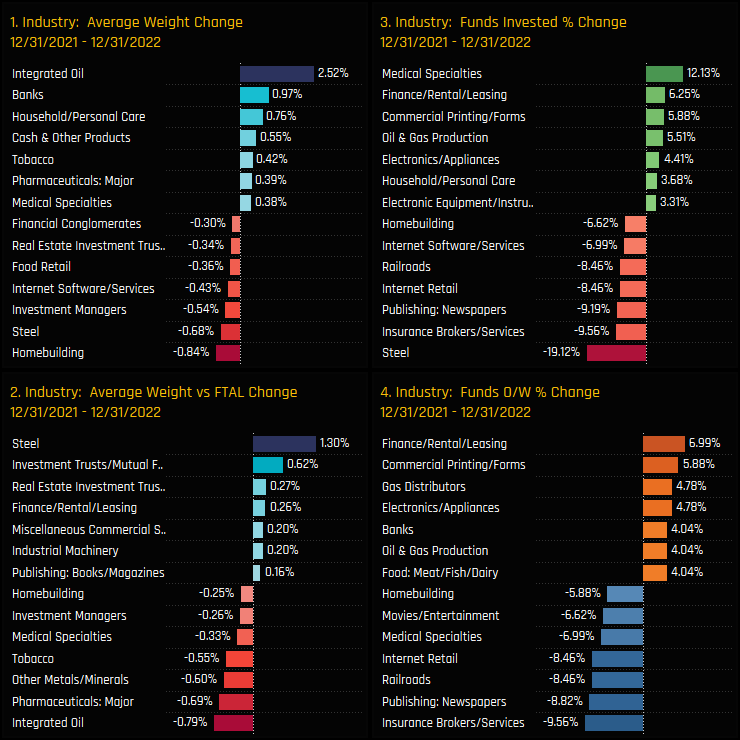
Over the course of last year, average fund weights increased in Integrated Oil, Banks and Household/Personal Care whilst decreases were seen in Homebuilding, Steel and Investment Managers. The decline in Homebuilding appears an active rotation, with the percentage of funds invested falling by -6.6% and underweights increasing by -0.25%. Active UK funds bought in to Medical Specialties, Finance/Rental/Leading and Commercial Printing.
Homebuilders Focus
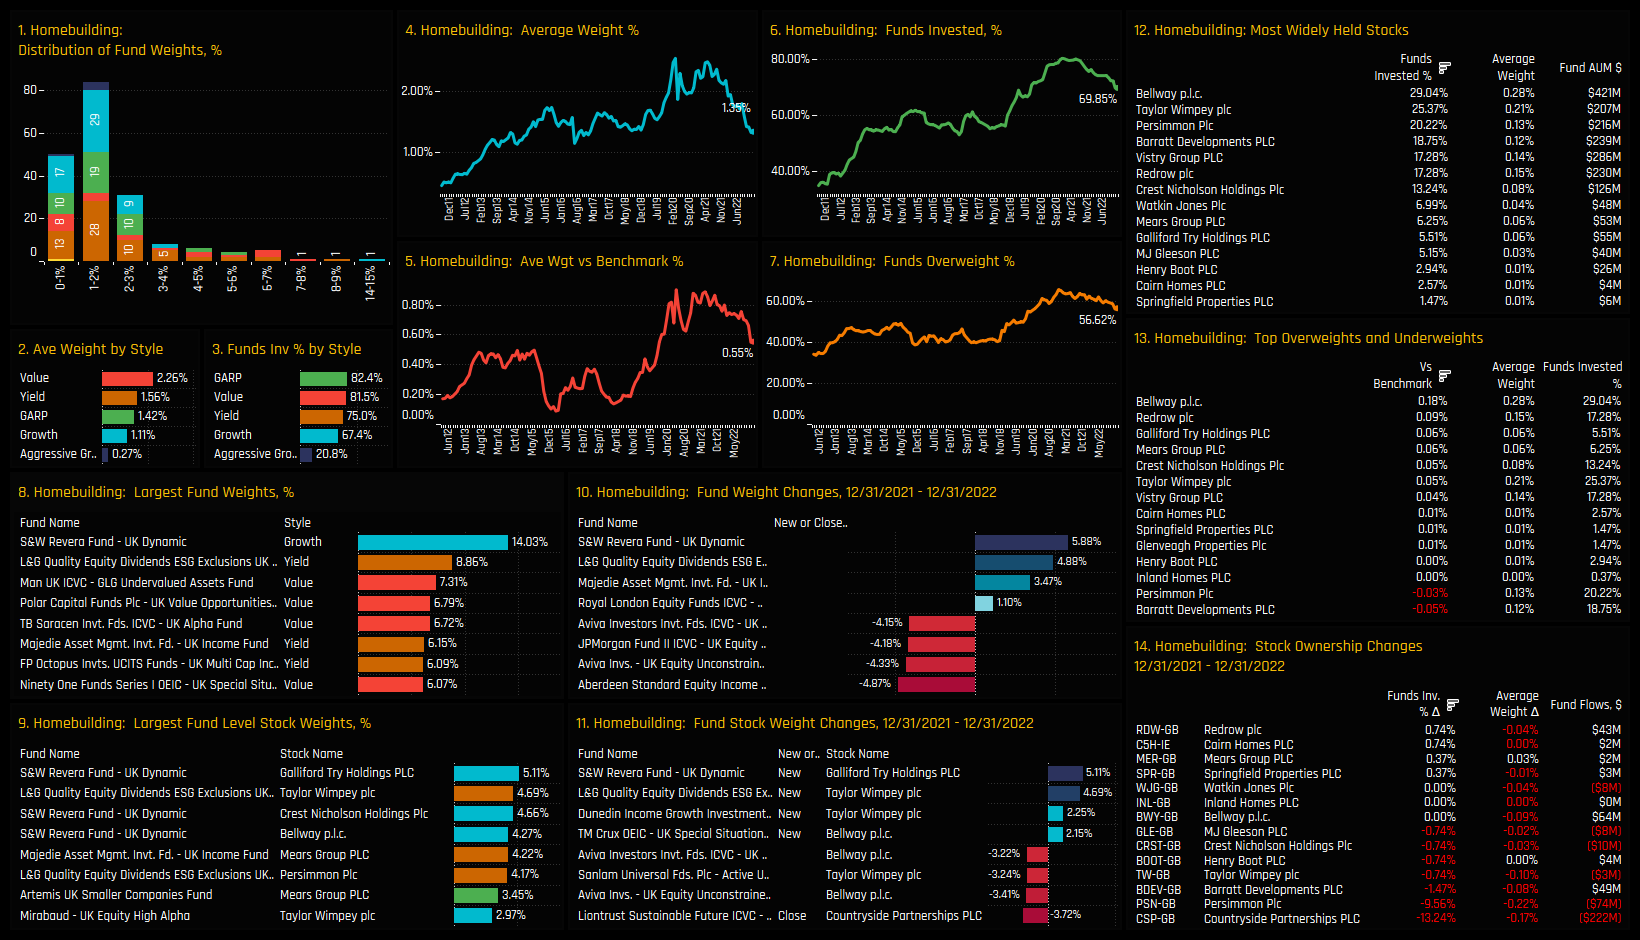
Sentiment in the UK Homebuilders has taken a turn for the worse. Homebuilders had been part of an ownership bull-market among UK equity funds, with the percentage of funds invested in the sector rising from 35% in 2011 to a high of 79% in 2020/2021. Since then however, UK investors have scaled back allocations, with all measures of exposure (ch4-7) trending downwards. The majority of UK funds now hold less than a 3% allocation in Homebuilders, with allocations correlated to Style (Value over Growth) and led by S&W UK Dynamic (14%) and L&G Dividends ESG (8.9%).
On a stock level, Bellway and Taylor Wimpey are the most widely held companies in the industry group, owned by 29% and 25.4% of funds respectively. The Countryside Partnerships takeover by Vistry Group did effect the ownership picture, with -13.2% of funds being closed out and no corresponding increase in Vistry holdings. However, negative stock activity was the theme in 2022, with -9.6% of funds closing their Persimmon holdings and -1.5% closing Barrat Development exposure.
Stock Positioning
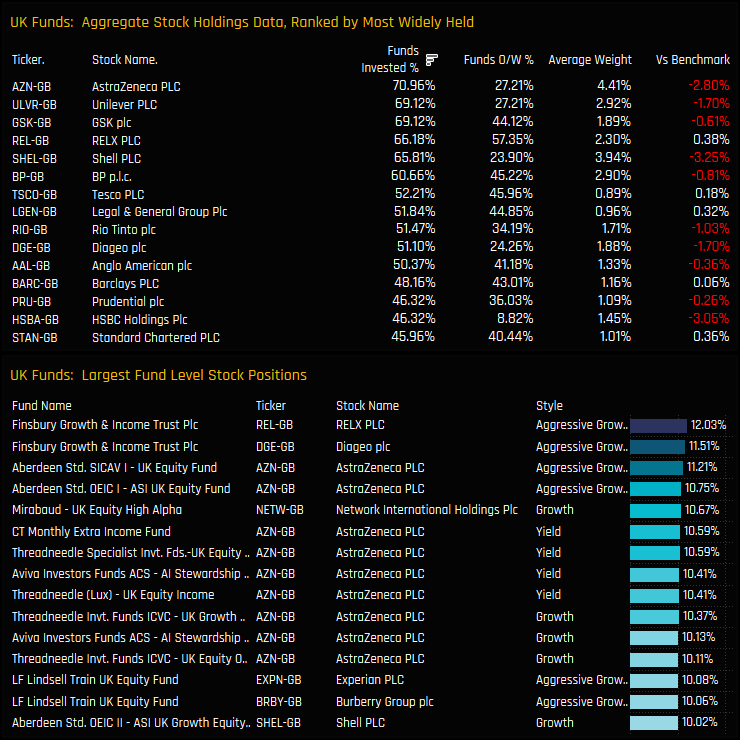
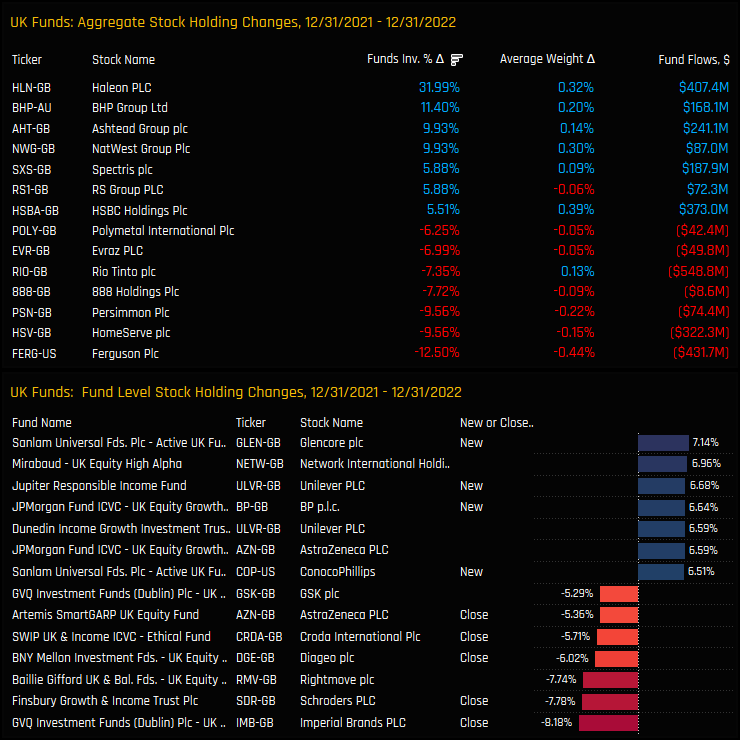
The top chart below shows the aggregated stock holdings statistics among active UK funds, ranked by how widely held each stock is. AstraZeneca is the most widely owned, held by 70.1% of managers at an average weight of 4.4%. It is the 3rd largest underweight after Shell PLC and HSBC Holdings. RELX PLC is perhaps the highest conviction holding, held overweight the FTSE All Share index by 57.4% of UK managers and topping the list of largest individual fund level stock positions with a 12% position in the Finsbury Growth & Income Trust.
Stock activity in 2022 (stripping out delistings) shows strong appetite for the Haleon IPO with 32% of funds buying in to the name in 2022. Ownership increases were also seen in BHP Group, Ashtead Group and Natwest Group, whilst managers scaled back exposure to Ferguson PLC, HomeServce PLC and Persimmon PLC. The bottom chart shows the largest portfolio stock weight changes on the year, and is headed by Sanlam UK Active Equity’s 7.14% opening position in Glencore PLC.
Conclusion and Links
This concludes our analysis of positioning among active UK Equity Funds. Click the link to the right for the latest version of the UK Fund Positioning Report, scroll down for positioning analysis in the UK Banks and deeper dive on SSE Ltd fund ownership.
In this report, we look at the recovery in UK Bank holding weights since the COVID driven lows of 2020. We find that allocations have recovered to pre-COVID levels, but remain at the lower end of the 10-year range. More so, the recovery was driven by Value strategies, with Aggressive Growth funds reluctant to re-instate exposure.
Peer Group Industry Positioning
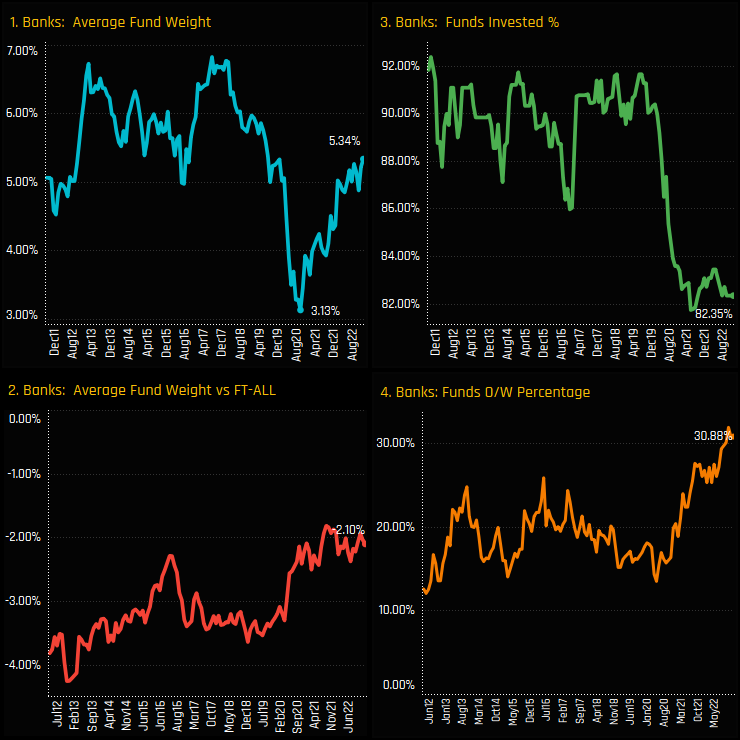
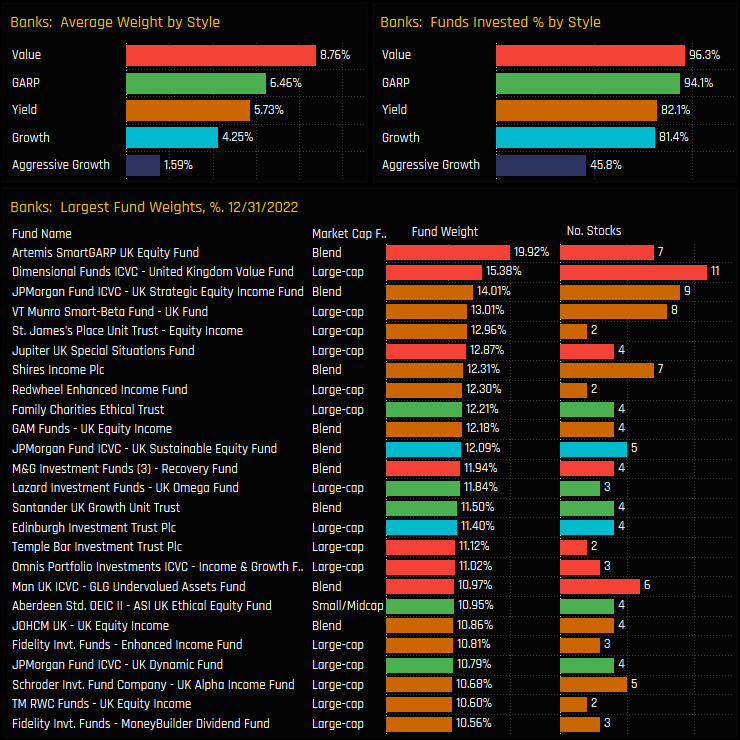
Among active UK equity funds, Banks are the 4th largest allocation on average (ch1) and held in some form by 82.4% of the 272 funds in our analysis (ch2). Versus the SPDRs FTSE All Shares ETF, Banks are held as an underweight position for the majority of investors (ch4), with the average underweight the 5th largest at -2.1% below index (ch3).
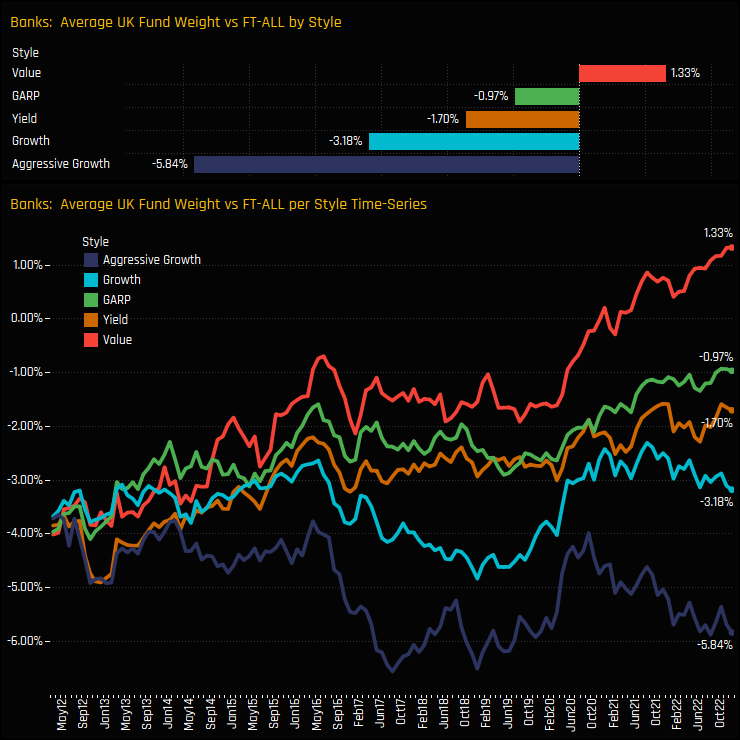
UK Bank allocations have seen something of a ‘V-Shaped’ recovery since their aggressive fall in the aftermath of the COVID pandemic, as chart 1 below shows. Average weights bottomed out at 3.16% in late 2020 and have been on a charge ever since. Though more funds are switching to overweight (ch4), many of the funds who exited the Banks sector in 2020 have yet to return, with only 82.4% of funds invested near the lowest levels on record (ch3). It’s a strange dynamic, with rising weights and falling outright ownership, but one that can be explained by the changing convictions between the Style groups.
Style Analysis
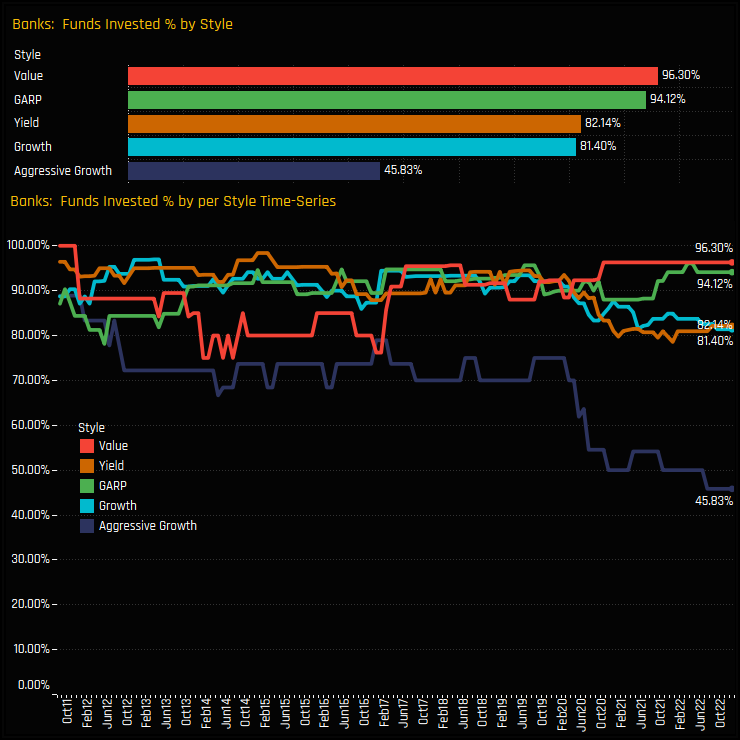
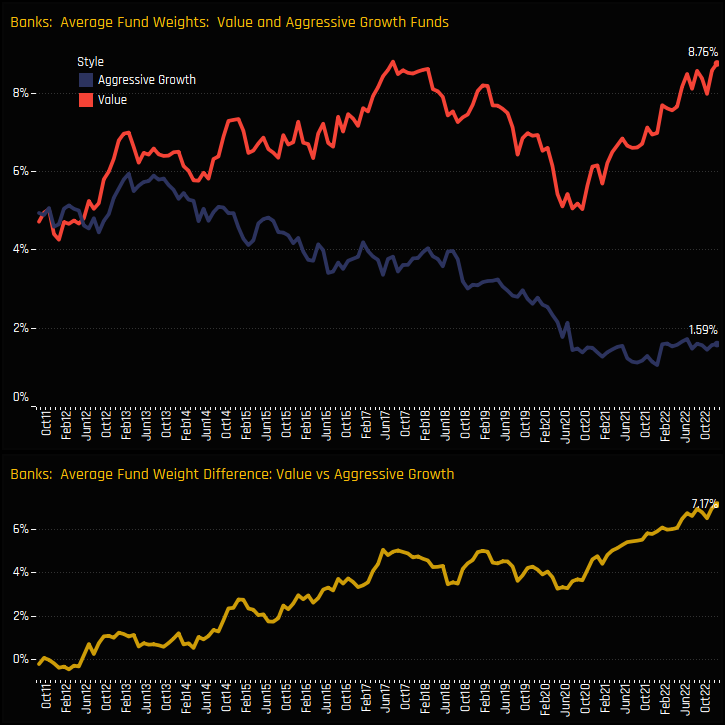
The charts below show the percentage of funds with ownership in the UK Banking sector split by the Style of the fund. There is a clear gap between the percentage of Aggressive Growth managers with exposure to UK Banks (45.8%) and the other Style groups, most notably Value (96.3%) and GARP (94.1%). The time-series chart shows a heavy drop in Aggressive Fund ownership, falling from over 70% pre-2020 to an all-time low 45.8% today. This accounts for the overall drop in ownership described in Chart 3 above.
This places Aggressive Growth managers as heavily underweight UK Banks on average, with net positioning below the index by -5.84%. But whilst Aggressive Growth managers scale back exposure, Value managers are doing the opposite. UK Value managers are the only Style group to be positioned above the benchmark, with today’s +1.3% overweight the highest on record, driving the overall increase in UK Bank weights among UK investors.
Fund Holdings & Activity
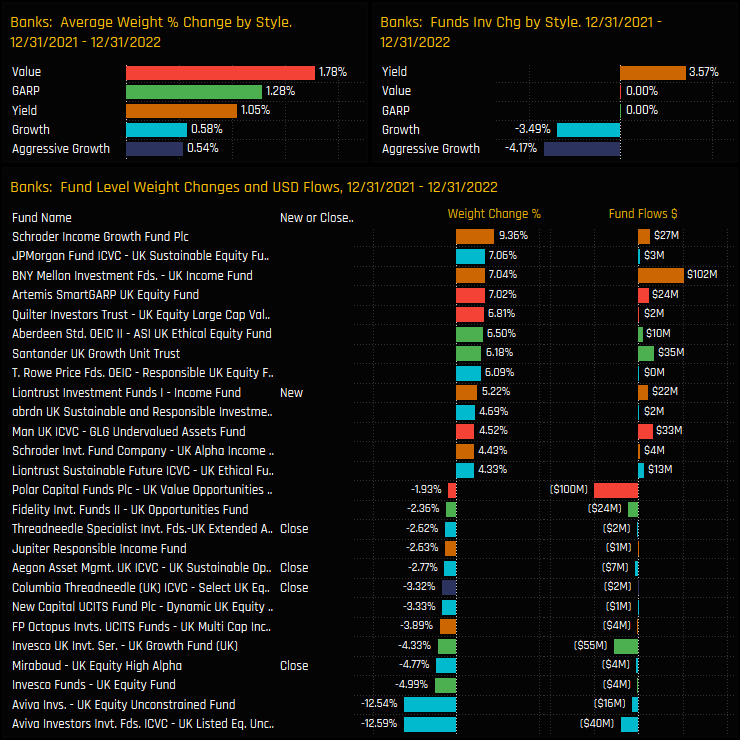
Analysing the fund level allocation changes over the last 12 months highlights the growing dispersion between selected Value and Growth strategies. UK Banking sector weights increased by 1.78% on average for Value funds versus 0.54% for Aggressive Growth. In addition, -4.2% of Aggressive Growth funds and -3.5% of Growth funds closed exposure. On a fund level, large scaling back from Aviva Unconstrained and closures from Colombia Threadneedle Select UK Equity are offset by big allocation increases by Schroders Income Growth and Artemis SmartGARP, among others.
This leaves the average UK Bank allocations among Aggressive Growth managers at just 1.59% versus Value at 8.76%. The top 20 holders in the bottom chart are dominated by Value and Yield strategies, led by Artemis SmartGARP (19.9%) and Dimensional UK Value (15.4%). For high growth UK investors, Banks are either a fringe holding or not investible at all.
Stock Holdings by Style
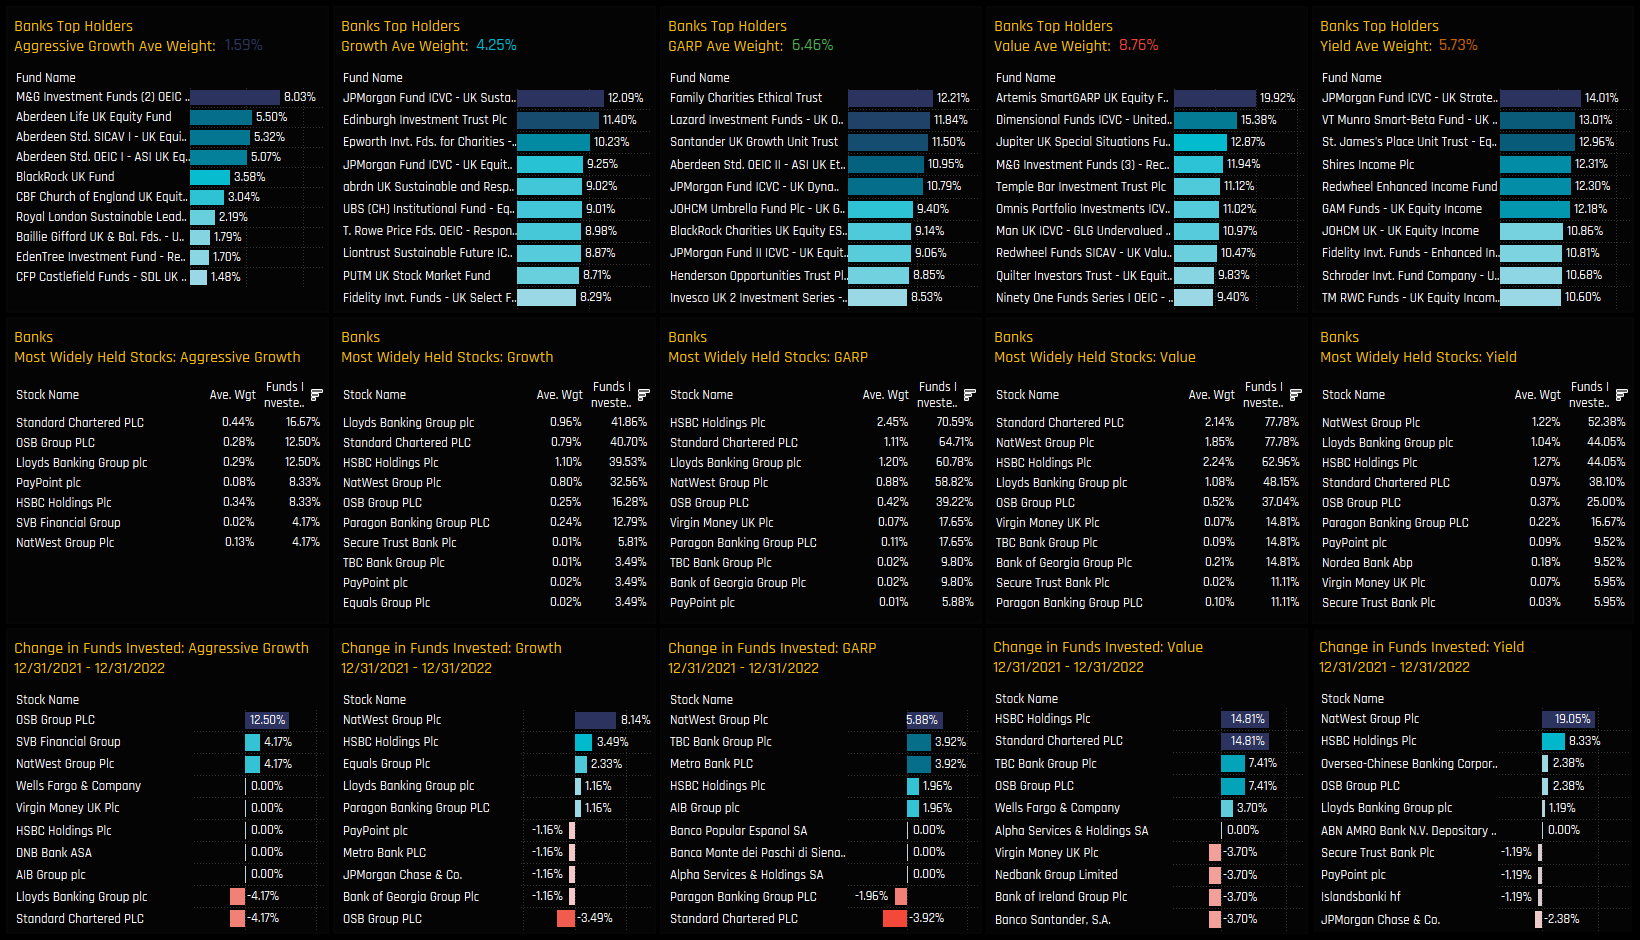
The below chart set shows the largest Fund holders in UK Banks by Style on the top row, the aggregate stock ownership statistics in the middle and the change in funds invested for each stock on the bottom row in 2022. Across all but Aggressive Growth funds, the quartet of HSBC Holdings, Natwest Group, Standard Chartered and Lloyds Banking Group are the most widely held and highest holding weights in the Banks industry group. Value managers are more heavily invested in Standard Chartered and Natwest Group, with 77.8% of Value funds invested in each. Natwest Group features across the Style groups as a stock capturing strong increases in ownership over the last 12-months. Stock holdings among Aggressive Growth funds are very light, with Standard Chartered the most widely held and OSB Group capturing investment from 12.5% of managers last year.
Conclusion and Links
UK Banks have demonstrated a robust recovery from the substantial decline in exposure experienced during the COVID pandemic, with average weights returning to the lower end of their decade-long range. The recovery in ownership has been uneven, driven by Value and Yield investors with seemingly little to tempt high Growth investors back in.
As it stands, the dispersion between Aggressive Growth and Value fund exposure in the UK Banks is at it’s widest level on record, as the chart opposite shows. This record divergence between Value and Growth has appeared across our analysis in different forms in recent months, from Indian allocations among GEM funds to Microsoft holdings among Global funds. One would assume that this trend can’t keep going forever and that mean reversion might occur at some point. For that to happen, either UK Banks need to show more signs of growth, or they become too expensive for Value funds to hold.
In this report, we highlight the rising ownership levels in SSE Ltd among UK Growth funds.
Growth Classification
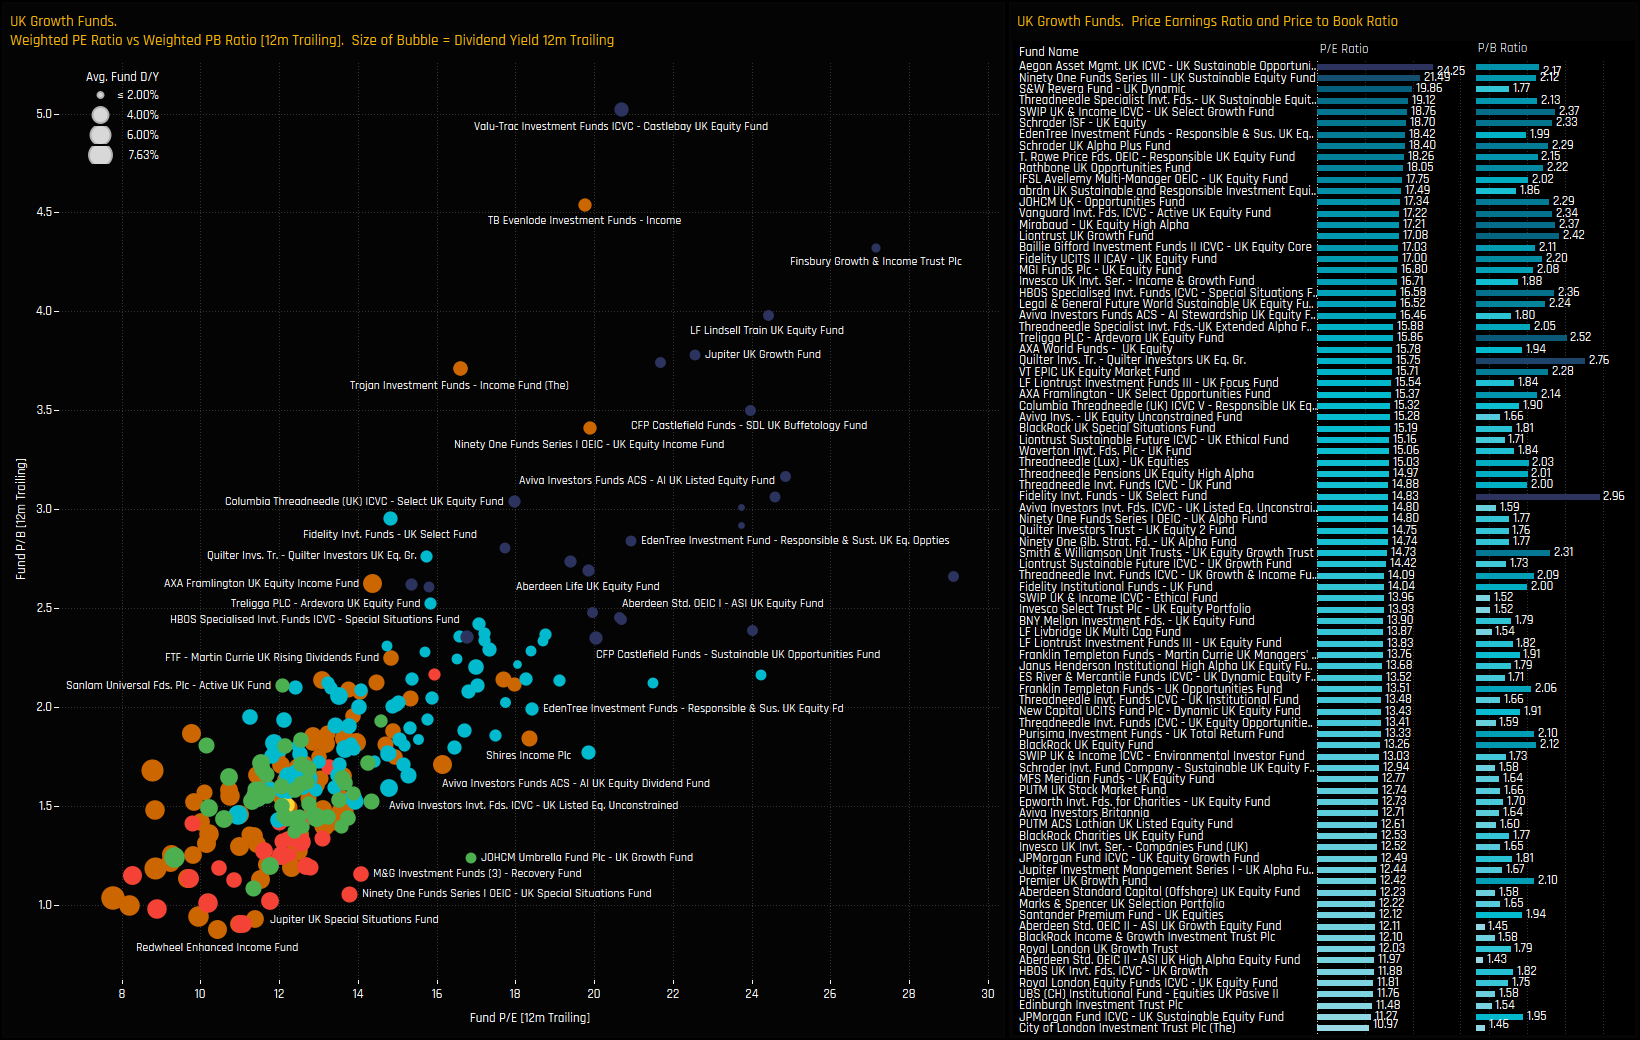
Each UK fund in our analysis is split into a Style category based on the P/E and P/B ratios of their portfolio compared to the benchmark. The left hand chart below plots the average P/E and P/B ratios for each fund, the right hand chart lists the Growth funds in our analysis.
For a fund to labeled as ‘Growth’, at least 50% of its portfolio is invested in stocks with a higher P/E ratio than the SPDRs FTSE All Share ETF average, and at least 50% in stocks with a higher P/B ratio. There are 86 funds classified as Growth in our analysis.
SSE plc: Peer Group Positioning & Activity
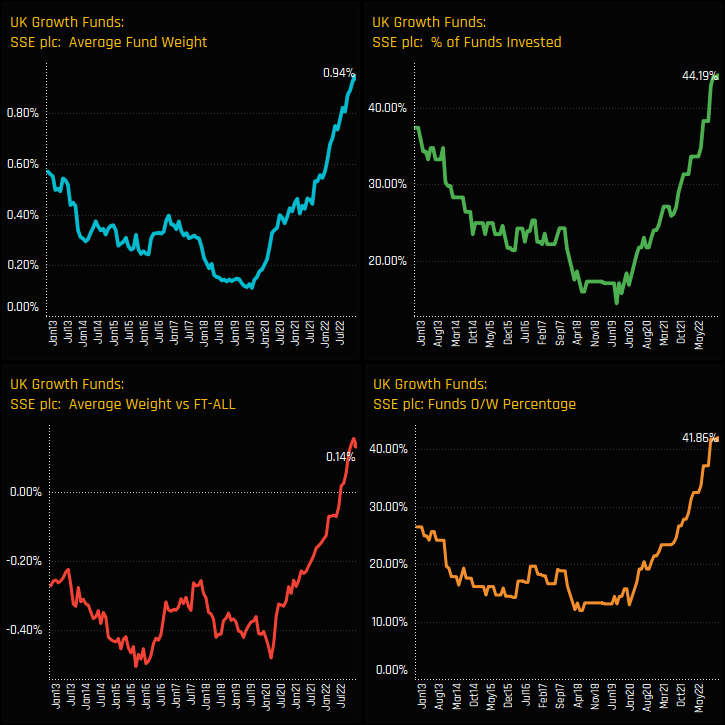
Among the UK Growth investors listed above, exposure in SSE plc is at all-time highs following a multi-year bull market in ownership. UK Growth funds have been consistently adding SSE plc to their portfolios since the lows of 2019, when just 15% of Growth funds had exposure compared to 44.2% today. During this period, average weights have more than quadrupled, moving SSE Ltd from a net underweight to an overweight of +0.14% in the process.
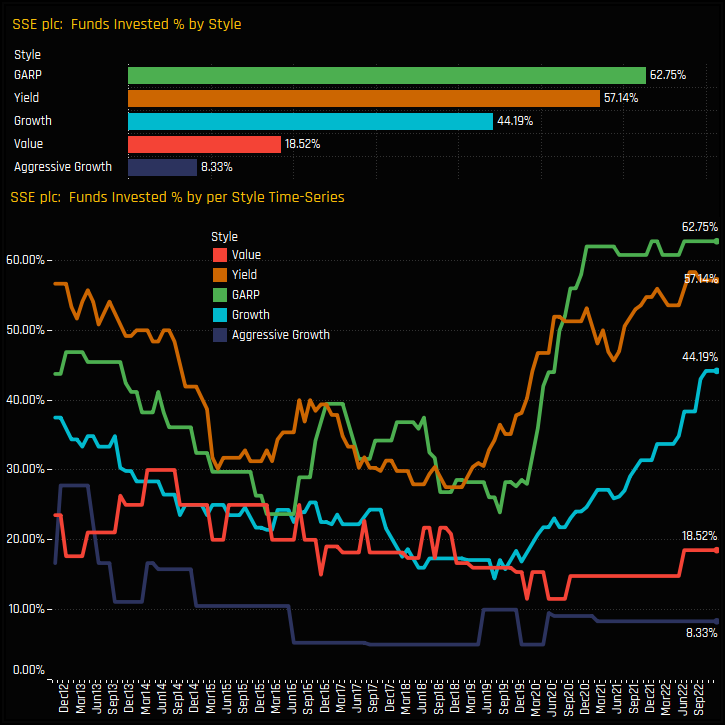
The below charts show the percentage of each Style group invested in SSE plc. The rise in Growth fund ownership sits in contrast to Value and Aggressive Growth funds, who remain largely on the sidelines in the name for now. A higher percentage of both GARP and Yield funds hold positions in SSE plc, though Growth funds are closing the gap.
Fund Holdings & Activity
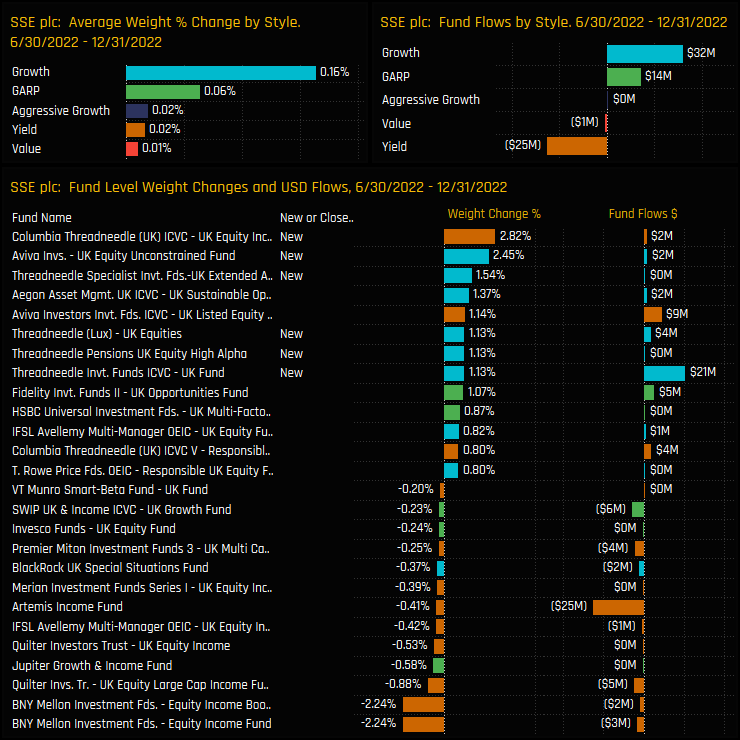
We can see this in the charts below. Over the last 6-months, Growth investors saw the largest increase in average fund weight and captured the largest fund inflows. New positions from Avivia UK Unconstrained and a host of Threadneedle strategies helped push ownership levels higher.
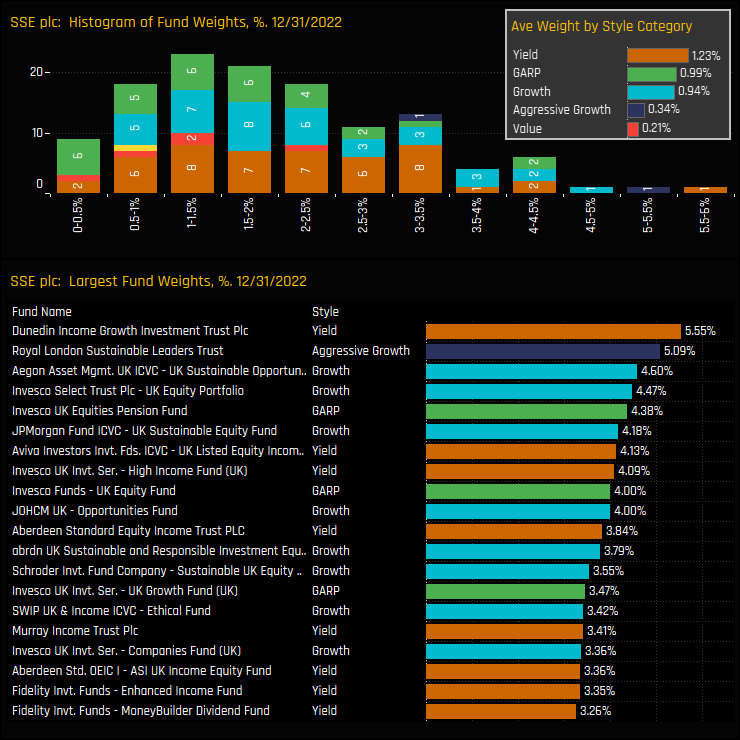
The charts below show the distribution of fund weights in SSE plc (top) and the largest holders (bottom). Yield managers remain some of the larger allocators and are well represented among the top holders. Growth funds have caught up to GARP on an average weight basis, with selected Growth strategies from Aegon, Invesco and JP Morgan in the top 10.
Peer Group Stock Positioning & Activity
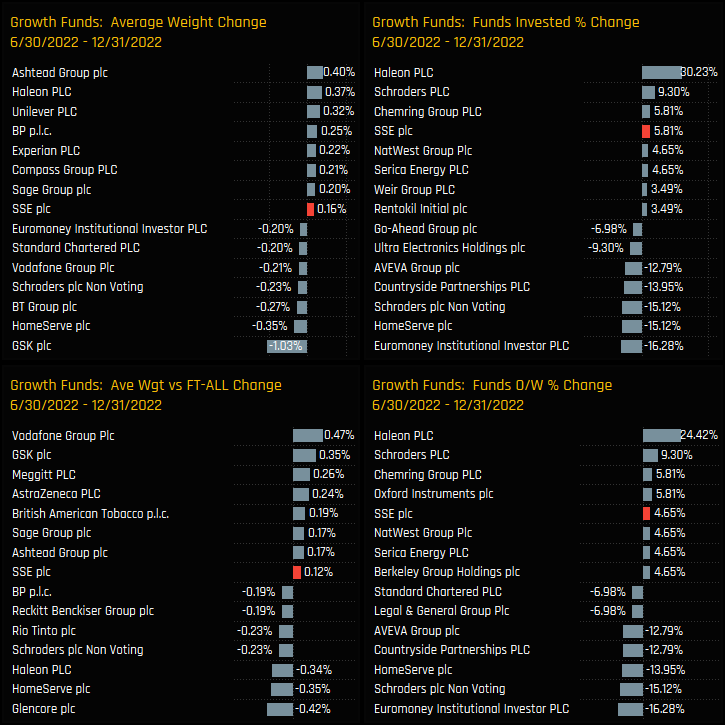
Versus other stocks in the UK investible universe, SSE Ltd captured some of the largest increases in ownership over the last 6-months. Rising average weights were driven by a further +5.8% of Growth funds buying in to the name, the 4th largest increase of any stock in the UK.
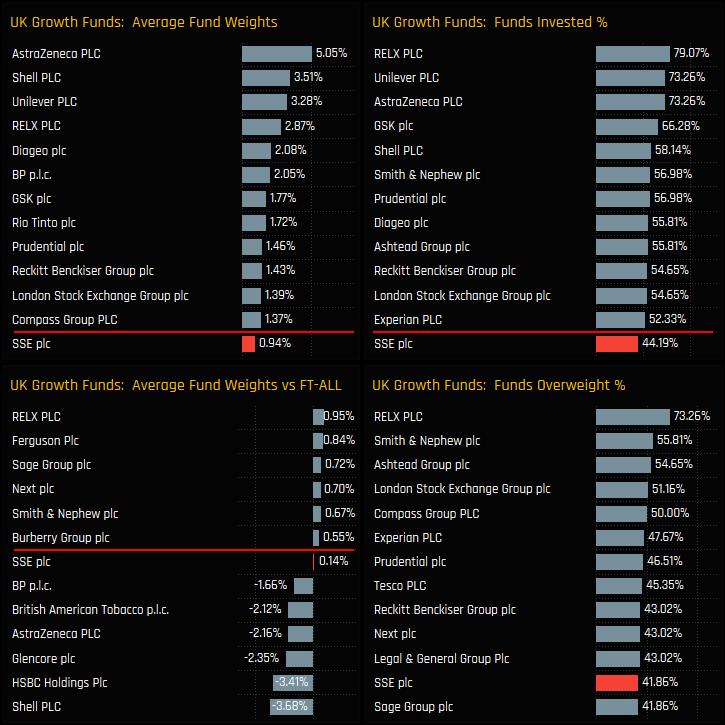
Despite these ownership increases, SSE Ltd sits well down the pecking order of average holding weights among Growth funds in the UK. It is the 18th most widely held stock and the 22nd largest average holding weight. Relative to the FTSE All Share index things are more favourable, with SSE Ltd the 12th most popular name to overweight.
Conclusion & Links
With a multi-year rise in investment levels and exposure at record highs, its fair to say that conviction in SSE plc is high among active UK Growth investors. One of the key beneficiaries of fund rotation in 2022, Growth investors are aligning themselves to Yield and GARP funds who remain more heavily allocated, for now at least.
The lack of investment from Value and Aggressive Growth strategies is a slight curve-ball, with SSE plc clearly not cheap enough, or offering enough growth to tempt either Style group to increase allocations.
Please click on the link to the right for the full data report on SSE plc ownership among UK active funds.
For more analysis, data or information on active investor positioning in your market, please get in touch with me on steven.holden@copleyfundresearch.com


