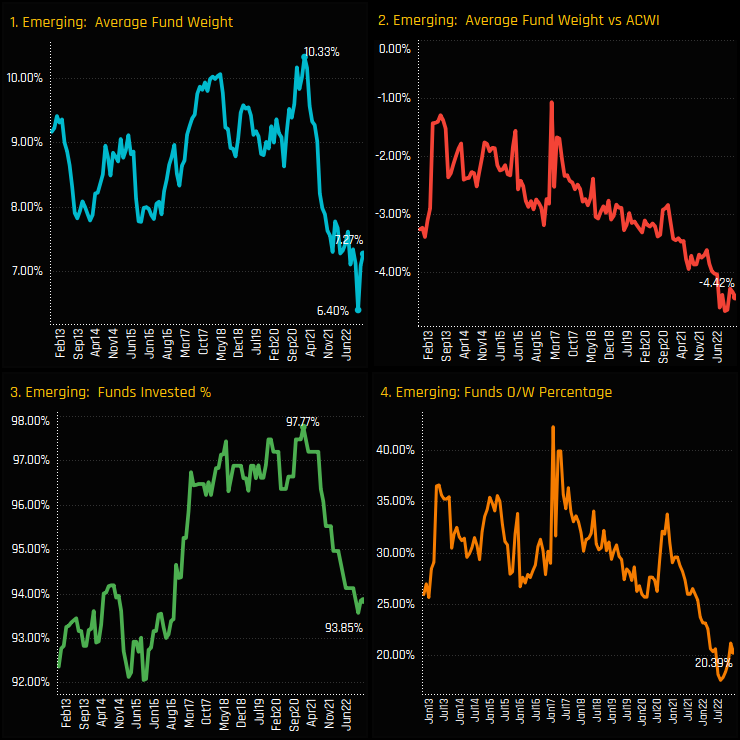
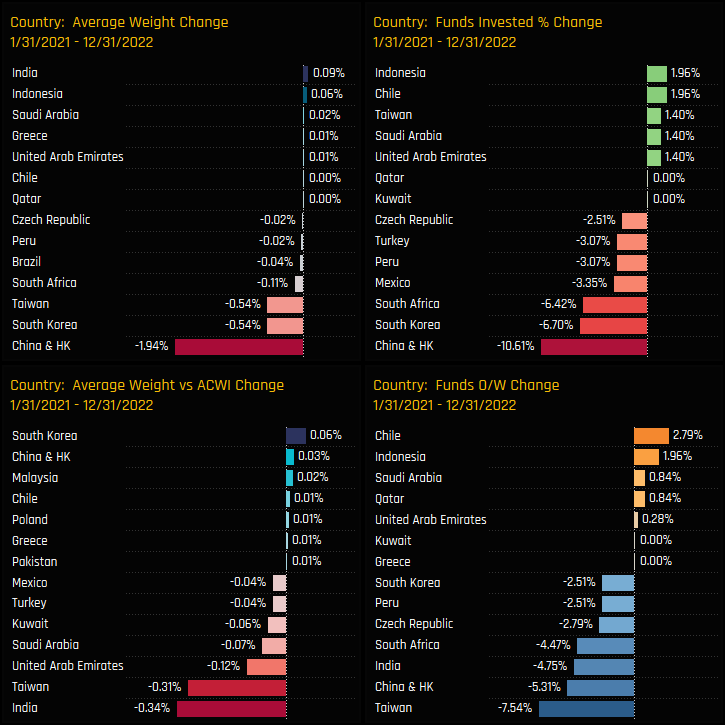
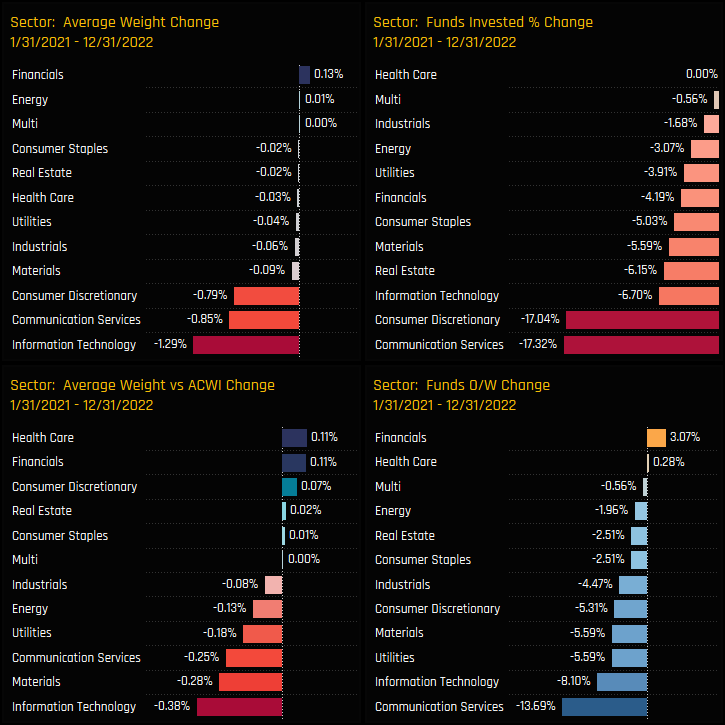
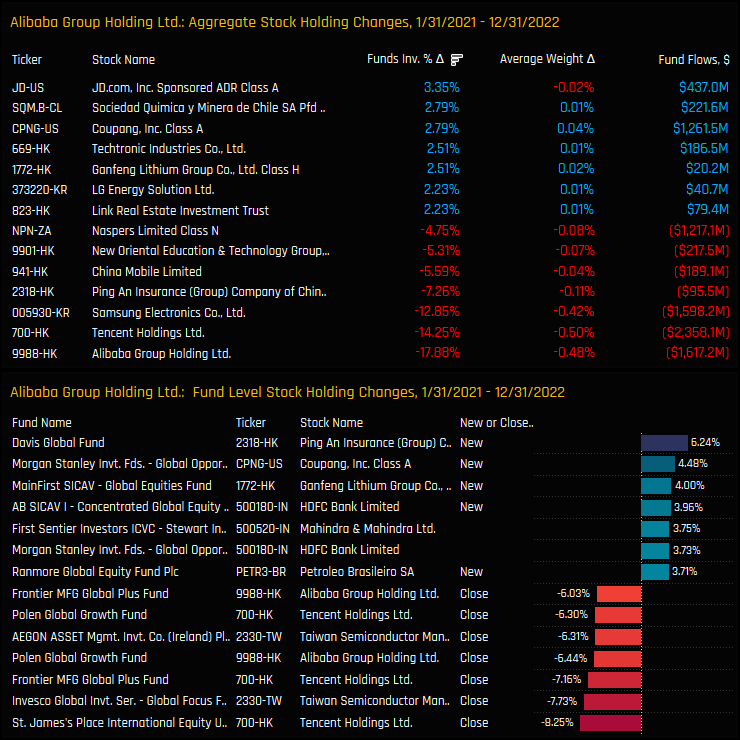
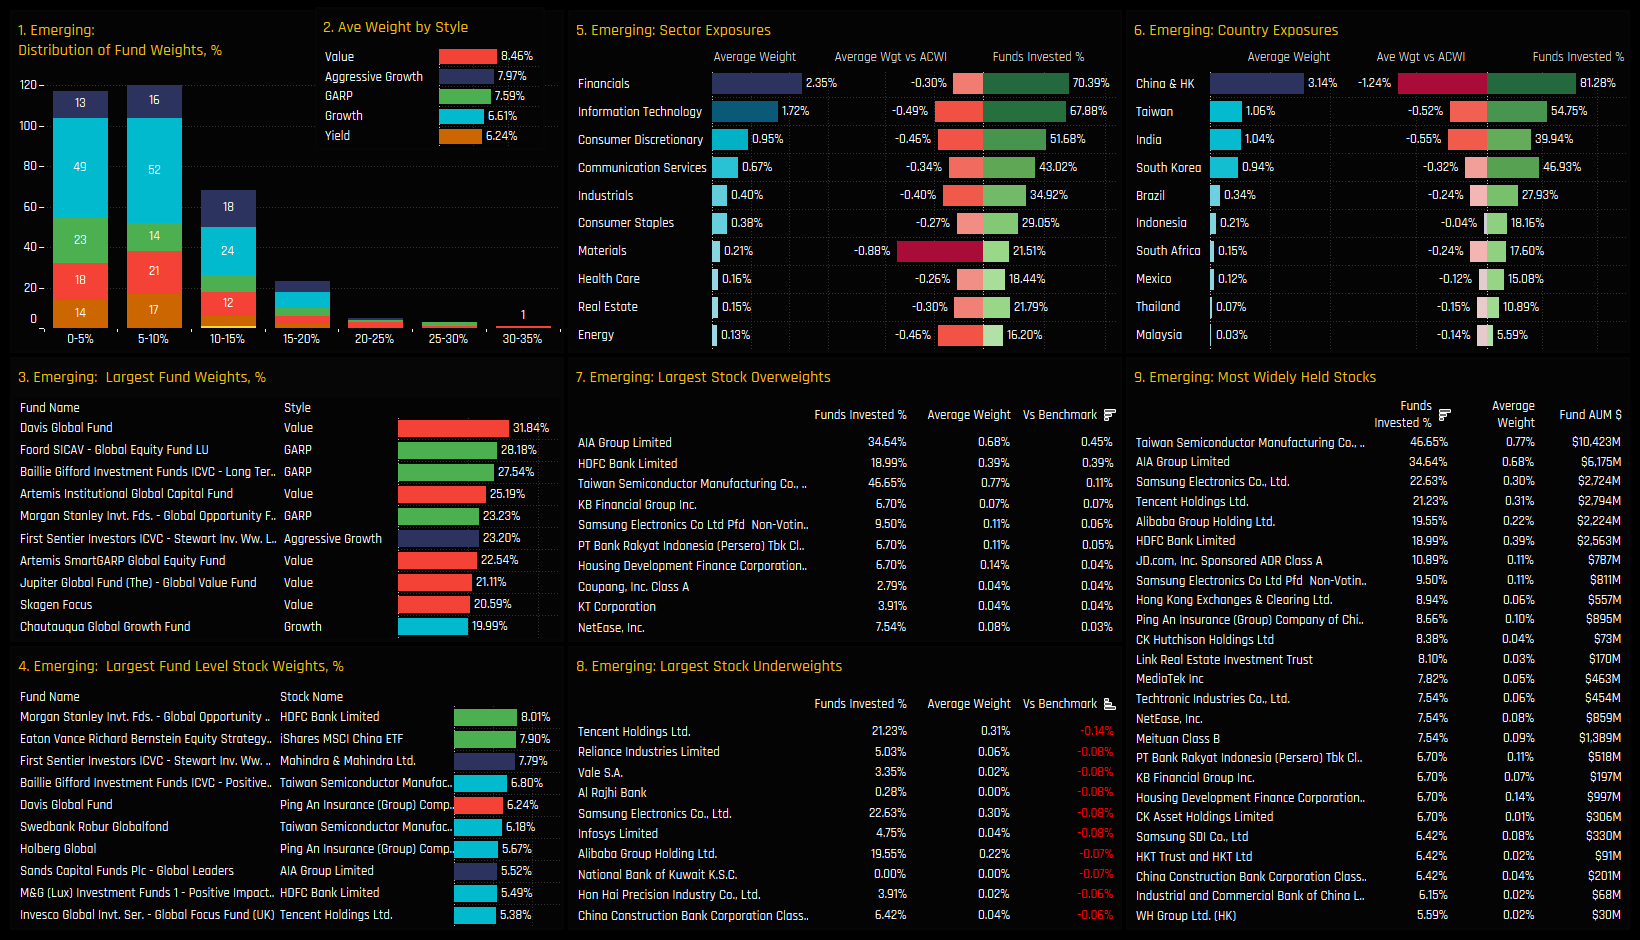
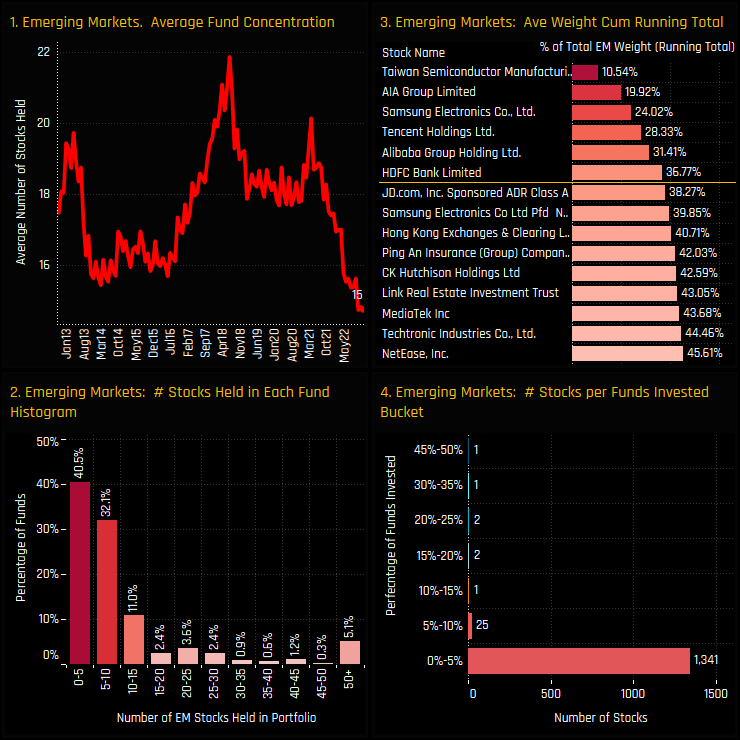
Global Funds: Record Under-Allocation in Emerging Markets

358 Global Equity Funds, AUM $914bn

Record Under-Allocation in Emerging Markets

Exploring the Factors Behind a Shift Away from Emerging Market Equities among Active Global Fund Managers.

Time-Series & Country Rotation

Emerging Market allocations among active Global funds are at depressed levels.  From a peak of 10.3% in January 2021, average holding weights fell to a low of 6.4% in October last year, recovering slightly to 7.27% today.  Over this period, the percentage of funds with exposure to EM fell from 97.8% to 93.85%, underweights increased from -3.4% to -4.4% and the percentage of funds overweight fell from 33.8% to 18.9%.  This was an active rebalance away from EM, compounded by relative underperformance versus developed markets.

The changes in EM country ownership from the highs of 2021 are detailed in the below charts.  The average weight decline was led by China & HK, with -10.6% of funds closing exposure and allocations falling by -1.94%.  South Korea, Taiwan and South Africa also suffered, with all measures of ownership moving lower.  Of the few bright spots, Global funds increased allocations to Indonesia, Chile and selected MENA countries over the period, but to a much smaller degree.

Sector & Stock Activity

On a sector level, -17.3% of investors closed exposure to EM Communication Services and -17.04% to EM Consumer Discretionary.  All sectors saw the percentage of funds invested decline, with the large average weight declines coming from Technology, Comm’ Services and Consumer Discretionary.  The EM Financials sector was alone in capturing modest increases in exposure over the period.

On a stock level, much of the declines can be attributed to the three large cap EM holdings of Alibaba Group Holdings, Tencent Holdings and Samsung Electronics.  All three suffered significant outflows and position closures among Global investors from Jan 21 to Dec 22.  At their peak in 2021, these three stocks were beginning to command good sized allocations in selected Global portfolios, 

Latest Snapshot

Where has this rotation left EM positioning?  On a fund level, the majority of Global funds now hold less than a 10% stake in Emerging Market equities (ch1) with only a handful holding in excess of 20%, led by Davis Global (31.8%) and Foord Global Equity (28.2%).  The Style split is fairly tight, with Value funds allocating 8.46% versus Yield on 6.24%, on average (ch2).  Global funds start the year underweight in every EM sector on average, with EM Materials perhaps the standout with just 21.5% of funds invested and a net underweight  of -0.88% (ch5).  

On a country level, China & HK is the key underweight at -1.24% below benchmark, but it remains widely owned with 81.3% of the funds in our analysis invested.  Other countries, notably India and Brazil are avoided by the majority, with all countries outside of the ‘top 5’ held by less than 20% of funds (ch6). Charts 7,8 and 9 show the aggregate stock holdings, with TSMC, AIA Group, Samsung Electronics and HDFC Bank among the most widely held and net overweights, whilst Tencent Holdings, Reliance Industries and Vale top the list of underweights.

Conclusions

Among active Global funds, Emerging Market exposure has rarely been this low. On most measures of ownership, whether absolute or relative to benchmark, Global managers are not positioned for EM outperformance as they start the year.  A big rotation out of China & HK, together with a decline in EM Tech exposure were the key drivers behind the moves lower since early 2021.

But it feels like more than that.  It almost feels like Emerging Markets have been forgotten, with the focus switched to the USA over the last 3-years and specifically in megacap US Tech.  The depth to the EM allocation has been reduced to just a handful of the larger index constituents.  The chart set to the right puts some figures around this notion.

  1. The average number of EM stocks held by the Global Funds in our analysis has dropped to an all-time low of 15
  2. 40.5% of funds hold less than 5 EM stocks in their portfolio, 72.6% hold less than 10.
  3. The 6 most widely held stocks account for 36.7% of the total EM allocation
  4. Only 32 EM stocks are held by more than 5% of the Global Funds in our analysis.
 

It certainly appears that Global managers are reluctant to make EM anything more than a fringe allocation.  To be overweight EM here is the non-consensus trade, and to be overweight stocks outside the top 6 puts you in the clear minority.  Either stance will deliver de-correlated returns versus an active peer group who are under-allocated as we head in to 2023. 


For more analysis, data or information on active investor positioning in your market, please get in touch with me on steven.holden@copleyfundresearch.com