In this issue:
2023 MSCI China Fund Positioning Update
2023 China A-Share Fund Positioning Update
2023 Greater China Fund Positioning Update
119 Active MSCI China Funds, AUM $48bn
2023 MSCI China Fund Positioning Update
In this report, we look at the latest allocations among the 119 active MSCI China funds in our analysis across sectors and industries. We look at average holdings, weights relative to benchmark and the key changes that occurred through 2022.
Sector Positioning
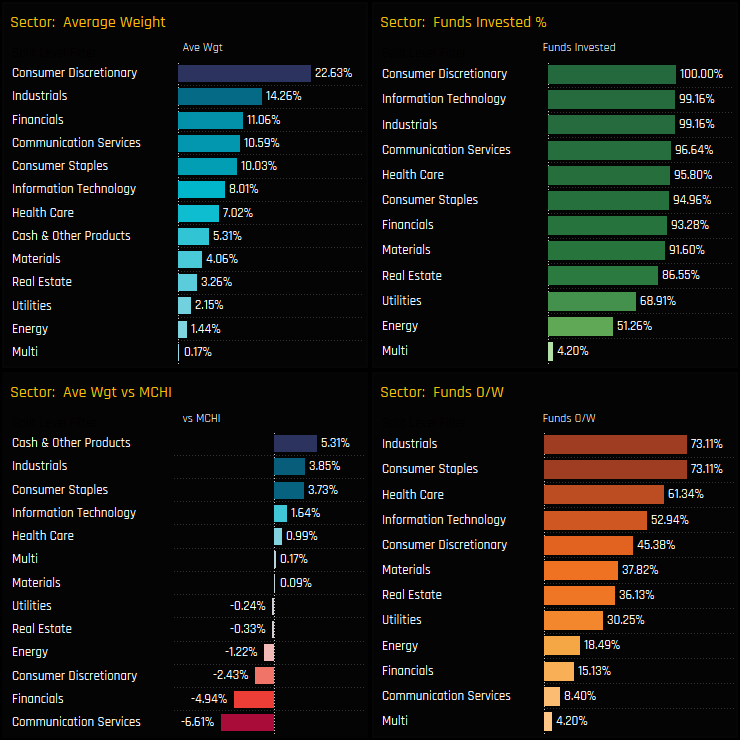
Consumer Discretionary remains the largest sector allocation as we start 2023, with Industrials carving a niche in 2nd spot and Financials, Communication Services and Consumer Staples forming the 3rd tier. Versus the benchmark, outside of Cash holdings on 5.3%, active MSCI China funds are underweight Communication Services, Financials and Consumer Discretionary to fund overweights in Industrials, Consumer Staples and Information Technology. Energy is the most underowned sector of them all, held by just 51.3% of managers at -1.22% below the iShares MSCI China ETF weight, on average.
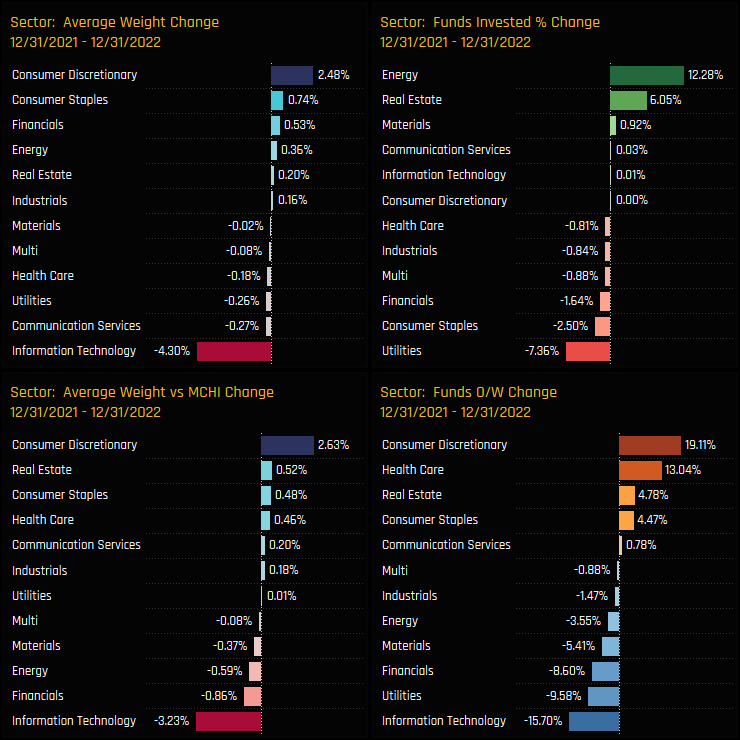
Sector activity through the course of 2022 saw a clear rotation out of Information Technology and in to Consumer Discretionary and Consumer Staples. Active China managers reduced overweights in the Tech sector by -3.23% on the year as -15.7% of funds switched to underweight, whilst +19.1% of managers moved to overweight the Discretionary sector, reducing underweights by +2.63%. The Energy sector stands out as capturing the largest percentage of new investors in 2022, with +12.3% of funds adding exposure over the period.
Sector Sentiment
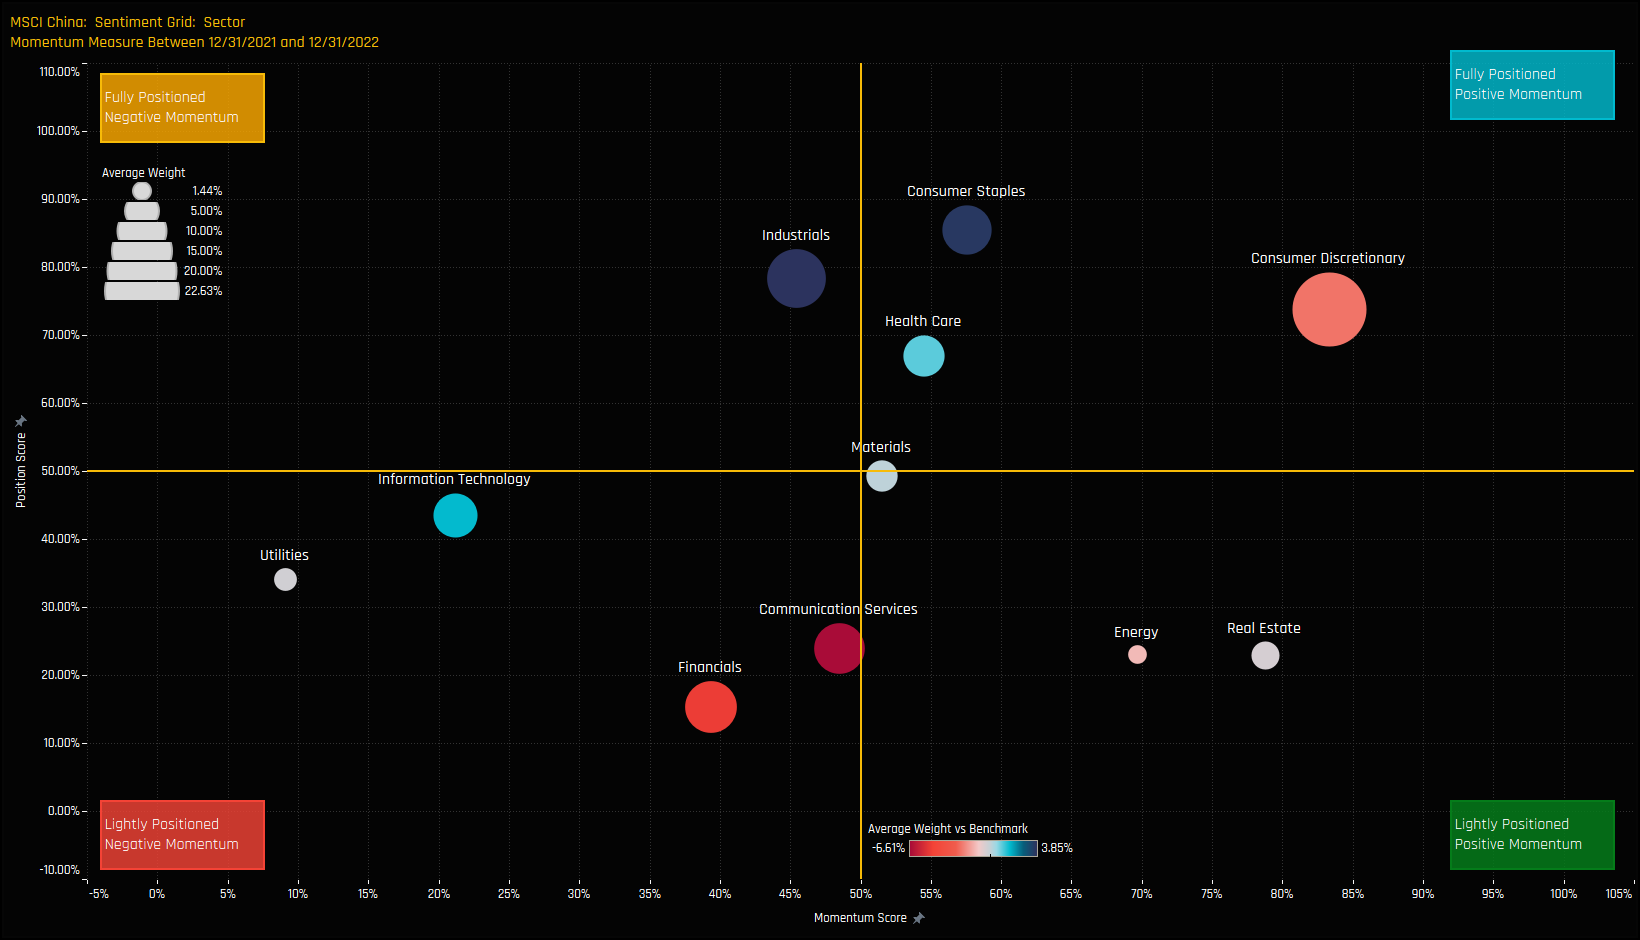
The sentiment grid below shows where current positioning in each Sector sits versus its own history going back to 2012 on a scale of 0-100% (y-axis), against a measure of fund activity for each Sector between 12/31/2021 and 12/31/2022 (x-axis).
The Grid highlights the favorable sentiment towardes the Consumer Discretionary sector, with momentum the strongest whilst positioning remains at the higher end of the 10-year range. Energy and Real Estate stand out as sectors at the lower end of their positioning ranges whilst attracting inflows from active China managers.
Consumer Discretionary Focus
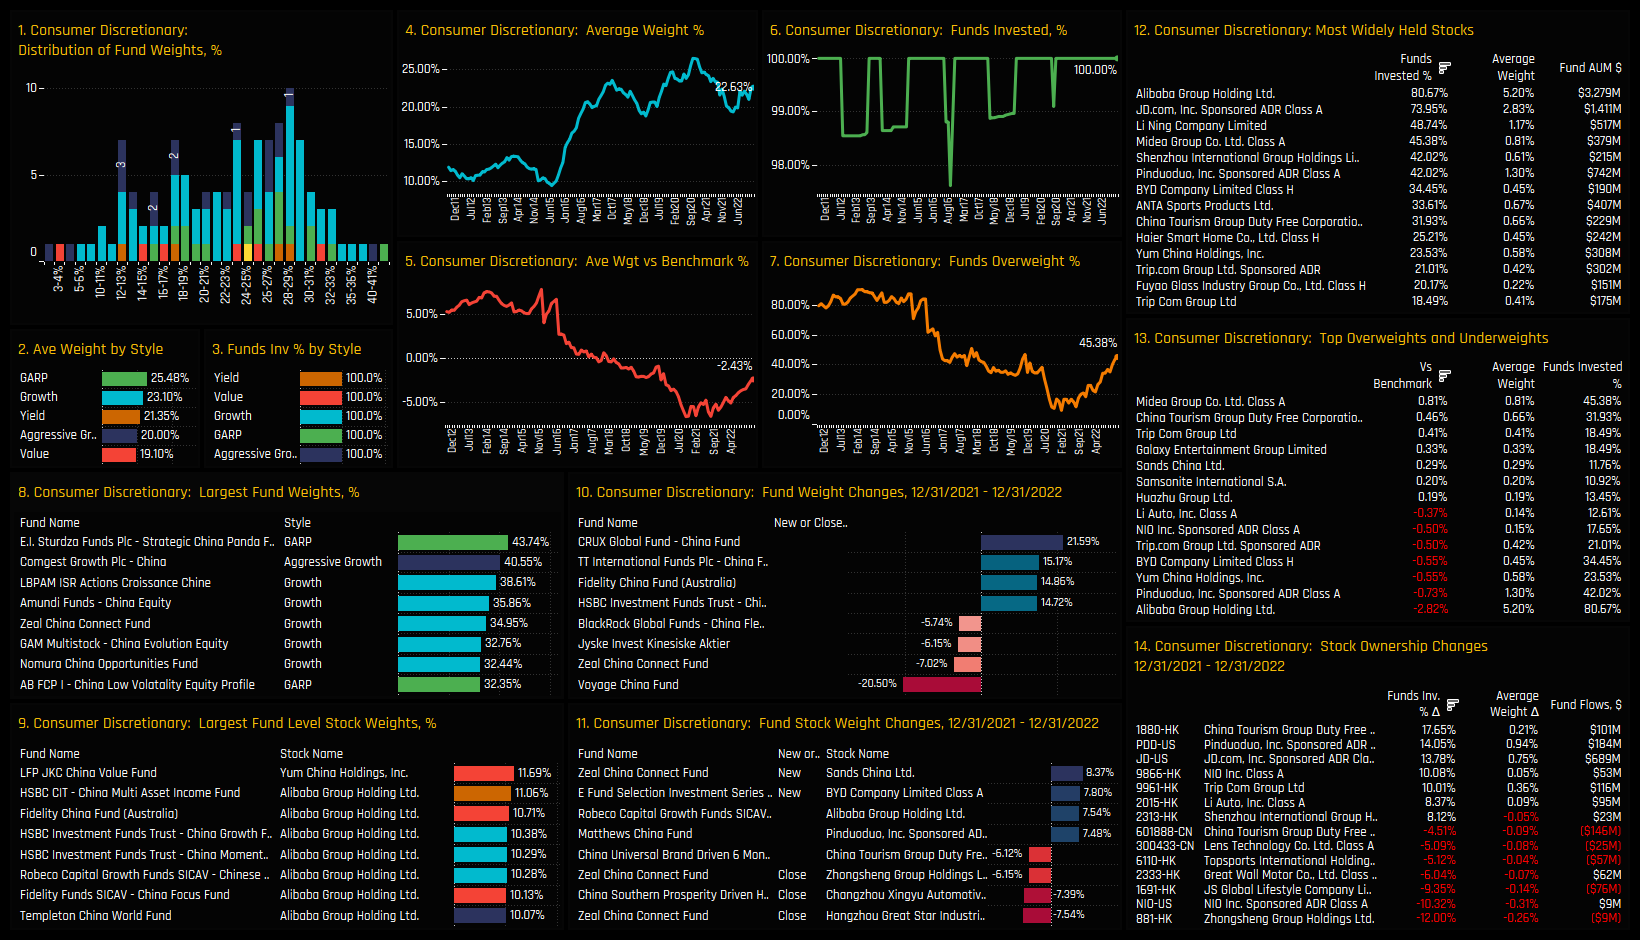
Positive sentiment is returning to the Consumer Discretionary sector. Average holding weights fell from a high of 26.5% in October 2020 to a low of 19.4% in early 2022, but have since rallied to 22.6% as we start 2023 (ch4). This has been driven by a concerted effort by China managers to increase allocations, with more funds switching to overweight (ch7) and closing gaps to benchmark (ch5). Over the course of 2023 there were some significant allocation shifts in to the sector, led by CRUX China (+21.6%) and TT China (15.2%)
On a stock level, Alibaba Group Holdings and JD.Com have formed a top-tier, held by 80.7% and 74% of China investors respectively, and at a significantly higher holding weight than sector peers. In general though, ownership in the sector runs deep, with 10 companies held by more than a quarter of the funds in our analysis. Activity through 2022 favoured China Tourism Group Duty Free, Pinduoduo and JD.Com, who all captured sizeable increases in investment over the period (ch14).
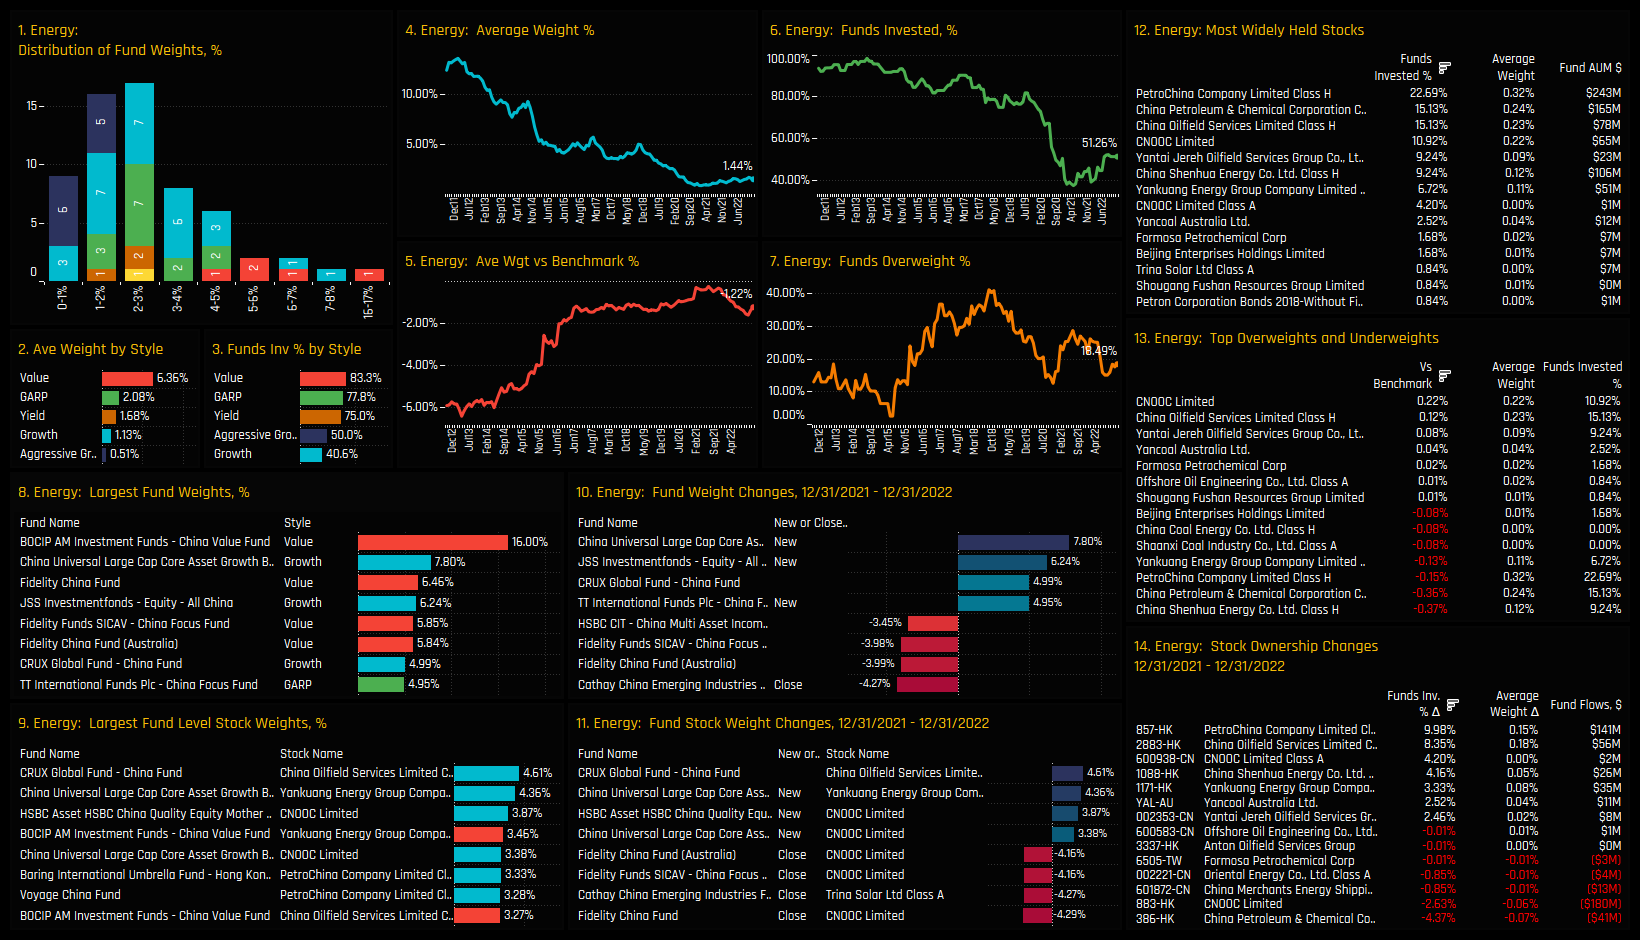
Energy Focus
Despite capturing strong ownership growth in 2022, Energy allocations are still close to their lowest levels on record. The percentage of funds invested in Energy stocks is still well below the levels pre-COVID, with those who sold out seemingly reluctant to buy back in (ch6). The Style split is significant, with Value funds allocating far more than their Growth/Aggressive Growth peers (ch2), led by BOCIP China Value’s allocation of 16% (ch8). With only 51.3% of funds invested and 18.5% of funds overweight Energy, the risk for most managers remains to the upside.
Stock ownership in the sector is extremely light, with PetroChina the most widely held name with 22.7% of funds invested. Only 4 stocks are held by more than 10% of the funds in our China analysis. Underweights are led by China Shenhua Energy and China Petroleum & Chemical. Stock activity in 2022 had a heavy buyside skew, with active China funds buying in to PetroChina, China Oilfield Services and CNOOC.
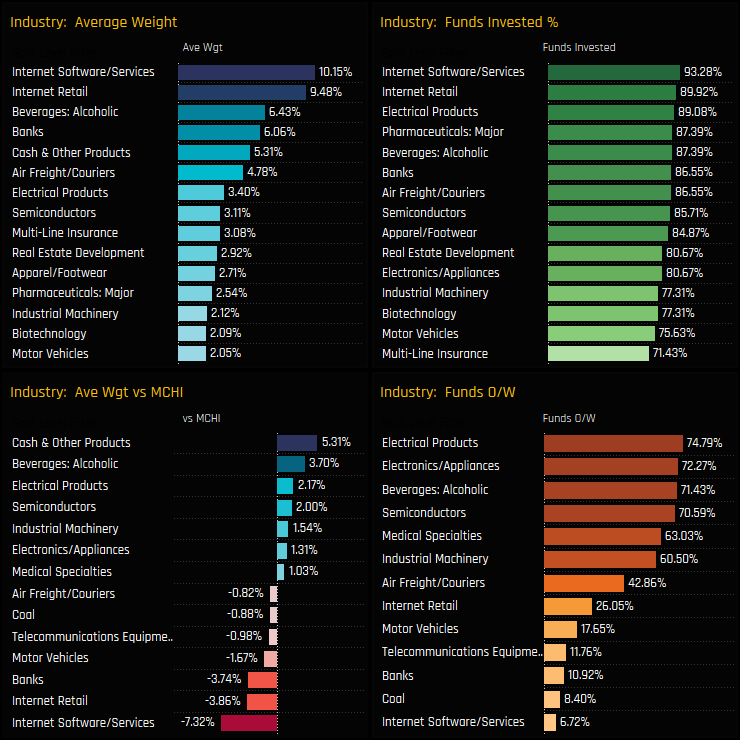
Industry Positioning
On an industry level, Internet Software/Services and Internet Retail are the dominant groups and account for nearly a fifth of total China allocations. Relative to benchmark however, both represent significant underweights of -7.32% and -3.84% respectively. On the overweight side, 6 industry groups standout, all held overweight by the majority of China investors. Banks and Motor Vehicles are widely owned, yet very few managers are positioned overweight.
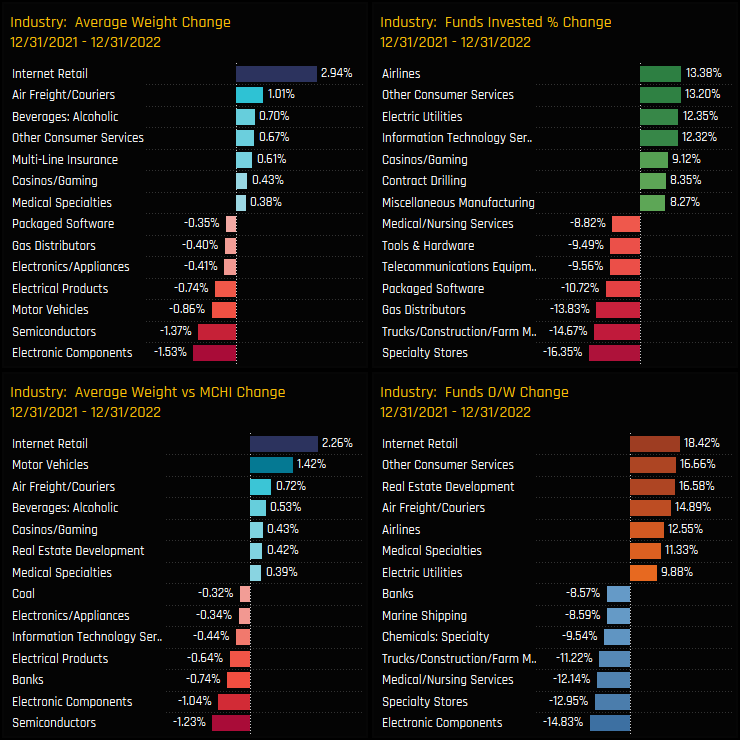
Over the course of last year, Internet Retail was a key beneficiary of industry rotation, with average weights increasing by +2.94% and 18.4% of funds moved to overweight. Other winners include Airlines, Casinos/Gaming and Airfreight/Couriers, whilst China investors scaled back on Banks, Electronic Components and Specialty Stores.
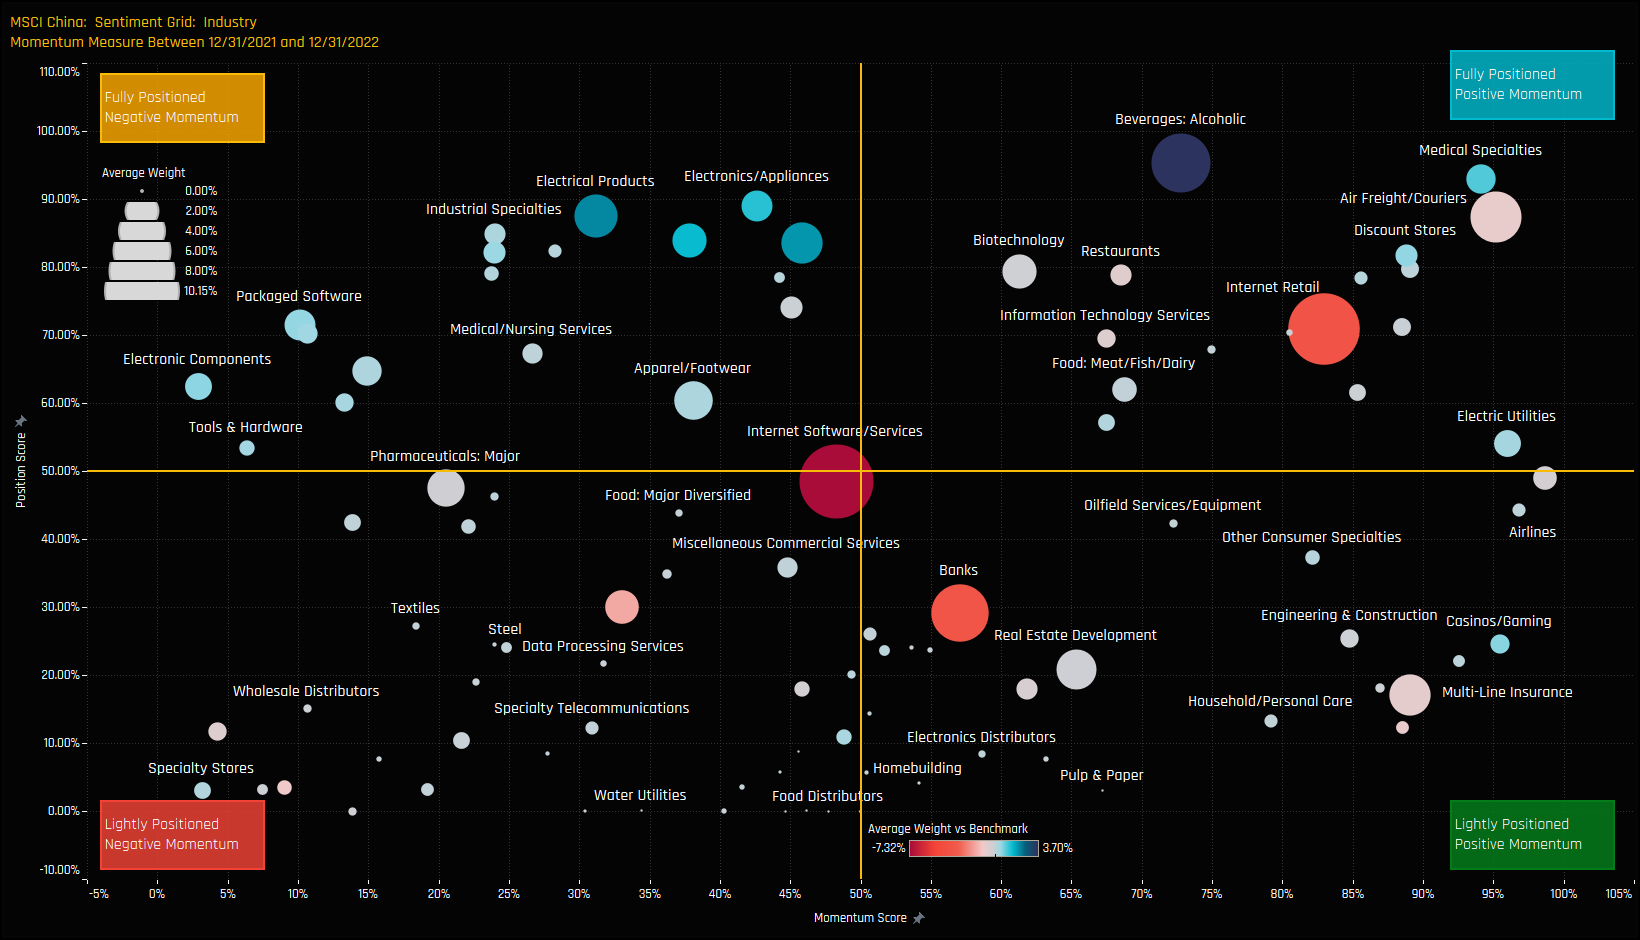
Industry Sentiment
The sentiment grid below shows where current positioning in each Industry sits versus its own history going back to 2013 on a scale of 0-100% (y-axis), against a measure of fund activity for each Industry between 12/31/2021 and 12/31/2022 (x-axis).
Industries in favour include Beverages (Alcoholic), Medical Specialties, Air Freight/Couriers and Internet Retail, all having captured investment in 2022 and with exposure levels towards their highest on record. Multi-Line Insurance, Casinos/Gaming and Airlines are rising up the ranks, whilst Packaged Software and Electronic Components are coming off the highs.
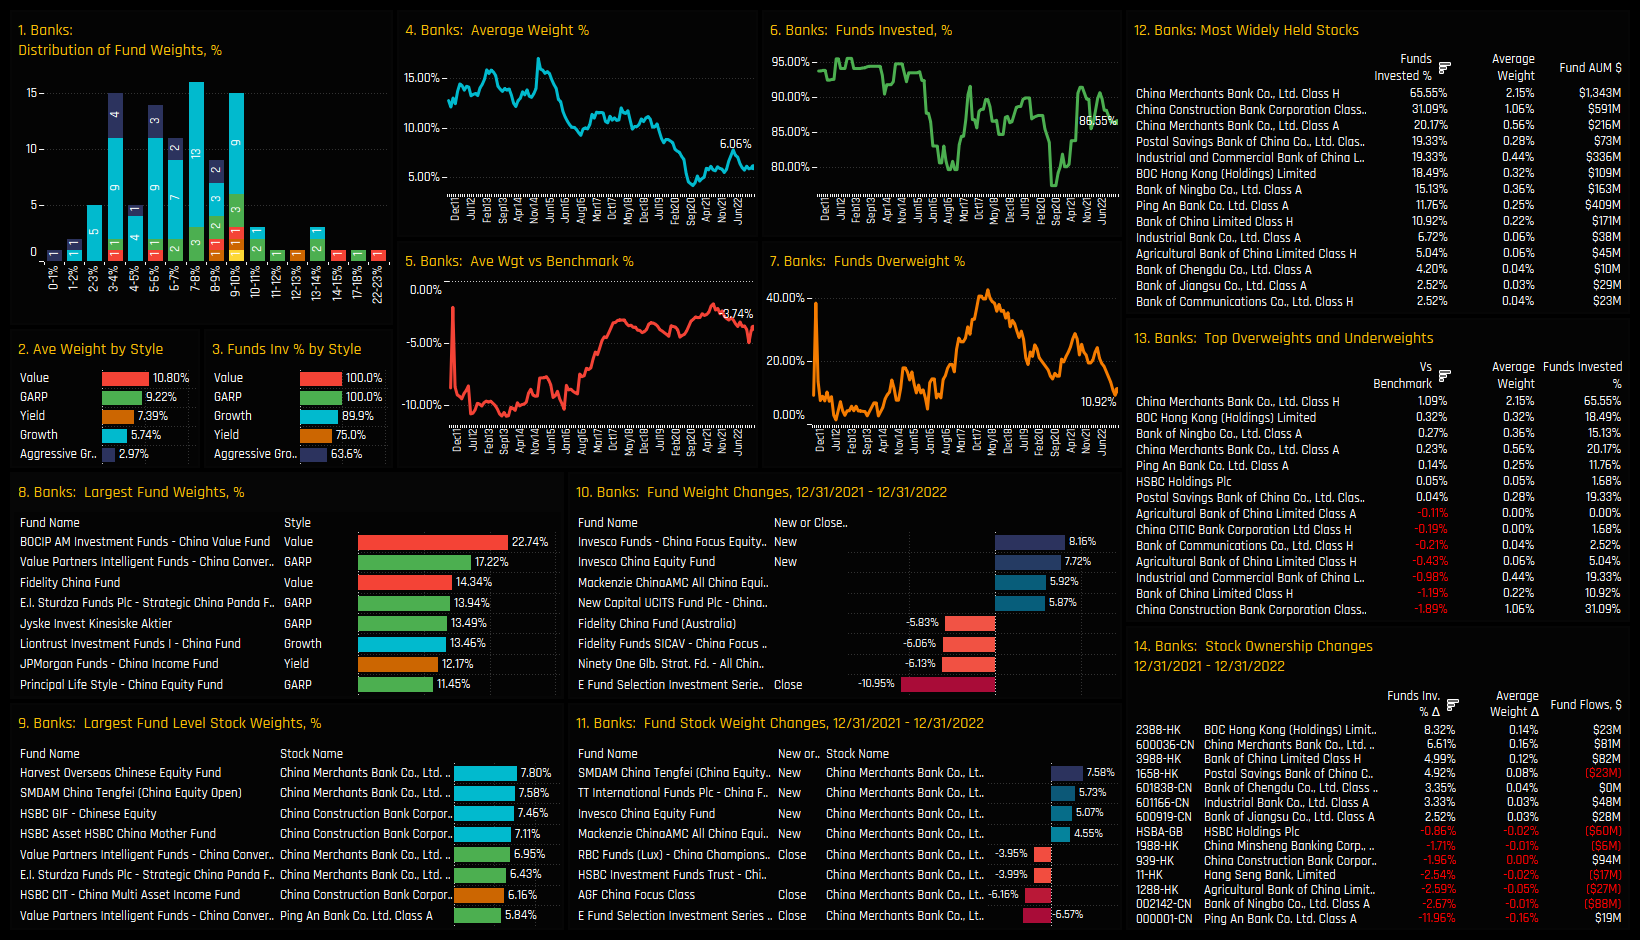
Banks Focus
Sentiment in the China Banks is depressed. Average weights are back towards the lows at 6.06% and the percentage of funds overweight has slumped to just 10.9%. Clearly, China active investors do not expect outperformance in the year ahead. Fund weights are clustered between 3% and 10%, with a Style correlation that favours Value over Growth.
China Merchants Bank is the ‘go-to’ name in the sector, held by 65.6% of funds at an average weight of 2.15%, a key overweight for the majority of investors. Underweights are led by China Construction Bank, Bank of China and ICBC. Stock activity saw Ping An Insurance A-Shares dumped by 11% of funds, offset by increased ownership in BOC Hong Kong, China Merchants Bank and Bank of China, among others.
Conclusion and Links
This concludes our analysis of top-down positioning among active MSCI China investors. Click the link to the right for the latest version of the MSCI China Fund Positioning Report, scroll down for positioning analysis for A-Share and Greater China Funds.
In this report, we look at the latest allocations among the 100 active China A-Share funds in our analysis across sectors and industries. We look at average holdings, weights relative to benchmark and the key changes that occurred through 2022.
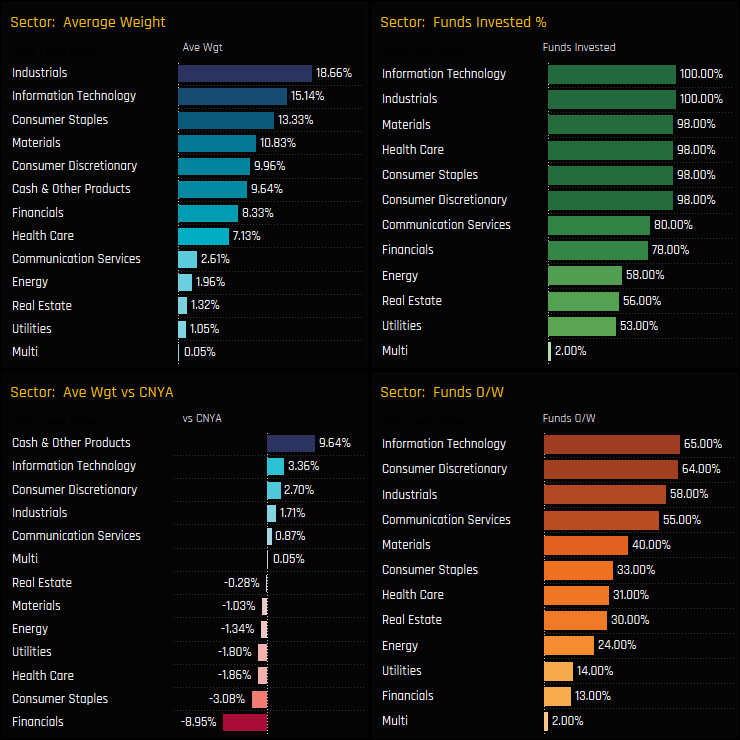
Sector Positioning
China A-Share managers hold 83% of their total allocation in the 7 top sectors. The remainder is split between Cash and the less widely held Communication Services, Energy, Real Estate and Utilities. Active managers differ from the iShares MSCI China A-Shares ETF (CNYA) by underweighting the financial sector with an average weight of -8.95% below benchmark and only 13% positioned higher than the index. Offsetting this are consensus overweights in the Information Technology and Consumer Discretionary sectors.
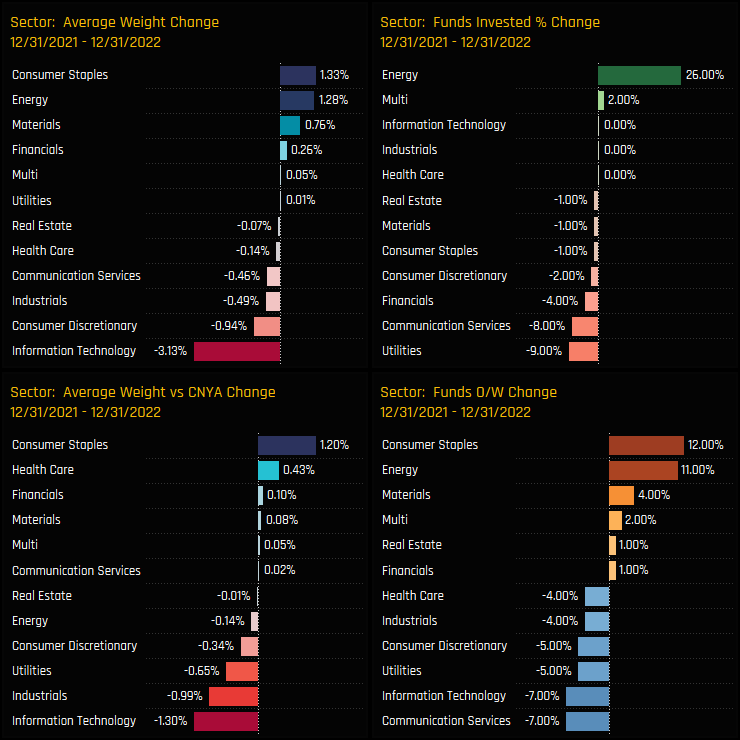
Through 2022, active A-Share managers reduced allocations in Tech and Consumer Discretionary and increased in Consumer Staples, Energy and Materials. The Energy sector, similar to MSCI China funds was one of the standouts, with 26% of the A-Share funds in our analysis adding exposure to the sector throughout the year.
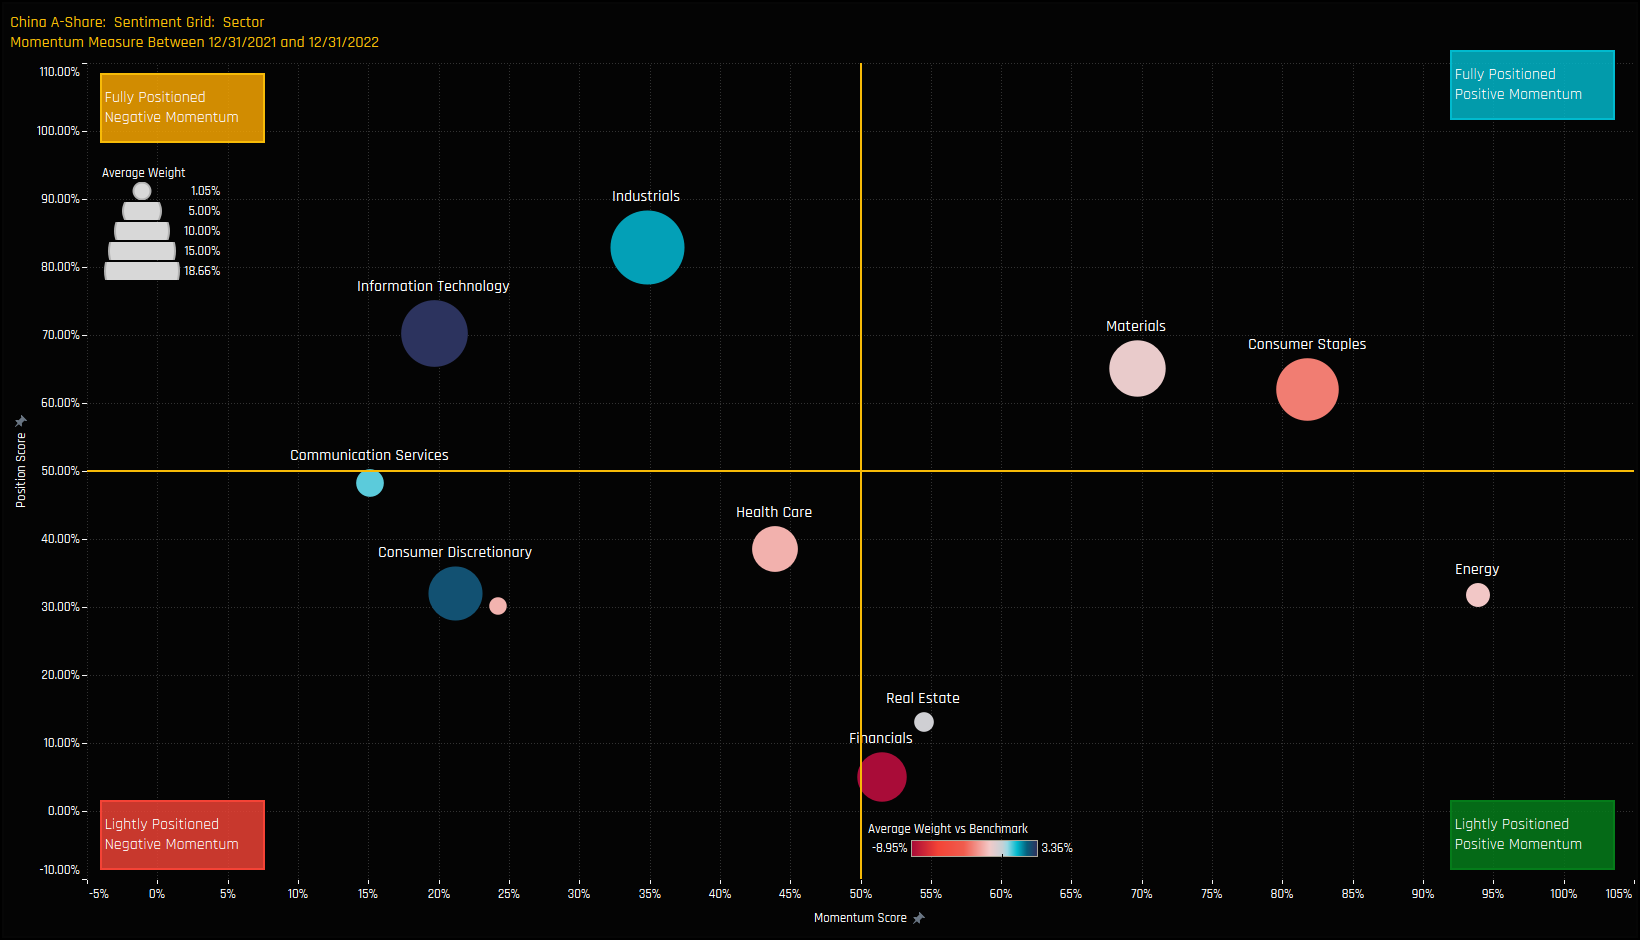
Sector Sentiment
The sentiment grid below shows where current positioning in each Sector sits versus its own history going back to 2015 on a scale of 0-100% (y-axis), against a measure of fund activity for each Sector between 12/31/2021 and 12/31/2022 (x-axis).
The Grid highlights a rotation out of previously well owned and overweighted sectors, led by Industrials, Tech and Consumer Discretionary. Instead, the less well owned and underweight sectors of Energy, Materials and Consumer Staples are taking a more prominent role in A-Share portfolios. Of the 3, Energy has the lower positioning score and the higher momentum score.
Energy Focus
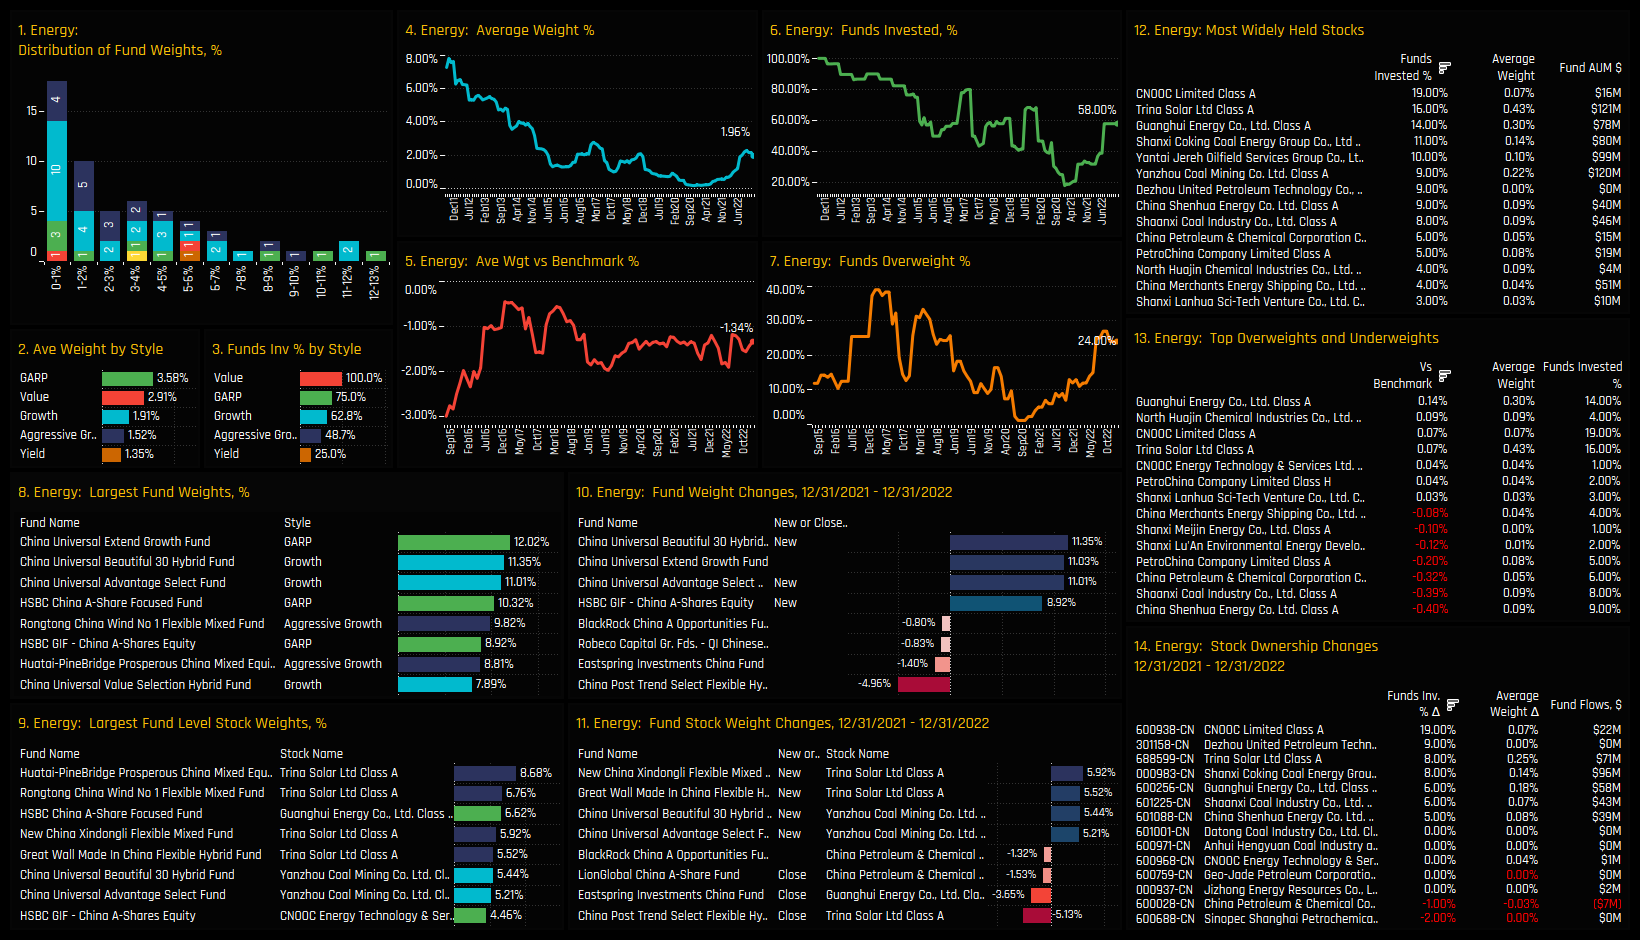
The ownership trends for the A-Share Energy sector look much the same as those among our MSCI China, EM, Global, US, UK and Asia Ex-Japan fund universes! The common thread is one of depressed ownership levels, far below the previous highs but with the early stages of a recovery. The Energy sector is far from universally held, with 58% fund ownership below the 100% seen in 2011 (ch6). The uptick in ownership through 2022 was led by new positions from China Universal Beautiful 30 (+11.35%), China Universal Advantage Select (+11%) and HSBC China A Shares (+8.9%)
The most widely held stock in the sector is CNOOC Class A, owned by 19% of managers but at a low average holding weight of 0.07%. More convincing exposures can be found in Trina Solar Ltd and Guanghui Energy, which occupy many of the largest individual holdings in the sector (ch9). The Energy underweight is mainly comprised of lighter than benchmark holdings in China Shenhua Energy, Shaanxi Coal Industry and China Petroleum & Chemical (ch13). Driving allocations higher was increased ownership in CNOOC, Dezhou United Petroleum and Trina Solar, among others (ch14).
Industry Positioning
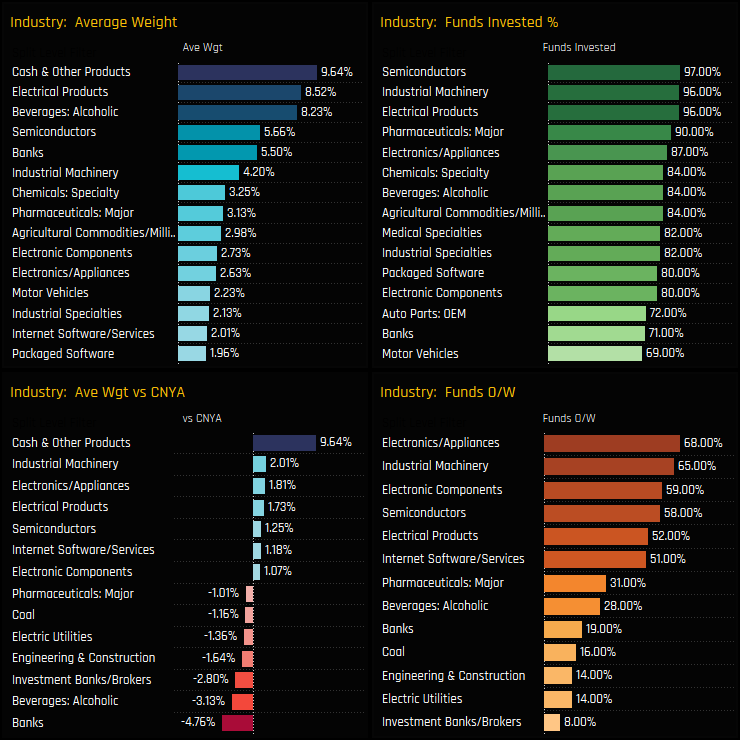
Industry positioning is led by Electrical Products and Alcoholic Beverages on an average weight basis, but Semiconductors and Industrial Machinery are more widely held. Versus the iShares CNYA ETF, active A-Share managers are running underweights in Banks and Alcoholic Beverages to fund overweights in Cash, Industrial Machinery and Electronics/Applicances.
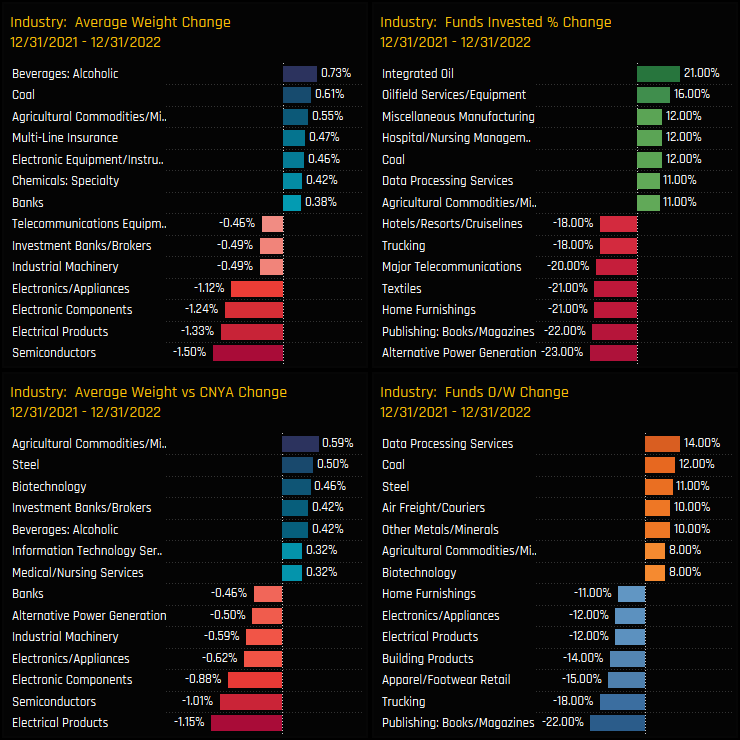
The key rotations in 2022 were a move in to the Energy industry groups of Integrated Oil and Oilfield Services, buying in Coal and Agricultural Commodities/Milling. Managers scaled back exposure to Semiconductors, Publishing and Electrical Products.
Industry Sentiment
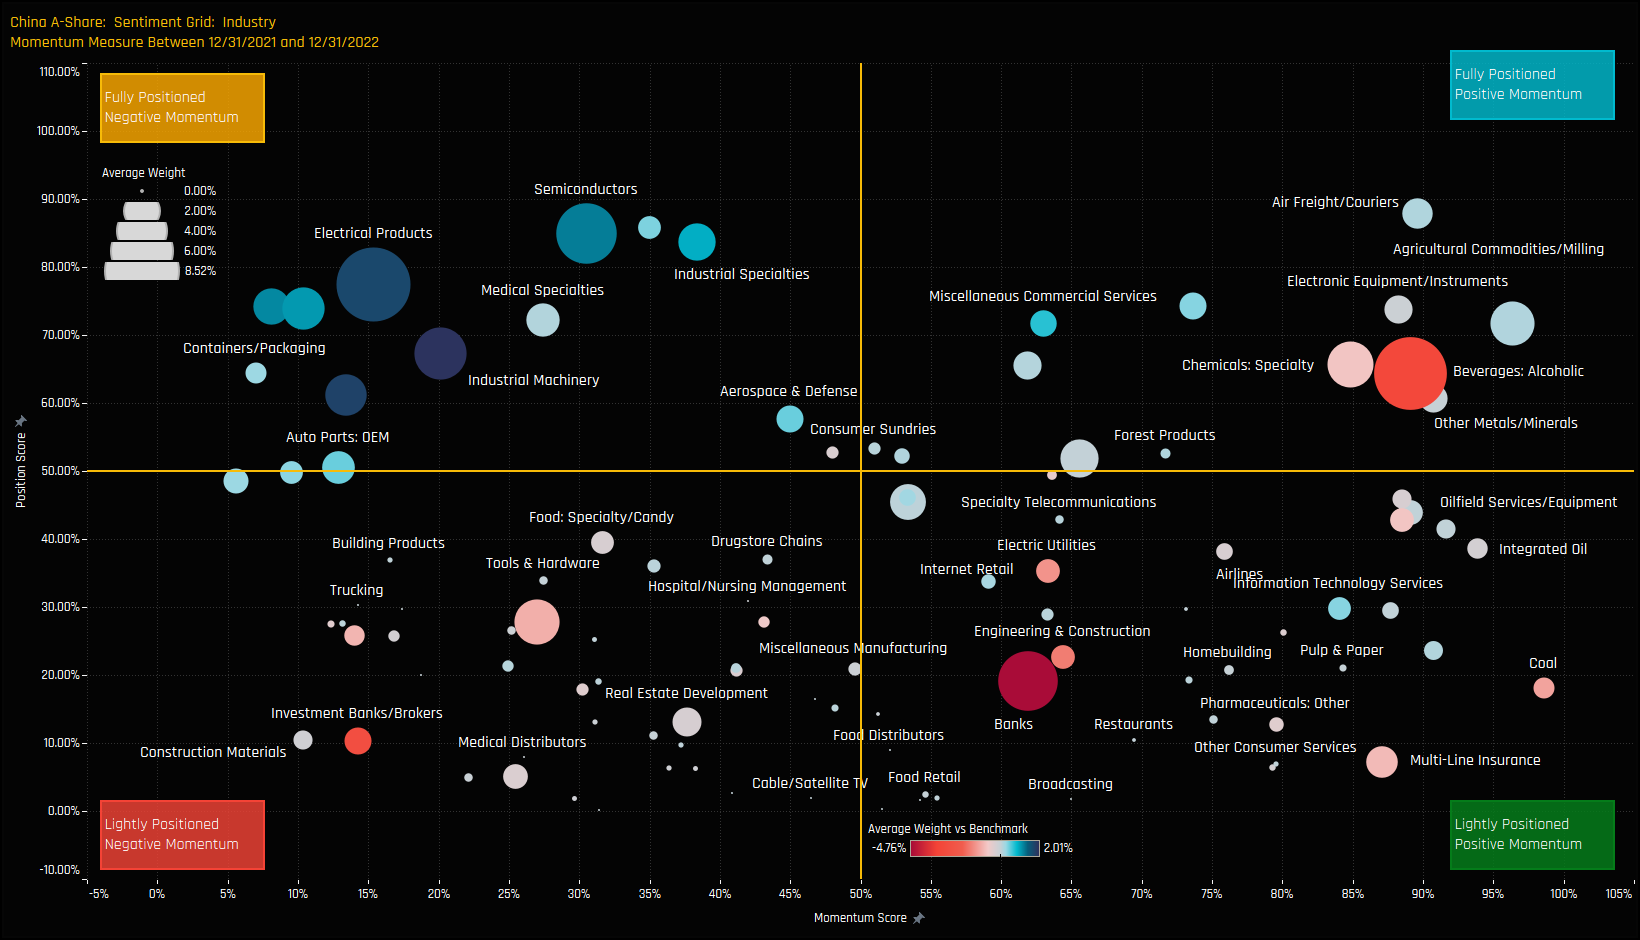
The sentiment grid below shows where current positioning in each Industry sits versus its own history going back to 2015 on a scale of 0-100% (y-axis), against a measure of fund activity for each Industry between 12/31/2021 and 12/31/2022 (x-axis).
There are a cluster of Industry groups in both the top left and top right corners of the Grid. The overweights and well owned industries of Electrical Products, Semiconductors and Industrial Materials are being scaled back. In contrast, underweights in Alcoholic Beverages and Specialty Chemicals have been the beneficiaries of rotation. Both Air Freight/Couriers and Agricultural Commodities/Milling are closing in on record levels of exposure after capturing inflows last year.
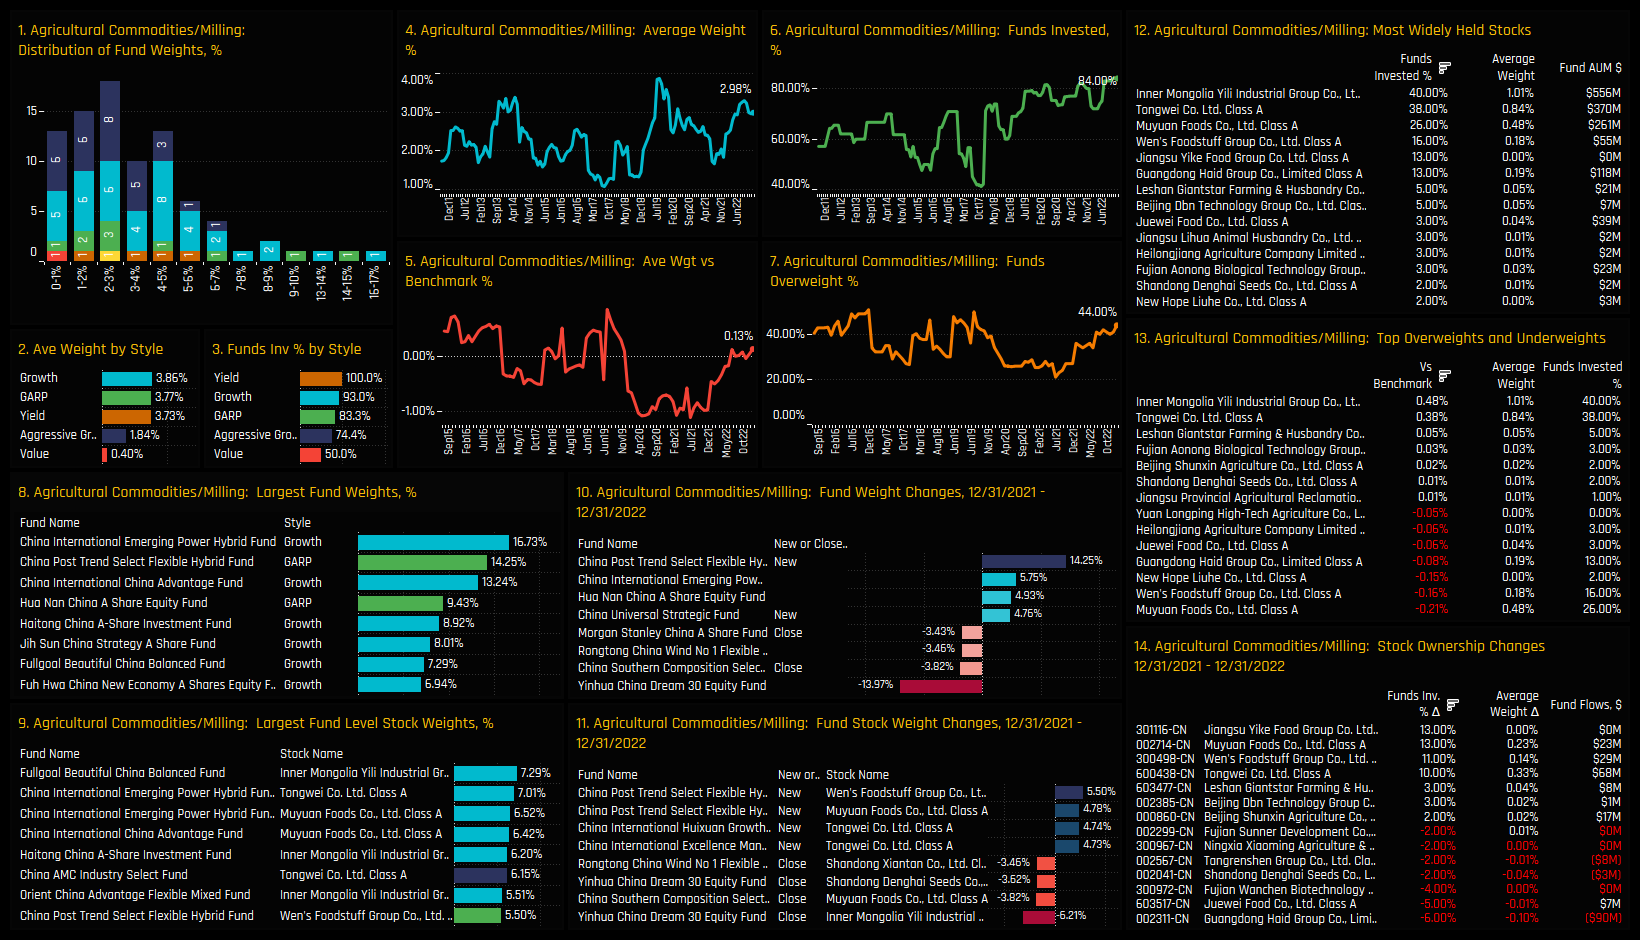
Agricultural Commodities/Milling Focus
The Agricultural Commodities/Milling industry group has benefitted from manager rotation over the last 12-months. The percentage of funds invested has hit a new high of 84%, average weights have moved to the top of the decade long range and active investors have moved from net underweight to overweight in the process. The majority of A-Share funds hold less than a 5% stake in the sector, though there are those more bullishly positioned, led by China Emerging Power Hybrid Fund (16.7%) and China Post Trend Select (14.25%).
Inner Mongolia Yili Industrial, Tongwei Co and Muyuan Foods are the key holdings, accounting for a combined 78% of the total industry weight and the most widely held companies by a distance. Rising ownership in Wen’s Foodstuff Group over the course of 2022 raised it to the 4th most widely owned stock, whilst investment levels dropped in Guandong Haid Group.
Conclusion and Links
This concludes our analysis of top-down positioning among active China A-Share investors. Click the link to the right for the latest version of the China A-Share Fund Positioning Report, scroll down for positioning analysis on Greater China Funds.
In this report, we look at the latest allocations among the 45 active Greater China funds in our analysis across sectors and industries. We look at average holdings, weights relative to benchmark and the key changes that occurred through 2022.
Sector Positioning
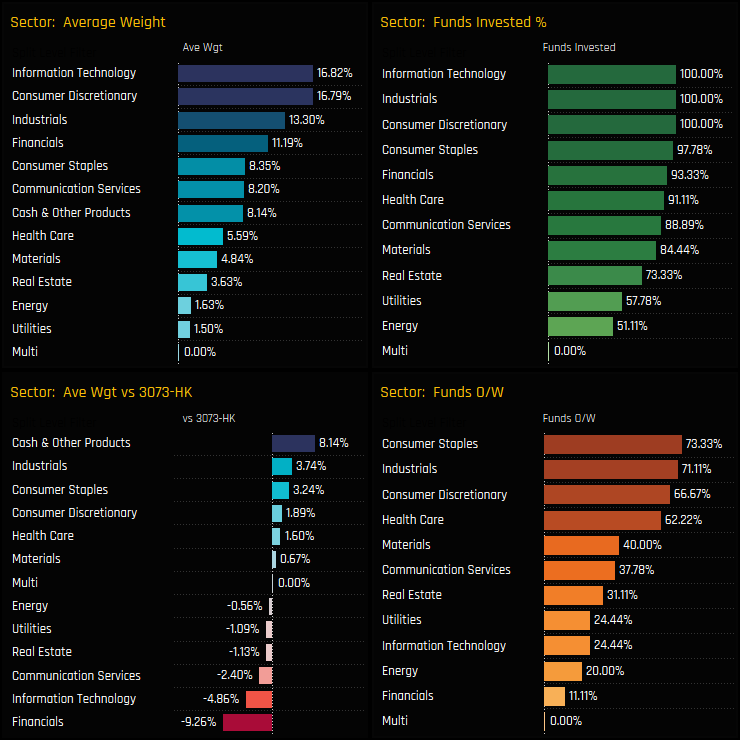
Technology and Consumer Discretionary are the dominant sectors, accounting for around a third of total allocations. Versus the benchmark, once again managers are running underweights in Financials, in addition to Technology and Communication Services. Overweights are led by Cash, Industrials and the Consumer sectors whilst Energy and Utilities are not widely held by Greater China managers.
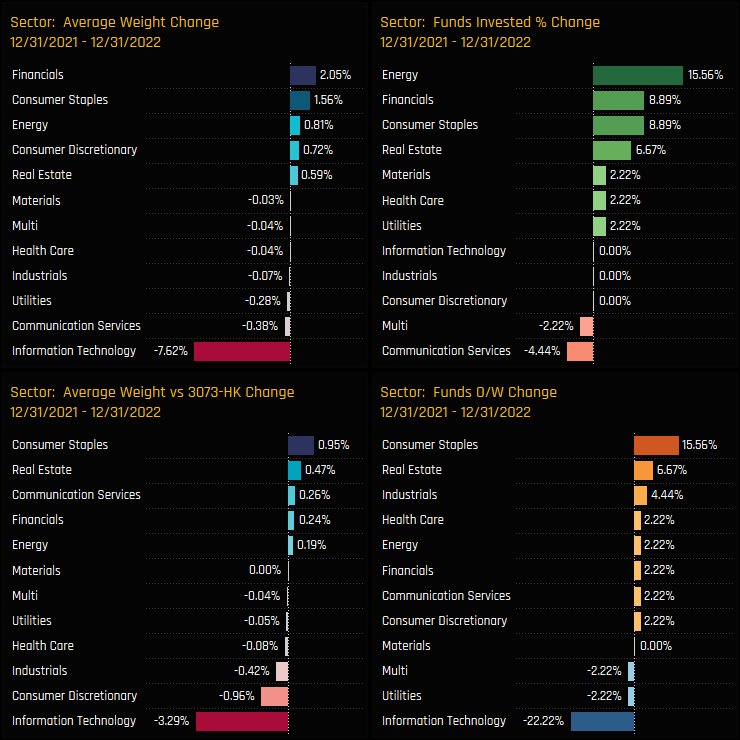
Allocation changes in 2022 suggest a rotation in to Financials and Consumer Staples at the expense of a big move out of Technology. Tech weights fell by -7.62% with 22.2% of funds switching to underweight. Energy, once again saw a large gap up in exposure as the percentage of funds invested increased by 15.6% on the year.
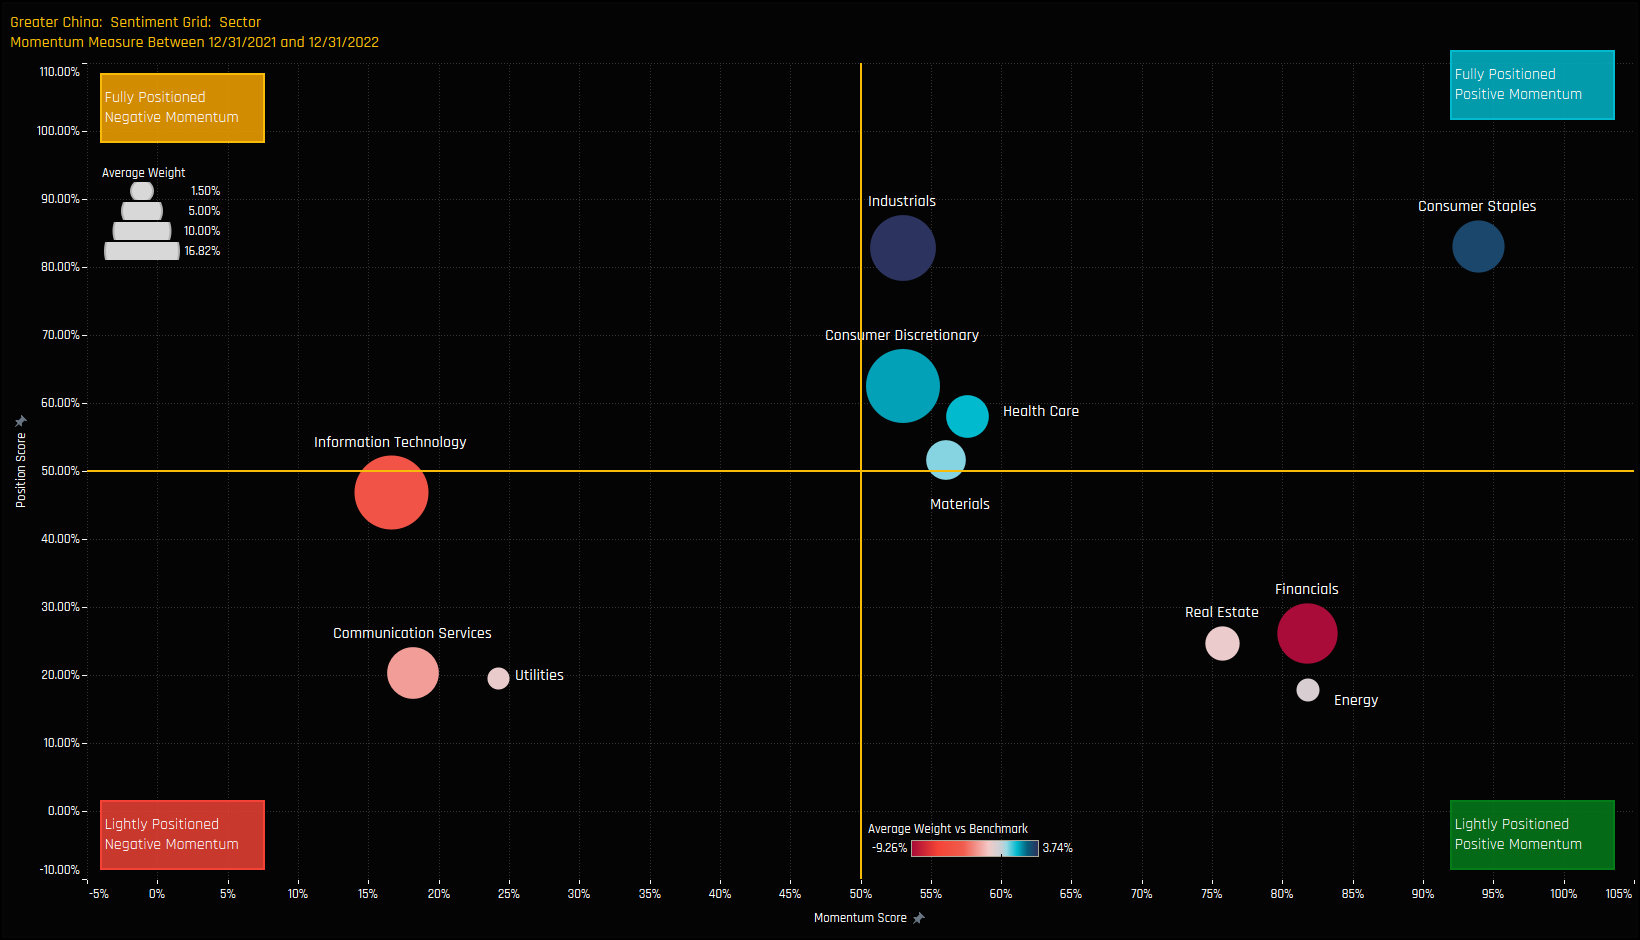
Sector Sentiment
The sentiment grid below shows where current positioning in each Sector sits versus its own history going back to 2011 on a scale of 0-100% (y-axis), against a measure of fund activity for each Sector between 12/31/2021 and 12/31/2022 (x-axis).
Consumer Staples sit out on their own as a sector at near peak exposure whilst attracting fresh inflows in 2022. Technology exposure has fallen from its highs after the aggressive outflows of last year and Communication Services is unloved on both measures. Financials, Real Estate and Energy look to be capturing investment from a position of low ownership.
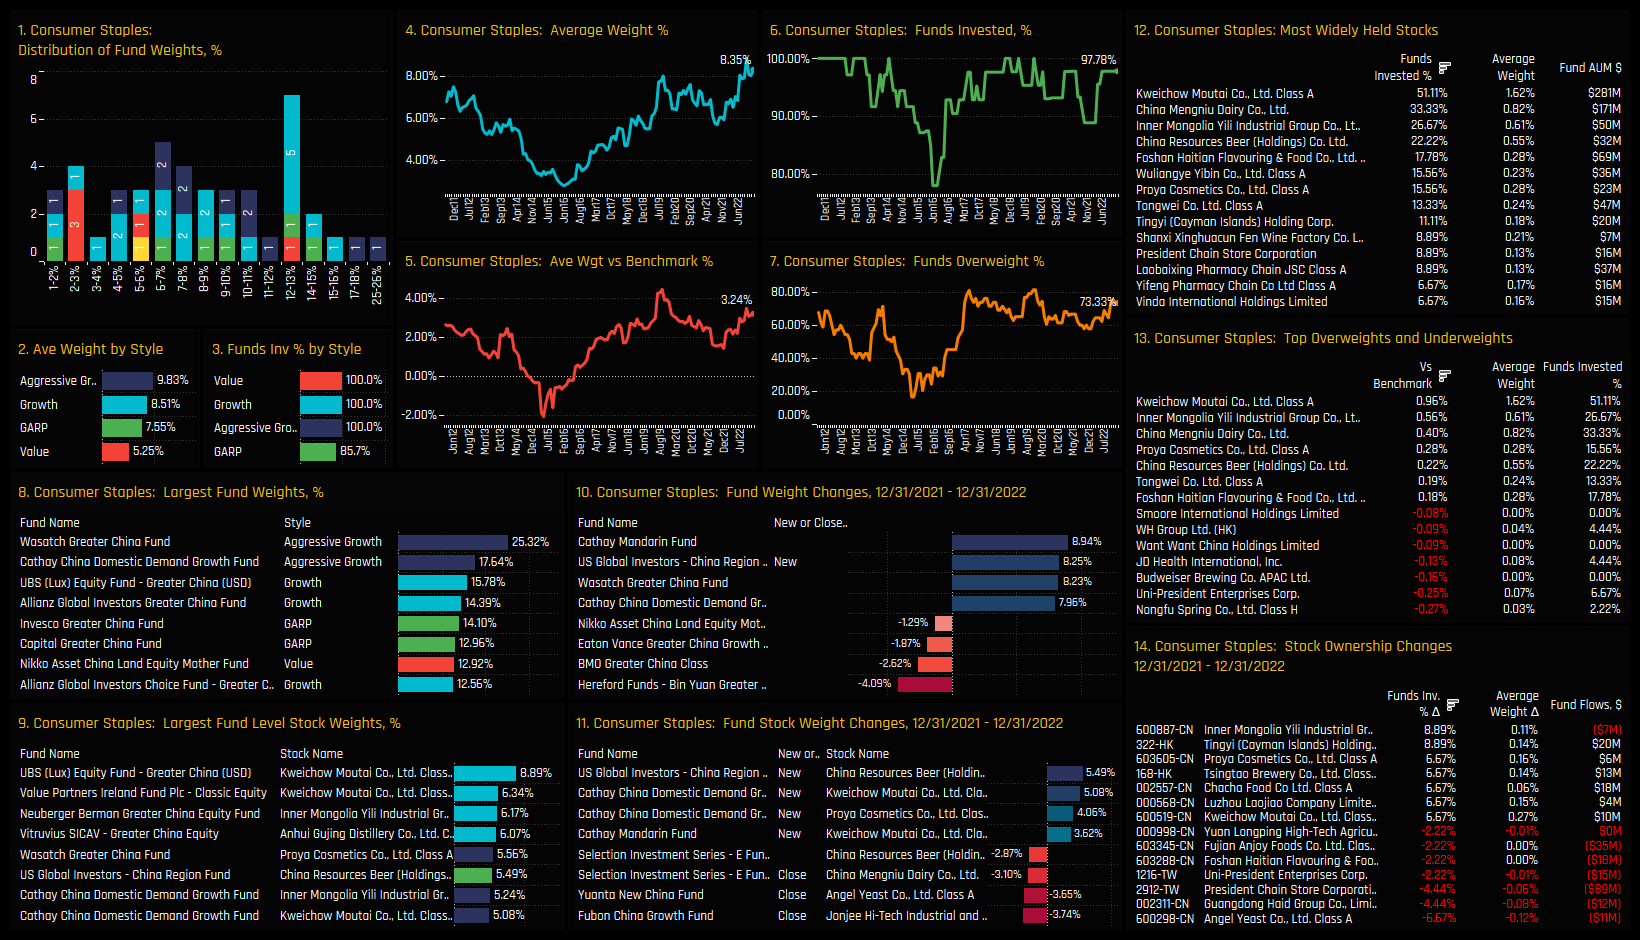
Consumer Staples Focus
Investment trends look strong for the Consumer Staples sector. Though not at all-time highs, the recent moves in both absolute and relative positioning suggest managers are positioning themselves for serious outperformance in 2023. Nearly three-quarters of the Greater China funds in our analysis are positioned overweight, with Growth/Aggressive Growth funds the key allocators.
Kweichow Moutai is the dominant holding by a measure, held by 51% of strategies at an average weight of 1.62%, though China Mengniu Dairy and Inner Mongolia Yili are also held in high regard as key overweights. Underweights are led by Nongfu Spring Co, Uni-President Enterprises and Budweiser Brewing Co, with all three almost universally avoided by Greater China managers.
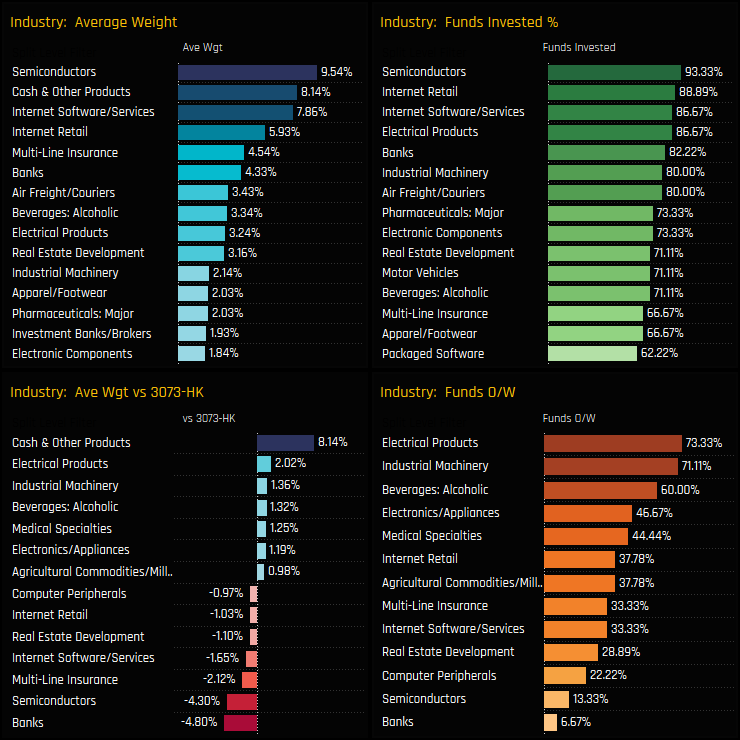
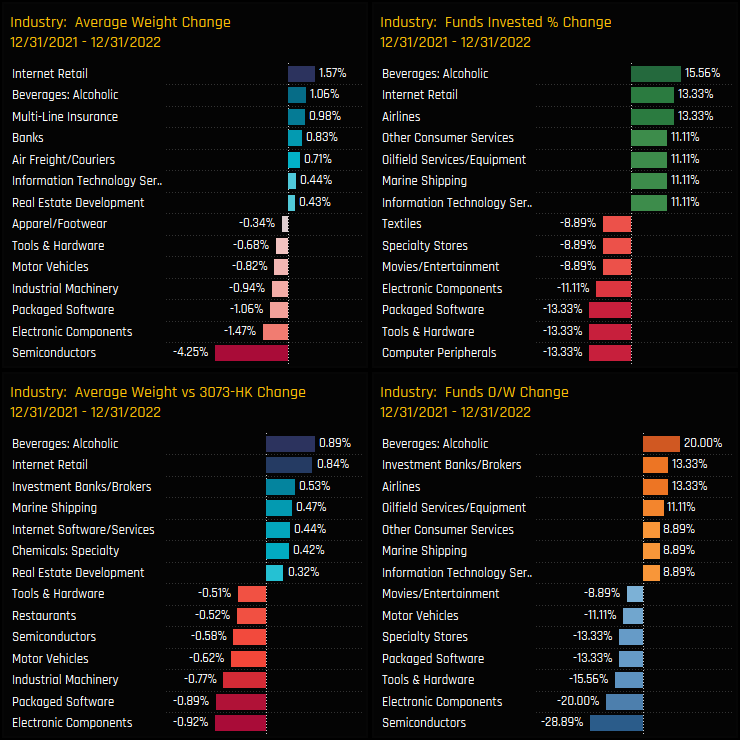
Industry Positioning
The latest Industry positioning snapshot shows Semiconductors, Cash and Internet Software/Services as the dominant allocations. Semiconductors are also the largest underweight versus the SPDRs Greater China ETF, alongside Banks and Multi-Line Insurance. Electrical Products and Industrial Machinery are the consensus overweights, held above benchmark by 73.3% and 71.1% of funds respectively.
Activity last year saw a significant scaling back of Semiconductor exposure, with 28.9% of funds moving to underweight as average weights fell by -4.25%. Beneficiaries of this rotation include Alcoholic Beverage, Airlines and Internet Retail, who all captured strong increases in the percentage of funds invested in 2022.
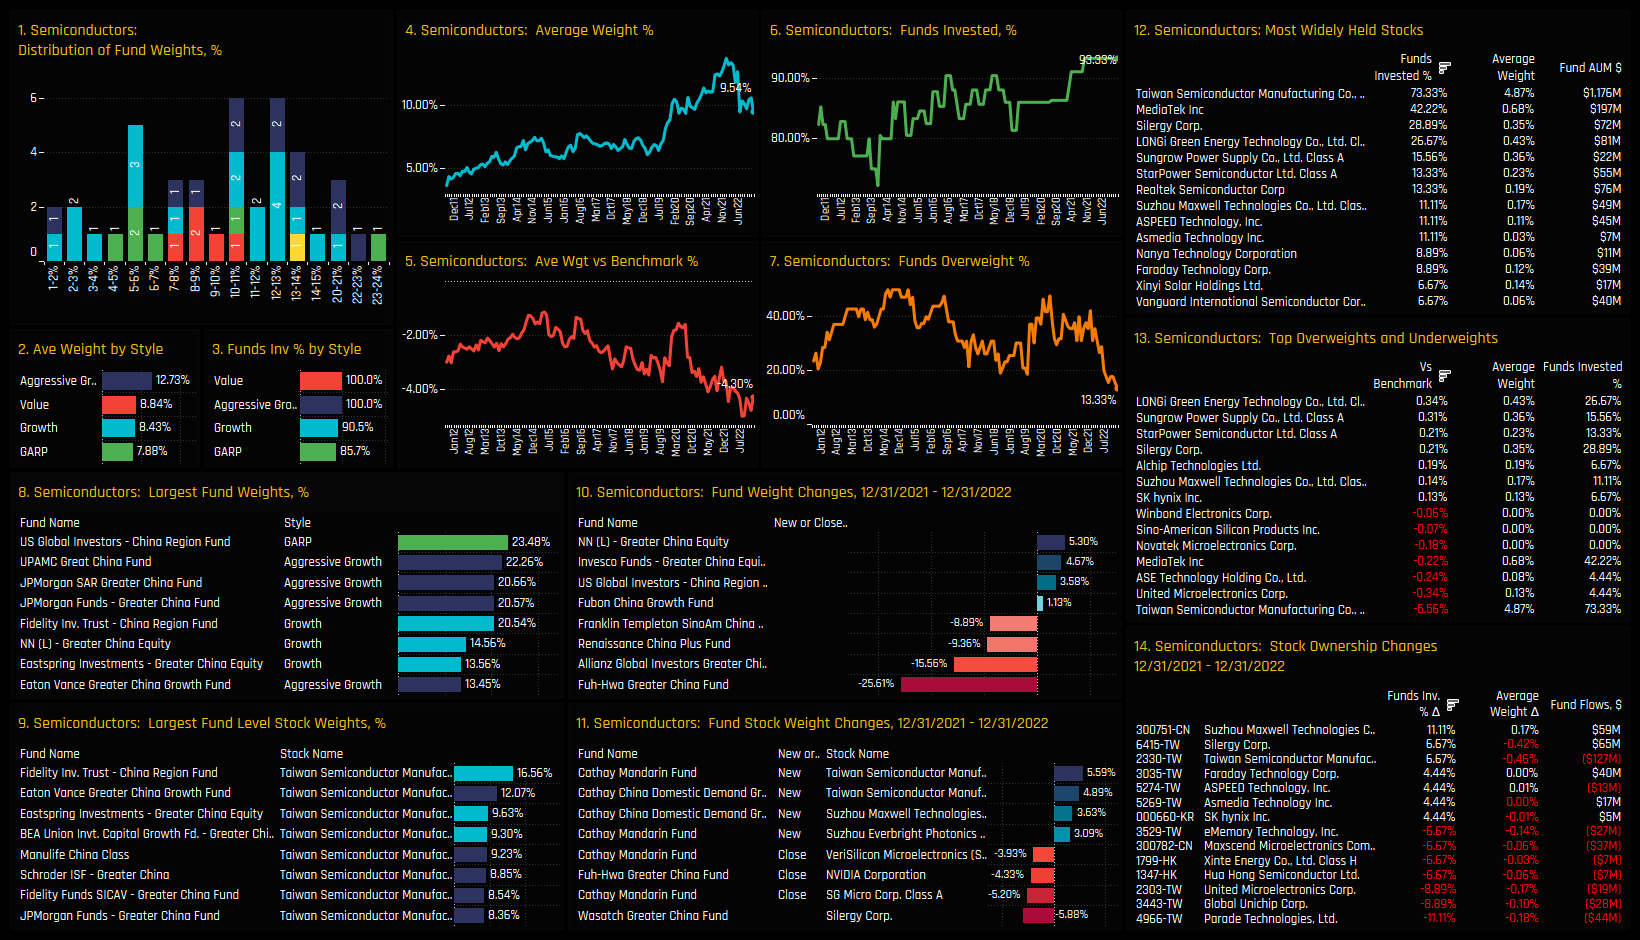
Semiconductor Focus
Semiconductor exposure among Greater China funds has taken a reality check. From a peak of 13.8% in December 2021, allocations have fallen to 9.54%, levels last seen before the onset of the COVID pandemic in 2020. Whilst absolute ownership in the sector remains high at 93.3% of funds, those that do hold Semiconductors have been reducing exposure. The percentage of funds overweight has plummeted to all-time lows of 13.3% with the net underweight at the bottom of the range at -4.3%.
TSMC is the flagship holding in the sector, and indeed across all sectors in the Greater China Universe. It is held by 73.3% of funds at an average weight of 4.87%, yet this represents an underweight of -5.56% compared to the SPDRs Greater China ETF. Overweights are led by LONGi Green Energy Technology, Sungrow Power Supply and StarPower Semiconductor Ltd. Suzhou Maxwell Technologies captured the largest rise in ownership in 2022, while Greater China funds scaled by exposure to Parade Technologies and Global Unichip Corp.
Conclusion & Links
This concludes our analysis of top-down positioning among active Greater China investors. Click the link to the right for the latest version of the Greater China Fund Positioning Report.
For more analysis, data or information on active investor positioning in your market, please get in touch with me on steven.holden@copleyfundresearch.com


