In this issue:
China Banks: Consolidating The Lows as Old Guard Makes a Come Back
New Oriental Education & Technology: Back From the Dead
MSCI China Stock Positioning & Activity Update
150 Active MSCI China Funds, AUM $47bn
China Banks: Consolidating the Lows as Old Guard Makes a Come Back
• China Banks are at near record levels of ownership among active MSCI China funds.
• Fund activity through 2023 shows a degree of consolidation among managers, with exposure levels holding the lows
• Within the sector we see rotation among the key names. China Merchants Bank loses steam whilst ICBC, Bank of China and China Construction Bank have seen momentum swing to the buy-side and positioning move off the lows.
Time Series & Industry Activity
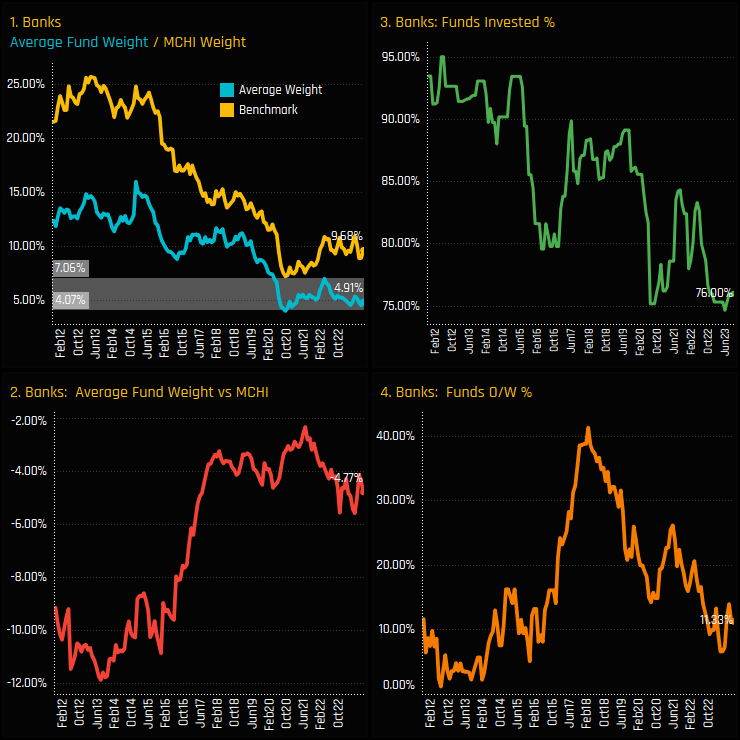
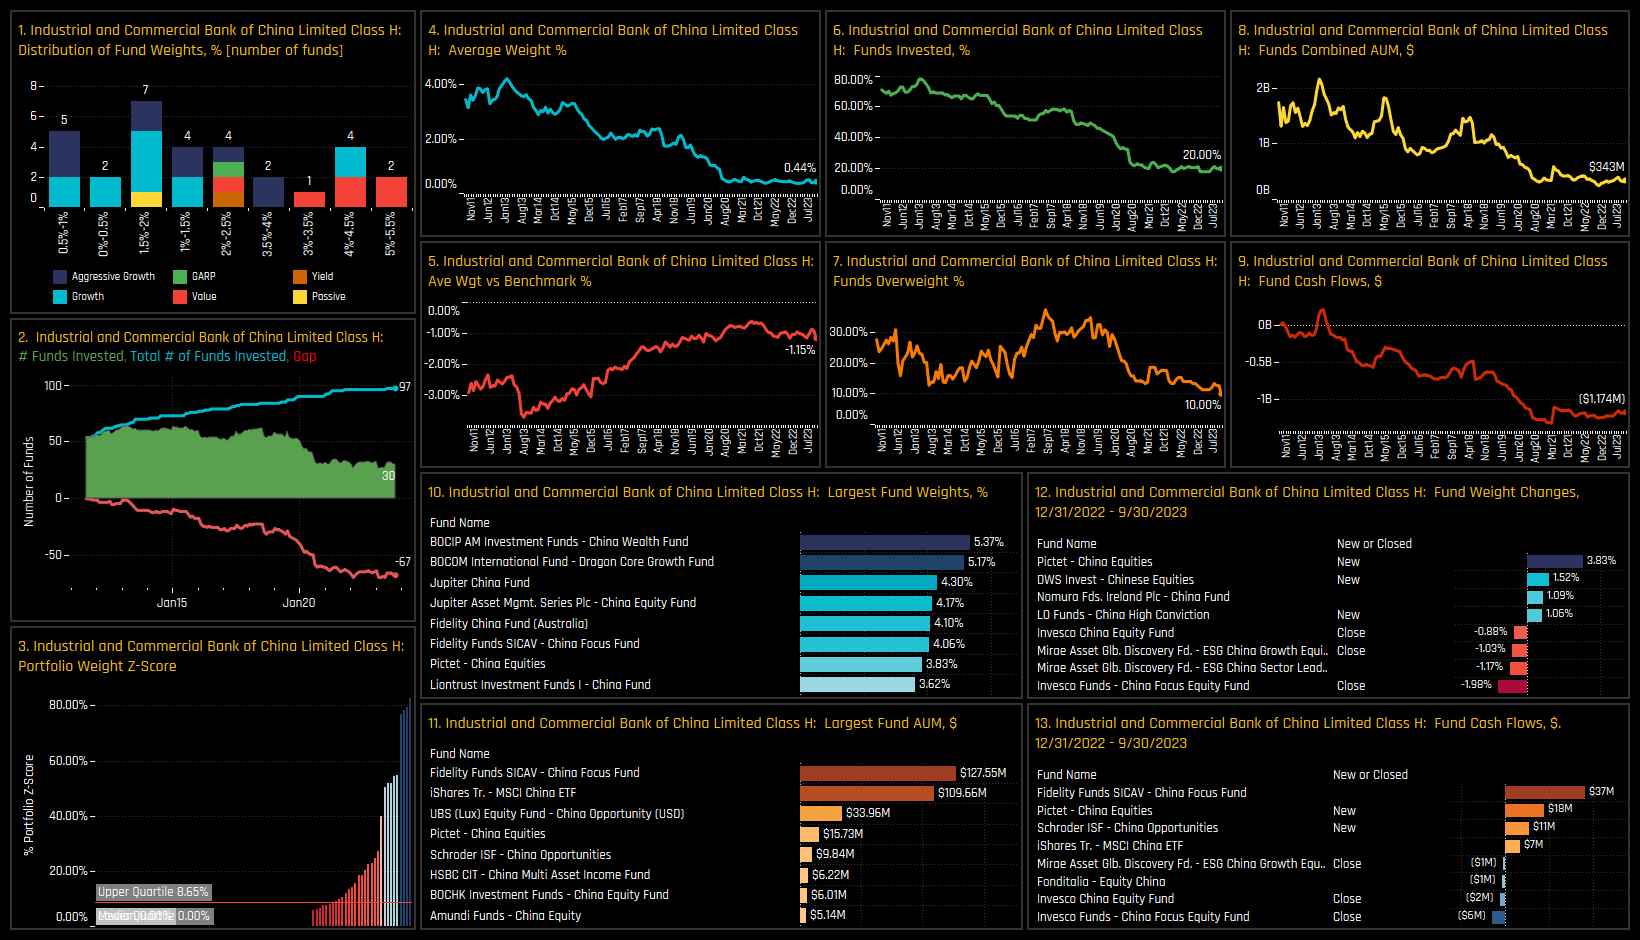
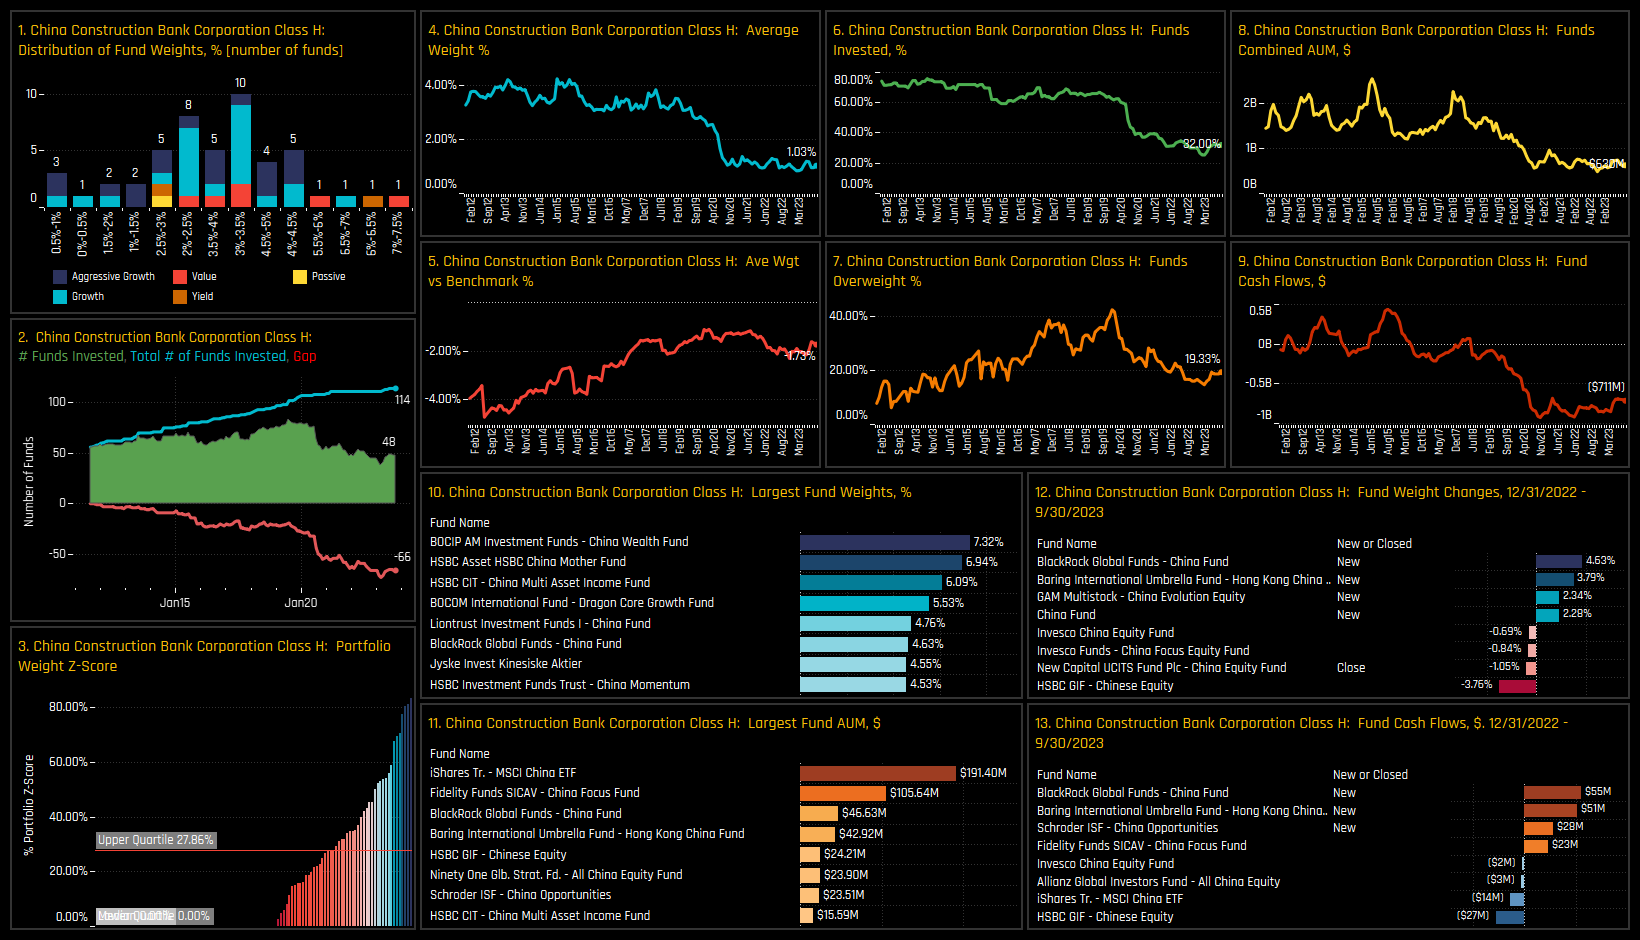
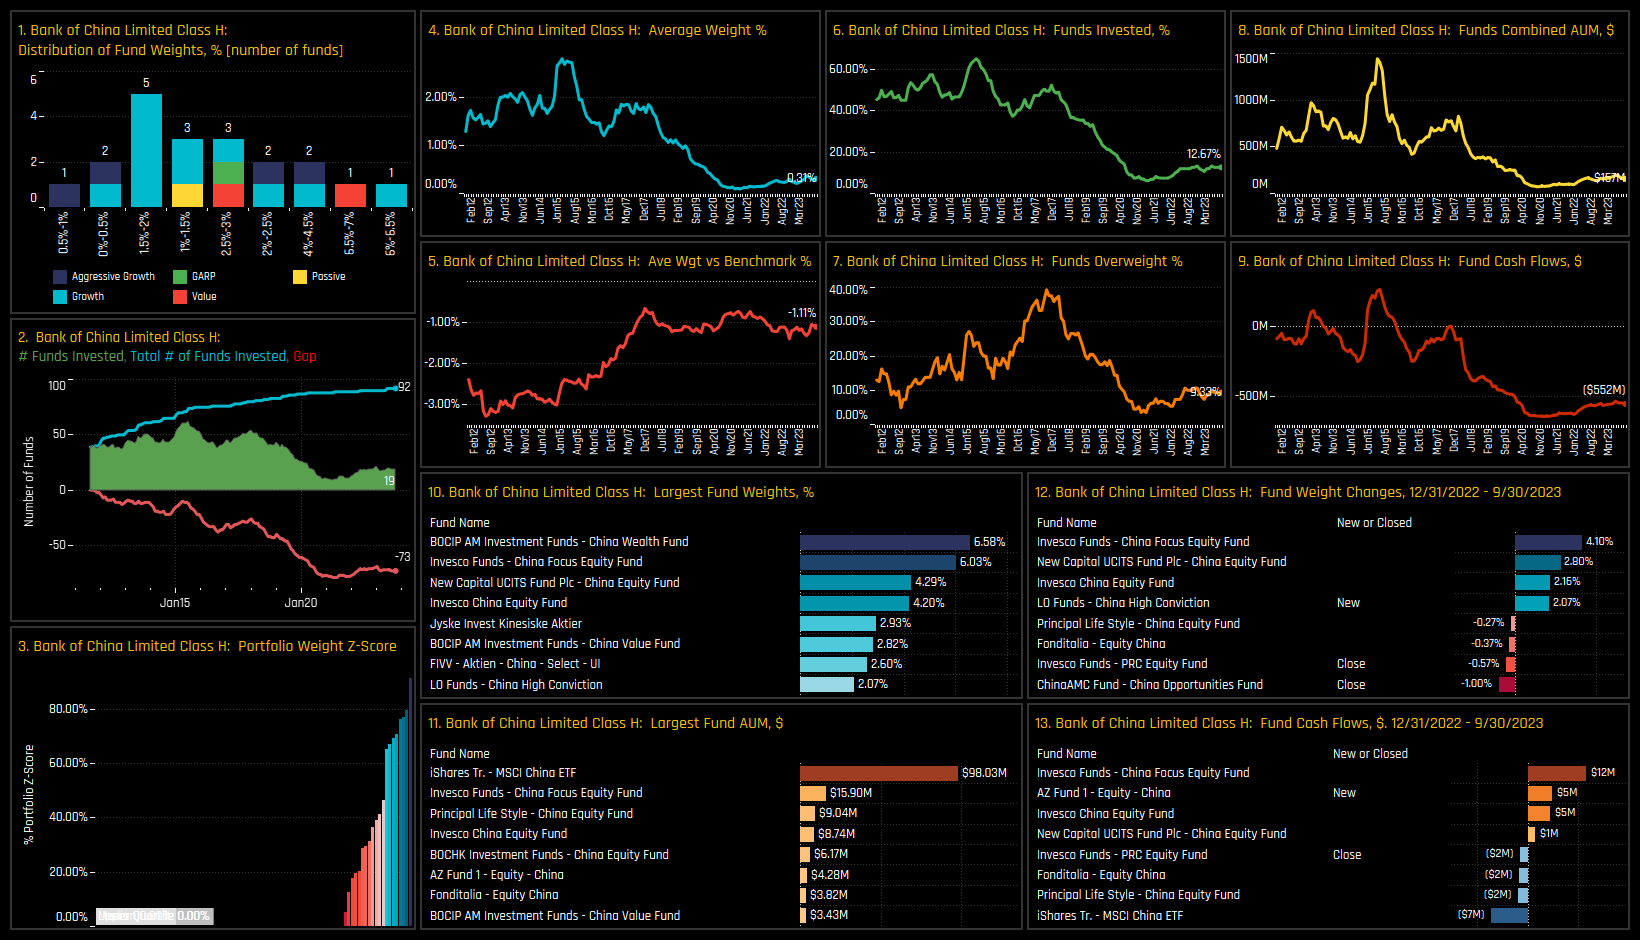
Ownership levels in Chinese Banking stocks are close to their lowest levels on record. The percentage of funds with Banks exposure has fallen to the bottom of the 10-year range at 76% (ch3). Average holding weights have remained stagnant between 4% and 7% since April 2020 and reside at the lower end of that range today (ch1). Versus the iShares MSCI China ETF, active China managers have always maintained an underweight in Banks (ch2), with that underweight reducing significantly due to the effect of falling absolute weights as seen in chart 1. However, on a pure fund level, just 11.3% of the 150 active funds in our analysis are positioned overweight China Banks (ch4).
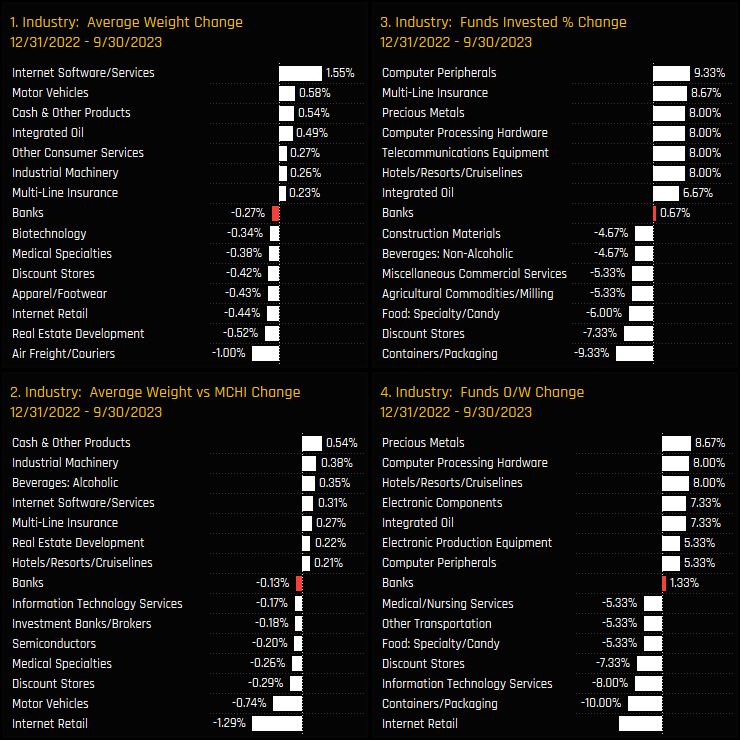
Through the course of 2023 a sense of stagnation in China Banks exposure is evident. The charts below show the aggregate ownership changes for all Industries between 12/31/2022 and 09/30/2023. China Banks saw moderate decreases in average weight, a small drop in the percentage of funds invested but a small rise in the percentage of funds positioned overweight. Taken positively, at least China Banks exposure appears to be consolidating around these levels, though there are few signs of any real change in sentiment to the upside.
Industry Positioning & Sentiment
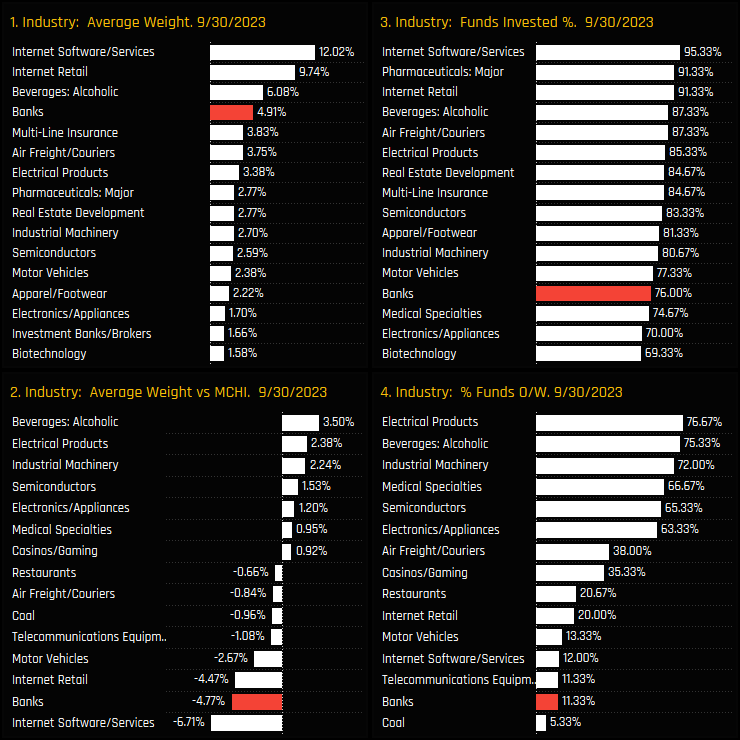
China Banks now stand as the 4th largest average Industry weight but the 13th most widely held, a set up that infers those that do hold exposure do so in decent size. Versus the benchmark, China Banks are the 2nd largest underweight Industry position after Internet Software/Services. They key overweights are in Alcoholic Beverages and Electrical Products, with over three quarters of managers overweight in each.
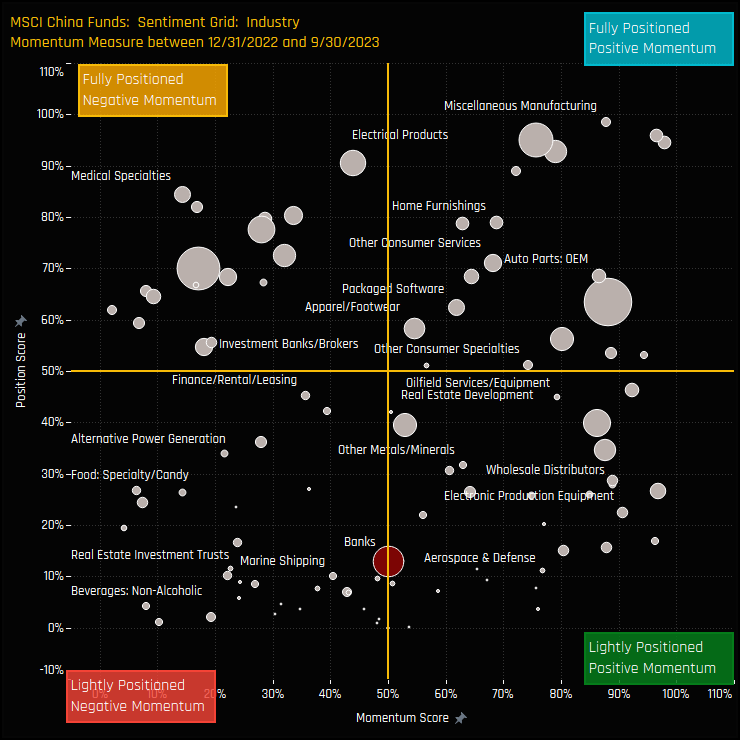
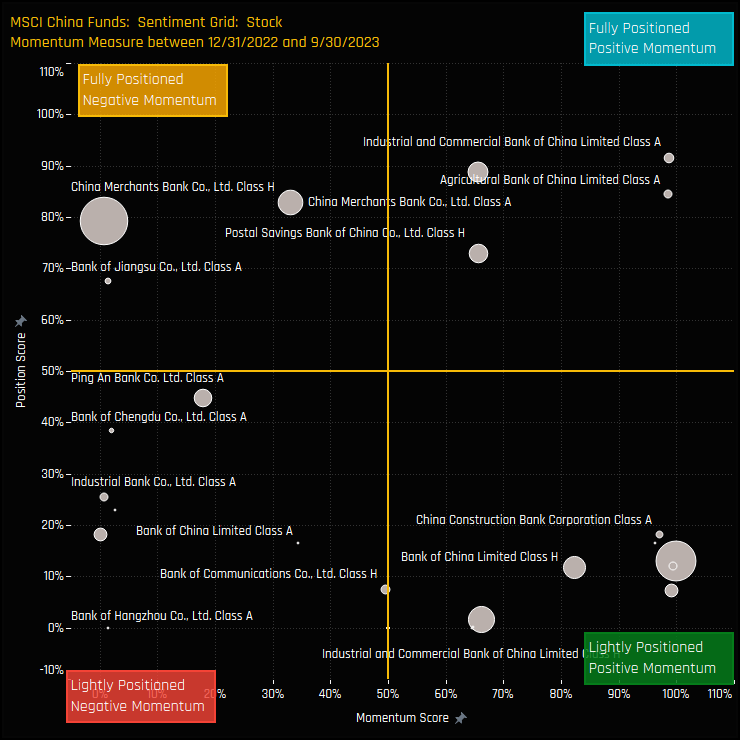
The Sentiment Grid below brings long-term positioning and short term manager activity together in a single chart. The Y-axis shows the ‘Position Score’, a measure of current positioning in each Industry compared to its own history going back to 2011 on a scale of 0-100%. The X-Axis shows the ‘Momentum Score’, a measure of fund manager activity for each Industry between 12/31/2022 and 09/30/2023 on a scale of 0% (maximum negative activity) to 100% (maximum positive activity). It highlights the Banks Industry group as poorly positioned compared to its own history, with momentum showing no strong signs in either direction.
Fund Holdings & Activity
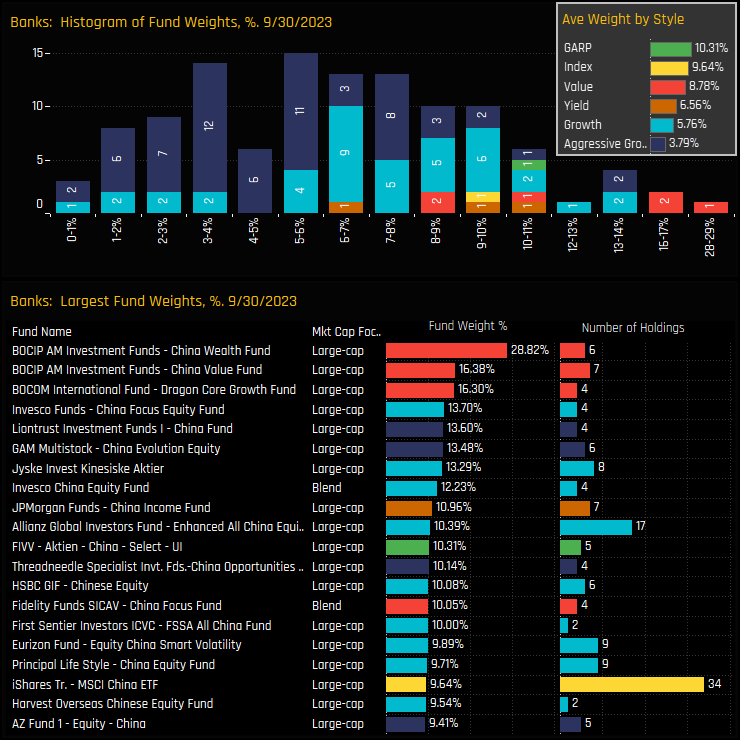
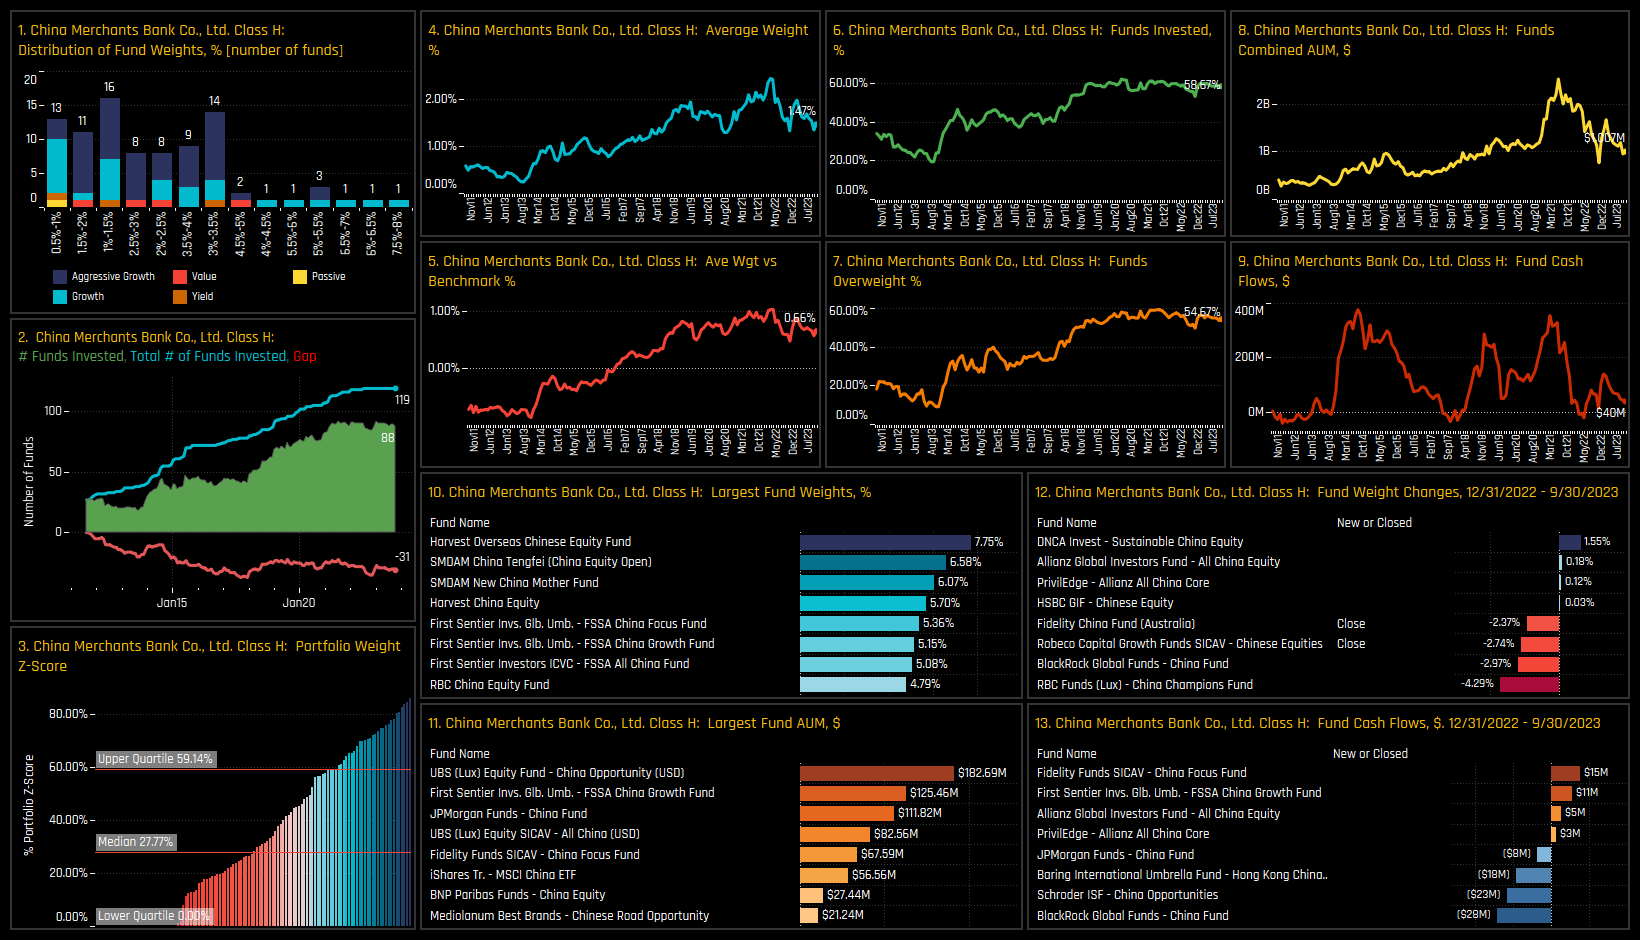
The top chart below shows the histogram of fund holdings in the Banks industry group and the inset chart the average weight by fund Style. Allocations are spread over a wide range, with a good number of funds holding between a 2% and 11% weight, and with exposure largely correlated to Style (Value over Growth). Fund allocations top out at 28.8% for BOCIP China Wealth, with Invesco and Liontrust among the largest non-domestic allocators.
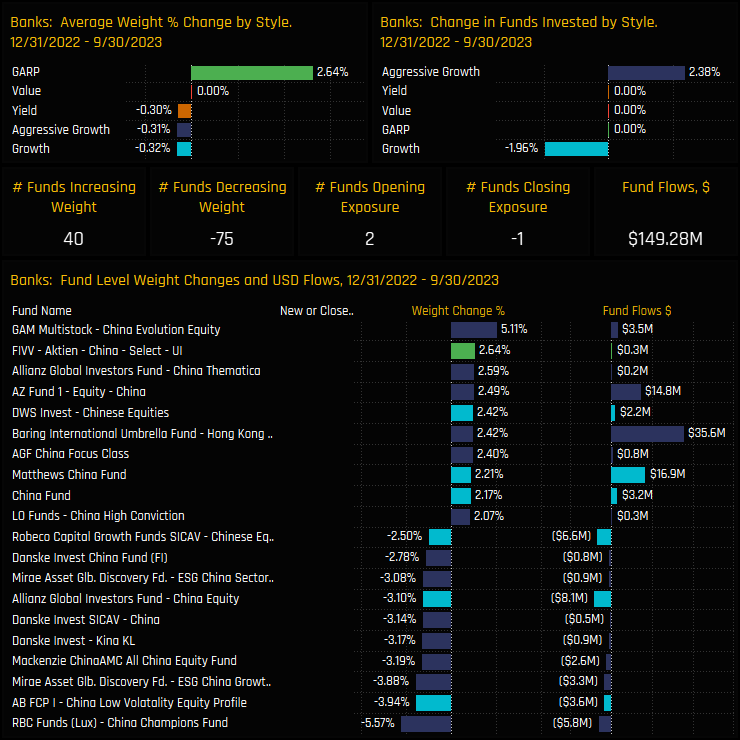
Fund activity through the course of the year shows a slight negative skew, but activity was fairly well balanced between managers. Weight increases from GAM China Evolution (+5.1) and FIVV China Select (+2.64%) were offset by decreases from RBC China Champions (-5.57%) and AB China Low Vol (-3.94%), among others. More funds decreased weight (-75) than increased (+40), but 2 funds opened exposure against 1 closure and net fund flows were positive at +$145m.
Stock Holdings & Activity
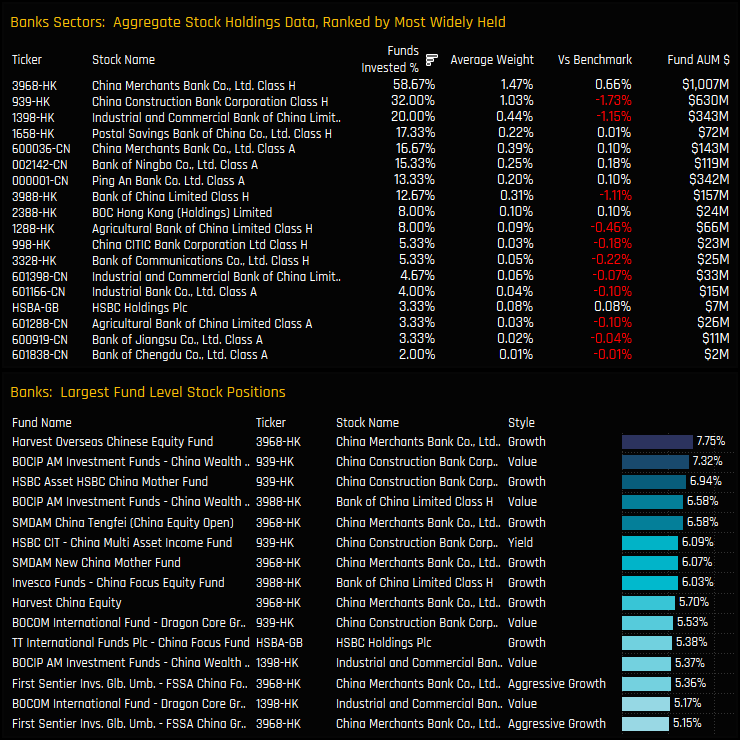
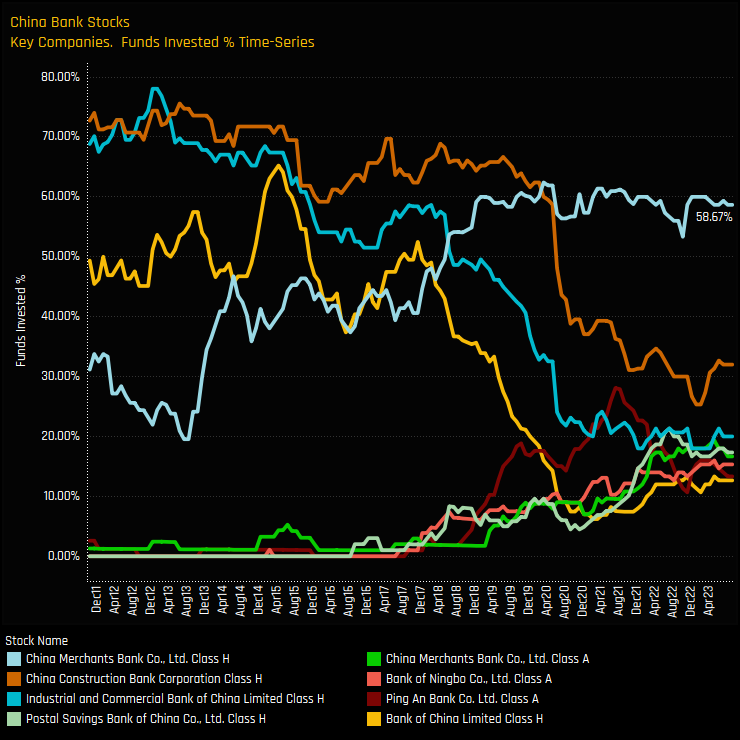
The most widely held stock in the China Banks industry group is China Merchants Bank, owned by 58.7% of funds at an average weight of 1.47%, or overweight the benchmark by +0.66%. China Construction Bank, ICBC and Bank Of China are all held underweight the iShares MSCI China ETF benchmark on average, and account for 4% of the total -4.77% underweight in the sector. High conviction fund level holdings in the bottom chart are dominated by outsized holdings in China Merchants Bank and China Construction Bank.
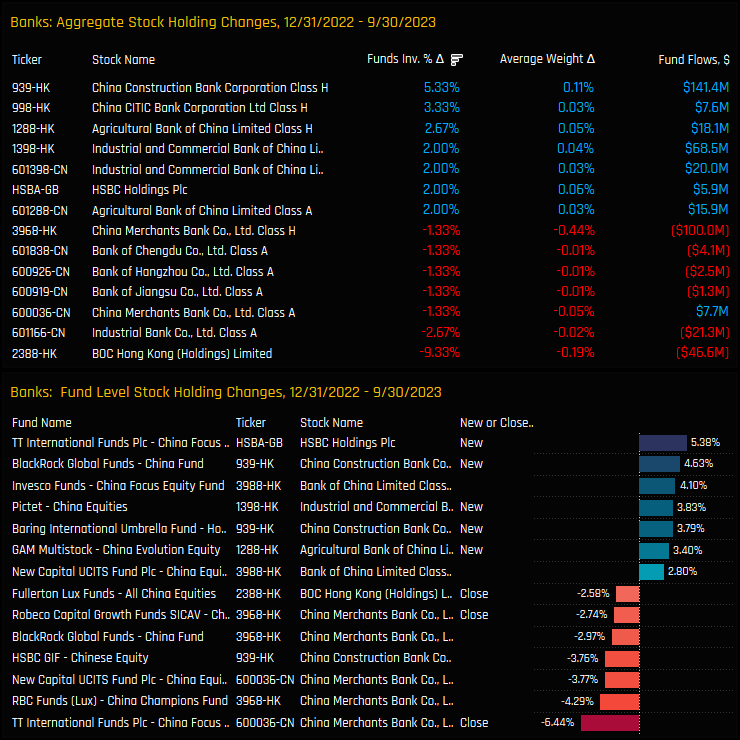
Stock level activity over the course of 2023 shows a strong degree of intra-industry rotation among the main China banks. BOC Hong Kong saw a 9.3% fall in the percentage of funds invested, whilst China Construction Bank and China CITIC Bank saw increases of +5.3% and +3.3% respectively. Note that the widely owned China Merchants Bank saw average weights fall by -0.44% following -$100m in fund outflows.
Stock Ownership Trends & Sentiment
The chart below tracks the percentage of funds invested in each of the 8 most widely held Chinese Banks. It highlights how China Merchants Bank has come to dominate the picture in recent years, but investment levels appear to have hit resistance and are drifting lower. In contrast, China Construction Bank, ICBC and Bank of China, who all witnessed steep declines in ownership between 2017 and 2020 are starting to see ownership levels climb from the lows.
The Sentiment Grid below shows China Bank positioning and momentum for all major holdings. It confirms what we are seeing in the time series charts, with China Merchants Bank towards the top end of it’s position range but with momentum skewed to the sell-side. In contrast, ICBC, Bank of China and China Construction Bank are at low levels of positioning compared to their own history, but have all seen momentum swing to the buy-side.
Conclusions & Links
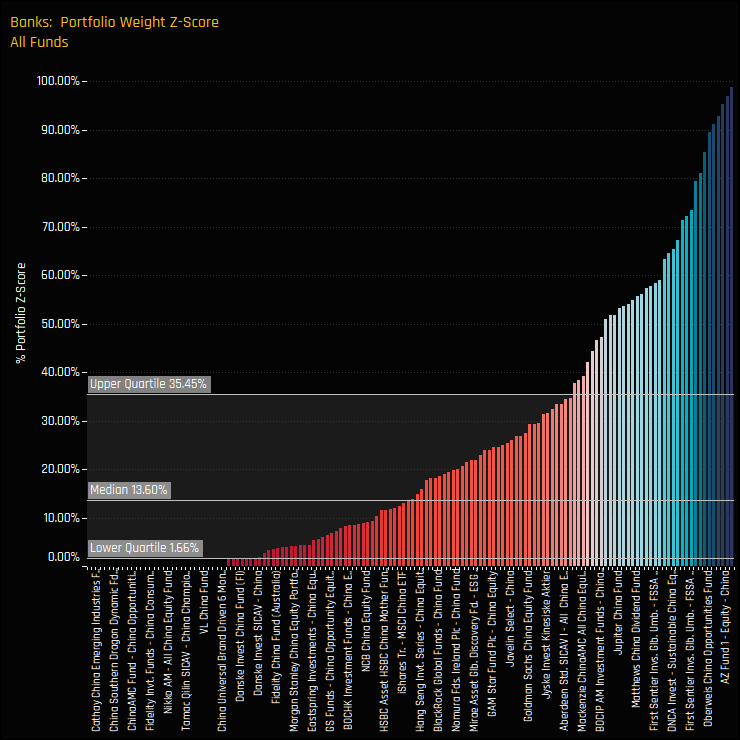
The chart to the right shows the Z-Score of China Banks positioning for all 150 funds in our MSCI China analysis. A score of 0% indicates that today’s weight in China Banks is at its lowest level for that fund, a score of 100% the highest ever level. The median Z-Score of 13.6% shows just how depressed positioning is compared to each fund’s history, with 75% of funds showing a Z-Score of less than 35.5%.
As it stands then, positioning in China Banks looks fairly negative. The vast majority of funds are positioned for underperformance and outright exposure is hovering around the lowest levels on record. On the positive side, it does appear that the aggressive selling has come to an end with a mixture of buying and selling among funds this year. Selected managers are clearly becoming more constructive.
Within the China Banks industry group, stock level positioning is getting interesting. The widely owned China Merchants Bank is coming up against resistance, with funds such as TT International, RBC, BlackRock and New Capital either closing or heavily reducing exposure. In its place, the trio of China Construction Bank, ICBC and Bank of China appear to be at the start of an ownership revival.
Click below for the extended data report on China Banks investor positioning. Scroll down for stock profiles on China Merchants Bank, China Construction Bank, ICBC and Bank of China.
Stock Profile: Industrial & Commercial Bank of China Class H
Stock Profile: China Construction Bank Class H
Stock Profile: Bank of China
150 Active MSCI China Funds, AUM $47bn
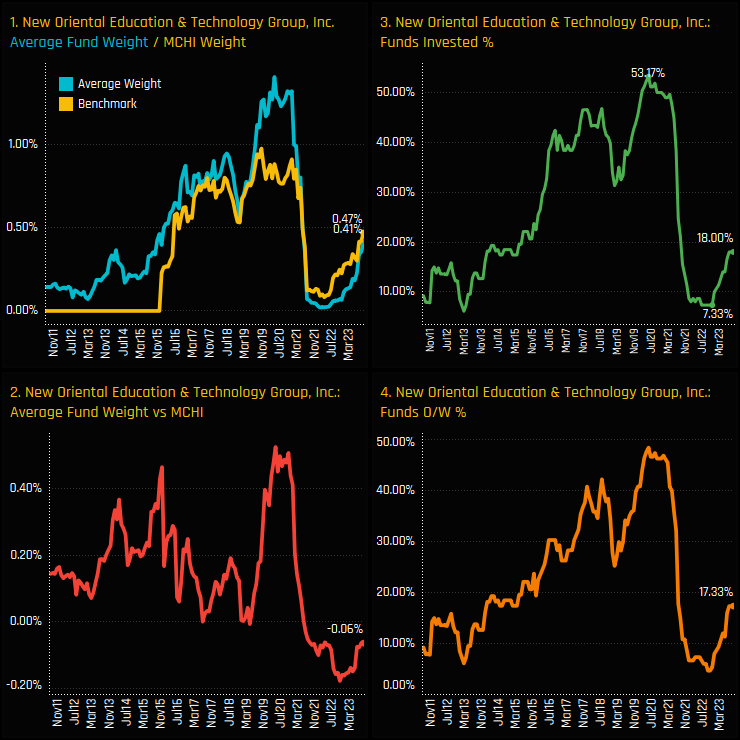
New Oriental Education & Technology: Back From the Dead
• MSCI China Funds are starting to engage with New Oriental Education after a big exodus in 2021 following China’s Tech Crackdown.
• Since the lows of 2022, New Oriental Education has been one of the key beneficiaries of active fund rotation
• Previous holders such as HSBC, Mirae and BlackRock have bought back in after closing out in 2021, but there is still a long way to go for New Oriental to reclaim its place as a key Consumer Discretionary holding
Time-Series & Stock Level Activity
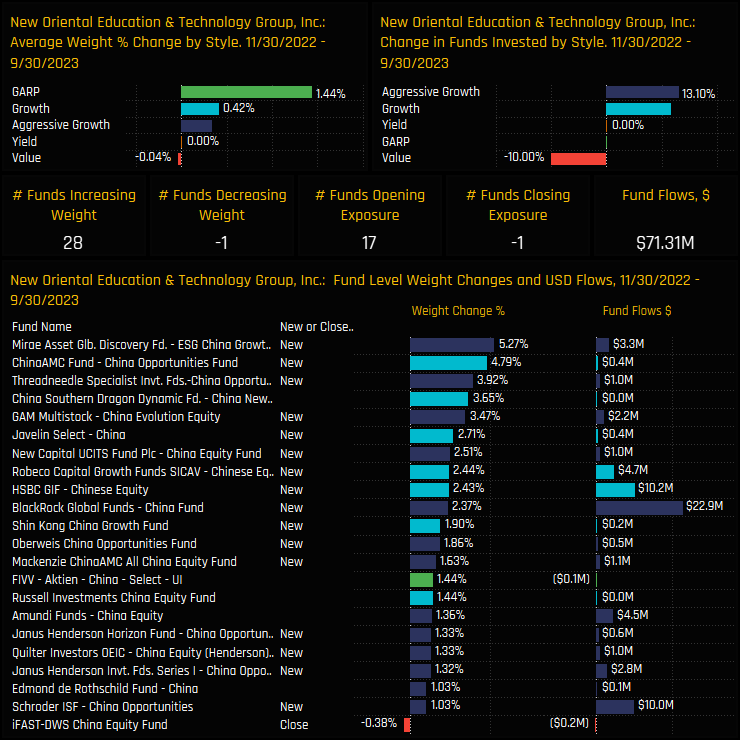
MSCI China active funds are starting to engage with New Oriental Education & Technology Group after an almost universal exodus in 2021. Heavily effected by the ‘China Tech Crackdown’ of the same year, New Oriental saw the percentage of funds invested fall from a peak of 53.2% of funds back in May 2020 to a low of 7.3% in November of last year (ch2). Since then, the percentage of funds invested in New Oriental has moved higher to 18% in conjunction with a rise in the average holding weight, shown in chart 1.
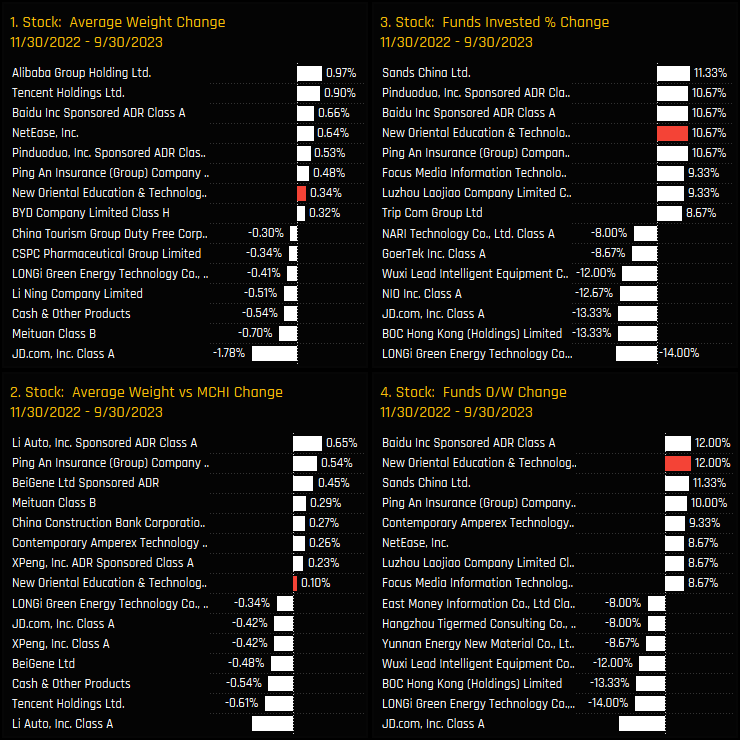
The charts below show the aggregate ownership changes for all Chinese companies between the lows of 11/30/2022 and 09/31/2023. New Oriental Education & Technology was one of the key beneficiaries of rotation alongside Sands China, Baidu Inc and Pinduoduo Inc. All 4 of our ownership metrics moved higher, indicative of the active nature of the rotation. The investment case has clearly taken a turn for the better.
Then versus Now
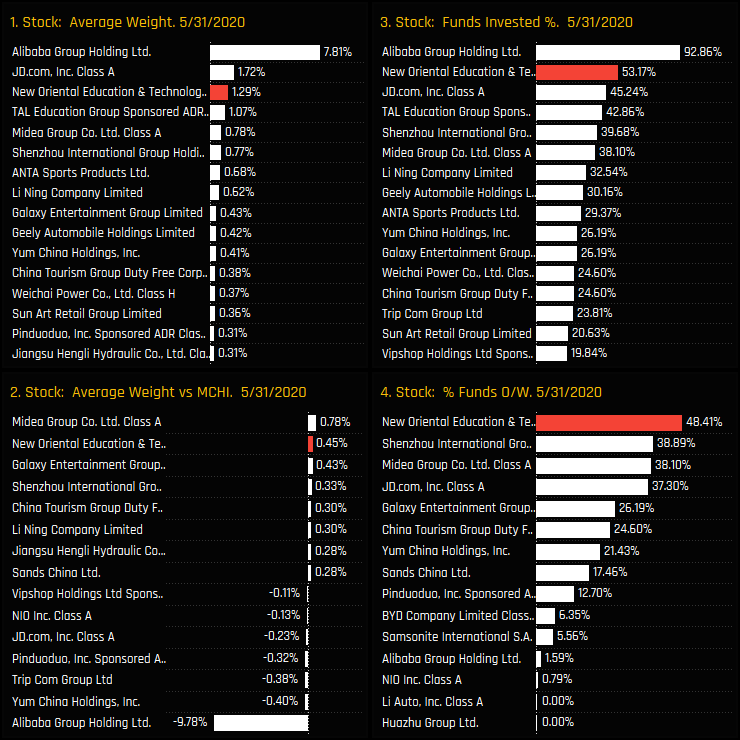
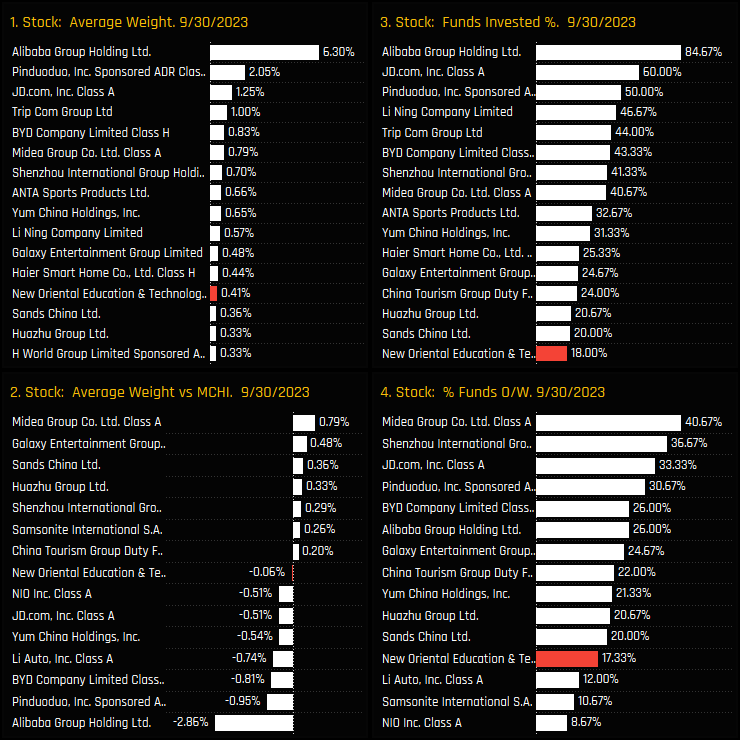
The below charts show our ownership metrics for stocks in the Consumer Discretionary sector both at the highs of 05/31/2020 and the end of last month. New Oriental was the 2nd most widely held Consumer Discretionary stock after Alibaba Group Holdings at its peak, with no other company held overweight by more funds. Fast forward to today and New Oriental is almost a rounding error, with Pinduoduo rising from a fringe holding to the 3rd most widely held Consumer Discretionary stock, and Alibaba and JD.Com still among the top holdings.
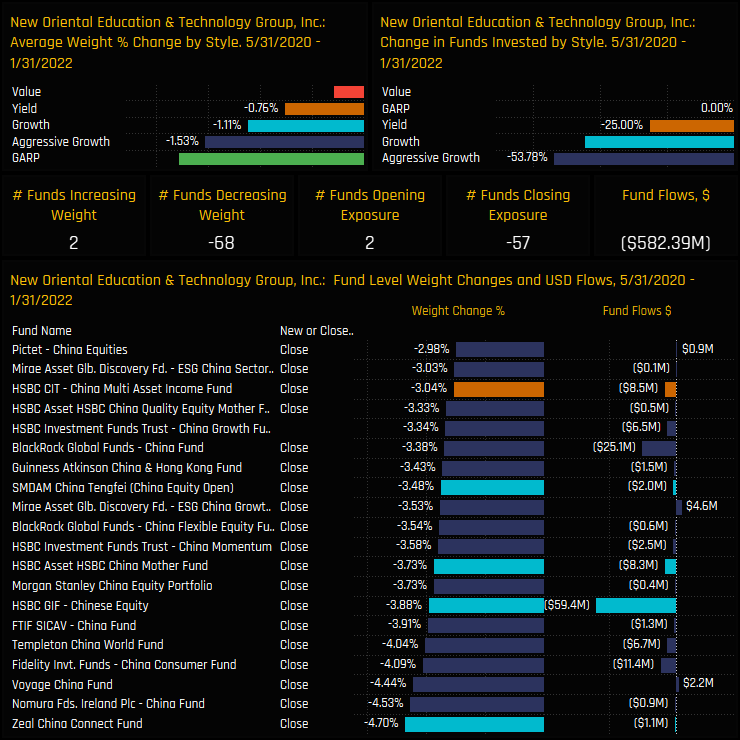
The Fall and Rise
The below charts show the aggregate Style level changes and the fund level activity, both for the period of decline between 05/31/2020 – 01/31/2022 (left chart) and the recent rally between 11/30/2022 and 09/30/2023 (right hand chart). The extent of the exodus is clear to see in the left hand charts, with 57 funds closing positions entirely and $582m in net fund outflows. The positive fund activity in the right hand charts is smaller in magnitude, but show selected managers such as Mirae, HSBC and BlackRock who closed out during the initial phase now buying back in.
Conclusions & Data Report
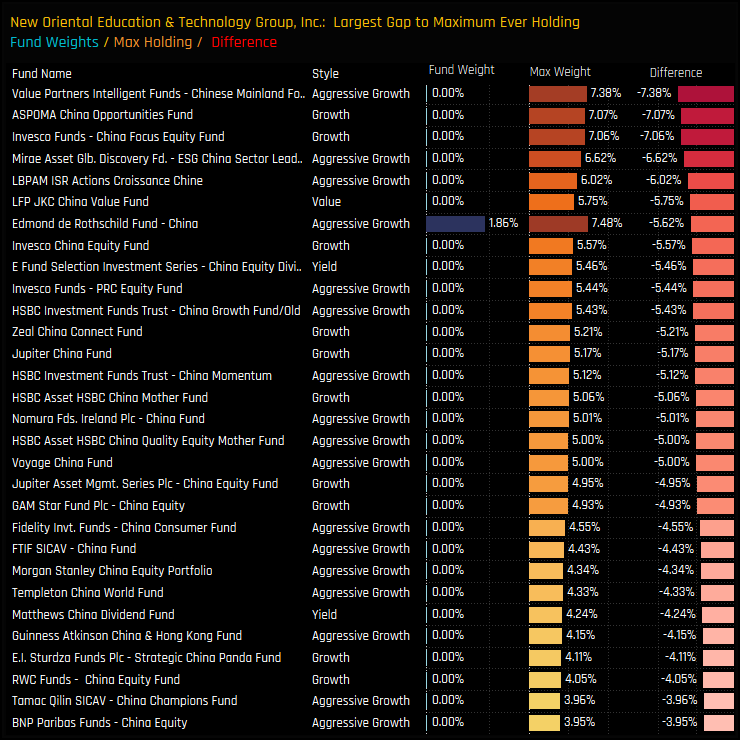
But this buy back is only in its early stages. The chart to the right shows the funds with the largest gaps to their largest ever fund weight in New Oriental Education & Technology. China Funds from Value Partners, Invesco, Mirae and HSBC have a history of ownership in New Oriental and in good size, but who remain on the sidelines for now.
There is a long road ahead for New Oriental Education & Technology to reach the ownership highs of 2021, but it appears they are on the right path.
Click on the link below for an extended report on positioning in New Oriental among the active China funds in our analysis.
The latest data on aggregate stock level holdings, fund level stock holdings and activity over the last 6-months.
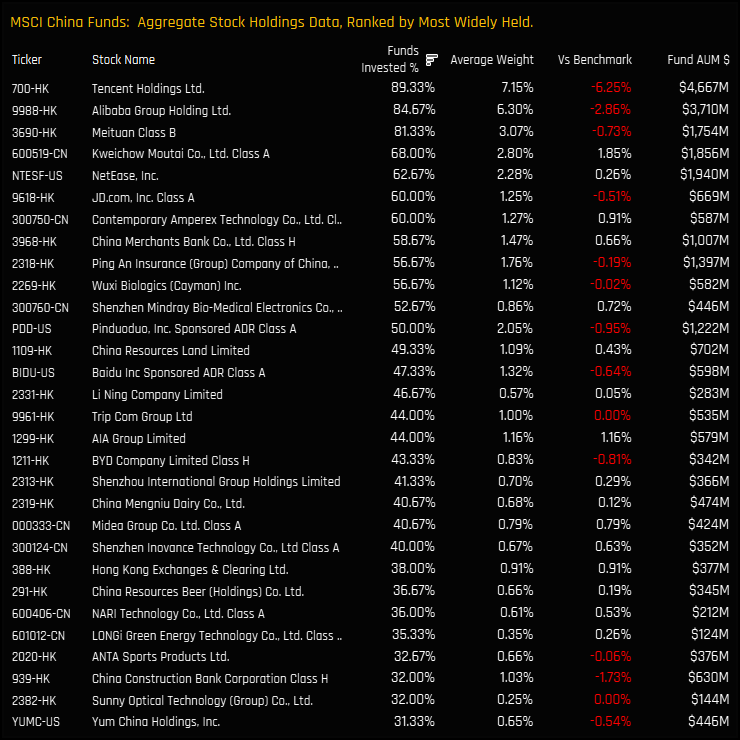
Most Widely Held Stocks
The 30 most widely held stocks among MSCI China active equity funds
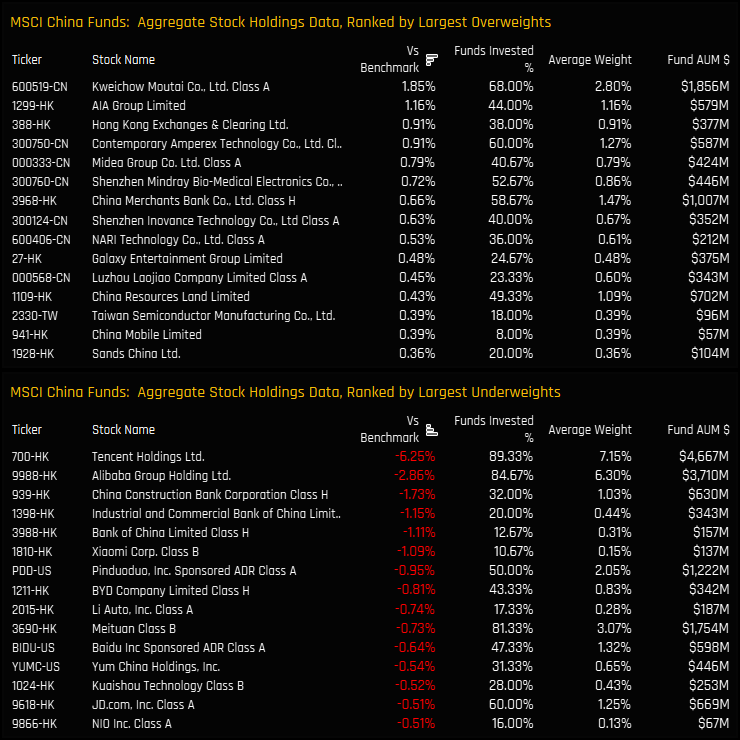
Top Over/Underweights
The top 15 aggregate overweight and underweight stock holdings versus the iShares MSCI China ETF
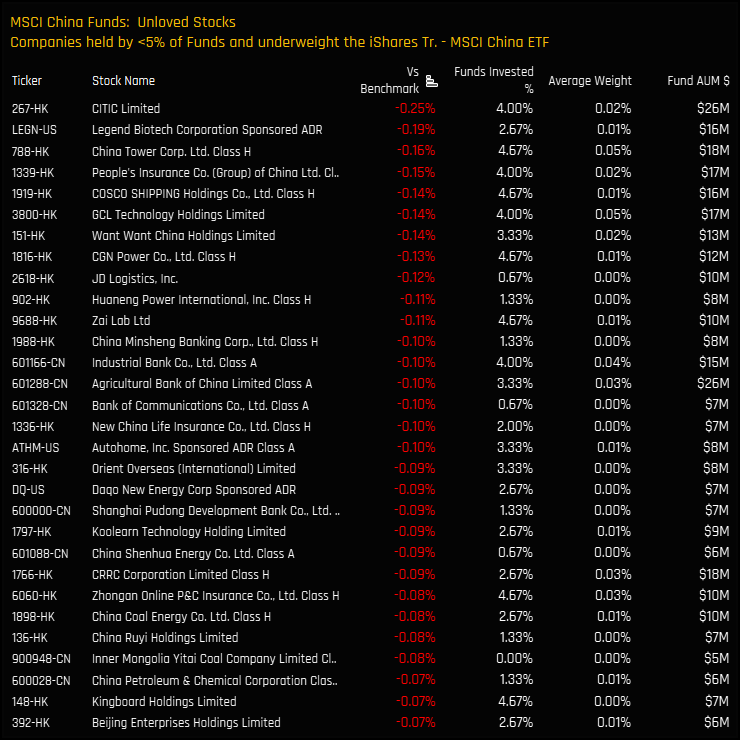
Unloved Stocks
Stocks held by less than 5% of the MSCI China Funds in our analysis, and net underweight vs the iShares MSCI China ETF (cash component removed and stock weights adjusted)
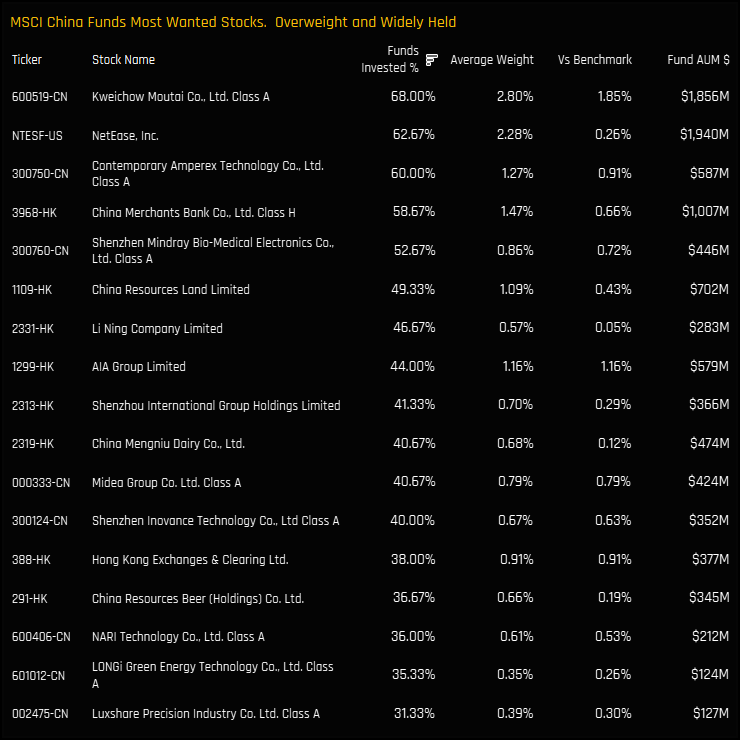
Most Wanted Stocks
Stocks held by more than 30% of the MSCI China Funds in our analysis, and net overweight vs the iShares MSCI China ETF
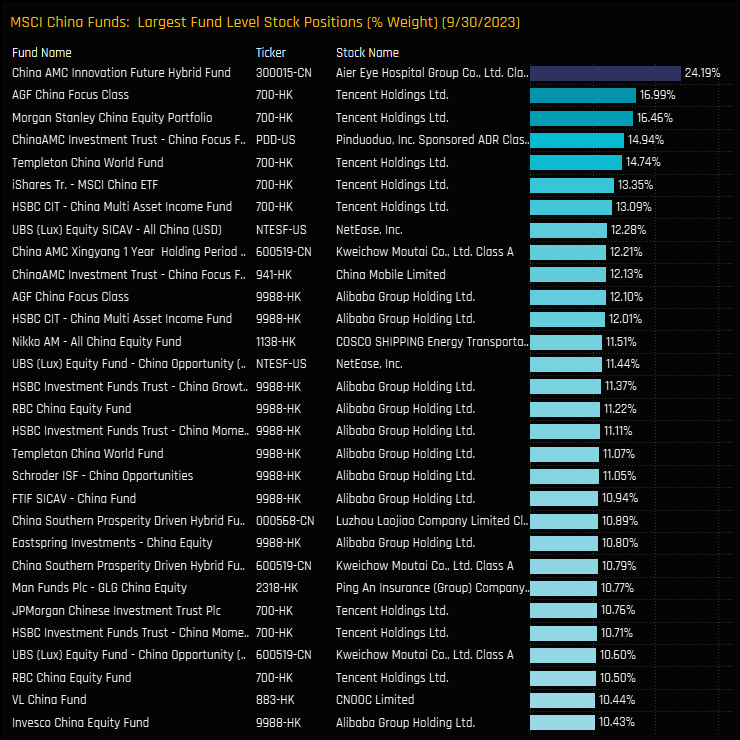
Largest Fund Level Stock Positions, %
The top 30 largest individual fund level stock positions on a portfolio weight basis.
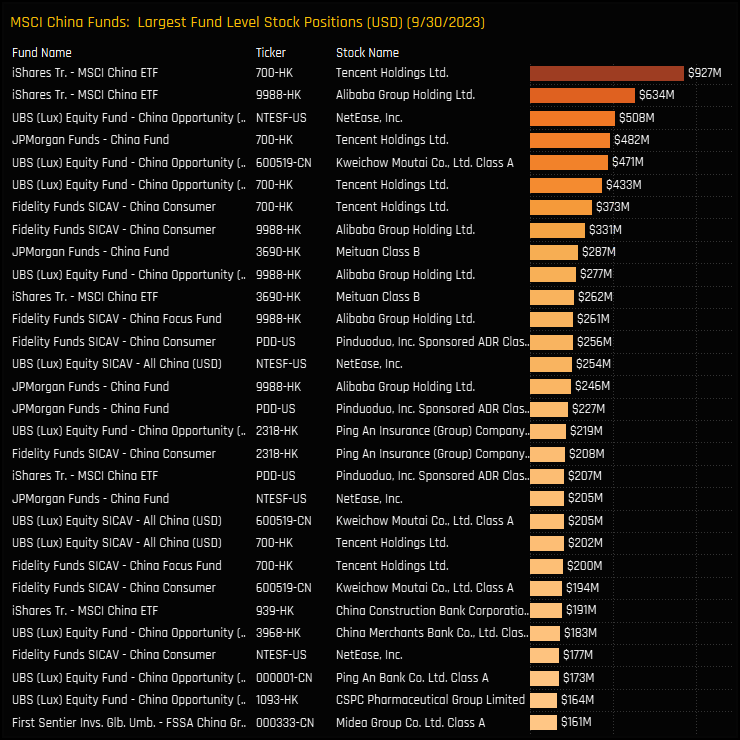
Largest Fund Level Stock Positions, $
The top 30 largest individual fund level stock positions on a fund AUM basis.
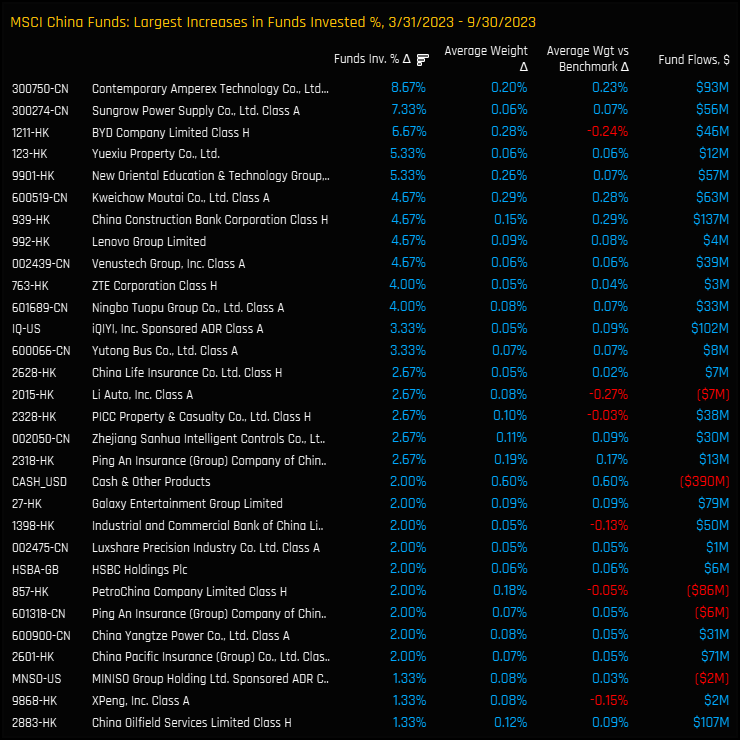
Largest Ownership Increases
The stocks with the largest net increase in the percentage of funds invested between 03/31/2023 and 09/30/2023
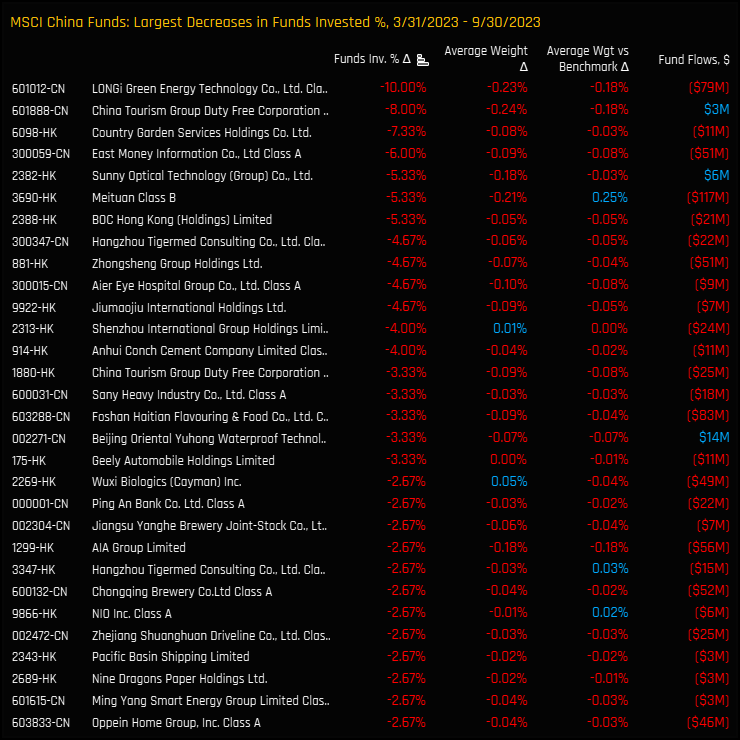
Largest Ownership Decreases
The stocks with the largest net decrease in the percentage of funds invested between 03/31/2023 and 09/30/2023
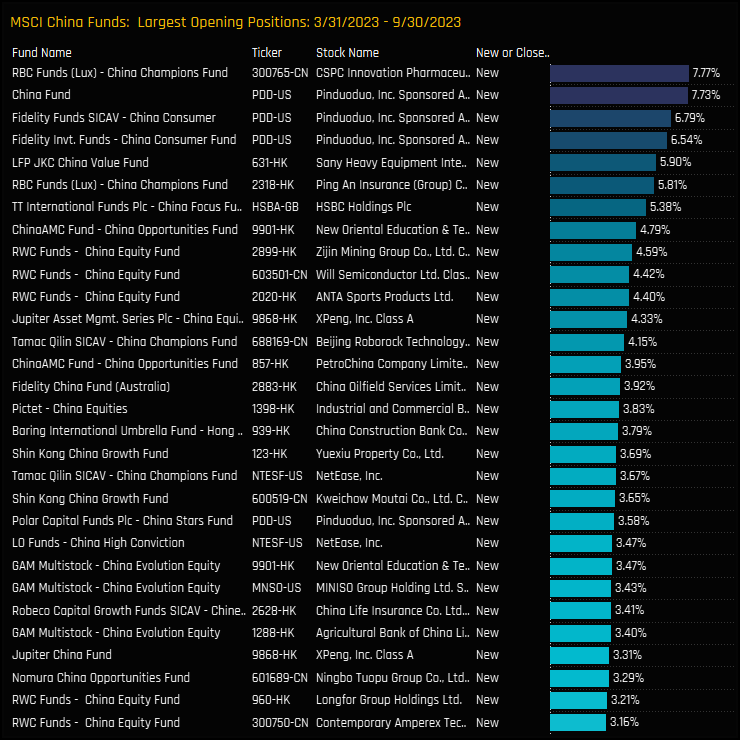
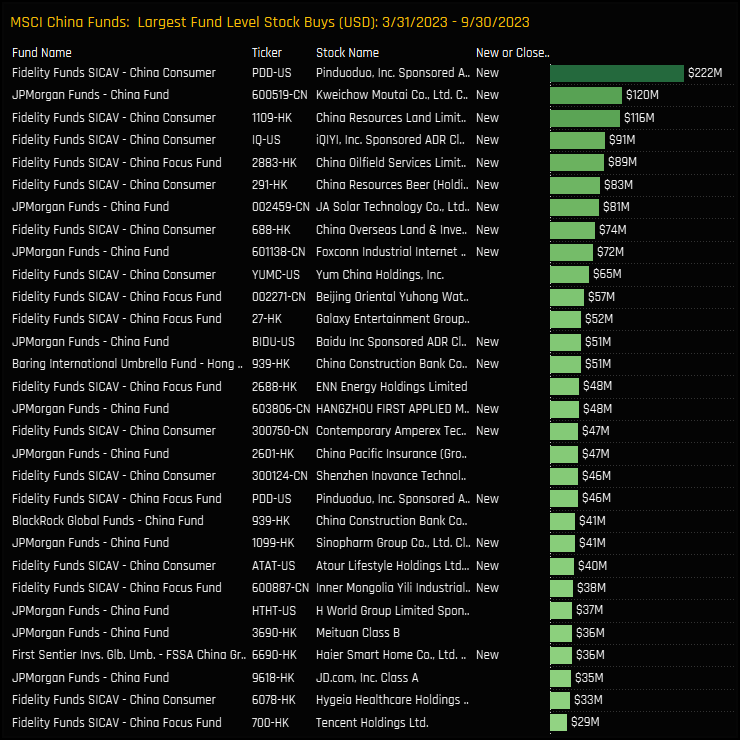
Largest Opening Positions
The largest opening stock positions between 03/31/2023 and 09/30/2023
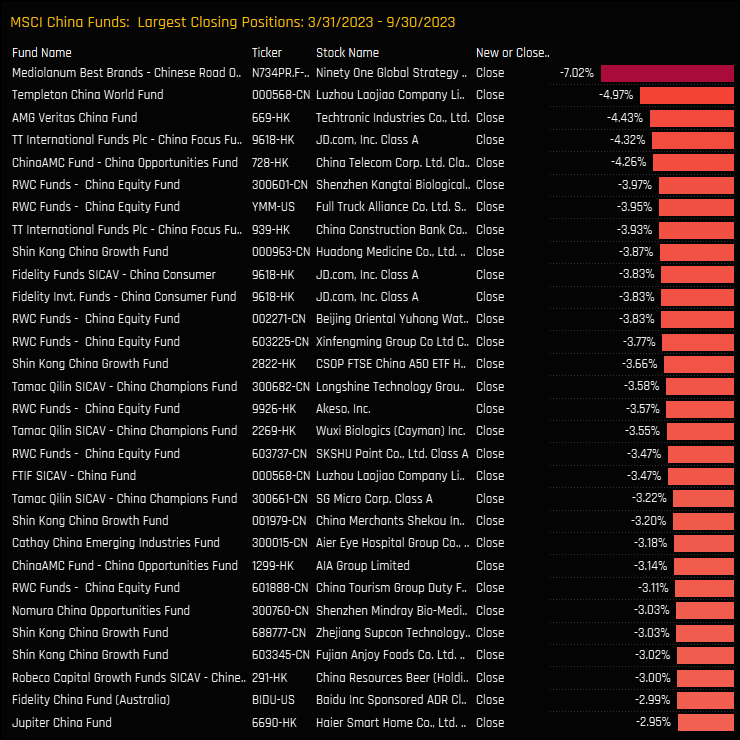
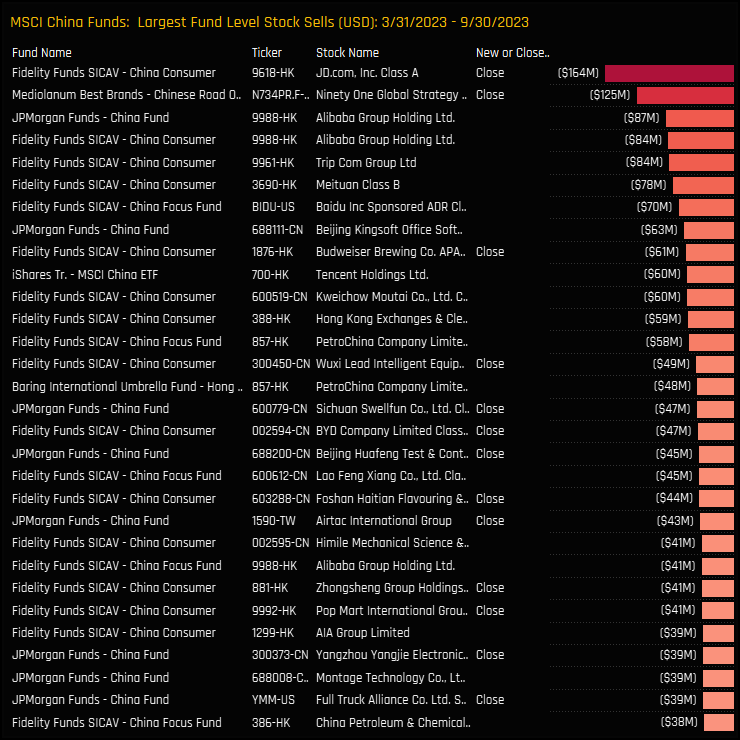
Largest Closing Positions
The largest closing stock positions between 03/31/2023 and 09/30/2023
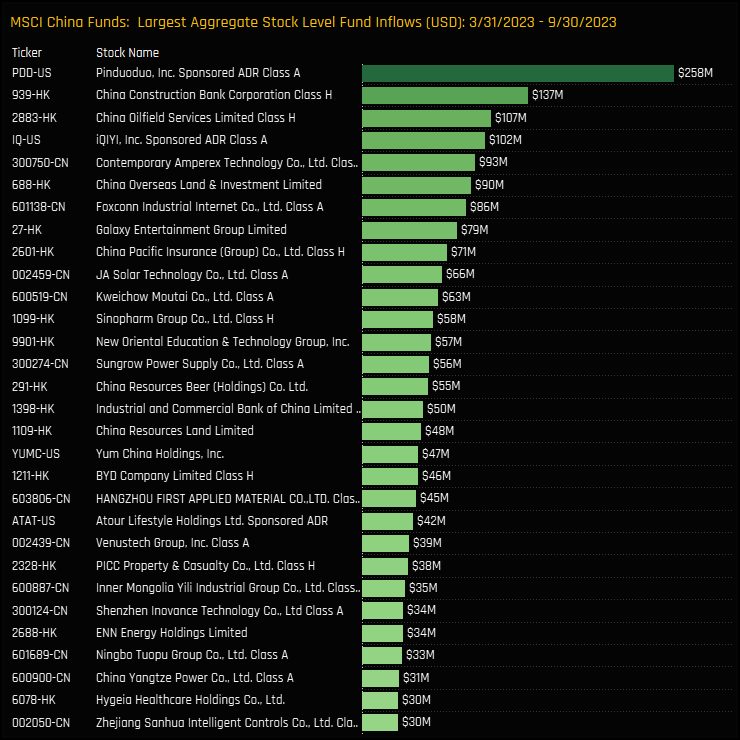
Largest Stock Inflows, $
The largest combined fund inflows on a stock level between 03/31/2023 and 09/30/2023
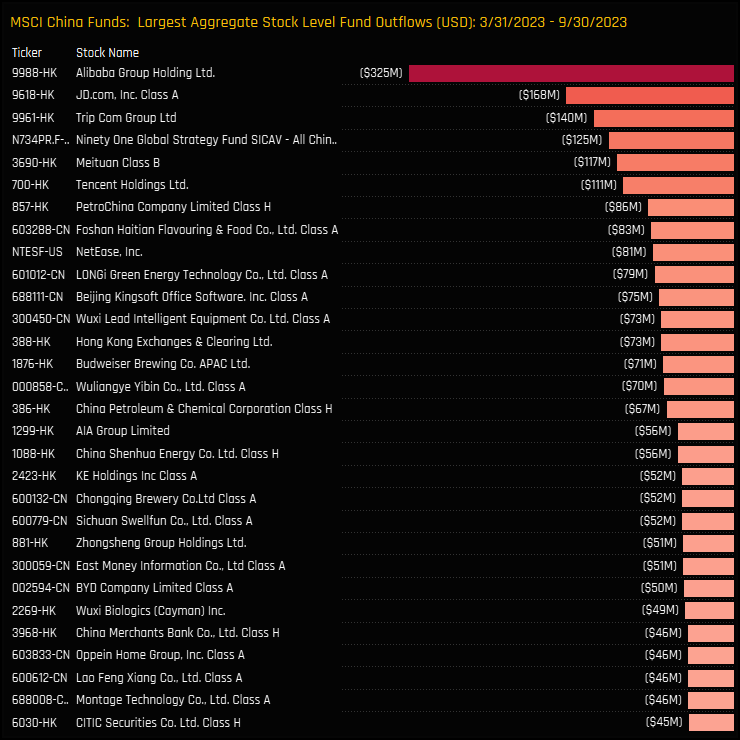
Largest Stock Outflows, $
The largest combined fund outflows on a stock level between 03/31/2023 and 09/30/2023
Largest Fund Level Stock Inflows, $
The largest fund level stock inflows between 03/31/2023 and 09/30/2023
Largest Fund Level Stock Outflows, $
The largest fund level stock outflows between 03/31/2023 and 09/30/2023
150 Active MSCI China Funds, AUM $47bn
China Active Funds Ownership Report
Please click on the link below for the full data report on MSCI China active fund positioning
For more analysis, data or information on active investor positioning in your market, please get in touch with me on steven.holden@copleyfundresearch.com
Investor Positioning Report — Copley Fund Research Ltd · Last updated: July 2026 · Registered in England and Wales
1. Who we are
Copley Fund Research Ltd provides proprietary institutional fund intelligence to listed companies and investor relations professionals. These terms govern every purchase of an Investor Positioning Report. By completing a purchase you confirm you have read, understood, and agreed to these terms in full.
2. What you are purchasing
The Investor Positioning Report is a bespoke PDF report mapping the institutional fund universe around your stock. It covers current investors, past investors, competitor investors, and white space investors. Every report is built from scratch for the specific company ordered and is not a standardised or templated product.
3. Delivery and process
Following payment or invoice issuance, Copley Fund Research will contact you within one working day to agree your competitor set. Production begins once the competitor set is confirmed in writing. The completed report will be released to you within 48 hours of production starting, provided payment has been received in full; where payment is outstanding, the report will be withheld until payment clears. If the requested company falls outside our covered fund universes, or a competitor set cannot be agreed, Copley Fund Research will issue a full refund or cancel the outstanding invoice.
4. Competitor set agreement
The competitor set is agreed with you in writing prior to production, and the report is built to that agreed specification. Requests to amend the competitor set after delivery, based on a change of preference rather than an error, may be treated as a new order.
5. Refund policy
Because each report is produced individually for your company, orders are non-refundable once production has begun, except as set out in clauses 3 and 5a below. By purchasing, you agree not to dispute the charge with your card provider on the basis that the service was not as described, provided the report has been delivered to the agreed specification or corrected under clause 5a.
5a. Quality remedy
If a delivered report contains a material error caused by Copley Fund Research — for example, an incorrect company analysed, a competitor omitted from the agreed set, or content missing from the specification in clause 2 — Copley Fund Research will correct and redeliver the report at no additional charge, within a reasonable timeframe. This is your sole remedy for such errors.
6. Data and accuracy
All fund positioning data in the report reflects holdings as disclosed at the most recently available reporting date at the time of compilation. The timing of fund holdings disclosures is determined by regulatory requirements applicable to each fund and is outside the control of Copley Fund Research Ltd. This data may not reflect current fund positions. Copley Fund Research takes reasonable care to ensure accuracy but makes no warranty, express or implied, as to the completeness or current accuracy of the underlying data — though this does not affect the quality remedy in clause 5a for errors in how that data was analysed or presented. Past fund positioning is not indicative of future fund behaviour or investment decisions.
7. Not investment advice
The Investor Positioning Report is produced for investor relations intelligence purposes only. It does not constitute investment advice, financial advice, or a recommendation to buy, hold, or sell any security. The data reflects historical fund positioning and must not be relied upon as a prediction of future fund behaviour or investment decisions. Copley Fund Research Ltd is not authorised or regulated by the Financial Conduct Authority for the provision of investment advice.
8. Permitted use and confidentiality
The report is licensed for internal use by the purchasing organisation only. You may share it with employees and directors of your organisation. You may not: reproduce, redistribute, publish, or resell the report or any part of it; share it with any third party outside your organisation without prior written consent; use the fund or portfolio manager names contained in the report to approach those individuals on behalf of Copley Fund Research or in a manner that could damage Copley Fund Research's relationships with those funds; or use the data for any purpose other than your own investor relations strategy. The data, analysis, and methodology contained in the report are the intellectual property of Copley


