In this issue:
EM Semiconductors Deep Dive
Saudi Aramco: Record Holdings
Emerging Markets Stock Positioning Update
371 emerging market Funds, AUM $385bn
EM Semiconductors Deep Dive
• Semiconductors are the 2nd largest industry allocation and the 6th largest overweight among EM active managers. However, the momentum witnessed between 2019 and 2021 has stalled.
• EM Growth funds remain overweight, but Value and GARP funds switch from an equal weight to an underweight.
• Taiwanese Semiconductor companies dominates country-level allocations, though sizeable outward rotation from China & HK Semiconductor exposure is the standout move.
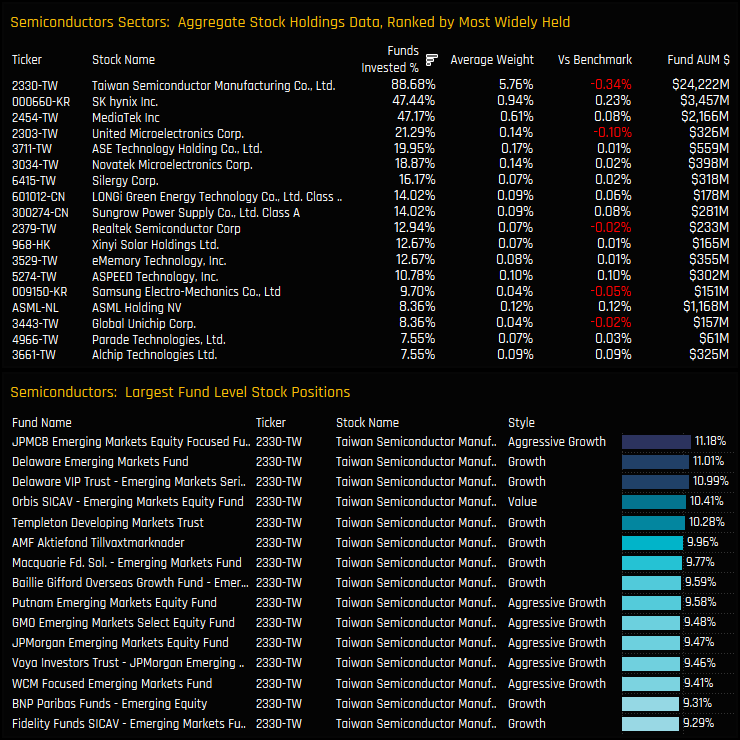
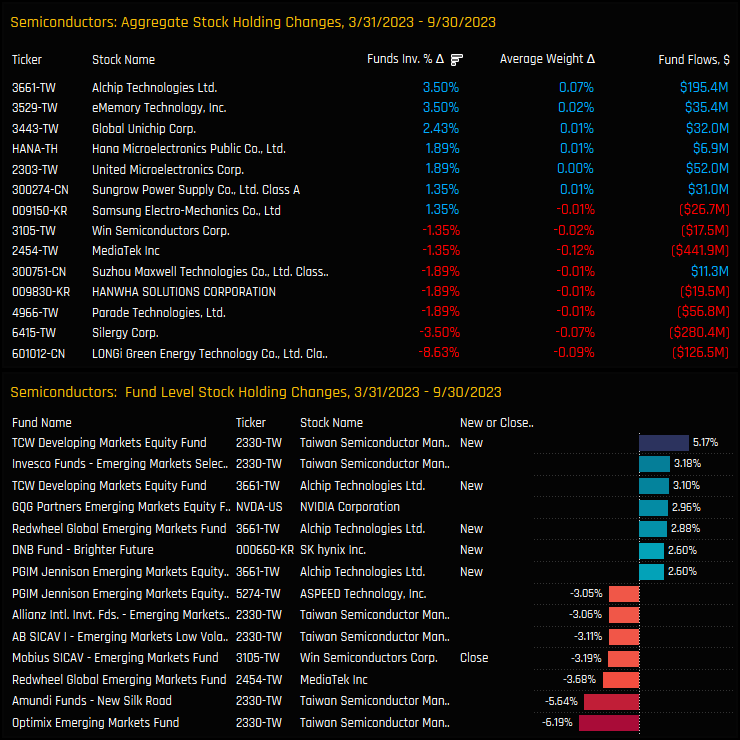
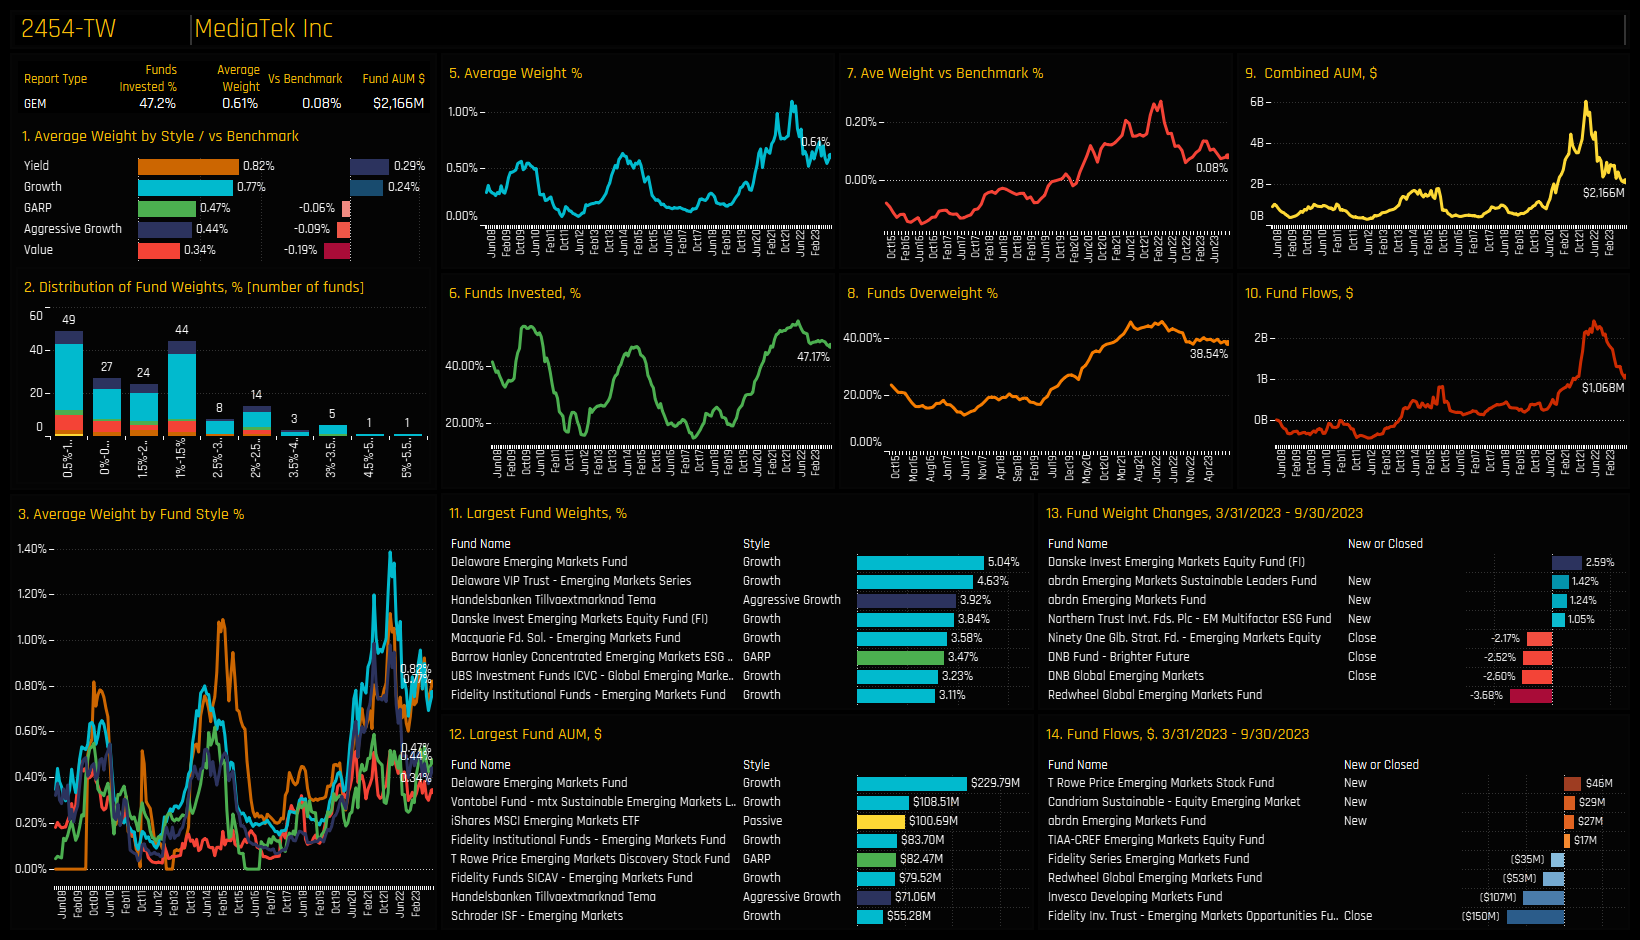
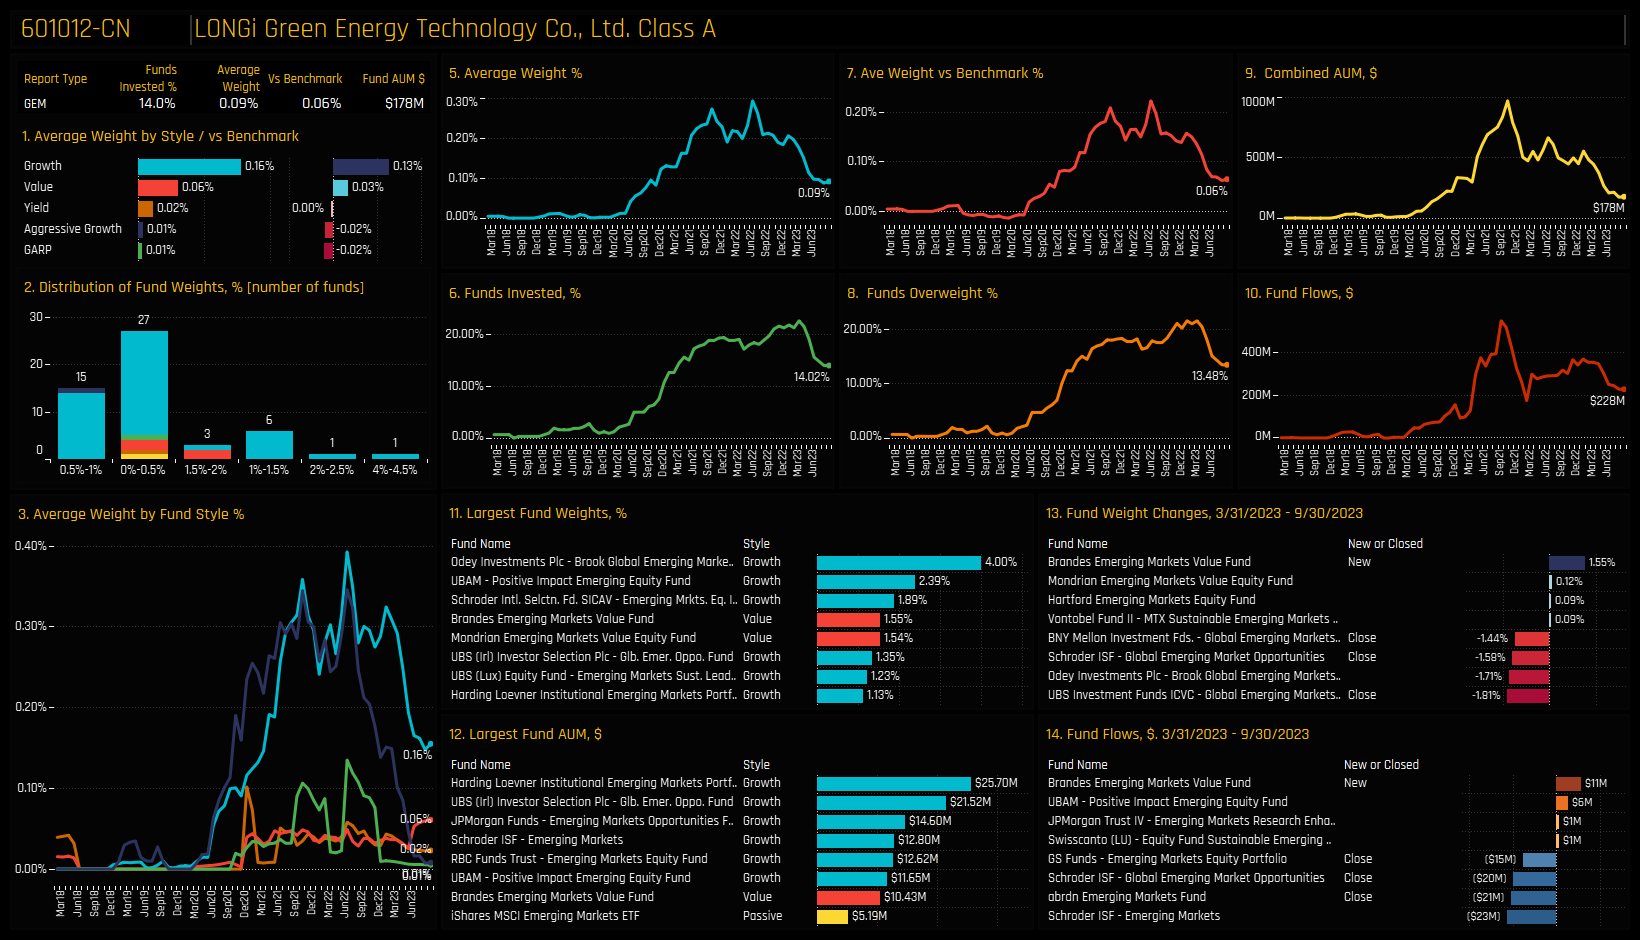
• TSMC is the dominant stock holding, with 88.6% of funds holding a position. SK Hynix and Mediatek occupy a clear 2nd tier. Alchip Technologies and eMemory Technology have captured inflows, whilst EM funds have exited LONGi Green Energy Technology in good numbers.
Industry Positioning & Semiconductor Ownership Trends
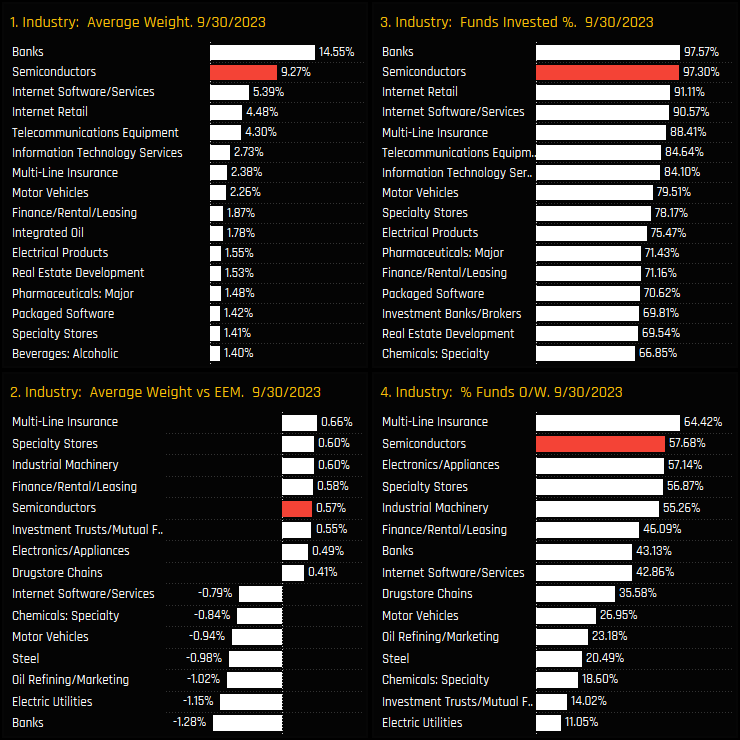
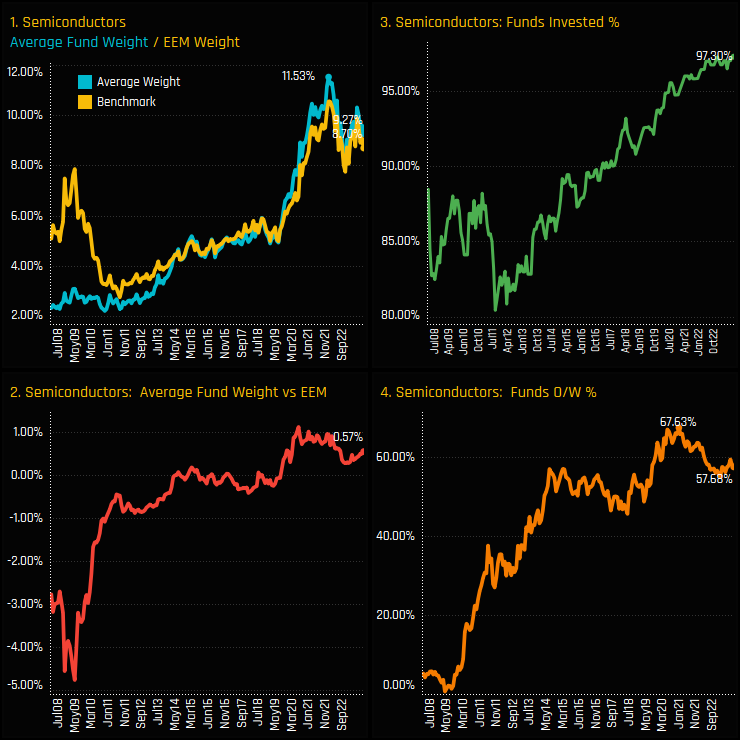
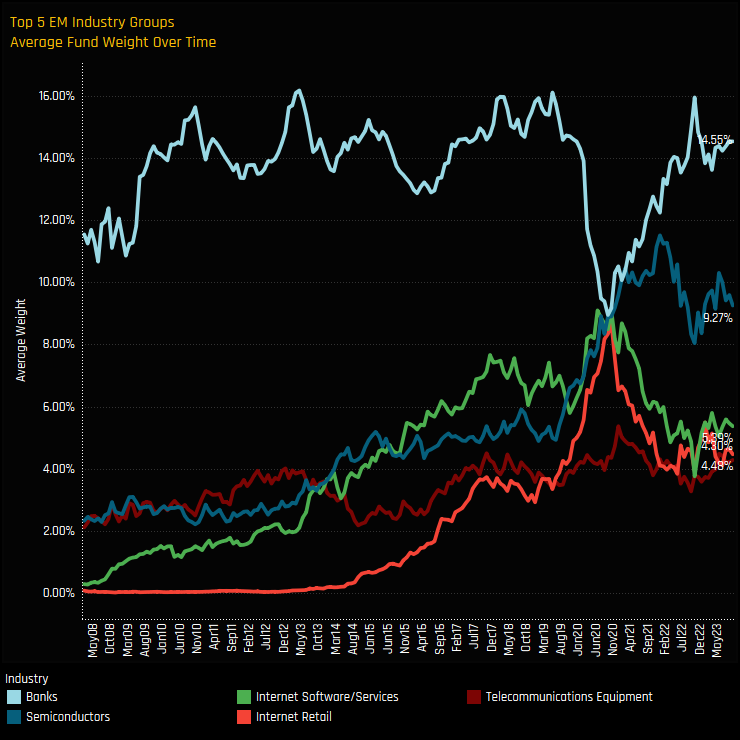
Semiconductors are the 2nd largest industry group holding among active Emerging Market funds. Average holding weights of 9.27% sit well below the dominant Banks industry group but well ahead of Internet Software/Services and Internet Retail (ch1). All but 10, or 2.7% of the 371 funds in our analysis hold exposure to Semiconductors (ch3), with 57.7% of funds positioned ahead of the iShares MSCI Emerging Markets ETF (ch4). This places Semiconductors as the 5th largest net overweight compared to benchmark (ch2).
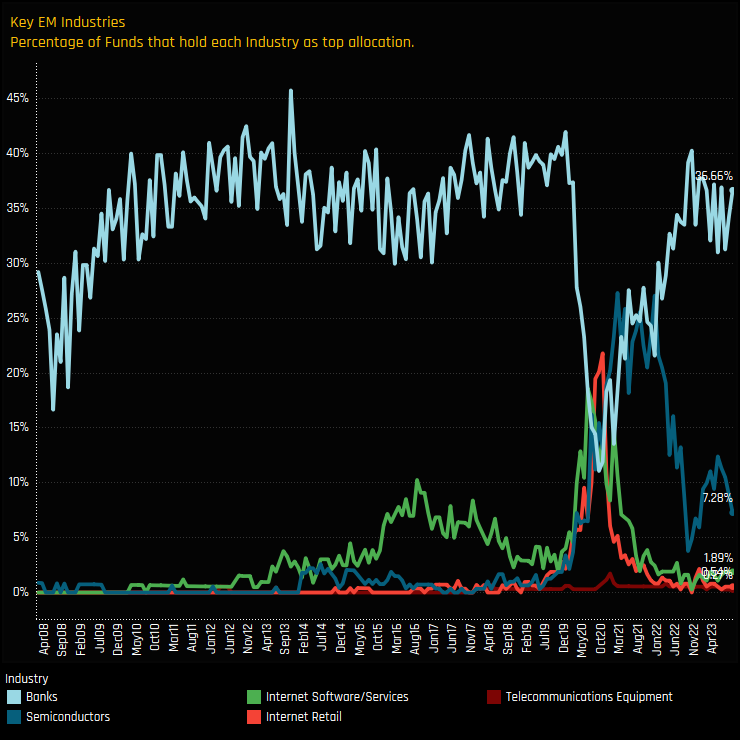
Over the past 15-years, the percentage of EM funds invested in Semiconductors has risen from just over 80% in 2011 to a record 97.3% today (ch3). Average holding weights took a marked jump higher in mid-2019 and accelerated further through the COVID-19 pandemic (ch1). The current average weight of 9.27% is off the highs of 11.5% back in December 2021 but remains well ahead of pre-2019 levels. Versus the benchmark, the percentage of funds positioned overweight has fallen from a peak of 67.6% in December 2020, though the majority of managers are still positioned ahead of the iShares EEM ETF (ch4).
Industry Activity & Sentiment
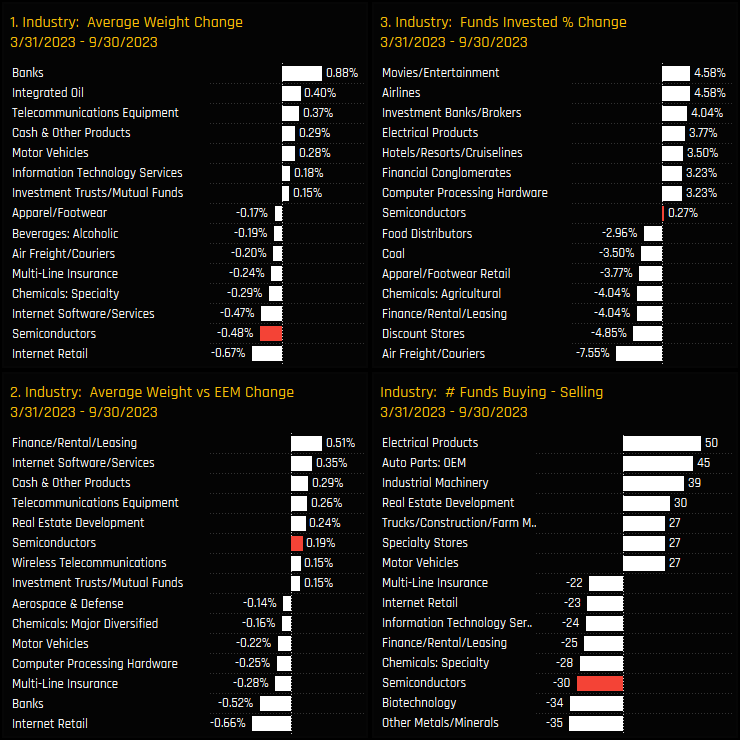
Aggregate Industry level activity over the last 6-months shows Semiconductor weights falling by -0.48%, among the largest declines alongside Internet Retail (-0.67%) and Internet Software/Services (-0.47%). Benchmark relative weights increased by +0.19% and the percentage of funds with exposure to Semiconductor stocks increased by +0.27% (i.e 1 fund). Against this, there was an excess of 30 funds selling versus buying over the period. On balance, the metrics show some signs of fatigue among managers as we close in on full levels of ownership.
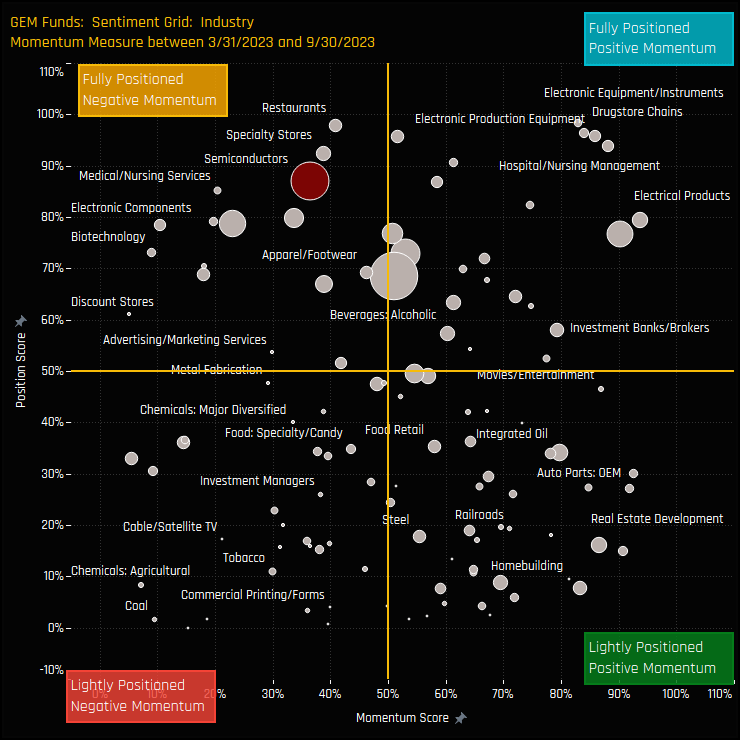
The Sentiment Grid below brings long-term positioning and short term manager activity together in a single chart. The Y-axis shows the ‘Position Score’, a measure of current positioning in each Industry compared to its own history going back to 2008 on a scale of 0-100%. The X-Axis shows the ‘Momentum Score’, a measure of fund manager activity for each Industry between 03/31/2023 and 09/30/2023 on a scale of 0% (maximum negative activity) to 100% (maximum positive activity). It highlights the Semiconductor Industry group as well positioned compared to its own history, and confirms that sense of stalling momentum over the past 6-months.
Top 5 Industry Long-Term Trends
The chart below shows the average holding weights for the largest 5 industry groups in EM since 2008. Semiconductors overtook Internet Software/Services following the China ‘Tech Crackdown’ of late 2020 and have remained well ahead ever since. They came close to overtaking Banks, but a strong resurgence in Banks’ positioning during 2021/22 has now solidified Semiconductors as the second-favored industry group, with a clear gap between Banks above and the Internet related industry groups below.
In a similar vein, the chart below shows the percentage of funds who place either of the top 5 industry groups as their largest Industry holding over time. Again, Banks are shown to be the clear conviction holding among managers, with 36.7% of the 371 EM funds in our analysis holding Banks as their largest position, and just 7.3% placing Semiconductors on top.
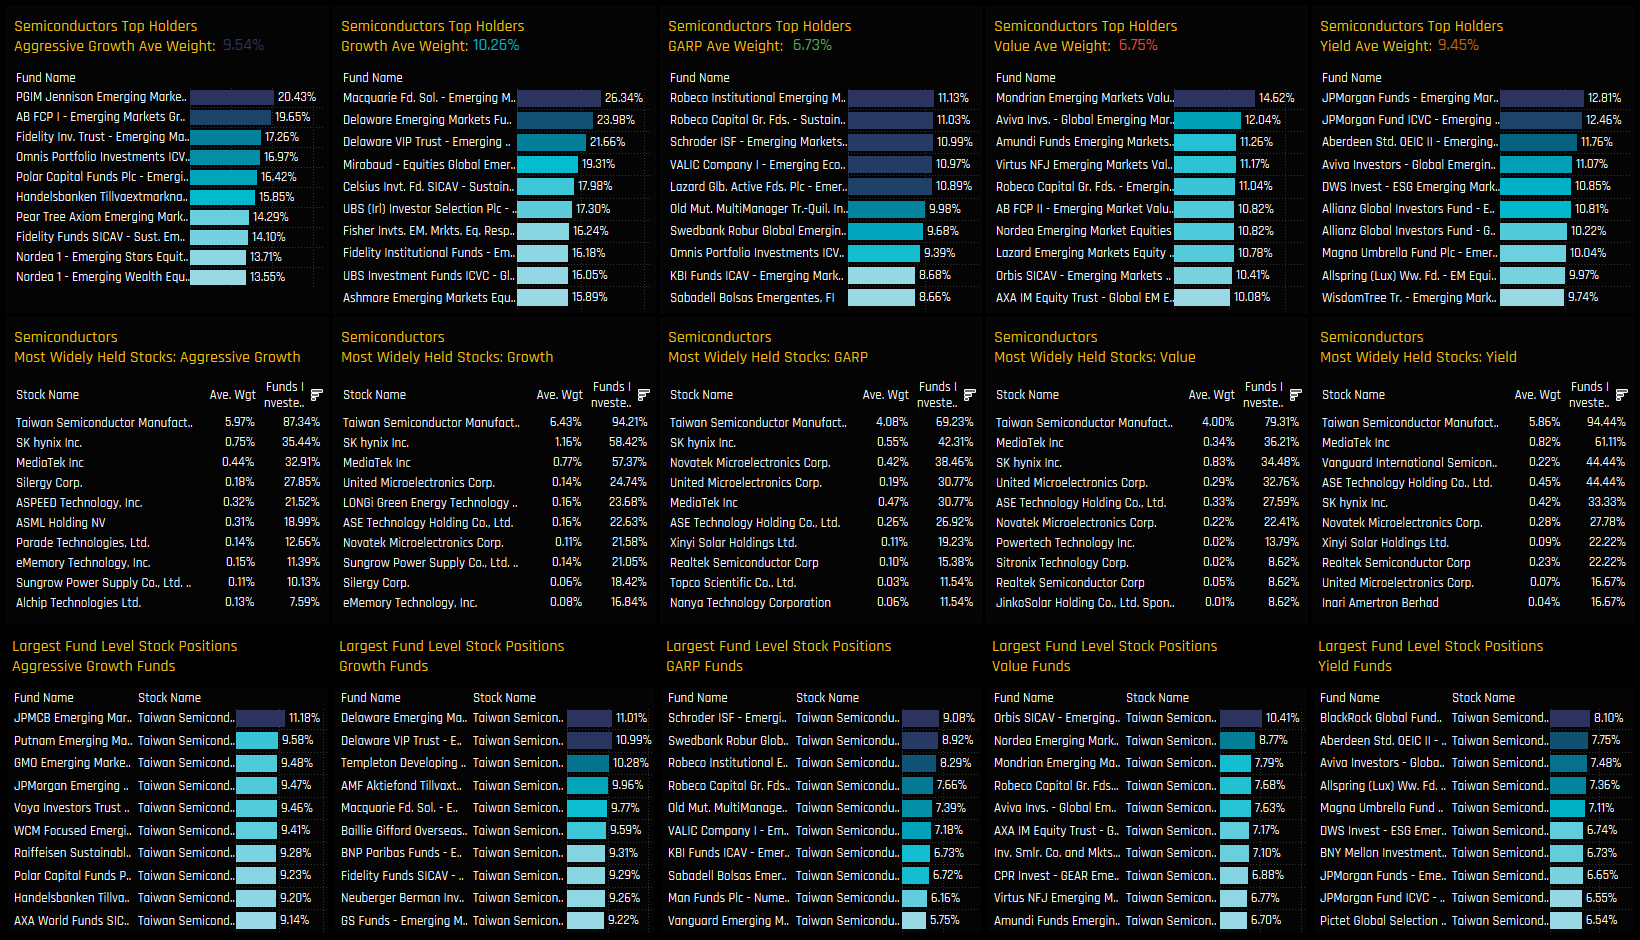
Fund Holdings & Style Trends
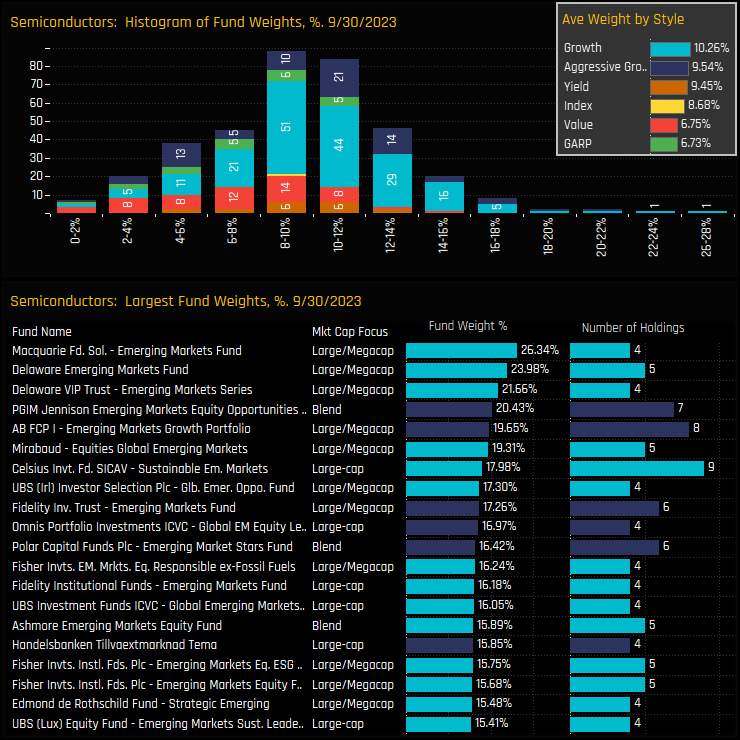
The top chart below shows the histogram of fund holdings in the Semiconductor industry group and the inset chart the average weight by fund Style. Allocations follow a rough normal distribution, with the core centered between 8-12%, and with exposure largely correlated to Style (Growth over Value). The upside tail comprises a number of funds with >20% allocations and led by Macquarie Emerging Markets (26.3%), Delaware Emerging Markets (24.0%) and Delaware VIP Emerging Markets (21.7%).
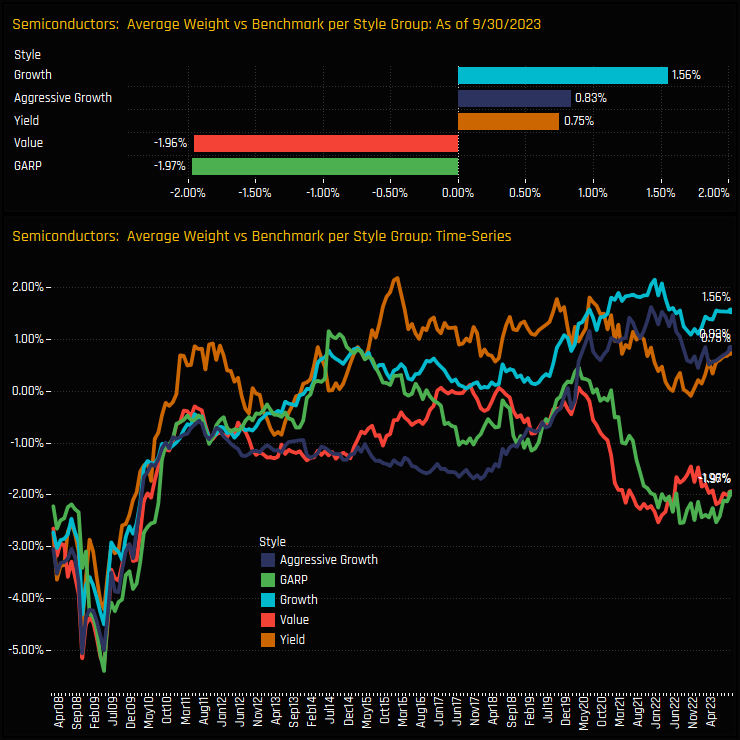
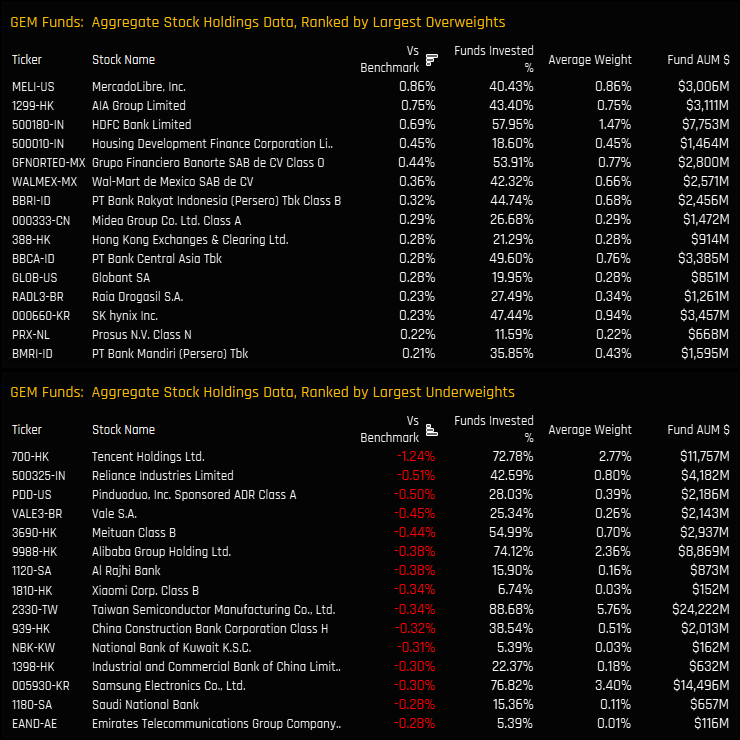
Split by Style, EM Growth and Aggressive Growth funds are running the largest overweight positions on average of +1.56% and +0.83% respectively. Yield managers are marginally behind, but have been positioned overweight Semiconductors for the most part of the last decade. Value and GARP funds made a clear departure from their Style peers in late 2019, switching from an equal weight to an underweight. Their respective underweights of -1.96% and -1.97% are near their lowest levels since 2010.
Country Exposure & Activity
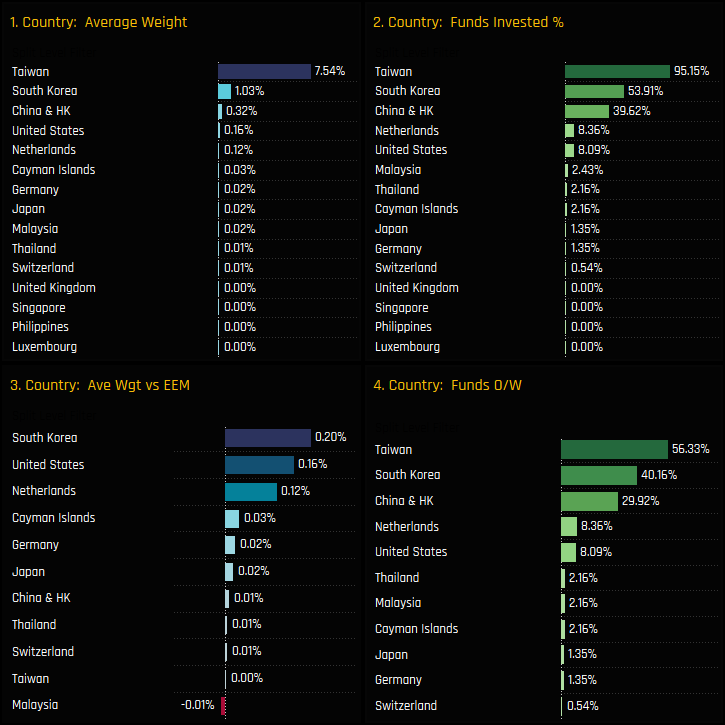
Taiwan Semiconductors are the dominant country exposure with average weights of 7.54% and are owned by 95.2% of funds. South Korean Semiconductors are owned by 53.9% of funds at an average weight of 1.03% and represent a minor overweight versus the benchmark, on average. China & HK Semiconductors are less widely owned and occupy a much smaller slice of the average active EM equity fund.
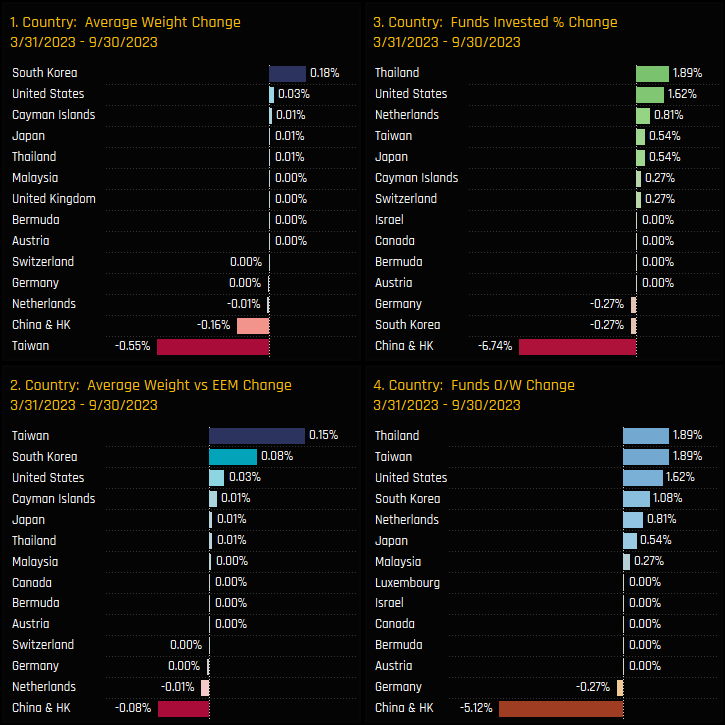
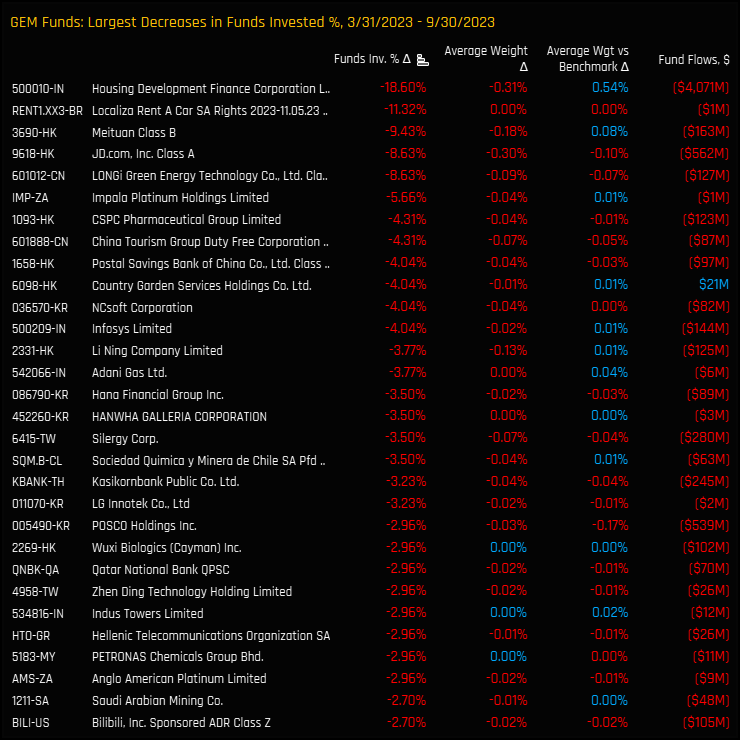
Country level activity between 03/31/2023 and 09/30/2023 shows Taiwan and China & HK Semiconductor weights falling against South Korea rising. However, the most significant data point is that in chart 3, which shows the percentage of funds invested in China & HK Semiconductor stocks falling by -6.74%, a significant outward rotation.
Stock Holdings & Activity
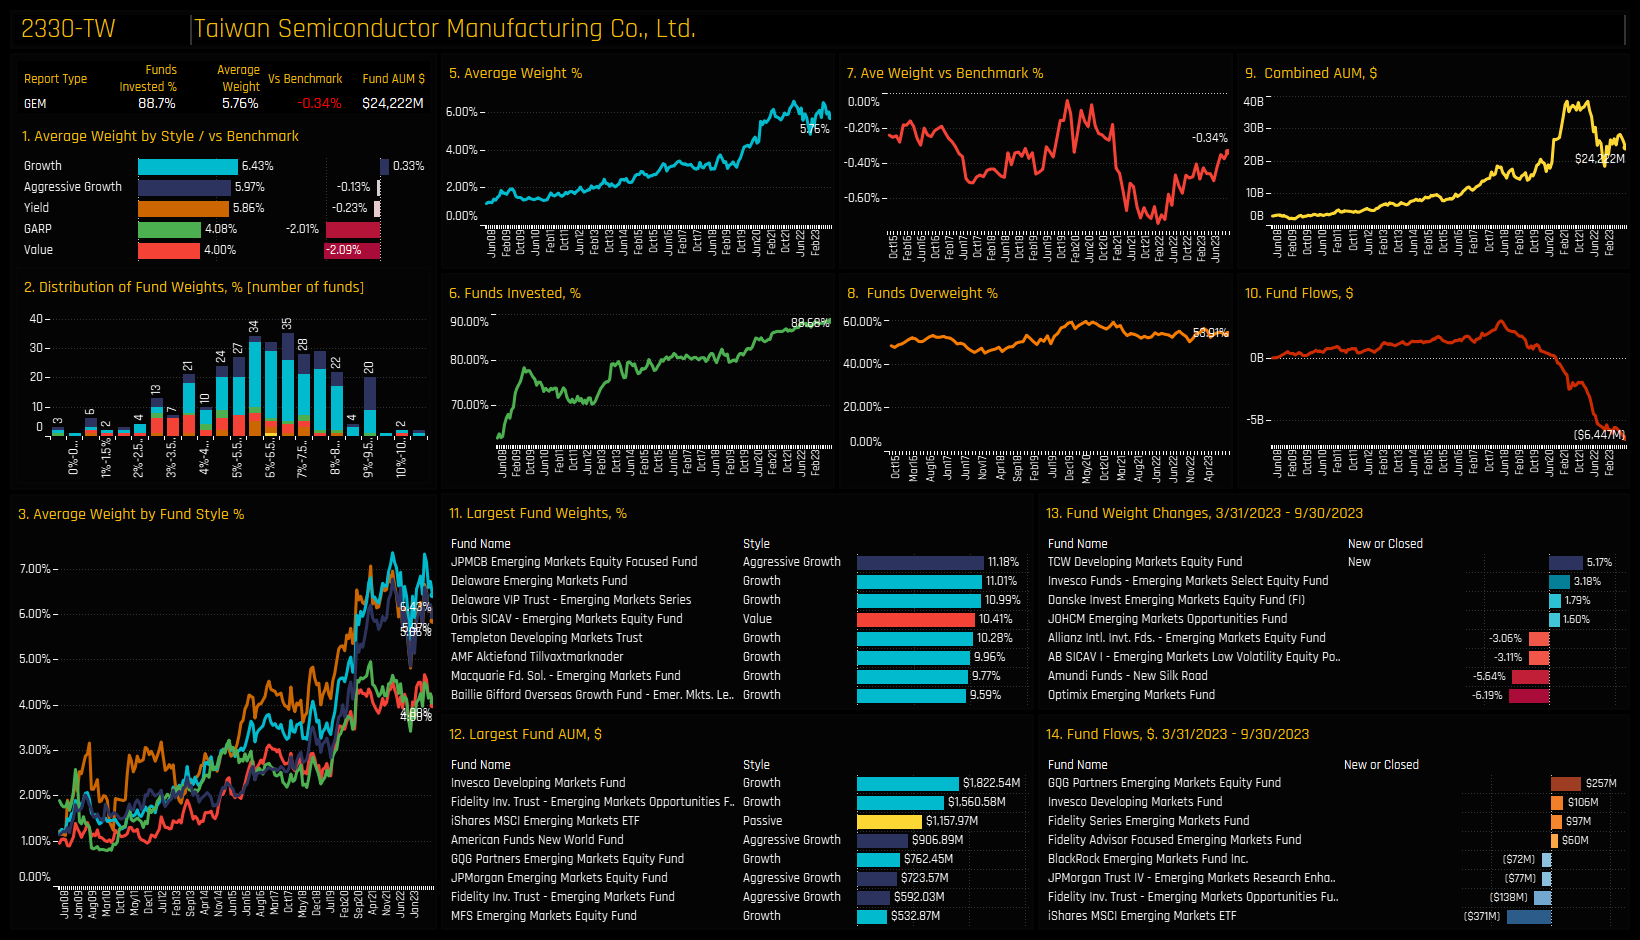
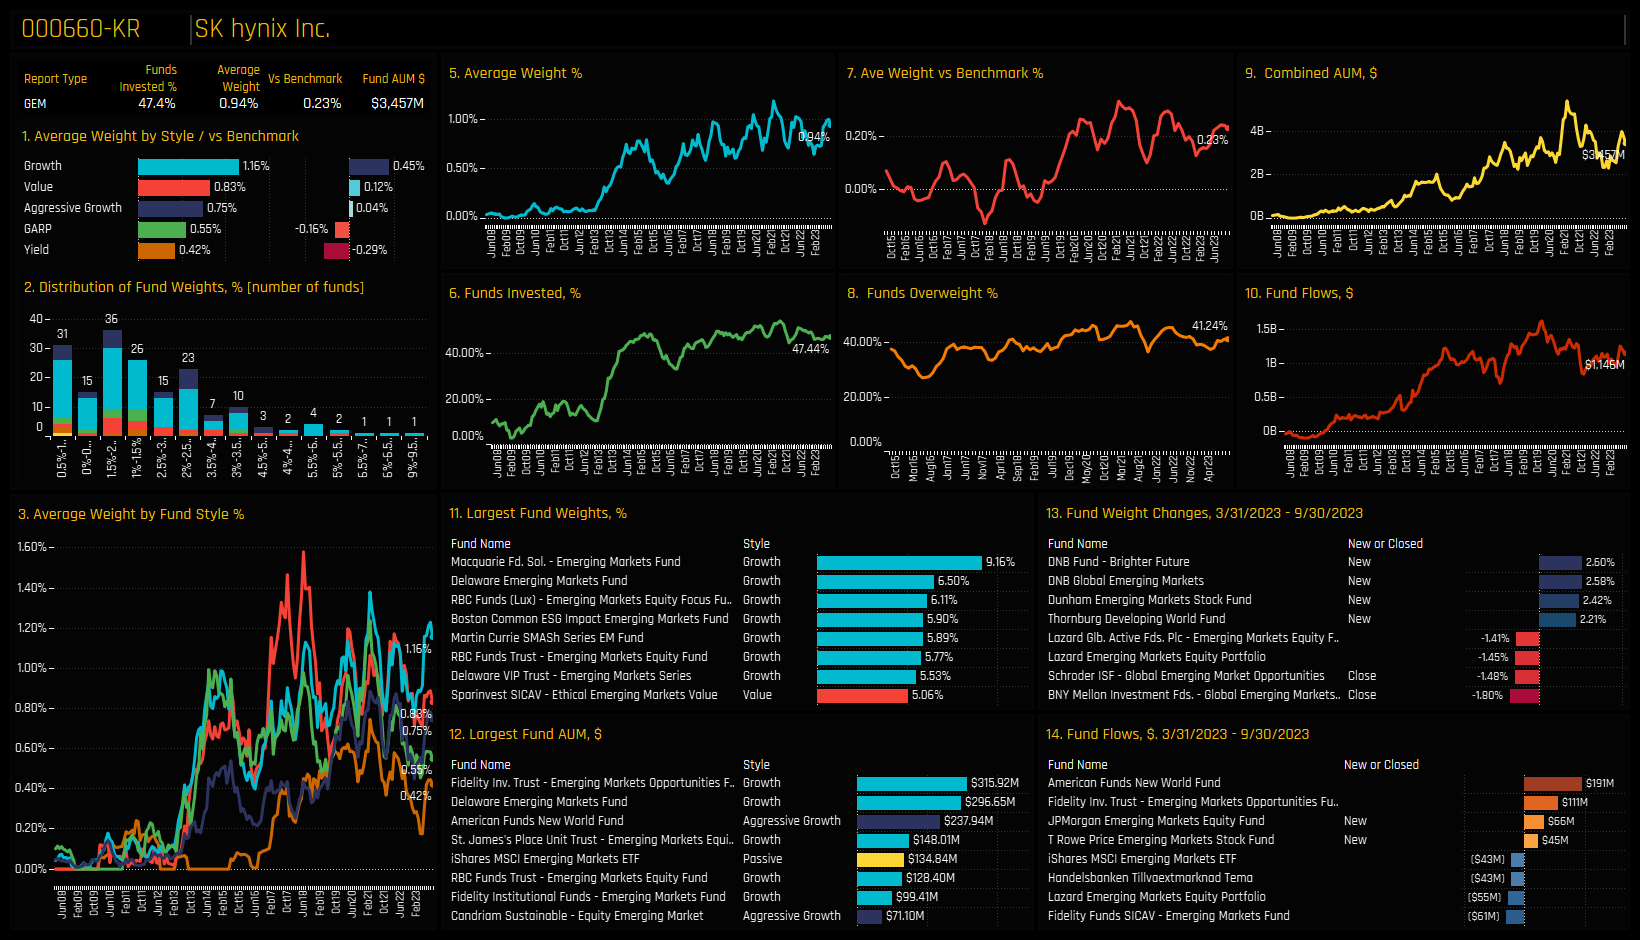
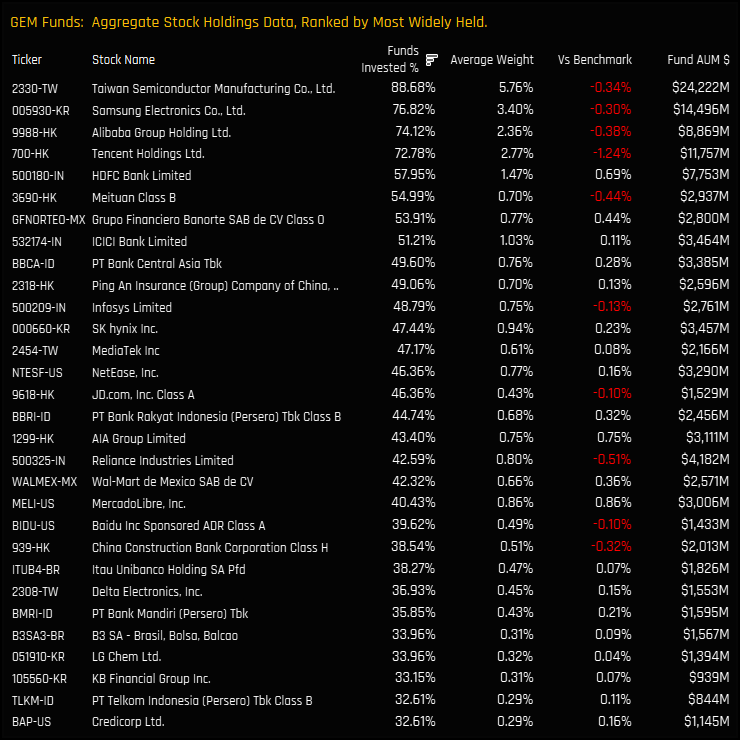
Underpinning the large Taiwan Semiconductor allocation are widespread and sizeable holdings in TSMC. In fact, it is the most widely held stock across the entire EM complex, owned by 88.7% of funds at an average weight of 5.76%. There is a clear 2nd tier occupied by SK Hynix and Mediatek, both held by 47% of managers and both representing small overweight positions, on average. After these 3 companies, most stocks are held by less than 20% of funds.
Stock level activity over the last 6-months shows active EM funds increasing exposure to Alchip Technologies, eMemory Technology and Global Unichip, among others. Decreases in ownership were led by LONGi Green Energy Technology, with a significant -8.63% of funds closing exposure to the stock between 03/31/2023 and 09/30/2023. It was responsible for most of the China & HK decline as seen in the chart above. On an individual fund level, Alchip was a notable addition for TCW, Redwheel and PGIM Jennision.
Stock Positioning by Style
The below charts break down the largest holders, the most widely held stocks and the largest fund level stock holdings in the Semiconductor sector, split by the Style of the fund. The first and most obvious point to note is the sheer dominance of TSMC across the Style spectrum. It is the most widely held Semiconductor stock from Value through to Aggressive Growth, and by some distance. It also occupies the top 10 largest Semiconductor fund positions for all Style groups, shown in the bottom row of charts. Outside of TSMC, SK Hynix and Mediatek are popular holdings for all Style groups, Silergy Corp is well owned by Growth funds and Vanguard International Semiconductors more favoured by Value managers.
Conclusions & Links
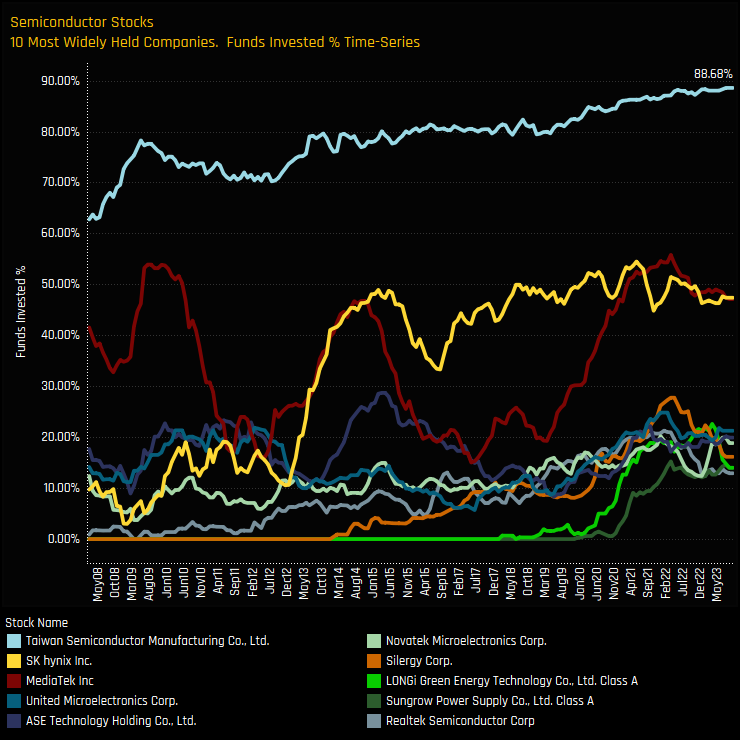
The chart to the right shows the percentage of funds invested in each of the 10 most widely held Semiconductor stocks since 2008. It highlights a 3 tier set up, with TSMC out on it’s own and almost universally held among active EM managers – current ownership levels are the highest on record. SK Hynix and Mediatek have carved a niche below TSMC with just under half the managers in our analysis holding a position. Note the cyclical nature of Mediatek ownership too, with current levels at the top end of the latest cycle.
The third tier contains the remaining 7 companies. Stocks such as Novatek Microelectronics and RealTek Semiconductors have been part of the EM landscape for the past 15-years, whilst LONGi Green Technology and Sungrow Power Supply are more recent entrants. All 7 are now owned by between 13% and 22% of funds.
So to conclude, Semiconductors represent a key allocation for EM managers. Semiconductors are the 2nd largest industry allocation and the 6th largest overweight, so the majority of active managers are positioned for outperformance. However, there are a couple of data points that managers should pay attention to. Firstly, the momentum witnessed between 2019 and 2021 has clearly stalled. With 97.3% of funds invested there is little room for further upside outside of existing managers raising allocations. Secondly, the fact that Value and GARP managers have moved to an underweight stance is a reflection of challenging valuations. With these thoughts in mind, now might be a good time to reassess exposure.
Click below for the extended data report on EM Semiconductor investor positioning. Scroll down for stock profiles on TSMC, SK Hynix, MediaTek and LONGi Green Energy Technology.
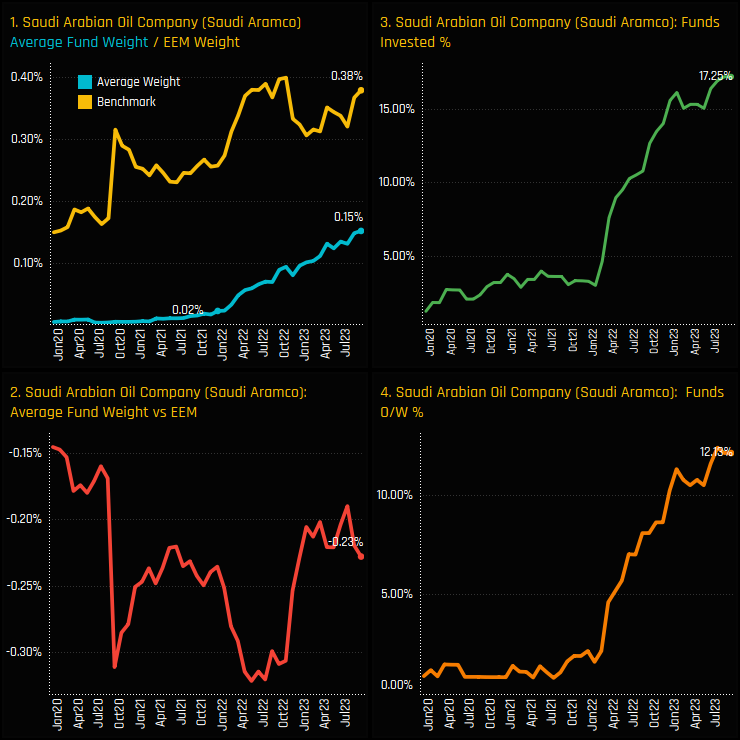
• EM Fund ownership in Saudi Aramco surges to highest levels on record.
• Saudi Aramco has benefitted from manager rotation over the last 6-months, with Ashmore, Redwheel, Robeco and abrdn among the buyers
• Saudi Aramco moves to the 5th most widely held stock in the Energy sector, overtaking the Chinese Energy majors in recent months.
Time-Series & Stock Level Activity
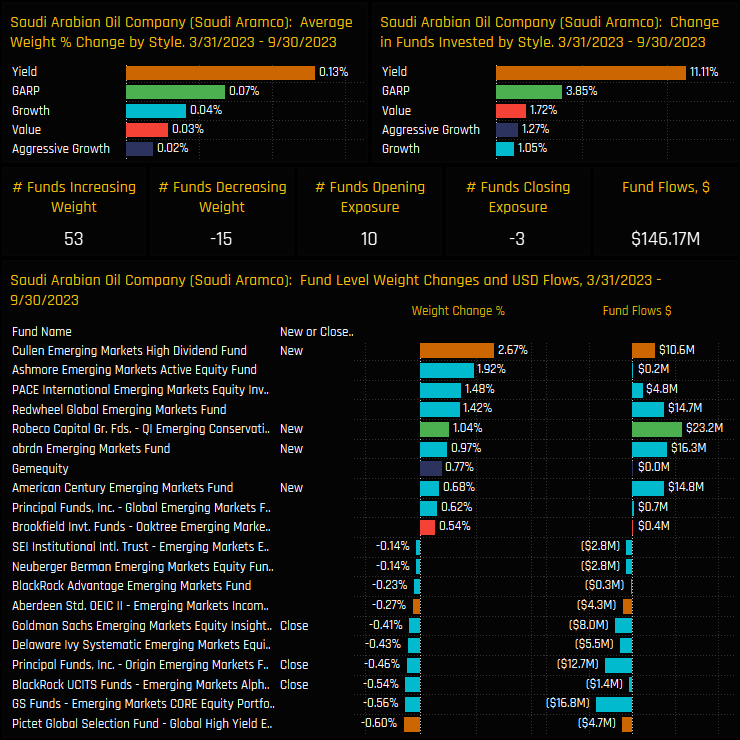
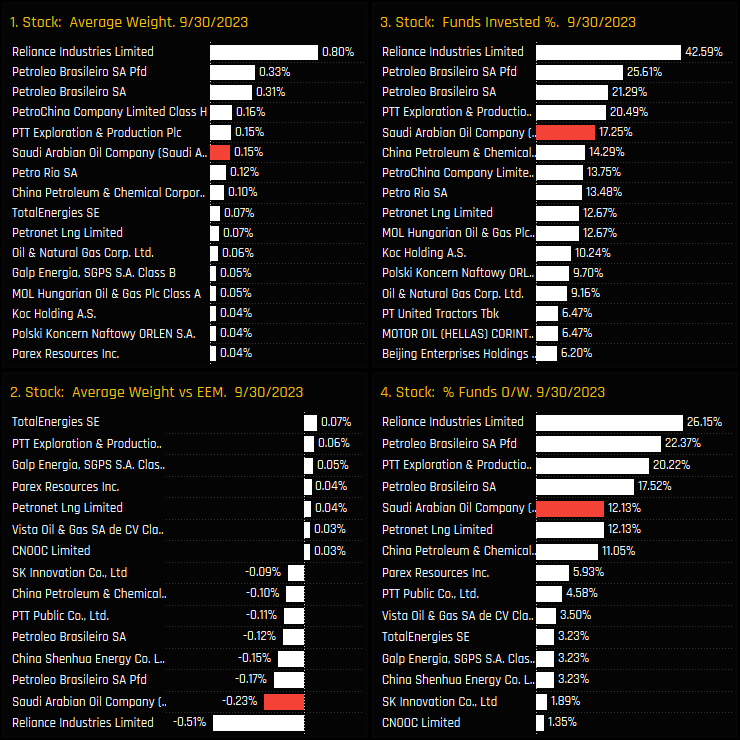
Ownership levels in Saudi Aramco have reached new highs. The percentage of funds invested in Saudi Aramco now stands at a record 17.25% (ch3), with average holding weights at an all-time high of 0.15% (ch1). Sentiment appeared to change towards the stock in early 2022 when the percentage of funds invested finally broke above 5%. Before that, EM managers had mostly ignored the stock following it’s 2020 listing and entry in to the MSCI Emerging Markets index. Today they remain underweight -0.23% on average, with just 12.1% of funds positioned ahead of the benchmark.
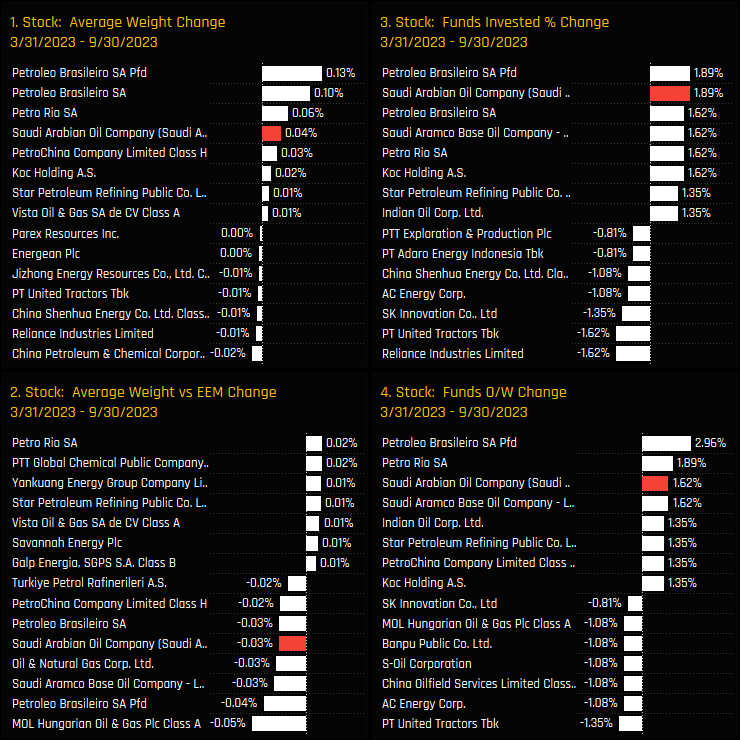
The charts below show the aggregate ownership changes for companies in the Energy sector between 03/31/2023 and 09/31/2023. Saudi Aramco has been one of the key beneficiaries of rotation, with the percentage of funds invested increasing +1.89% and average weights by +0.04%. These moves are moderate in relation to the wider EM stock universe, but they re-enforce the sense that Saudi Aramco is becoming a legitimized investment option for those looking for Energy exposure.
Fund Activity & Latest Holdings
Fund level activity over the same period provides further details of this active rotation. All Style groups saw ownership levels rise, with 11.1% of Yield funds opening new positions and 3.85% of GARP managers. Of the 371 funds in our analysis, 53 increased weights in Saudi Aramco and 10 opened new exposure. New positions were led by Cullen EM High Dividend (+2.67%) in addition to inflows from Ashmore, Redwheel, Robeco, American Century and abrdn, among others.
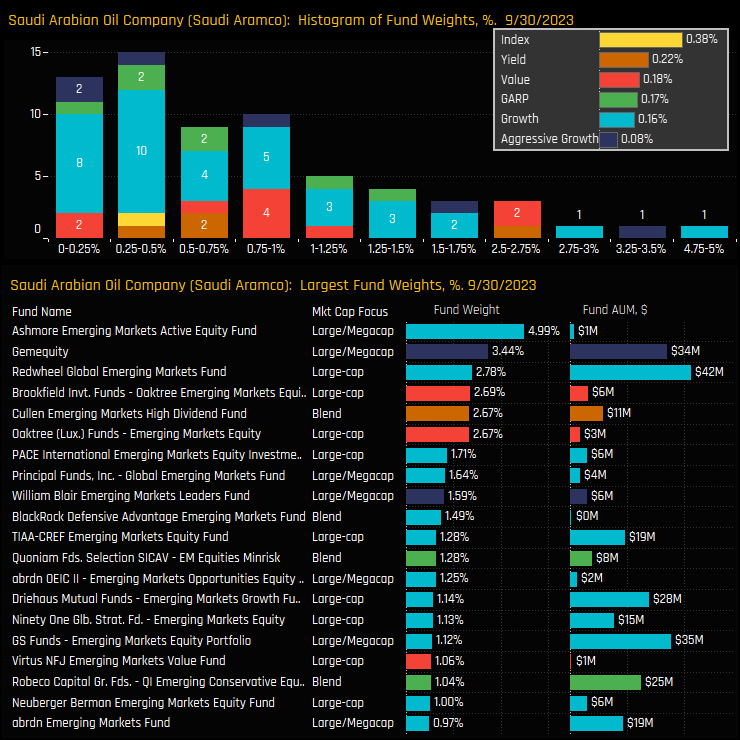
The latest histogram of holding weights in Saudi Aramco is shown in the top chart below, with the inset chart showing the average weight by Style. The bulk of the holding distribution lies below 1%, with allocations correlated to Style (Value over Growth) and all Style groups positioned below the iShares MSCI EM ETF benchmark. Despite this Style bias, the top holders are from the Growth end of the spectrum and led by Ashmore EM Active Equity (4.99%), Gemequity (3.44%) and Redwheel Global EM (2.78%).
Saudi Arabia's Top Stock Holdings
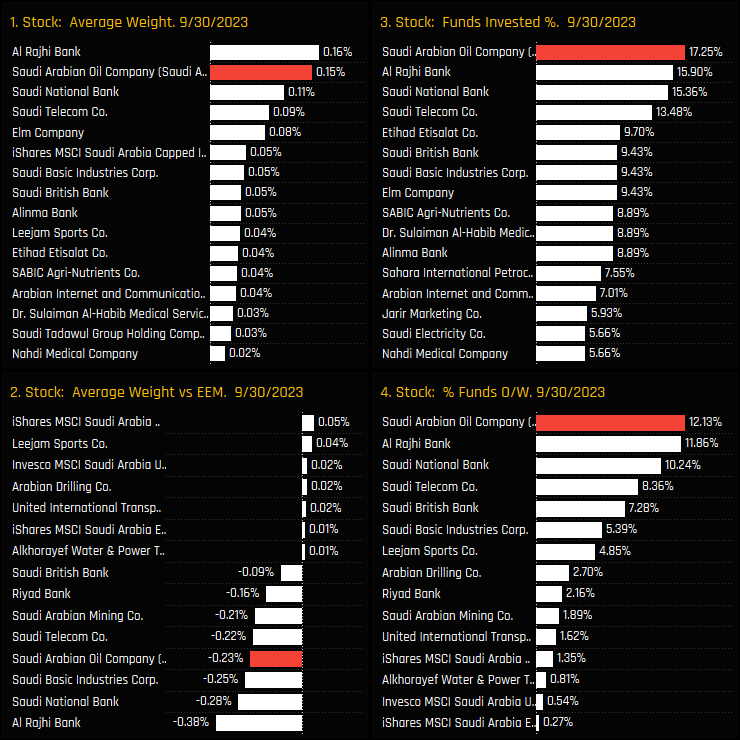
Saudi Aramco is now the most widely held stock in Saudi Arabia, ahead of Al Rajhi Bank and Saudi National Bank (ch3), although marginally behind Al Rajhi Bank on an average weight basis (ch1). Versus the benchmark, Saudi Aramco is the 4th largest net underweight holding in Saudi Arabia (ch2) and although small, no other company has more funds positioned overweight (ch4).
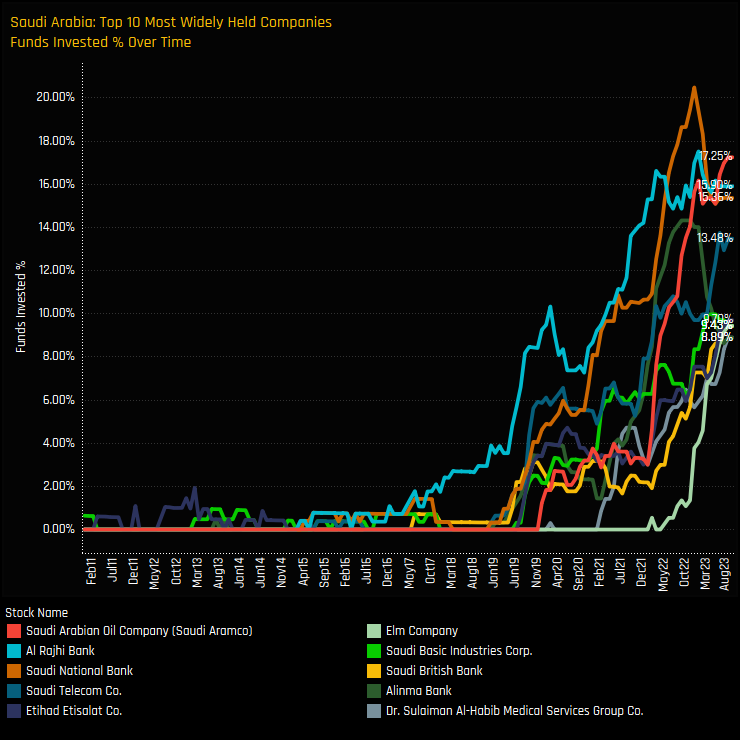
The time-series of funds invested for the 10 most widely held companies in Saudi Arabia is shown in the chart below. It highlights how Saudi Aramco has overtaken both Al Rajhi Bank and Saudi National Bank over the course of 2023 to become the most widely held stock. All 10 companies have seen strong increases in ownership over the last 2-years.
Conclusions & Data Report
This active rotation has elevated Saudi Aramco’s position in the hierarchy of global Energy stock allocations among active EM managers. The charts opposite show our holding metrics for stocks in the Energy sector. Saudi Aramco has overtaken both China Petroleum & Chemical and PetroChina in recent months to move to the 5th most widely held stock in the sector.
These are early days and it remains to be seen how much further Saudi Aramco can go given the general lack of appetite for Energy exposure among active EM managers. But the fact that Reliance Industries has managed to secure investment from 42.6% of funds shows the potential for further investment growth. What our data does show is a definitive change in sentiment towards Saudi Aramco. A stock once shunned by EM managers on it’s stock market debut has started to find some backers.
Click on the link below for an extended report on positioning in Saudi Aramco among the GEM funds in our analysis.
The latest data on aggregate stock level holdings, fund level stock holdings and activity over the last 6-months.
Most Widely Held Stocks
The 30 most widely held stocks among GEM active equity funds
Top Over/Underweights
The top 15 aggregate overweight and underweight stock holdings
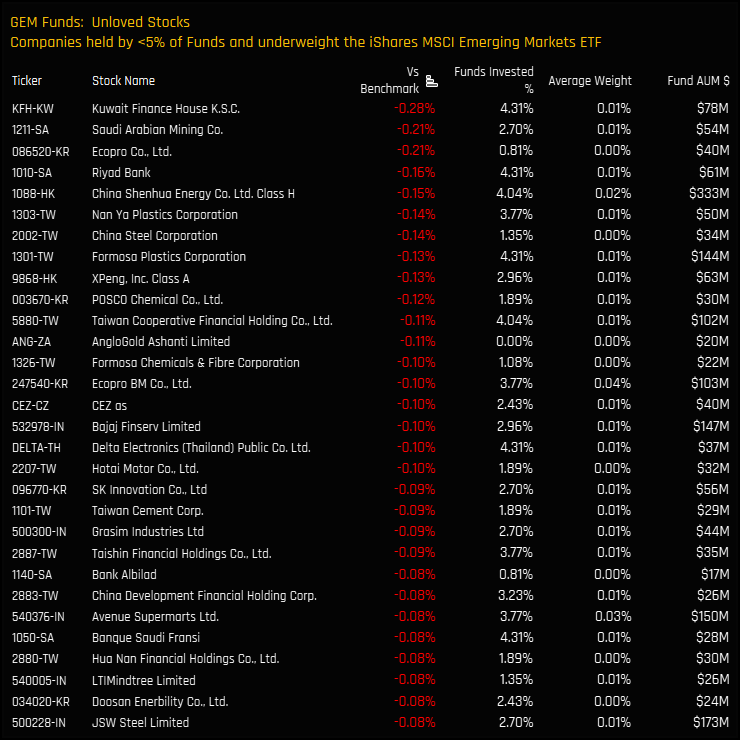
Unloved Stocks
Stocks held by less than 5% of the GEM Funds in our analysis, and net underweight vs the iShares MSCI EM ETF (cash component removed and stock weights adjusted)
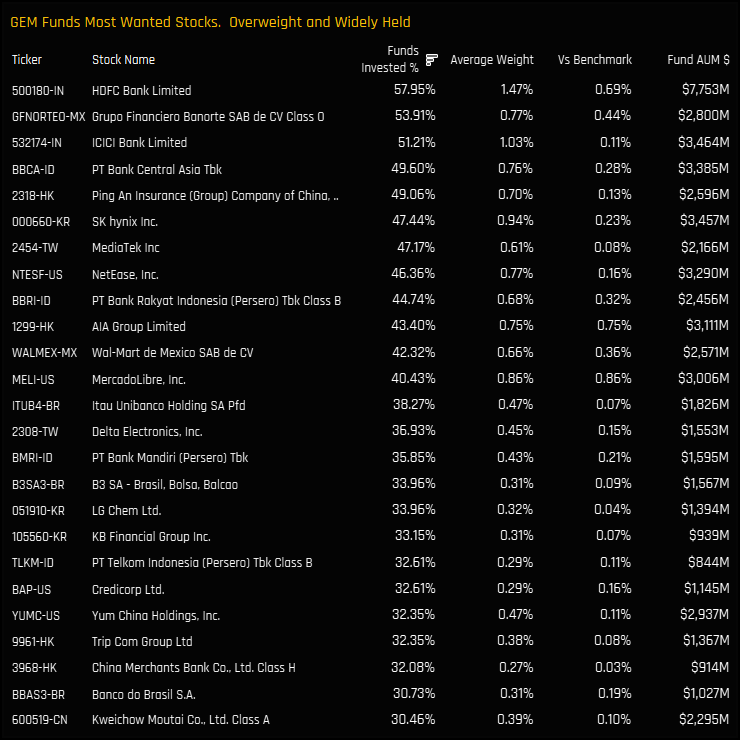
Most Wanted Stocks
Stocks held by more than 30% of the GEM Funds in our analysis, and net overweight vs the iShares MSCI EM ETF
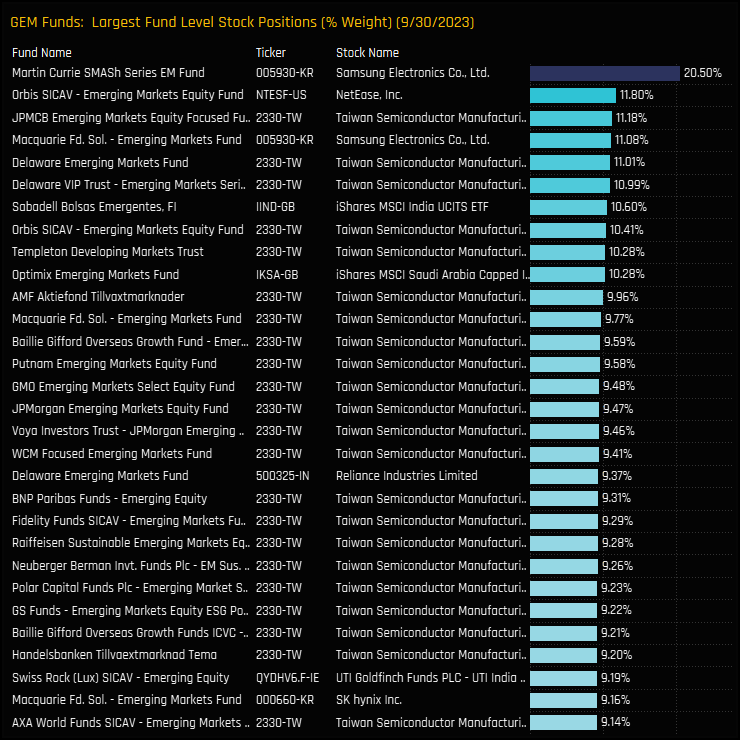
Largest Fund Level Stock Positions, %
The top 30 largest individual fund level stock positions on a portfolio weight basis.
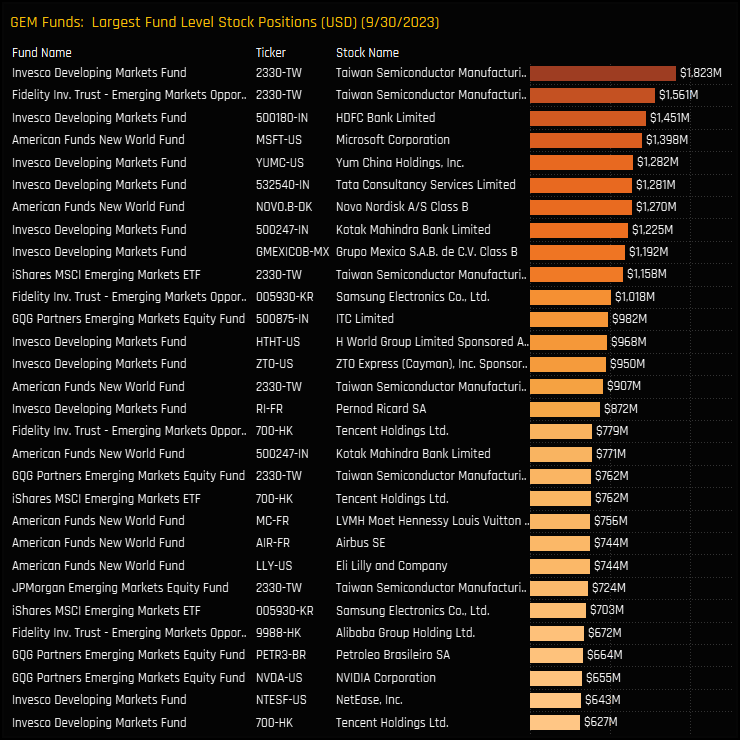
Largest Fund Level Stock Positions, $
The top 30 largest individual fund level stock positions on a fund AUM basis.
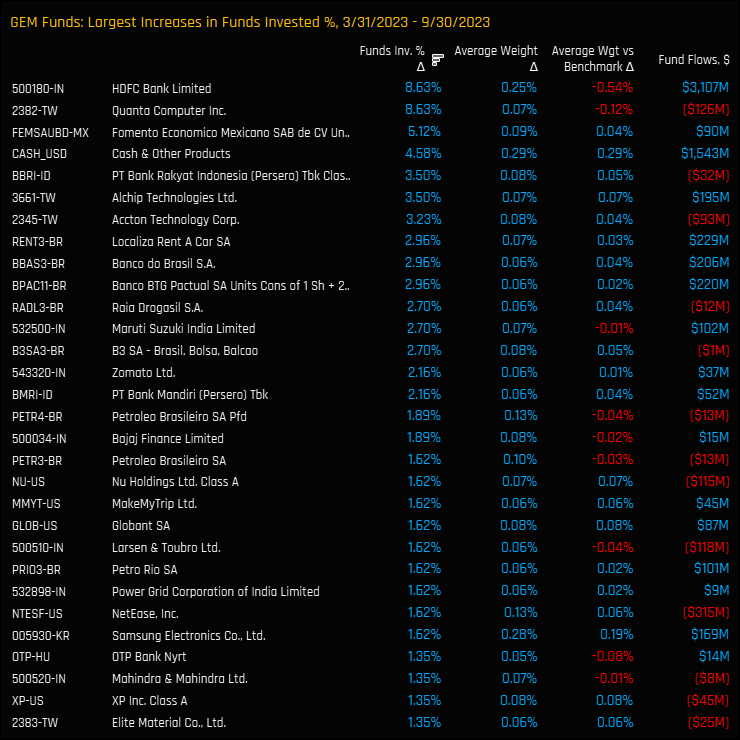
Largest Ownership Increases
The stocks with the largest net increase in the percentage of funds invested between 03/31/2023 and 09/30/2023
Largest Ownership Decreases
The stocks with the largest net decrease in the percentage of funds invested between 03/31/2023 and 09/30/2023
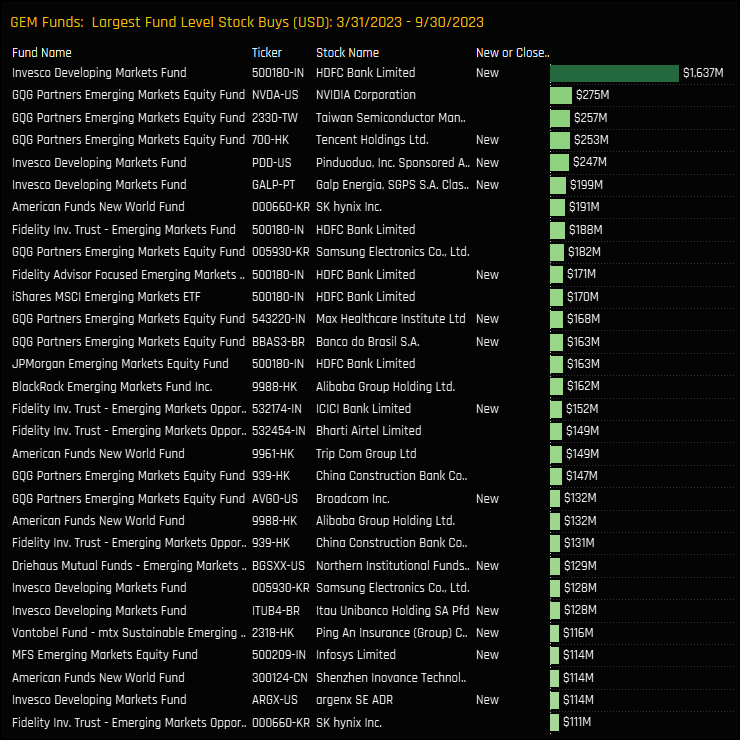
Largest Opening Positions
The largest opening stock positions between 03/31/2023 and 09/30/2023
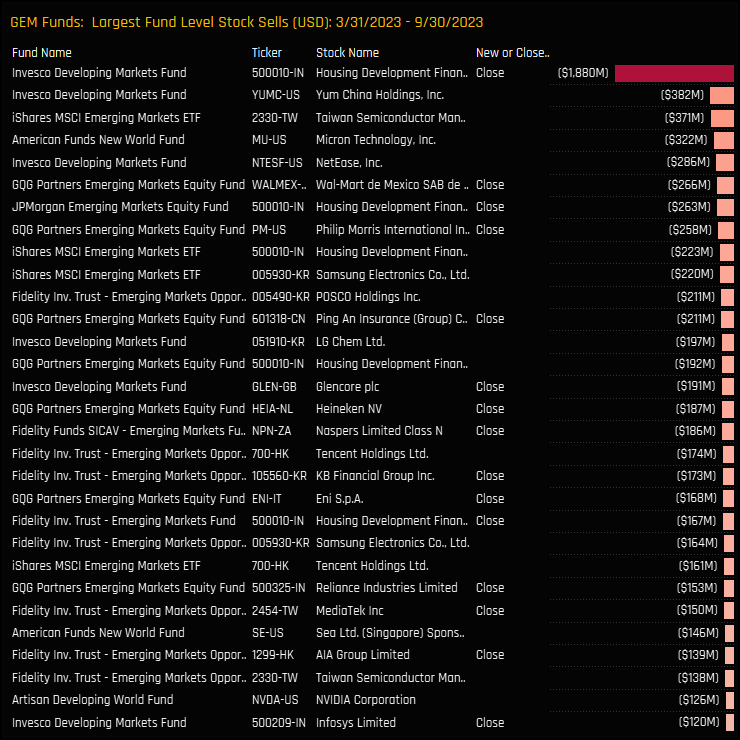
Largest Closing Positions
The largest closing stock positions between 03/31/2023 and 09/30/2023
Largest Stock Inflows, $
The largest combined fund inflows on a stock level between 03/31/2023 and 09/30/2023
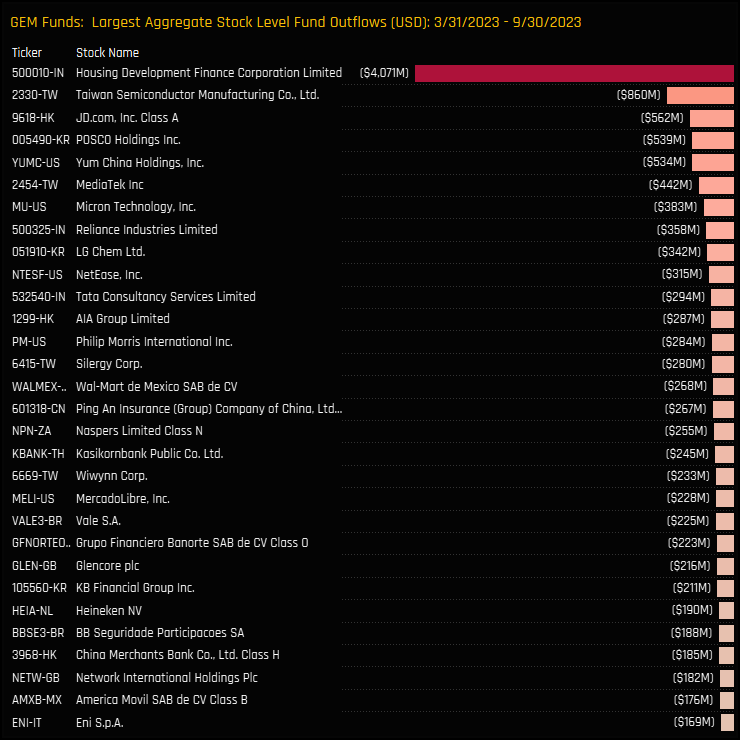
Largest Stock Outflows, $
The largest combined fund outflows on a stock level between 03/31/2023 and 09/30/2023
Largest Fund Level Stock Inflows, $
The largest fund level stock inflows between 03/31/2023 and 09/30/2023
Largest Fund Level Stock Outflows, $
The largest fund level stock outflows between 03/31/2023 and 09/30/2023
371 emerging market Funds, AUM $385bn
GEM Active Funds Ownership Report
Please click on the link below for the full data report on Global EM active fund positioning
For more analysis, data or information on active investor positioning in your market, please get in touch with me on steven.holden@copleyfundresearch.com
Investor Positioning Report — Copley Fund Research Ltd · Last updated: July 2026 · Registered in England and Wales
1. Who we are
Copley Fund Research Ltd provides proprietary institutional fund intelligence to listed companies and investor relations professionals. These terms govern every purchase of an Investor Positioning Report. By completing a purchase you confirm you have read, understood, and agreed to these terms in full.
2. What you are purchasing
The Investor Positioning Report is a bespoke PDF report mapping the institutional fund universe around your stock. It covers current investors, past investors, competitor investors, and white space investors. Every report is built from scratch for the specific company ordered and is not a standardised or templated product.
3. Delivery and process
Following payment or invoice issuance, Copley Fund Research will contact you within one working day to agree your competitor set. Production begins once the competitor set is confirmed in writing. The completed report will be released to you within 48 hours of production starting, provided payment has been received in full; where payment is outstanding, the report will be withheld until payment clears. If the requested company falls outside our covered fund universes, or a competitor set cannot be agreed, Copley Fund Research will issue a full refund or cancel the outstanding invoice.
4. Competitor set agreement
The competitor set is agreed with you in writing prior to production, and the report is built to that agreed specification. Requests to amend the competitor set after delivery, based on a change of preference rather than an error, may be treated as a new order.
5. Refund policy
Because each report is produced individually for your company, orders are non-refundable once production has begun, except as set out in clauses 3 and 5a below. By purchasing, you agree not to dispute the charge with your card provider on the basis that the service was not as described, provided the report has been delivered to the agreed specification or corrected under clause 5a.
5a. Quality remedy
If a delivered report contains a material error caused by Copley Fund Research — for example, an incorrect company analysed, a competitor omitted from the agreed set, or content missing from the specification in clause 2 — Copley Fund Research will correct and redeliver the report at no additional charge, within a reasonable timeframe. This is your sole remedy for such errors.
6. Data and accuracy
All fund positioning data in the report reflects holdings as disclosed at the most recently available reporting date at the time of compilation. The timing of fund holdings disclosures is determined by regulatory requirements applicable to each fund and is outside the control of Copley Fund Research Ltd. This data may not reflect current fund positions. Copley Fund Research takes reasonable care to ensure accuracy but makes no warranty, express or implied, as to the completeness or current accuracy of the underlying data — though this does not affect the quality remedy in clause 5a for errors in how that data was analysed or presented. Past fund positioning is not indicative of future fund behaviour or investment decisions.
7. Not investment advice
The Investor Positioning Report is produced for investor relations intelligence purposes only. It does not constitute investment advice, financial advice, or a recommendation to buy, hold, or sell any security. The data reflects historical fund positioning and must not be relied upon as a prediction of future fund behaviour or investment decisions. Copley Fund Research Ltd is not authorised or regulated by the Financial Conduct Authority for the provision of investment advice.
8. Permitted use and confidentiality
The report is licensed for internal use by the purchasing organisation only. You may share it with employees and directors of your organisation. You may not: reproduce, redistribute, publish, or resell the report or any part of it; share it with any third party outside your organisation without prior written consent; use the fund or portfolio manager names contained in the report to approach those individuals on behalf of Copley Fund Research or in a manner that could damage Copley Fund Research's relationships with those funds; or use the data for any purpose other than your own investor relations strategy. The data, analysis, and methodology contained in the report are the intellectual property of Copley


