UK Small/Midcap Fund Positioning Update, October 2023
In Brief:
• Industrials maintain top Sector weight.
Real Estate and Consumer Discretionary underweights fund Technology overweight.
• Investment Managers Industry group hits record exposure. REITs largely unloved by UK Small/Midcap funds.
• Future plc remains the most widely held company. XPS Pensions and Foresight Group Holdings are the top overweights. B&M, Weir Group and Rightmove lead the underweights.
Sector Positioning
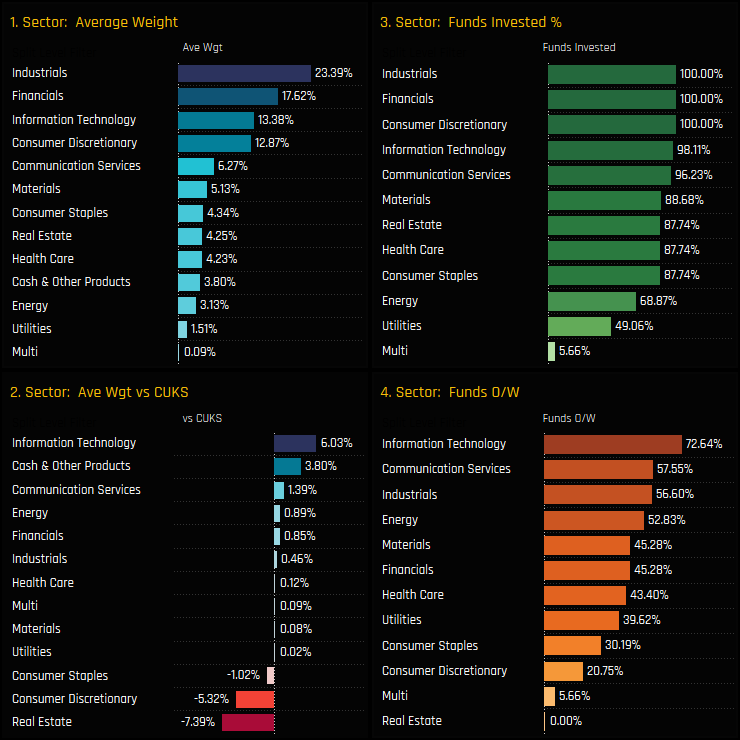
Sector allocations among the 103 active UK Small and Midcap funds in our analysis are shown in the 4 charts below. Chart 1 shows the average holding weight for each sector, with a clear top tier of 4 sectors comprising Industrials, Financials, Information Technology and Consumer Discretionary. Chart 2 shows the percentage of funds invested in each sector. Every fund has exposure to Industrials, Financials and Consumer Discretionary stocks, but far less are exposed to Utilities and Energy stocks – these are non-essential sector exposures for UK Small/Midcap managers. Versus the iShares MSCI Small Cap ETF, active funds are aggressively overweight Technology by +6.03% on average (ch3), with 72.6% of managers positioned ahead of the benchmark (ch4). Underweights are led by Real Estate, Consumer Discretionary and Consumer Staples.
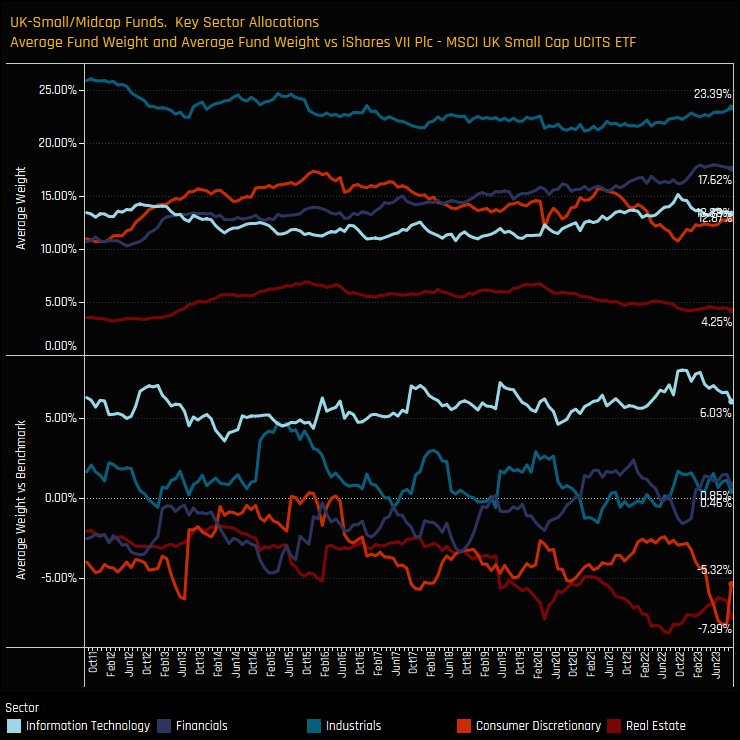
The top chart below shows the long-term average fund weights for the 4 largest sectors of Industrials, Financials, Consumer Discretionary and Technology together as well as the key underweight, Real Estate. Industrials have been the largest sector weight by some distance over the last decade, with Financials and Technology overtaking Consumer Discretionary over the last 2 years. The bottom chart shows the average weight vs the benchmark for the same sectors. Information Technology has been a consistent overweight, though today’s +6.03% overweight is some way off the highs of +8% at the end of last year. Real Estate and Consumer Discretionary have seen underweights increase in recent years.
Financials Focus
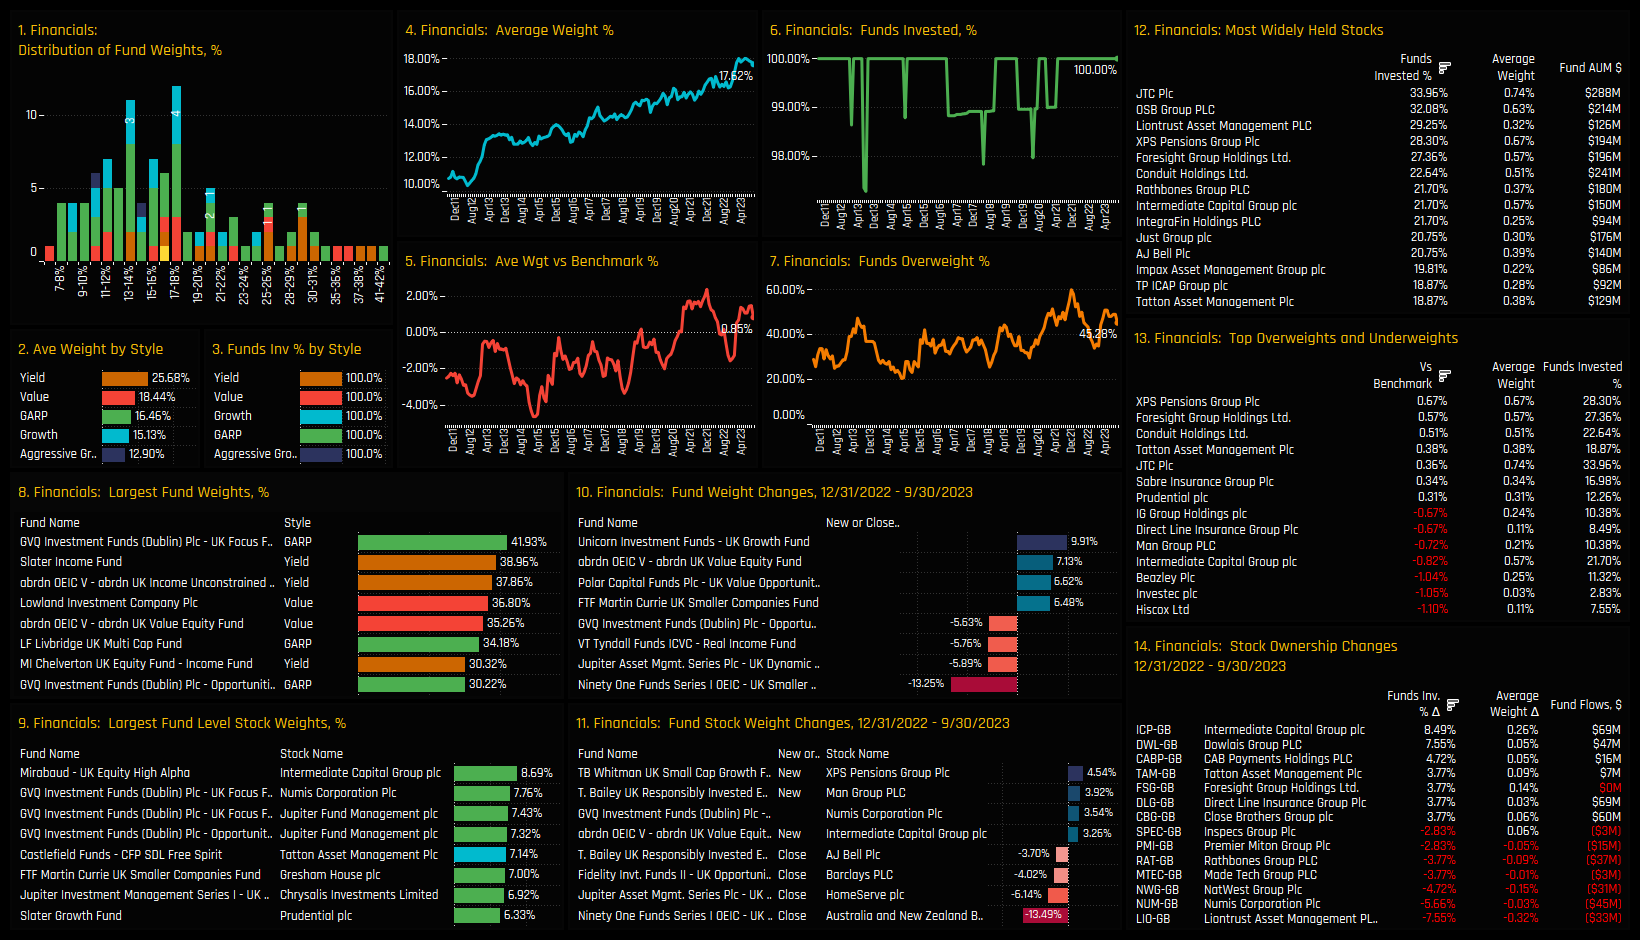
The chart dashboard below shows the ownership breakdown for the Financials sector. Chart 1 looks at the distribution of Financials weights among funds, with the bulk of allocations below 20% but with an extended tail to the upside. The most bullishly positioned are GVQ UK Focus (41.9%) and Slater UK Income (39.0%) as shown in chart 8, with Yield and Value managers positioned ahead of their Growth peers (ch2). The long-term trend of Financials weights is shown in chart 4, with today’s 17.62% average holding weight near its highest level on record, as managers switched from underweight to overweight over the last year (ch5).
The most widely held stock in the Financials sector is JTC plc, owned by 33.9% of funds at an average weight of 0.74%, though OSB Group and XPS Pensions Group are not far behind (ch12). The key overweight positions are in XPS Pensions Group and Foresight Group, with underweights led by the lightly owned Hiscox ltd and Investec plc. Stock ownership changes this year have favoured Intermediate Capital Group, with a net 8.5% of funds opening new exposure in the name (ch14). On the negative side, Liontrust Asset Management suffered a significant fall in ownership, losing investment from -7.55% of the UK Small/Midcap funds in our analysis.
Industrials Focus
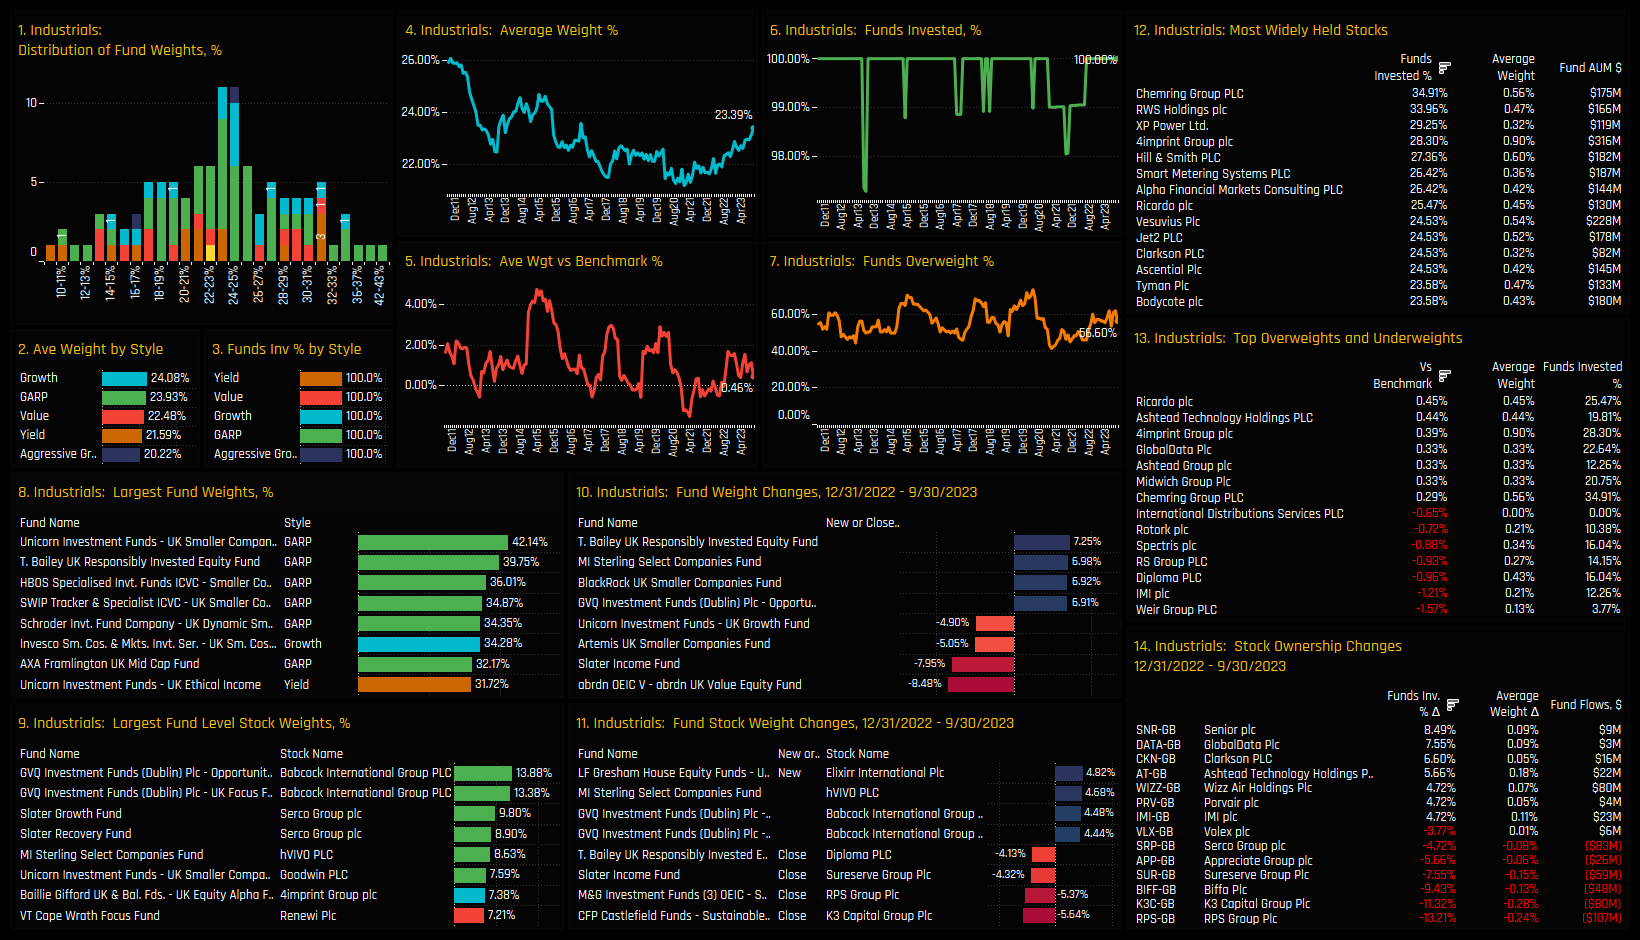
Industrials allocations are on the rise. Year on year increases from a low of 21.3% in early 2021 have propelled Industrials weights to their highest levels in over 5-years (ch4). Allocations are distributed in a roughly ‘normal’ fashion around the mean, with fund weights topping out at 42.1% for the Unicorn UK Smaller Companies Fund. The T. Bailey UK Responsibly Invested Equity Fund have increased allocations by +7.25% this year, making them the 2nd largest holders of Industrials with a 39.75% weight.
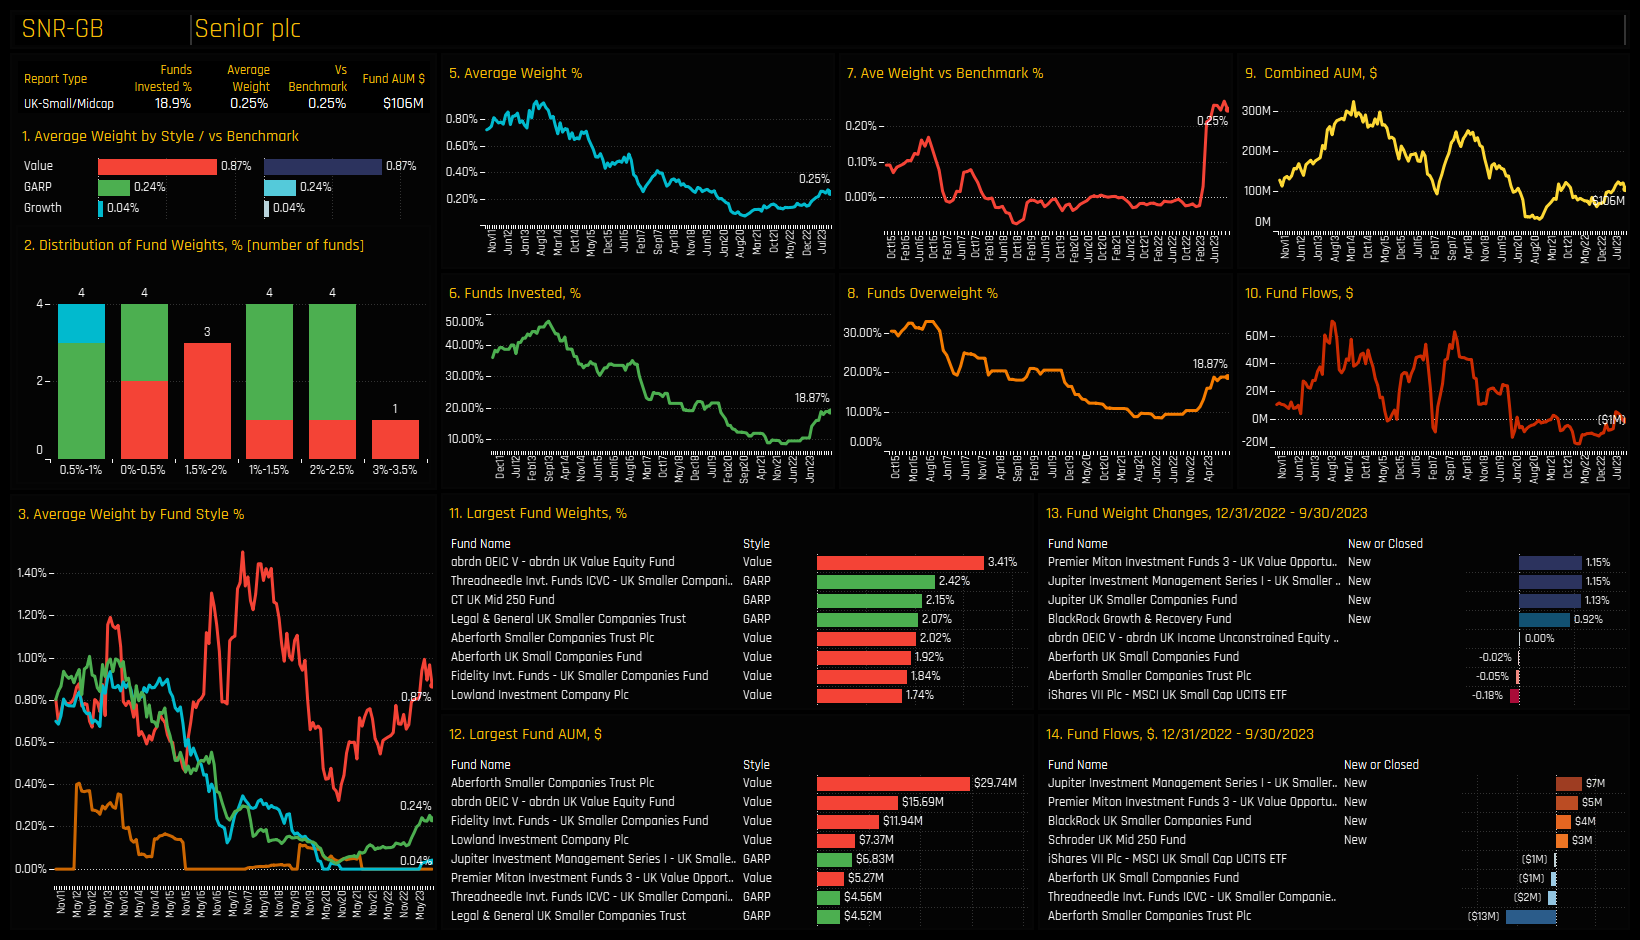
The most widely held stocks in the Industrials sector are Chemring Group and RWS Holdings, owned by 34.9% and 33.9% of funds respectively. Weir Group is notable for it’s lack of investment from UK Small/Midcap funds, with just 3.8% of funds holding a position making it the largest stock underweight compared to the iShares MSCI UK Small Cap ETF (ch13). Stock level activity shows +8.5% of funds opening positions in Senior plc and 7.5% in GlobalData plc, whilst fund closures were led by RPS Group and K3 Capital Group plc.
Industry Positioning
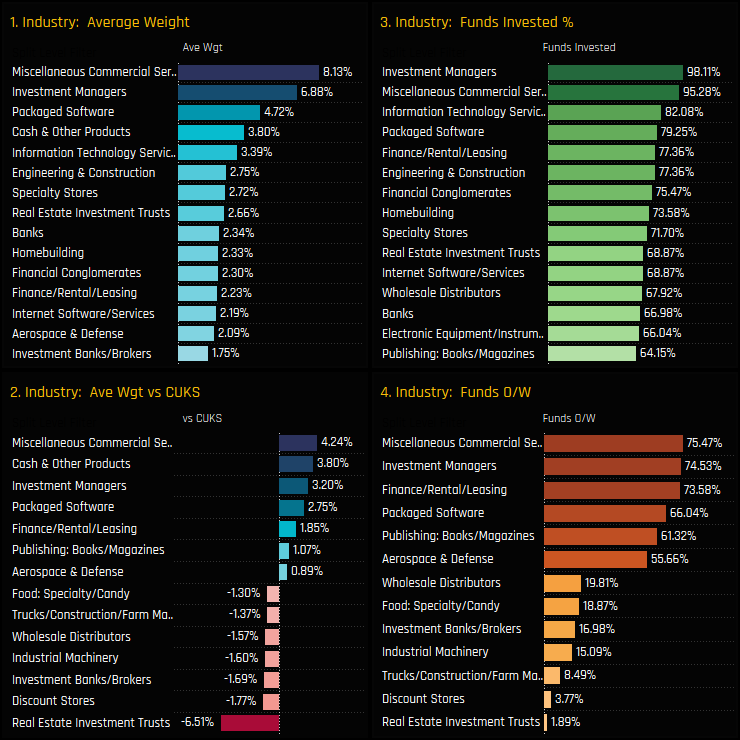
On an industry level, allocations are dominated by Miscellaneous Commercial Services, Investment Managers and Packaged Software, which together account for 19.7% of the average UK Small/Midcap fund (ch1). Miscellaneous Commercial Services and Investment Managers are also the key overweight industry groups, positioned ahead of the benchmark by +4.24% and 3.2% respectively (ch2) and with around three quarters of funds positioned overweight (ch4). Underweights are led by Real Estate Investment Trusts which are held -6.51% below benchmark, with just 1.9% of funds positioned overweight.
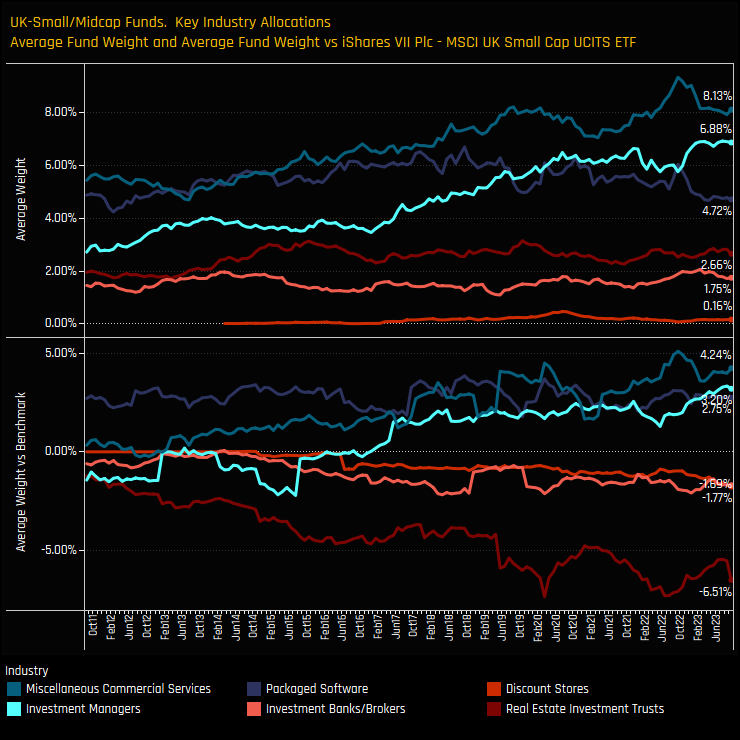
Over the longer-term, Miscellaneous Commercial Services have been the largest industry allocation since 2014, though exposure has drifted from the peak of late 2022. Investment Managers overtook Packaged Software in 2019 and currently command record levels of exposure, both in absolute terms and versus the benchmark. Discount Stores are barely on the radar of UK Small/Midcap investors, with average weights of just 0.16% and a growing underweight versus the benchmark. Investment Banks/Brokers have seen underweights drift lower in recent years, whilst Real Estate Investment Trusts are back towards record levels of net underweight.
Investment Managers Focus
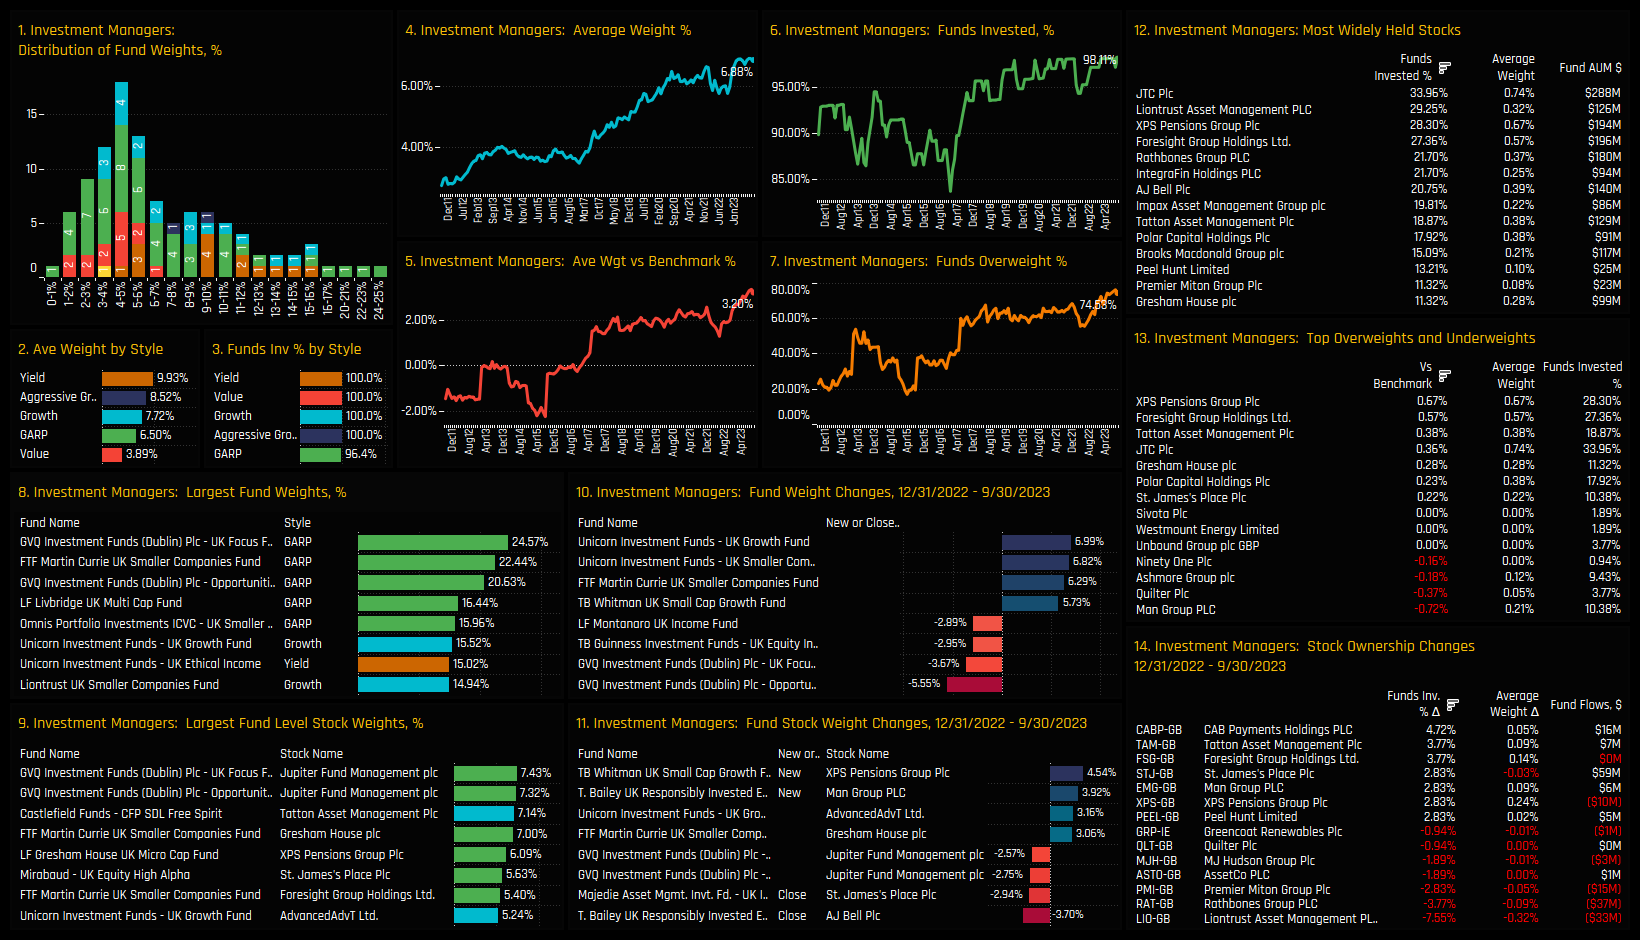
Across all of our ownership time-series metrics displayed in charts 4-7, Investment Managers are close to their peak. A record 74.5% of funds are positioned overweight at a net +3.2% above benchmark. Fund allocations are clustered between 2% and 7% but there are those with a far more bullish stance. GVQ UK Focus leads the way on 24.57%, followed by FTF Martin Currie UK Smaller Companies (22.44%) and GVQ UK Opportunities (20.63%). High conviction positions are led by GVQ in Jupiter Asset Management and Castlefield funds in Tatton Asset Management (ch9).
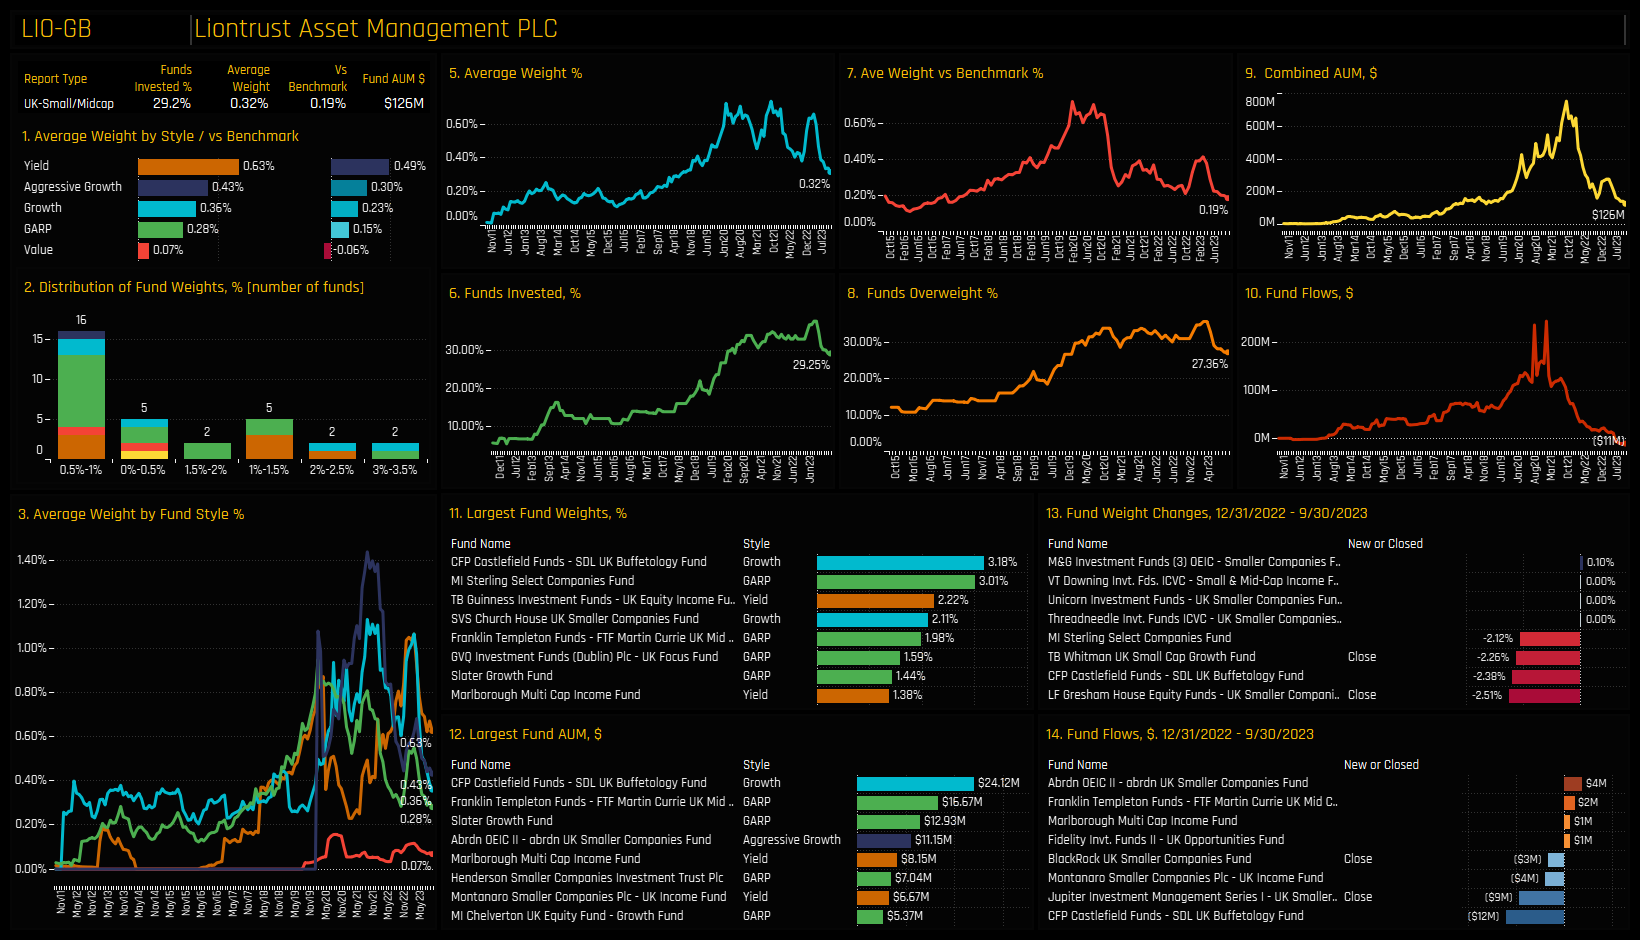
With Investment Managers being a subset of the Financials sector as highlighted above, the same stocks appear as the most widely held in Chart 12. What is more apparent is the clear difference in conviction between likeminded managers such as Liontrust Asset Management, owned by 29.2% of funds and Man Group, owned by just 10.4%. In fact, Man Group plc is the largest underweight stock position compared to the MSCI UK Small Cap ETF. Conviction in Liontrust Asset Management is being tested however, with -7.55% of funds closing exposure over the course of this year.
Real Estate Investment Trust Focus
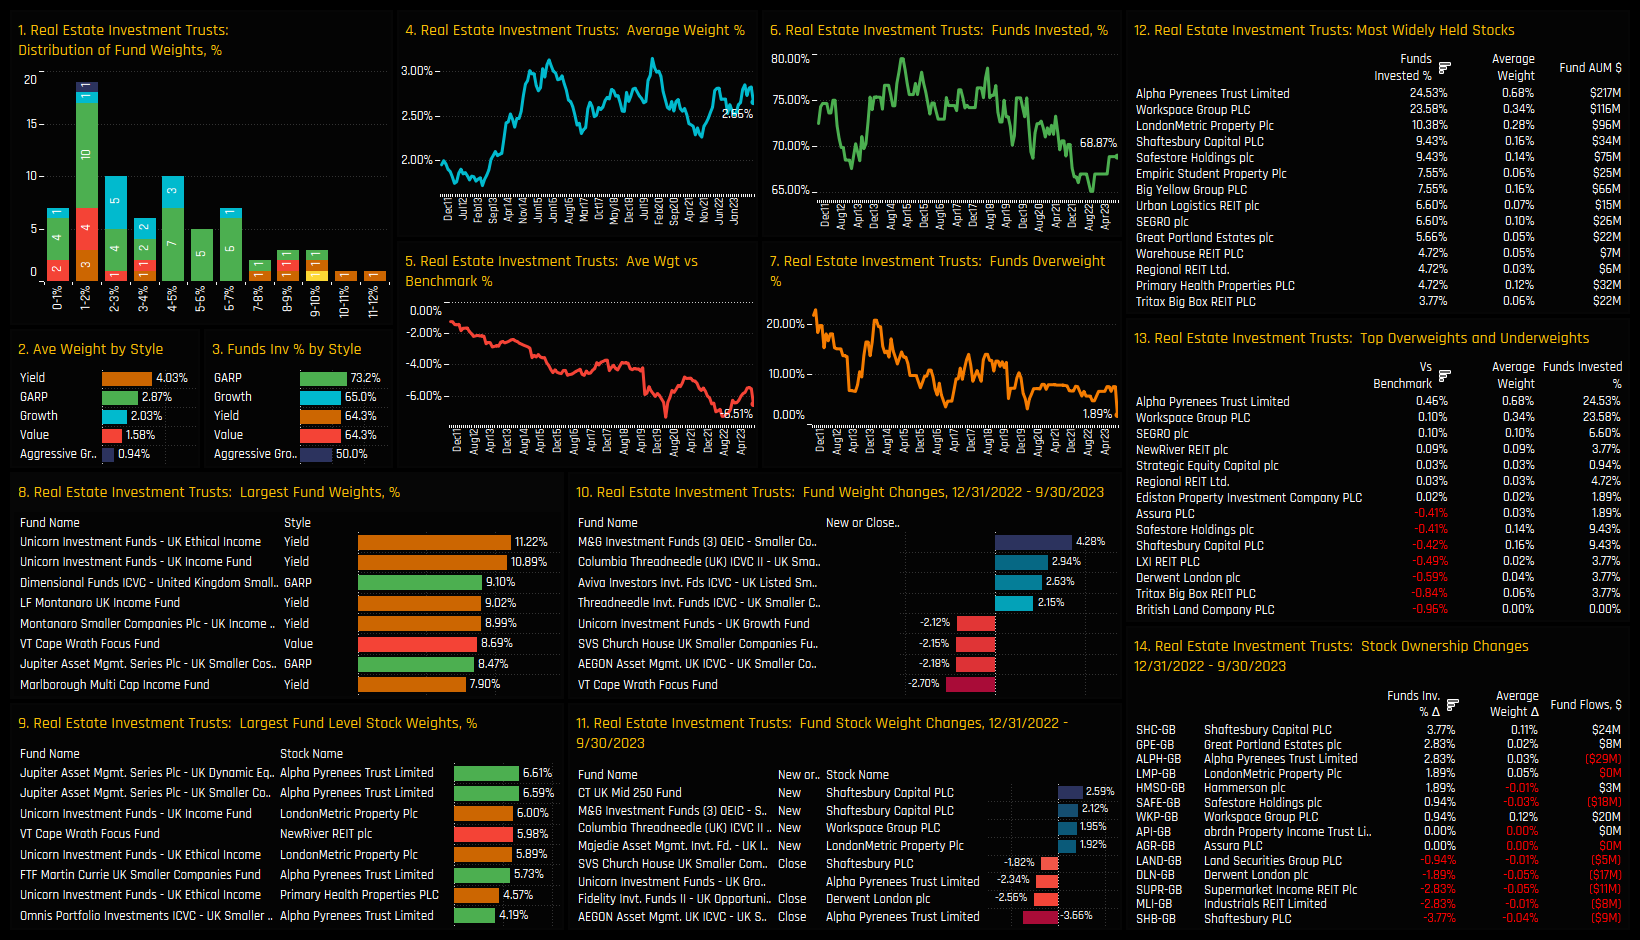
Whilst the Investment Managers Industry group is a clear overweight, Real Estate Investment Trusts are the conviction underweight. Chart 5 shows the net underweight in REITs over time, with today’s level approaching the lowest on record. Part of this is down to the fact that just over 30% of funds hold no exposure to REITs at all (ch6). Typically those that hold exposure do so at sub 5% weights, with selected Yield funds from Unicorn and Montanaro allocating north of 9% (ch8).
Alpha Pyrenees Trust and Workspace Group PLC are the most widely held companies in the sector, with 24.5% and 23.6% of funds holding a position respectively. More notable are the underweights in chart 13, with British Land PLC avoided by every fund in our analysis and Tritax Big Box REIT, Derwent London and LXI Reit owned by just 3.8% of funds each. Combined, these 4 stocks account for -2.4% of the -6.5% REIT sector total underweight.
Stock Positioning
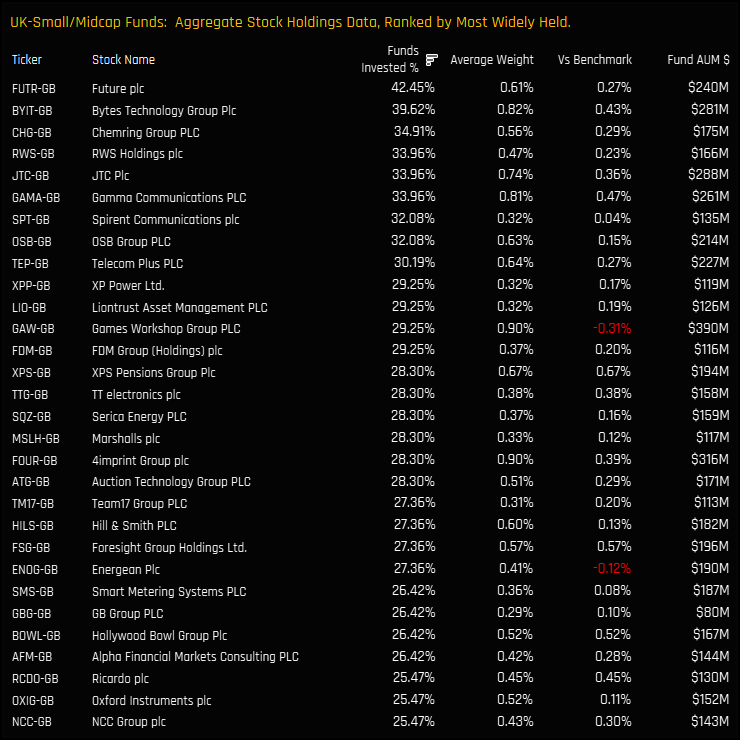
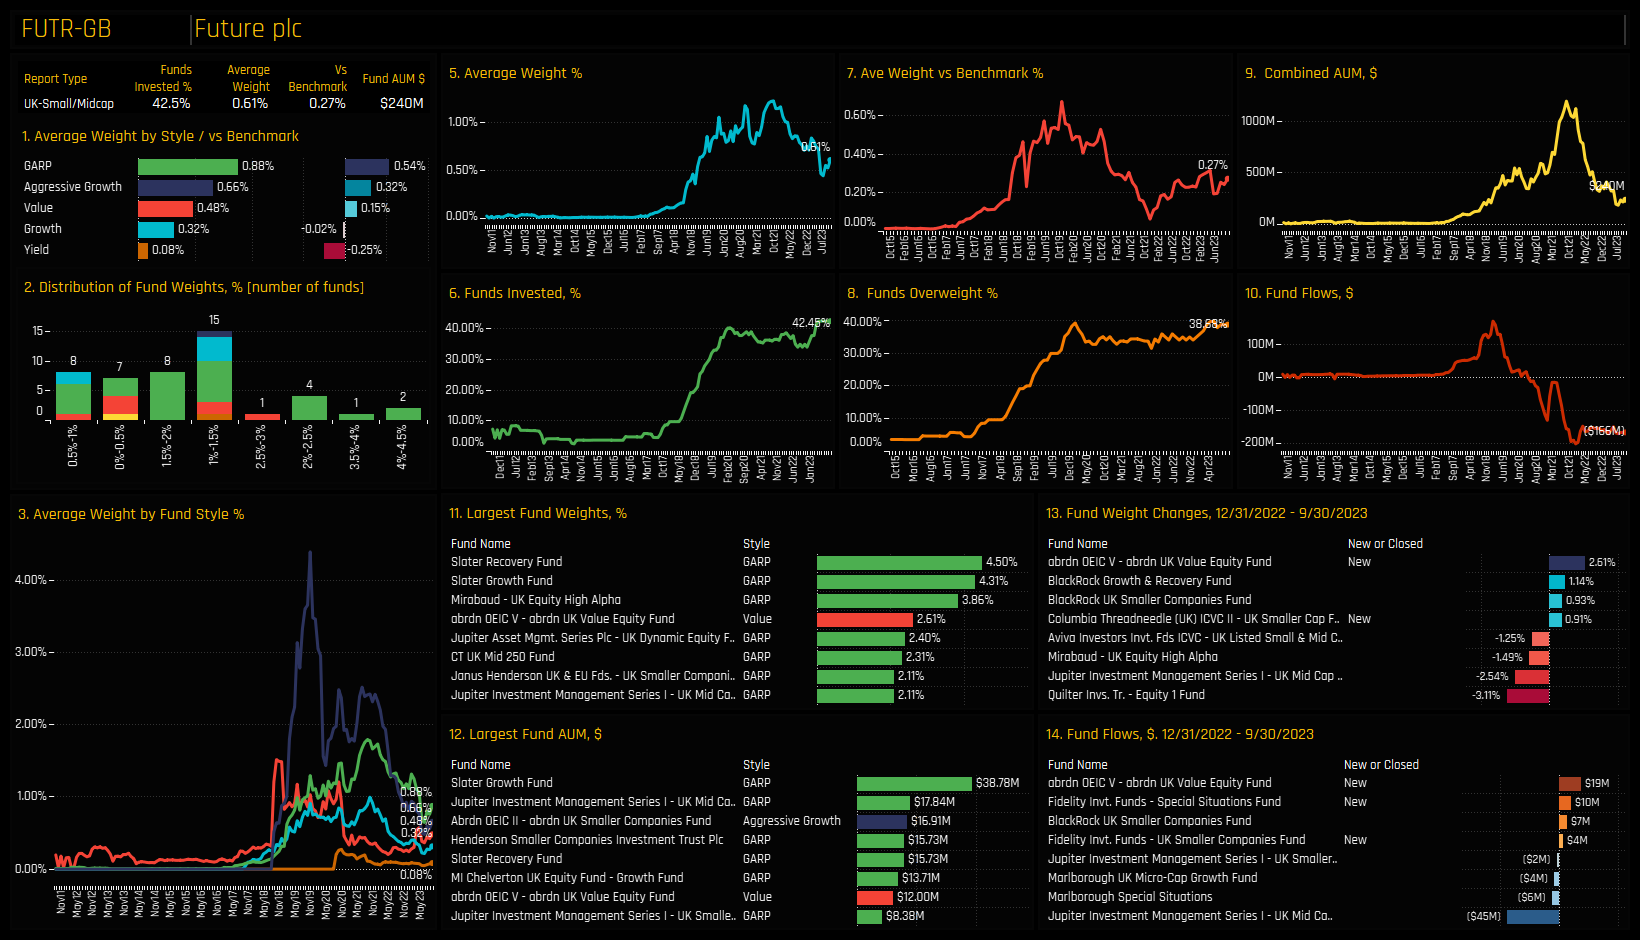
Ignoring the constraints of Sectors and Industry groups, the chart below shows the 30 most widely held companies among UK Small/Midcap funds. They are topped by Future plc, a company owned by 42.45% of funds at an average weight of 0.61%, or overweight the MSCI UK Small Cap ETF by +0.27%. Though held by fewer funds, 4imprint Group, Games Workshop Group and Bytes Technology are held at a higher average weight, indicative of higher conviction among holders.
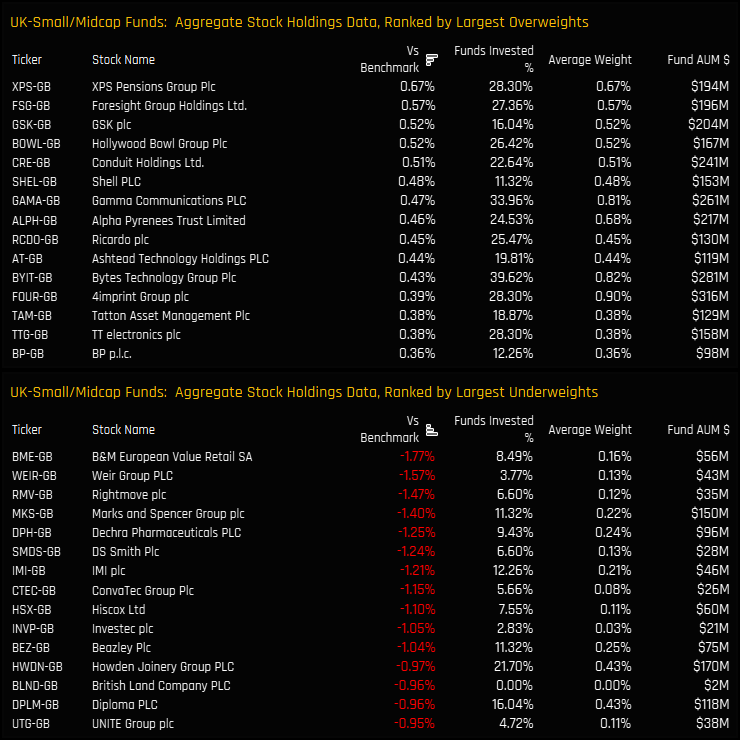
The top 15 overweight stock holdings are highlighted in the top chart below, with XPS Pensions Group and Foresight Group Holdings well owned and at average weights well above the benchmark. Underweights are larger in magnitude, with active UK managers mostly avoiding the large benchmark stocks of B&M European Value Retail, Weir Group plc and Rightmove plc.
Unloved and Most Wanted Stocks
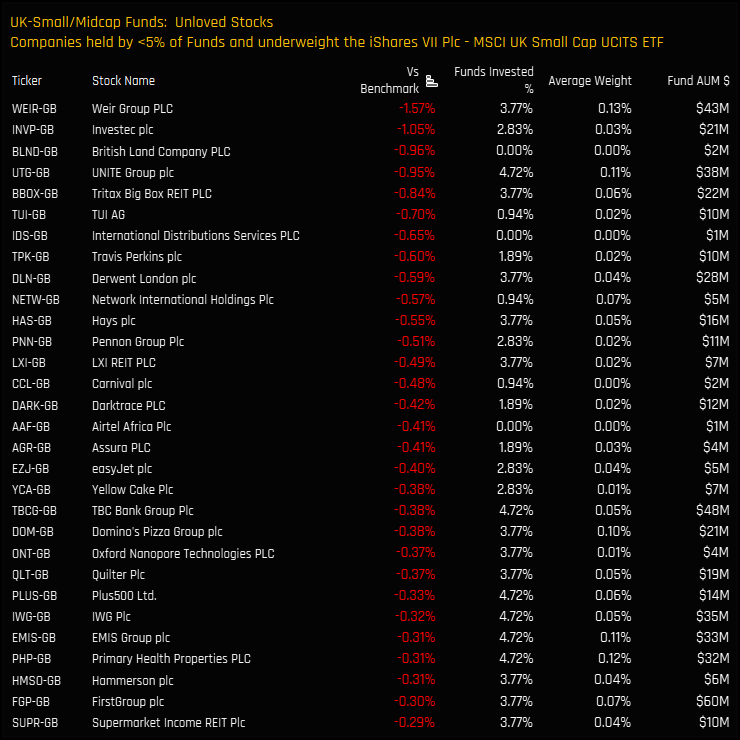
We can look for stocks that are unloved by UK active managers by screening for companies that are held net underweight, and also by less than 5% of the managers in our analysis. The list is headed by Weir Group, Investec plc and British Land Company PLC. There is little appetite from the UK funds in our analysis to own any of the stocks in the list below.
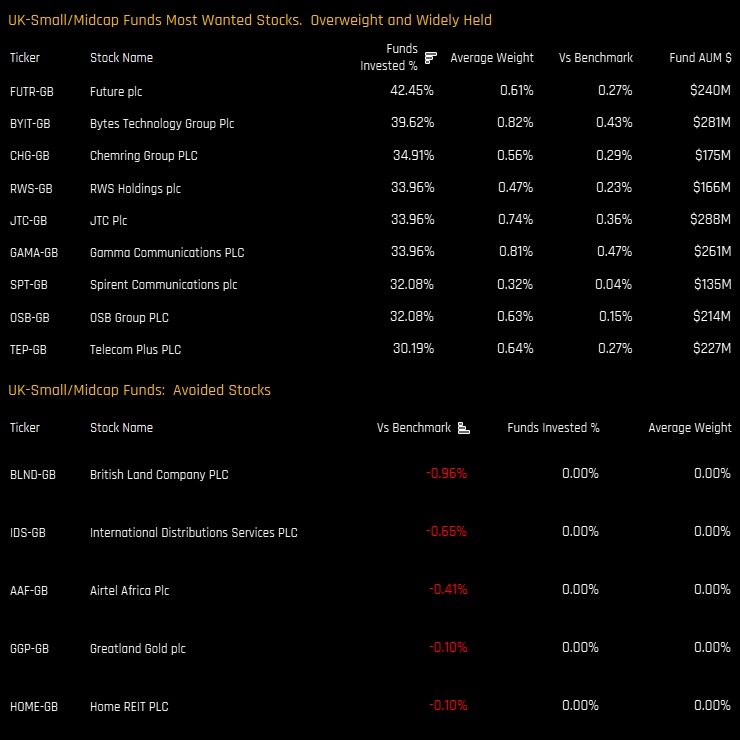
We provide 2 further lists in the charts below. The first a screen for stocks that are well liked by UK Small/Midcap managers. These are companies that are held net overweight and also by more than 30% of the funds in our analysis. The list is headed by Future plc and Bytes Technology and represent the highest conviction companies among UK funds. At the other end of the spectrum, we screen for stocks that are in the MSCI UK Small Cap ETF but have found no investment at all from the UK funds in our analysis. The list is headed by British Land plc, International Distribution Services and Airtel Africa plc.
Stock Activity
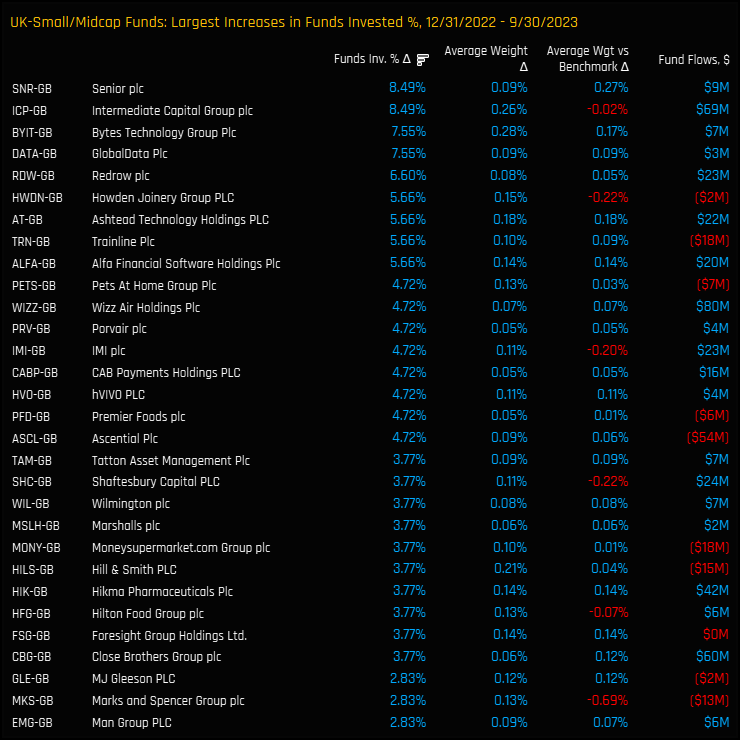
Finally, we look at how stock positioning has changed over the course of 2023. The chart below ranks the companies seeing the largest increases in fund ownership between the reporting dates of 12/31/2022 and 09/30/2023. The list is headed by Senior plc and Intermediate Capital Group plc, both attracting investment from a further +8.5% of the funds in our analysis.
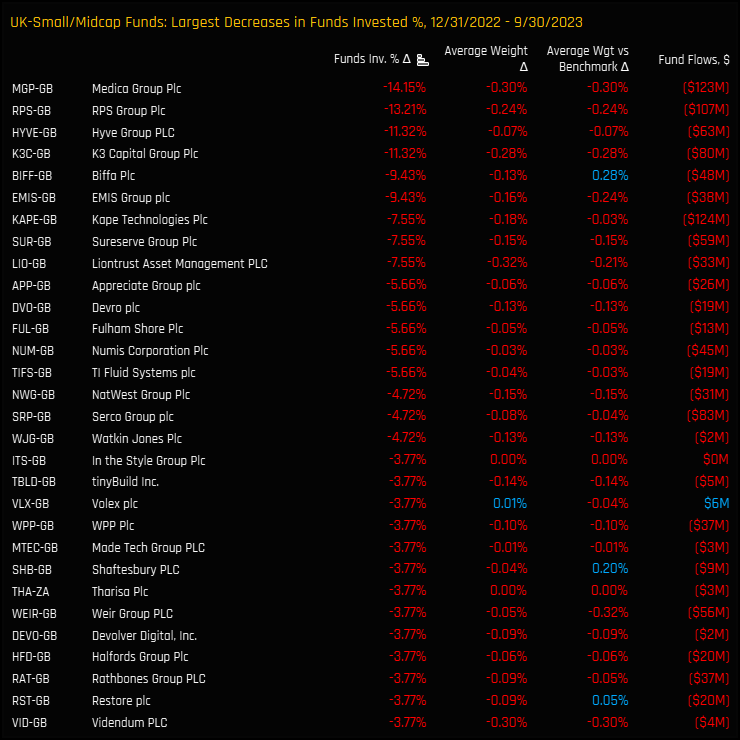
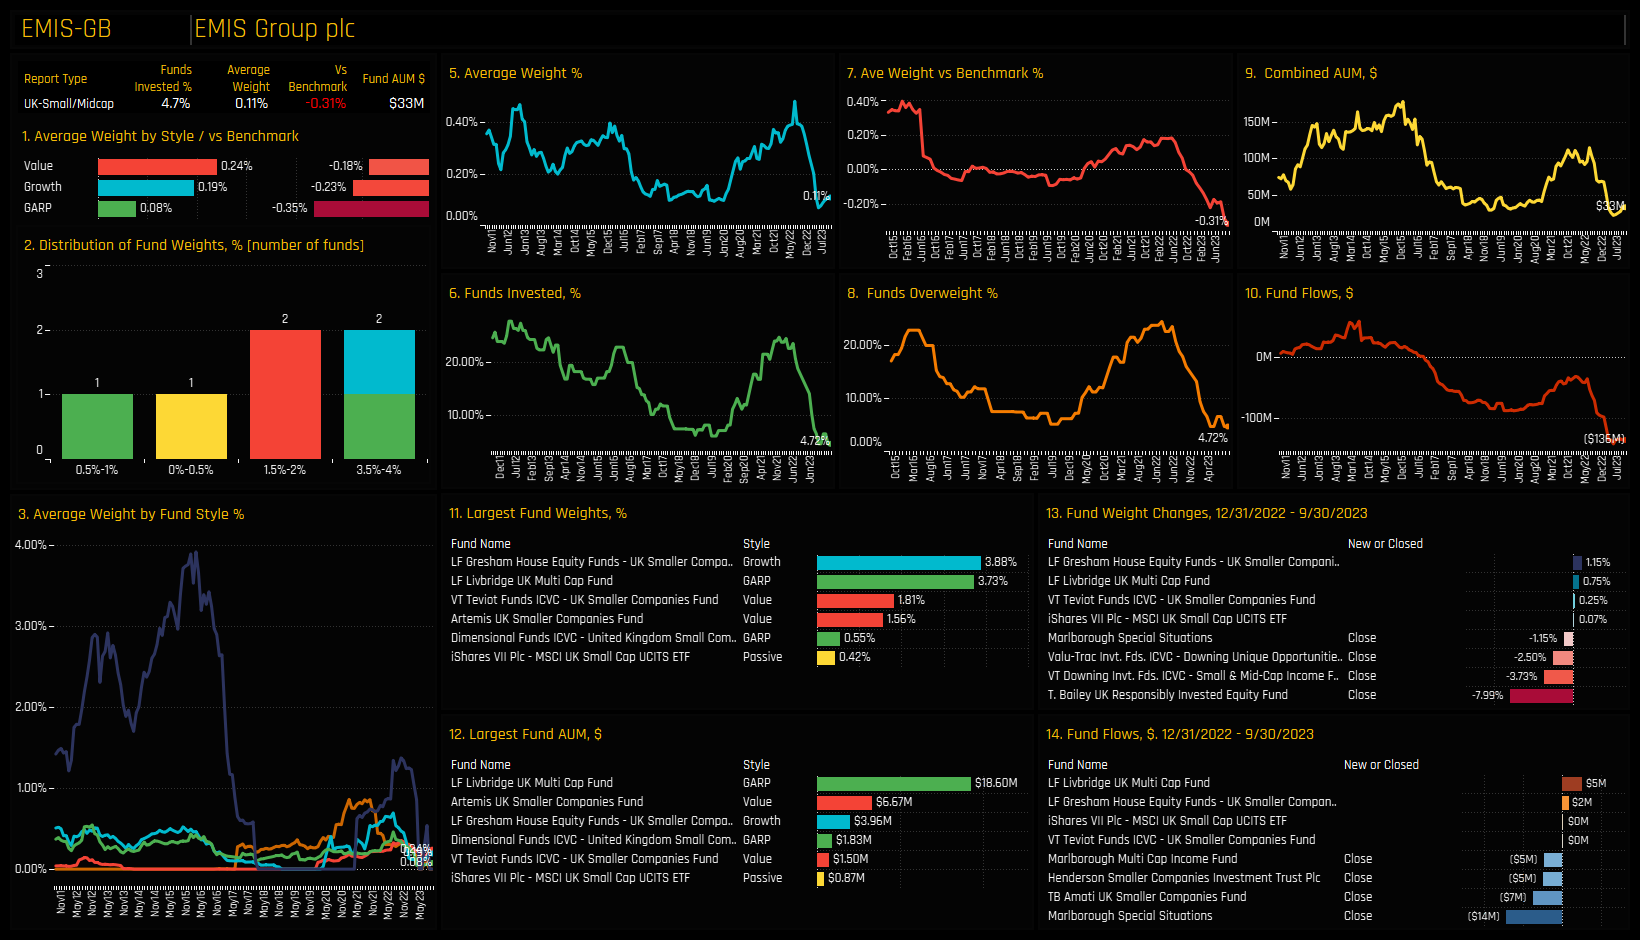
On the negative side, the list below captures a number of delistings such as Medico Group and RPS Group. Among those still on the exchanges, EMIS Group and Liontrust Asset Management stand out, losing investment from -9.43% and -7.55% of funds respectively over the course of 2023.
Stock Profiles and Links
Please click on the link opposite for the full data report on positioning among active UK Small/Midcap equity funds. Scroll down for profiles of 4 key stocks from the analysis.
For more analysis, data or information on active investor positioning in your market, please get in touch with me on steven.holden@copleyfundresearch.com