In this report, we provide an overview of 2022 performance among the UK active funds in our analysis. We look at annual performance broken down by Style and Market Cap focus, together with longer-term analysis of active versus passive. We then identify the drivers behind 2022 performance based on the average active UK fund stock portfolio versus the SPDRs FTSE All Share ETF (FTAL).
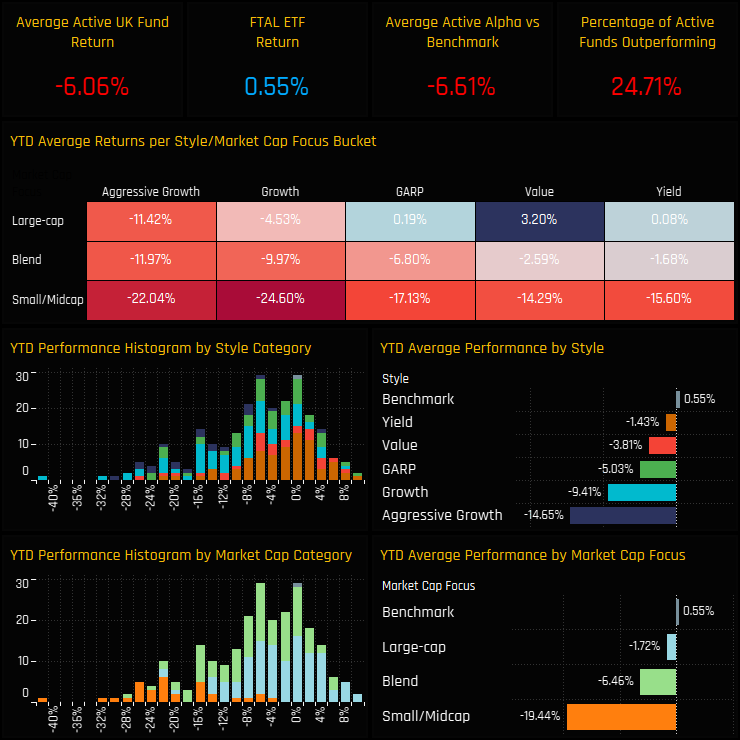
2022 was an Annus Horribilis for UK equity managers. Average fund returns came in at -6.06%, underperforming the SPDRs FTSE All Share ETF (FTAL) by -6.61% with just over three quarters of the 273 strategies in our analysis underperforming the index. Returns were almost perfectly correlated to Style (Value over Growth) and Market Cap Focus (Large-Cap over Small/Midcap).
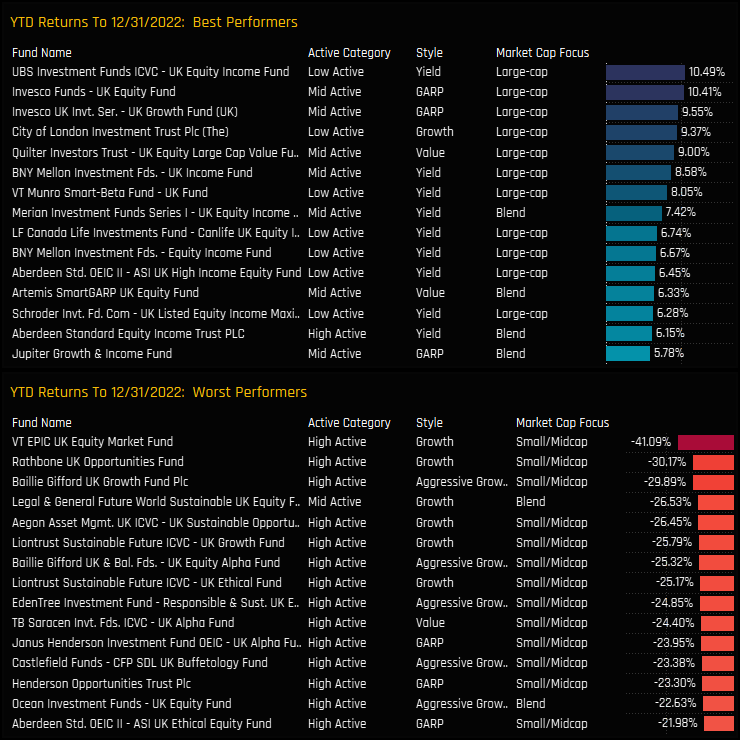
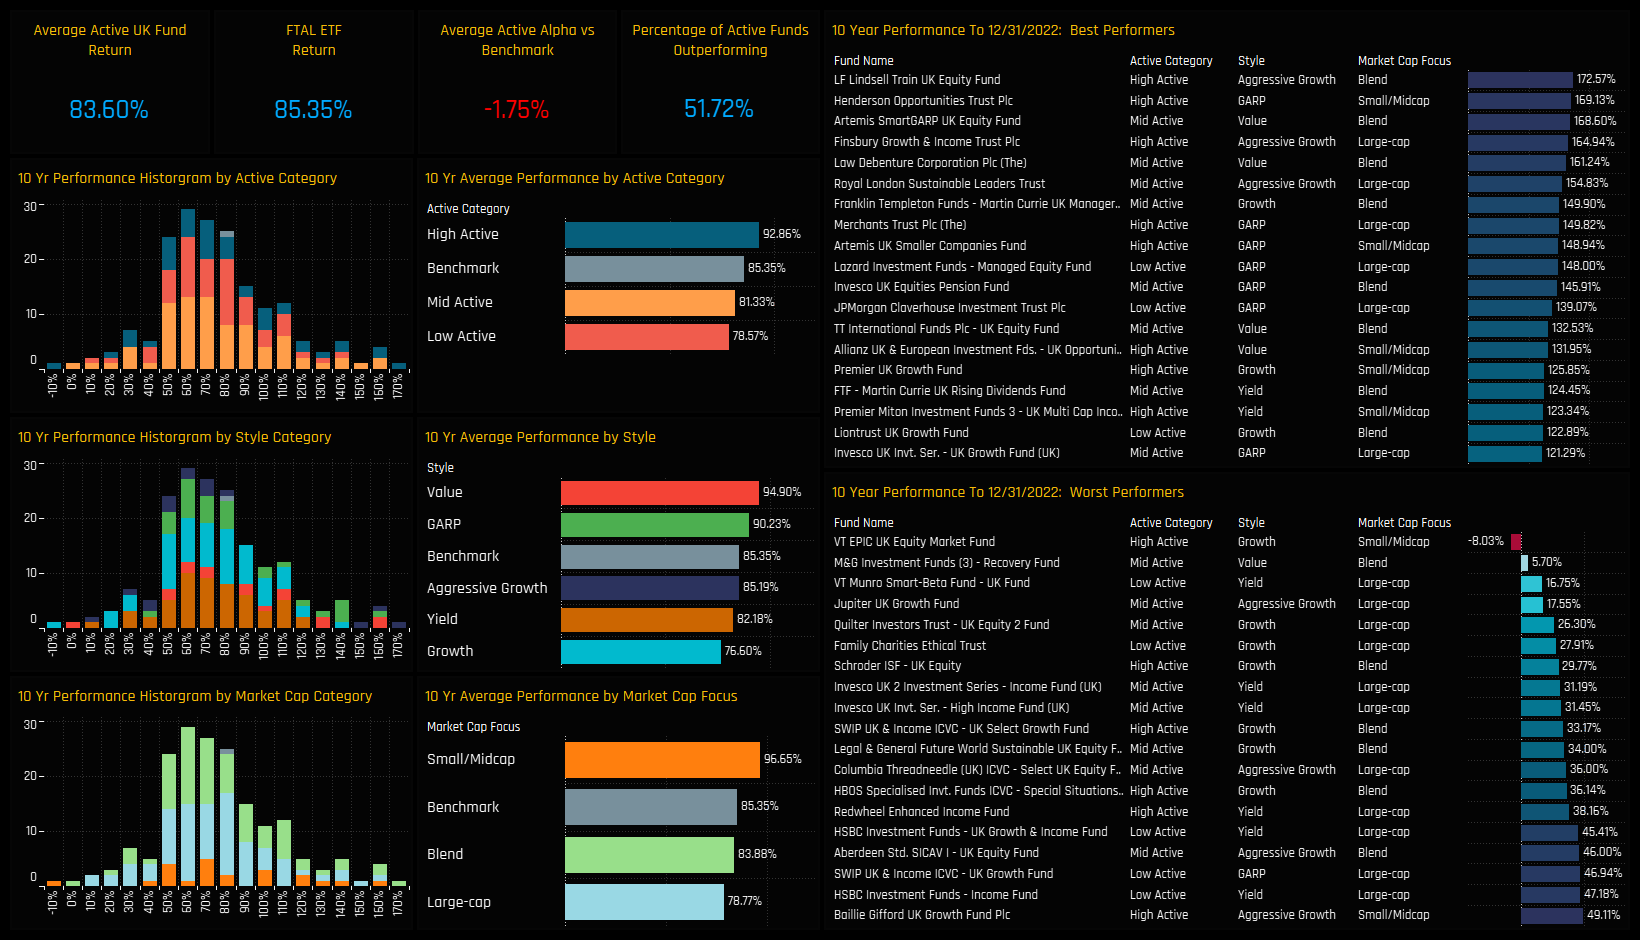
The top and bottom performers on the year are listed below. Value, GARP and Yield strategies dominate the top 20, led by UBS UK Equity Income (10.5%) and Invesco UK Equity (10.4%), whilst Small/Midcap strategies occupy the list of underperformers.
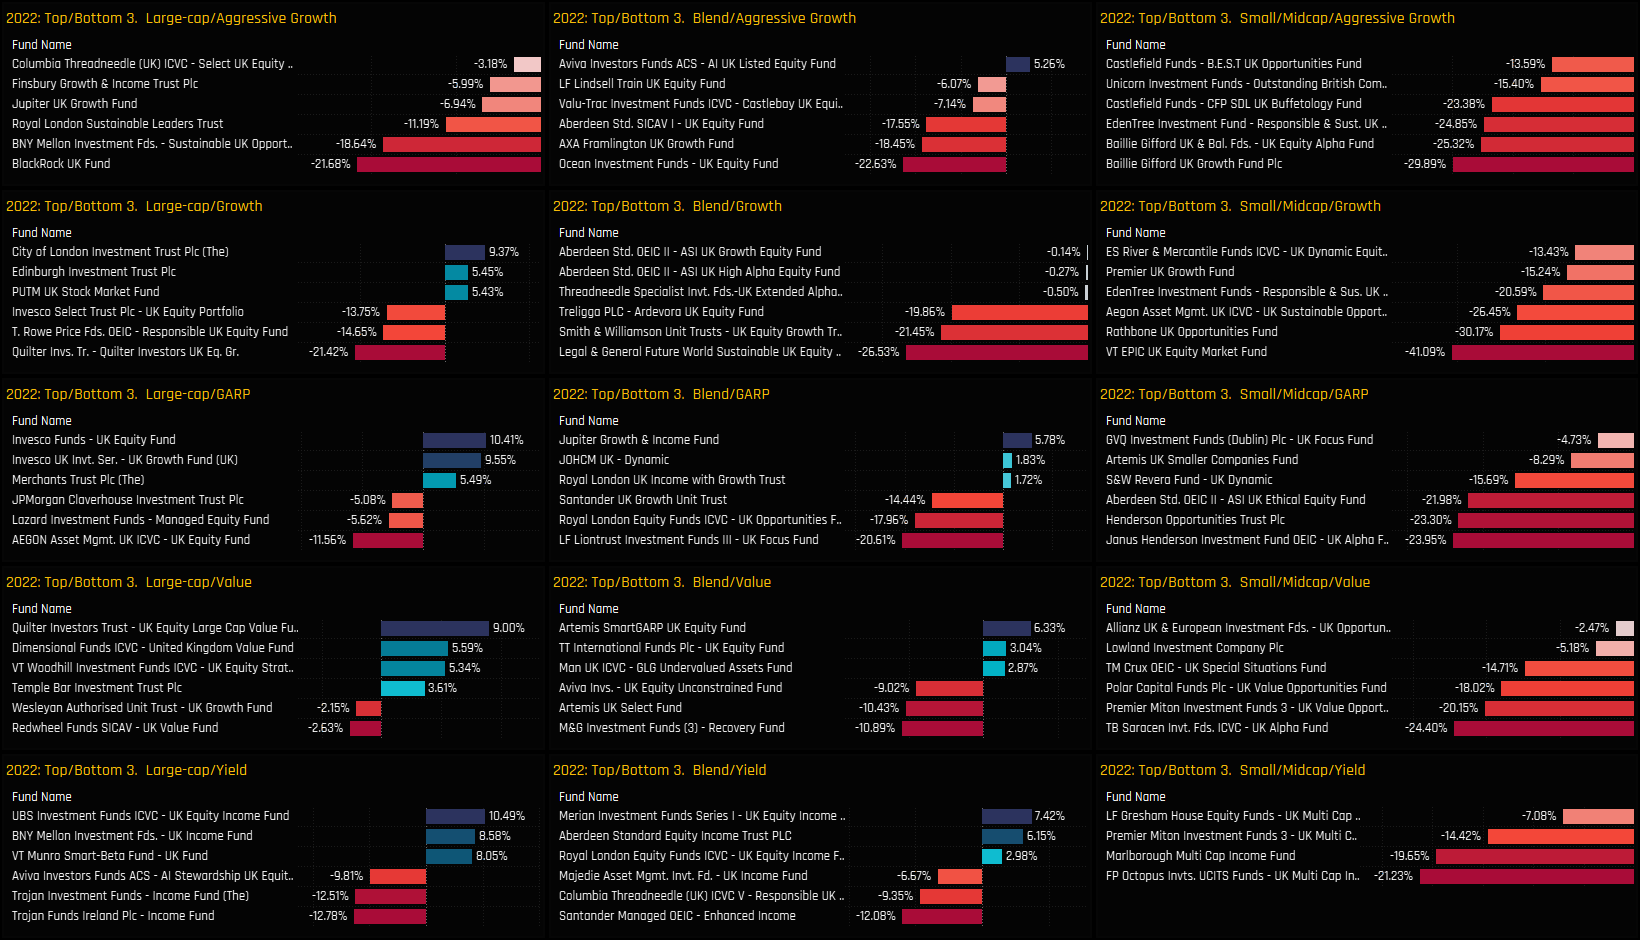
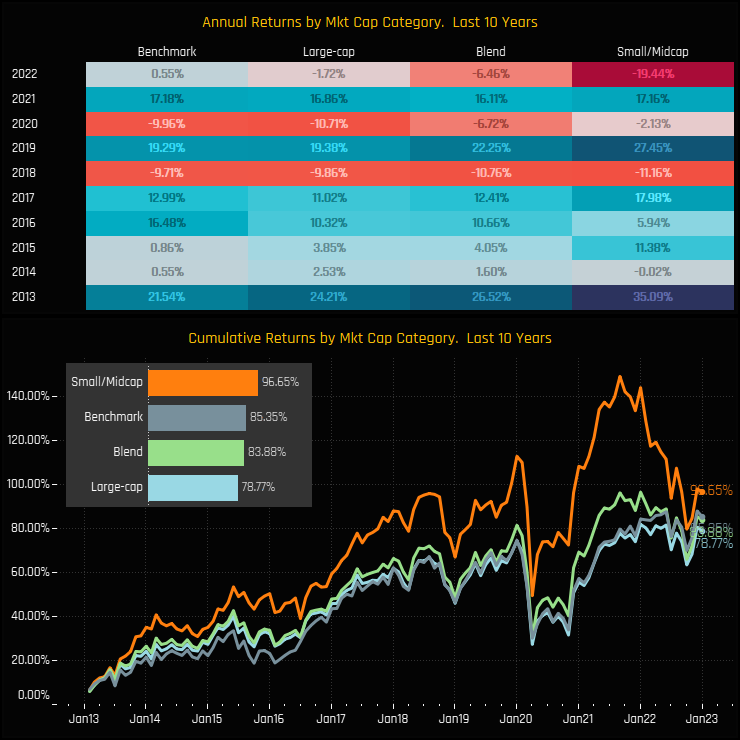
Returns by Style & Market Cap Focus
The grid below shows the top 3 and bottom 3 performers in each Style and Market Cap bucket
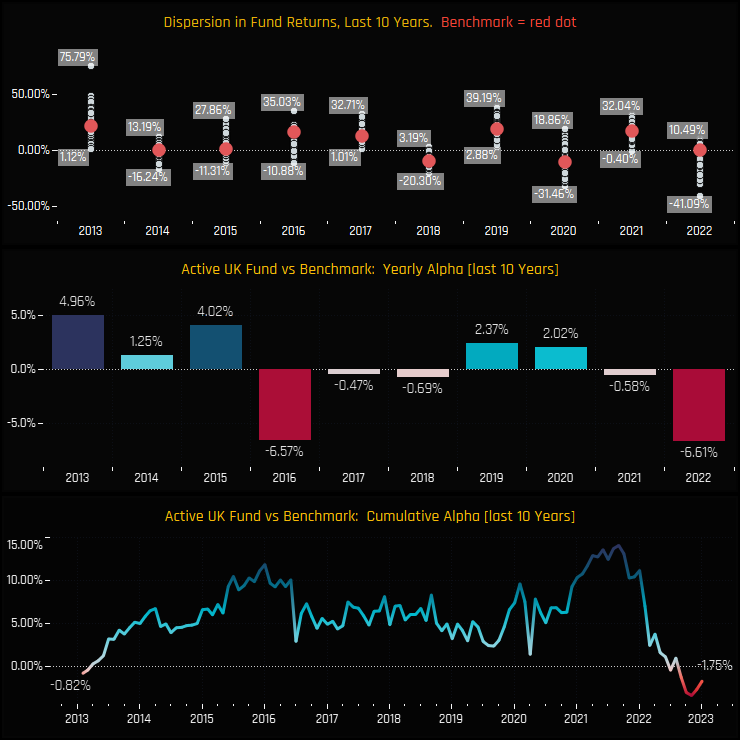
Time-Series Active v Passive
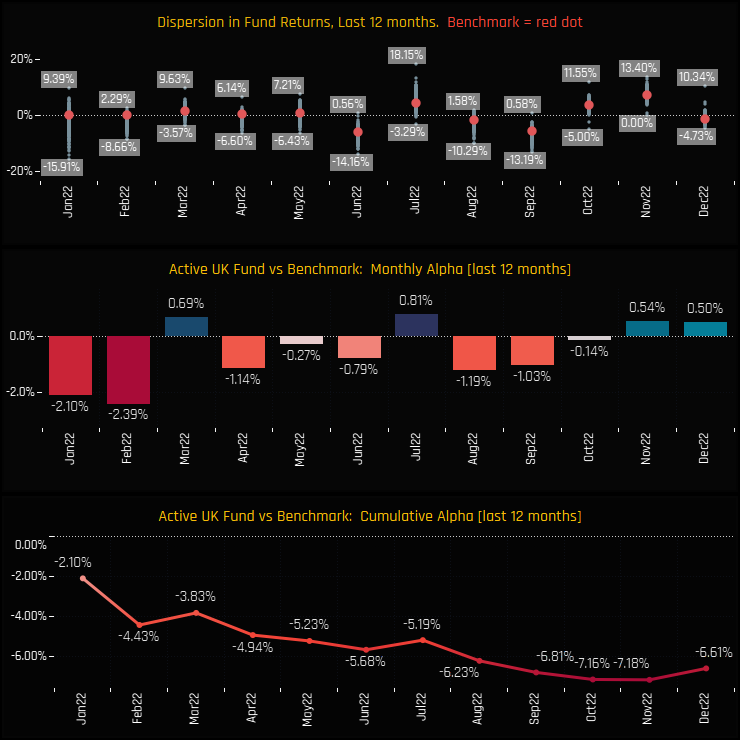
Versus the benchmark, UK managers were doomed from the start of 2022, with -4.43% of underperformance generated in January and February. Only 4 of the last 12 months generated outperformance versus the SPDRs FTSE All Share ETF.
This makes 2022 the worst performing year in a decade when compared to benchmark, completely wiping out the hard-earned outperformance up until 2021. Active UK managers now sit -1.75% behind the benchmark on average, over the last decade.
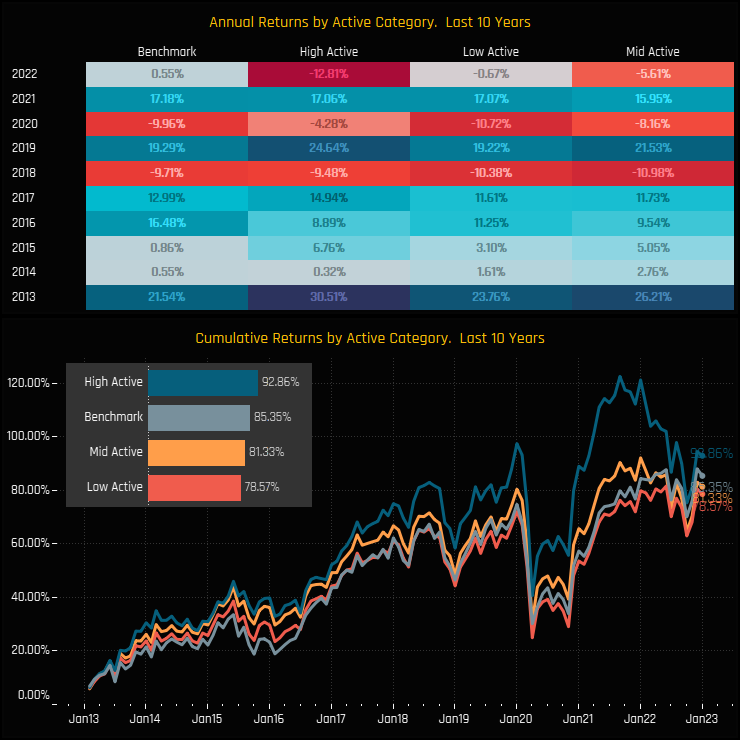
Performance by Style and Active Category
The charts below show the average annual performance (top) and cumulative performance (bottom) split by fund Style over the last decade. Despite the underperformance of Small/Midcap funds last year, over the longer term they remain the top performers and the only Style group to outperform the FTAL ETF.
Fund performance split by active category provides evidence that an active approach is the way to go in the UK. High Active funds (active shares >75%) appear to have an advantage, outperforming the SPDRs FTAL ETF by 7.5% over the last decade. Benchmark hugging in the UK has not yielded favorable results.
10-Year Performance Summary
Contribution & Attribution Analysis
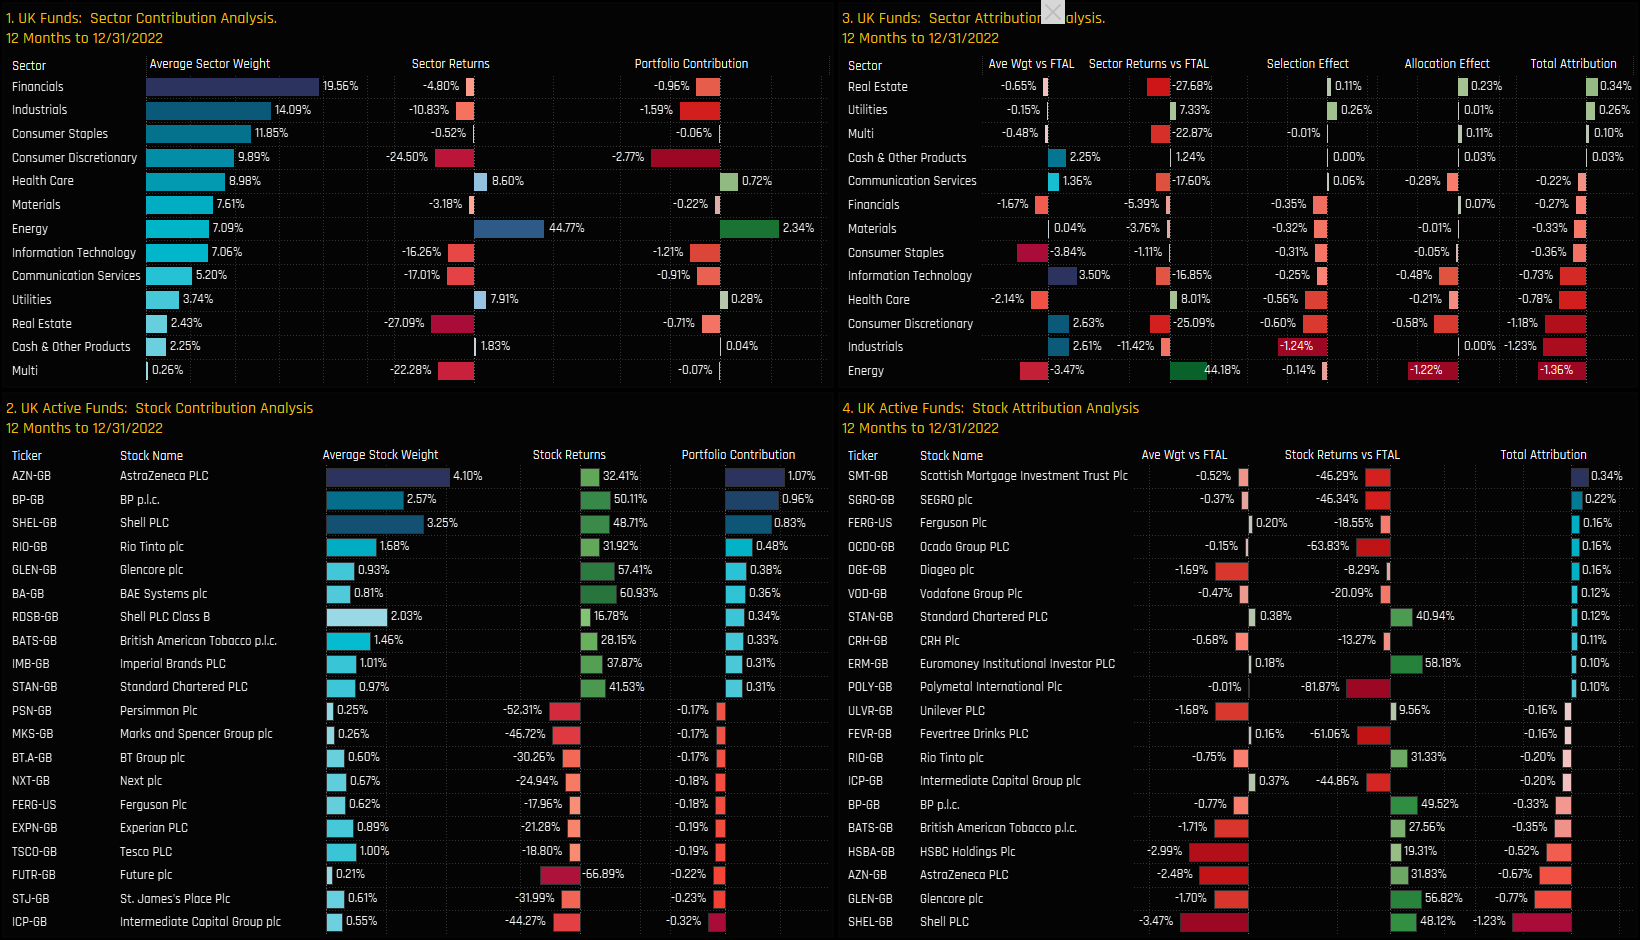
We now look at the drivers behind last year’s absolute and relative performance. We do this by creating a portfolio based on the average allocations of the 273 active strategies in our analysis. This theoretical portfolio, with no fees and based on monthly holding observations returned -5.12% on the year (in line with the actual fund performance above). On a sector level, -2.77% of this was driven by Consumer Discretionary holdings (ch1), -1.59% by Industrials and -1.21% by Tech. Energy, the star performer in 2022 generated +2.35% towards portfolio returns in 2022. On a stock level, AstraZeneca, Shell and BP were the key drivers of positive returns, whilst exposure to Intermediate Capital Group, St. James Place and Future plc dragged on returns (ch2).
To understand where last year’s underperformance came from, we measure the attributes of this portfolio versus a representation of the benchmark based on the SPDRs FTSE All Share ETF (FTAL). The active portfolio underperformed by -5.51% in 2022, driven by underweights in Energy, overweights in Consumer Discretionary and Tech, together with poor stock selection in the Industrials sector (ch3). On a stock level, underweights in Shell, Glencore, AstraZeneca, HSBC and British American Tobacco were the key drivers of underperformance, losing a combined 3.5% of performance versus the benchmark (ch4). Of the few positives, underweights in Real Estate, together with overweights in Standard Chartered and Euromoney generated some outperformance. On the whole though, very little worked for active UK managers in 2022. Roll on 2023!


