Investment levels among the hundreds of stocks in the investible UK universe differ greatly. Some stocks are widely owned, others largely avoided with ownership levels changing every month. We combine current and historical positioning against shorter-term manager activity to get a handle on where sentiment lies for every stock in the UK market. We highlight 8 stocks at the extreme ends of their own positioning ranges whilst also seeing significant changes in fund ownership.
The Sentiment Grid
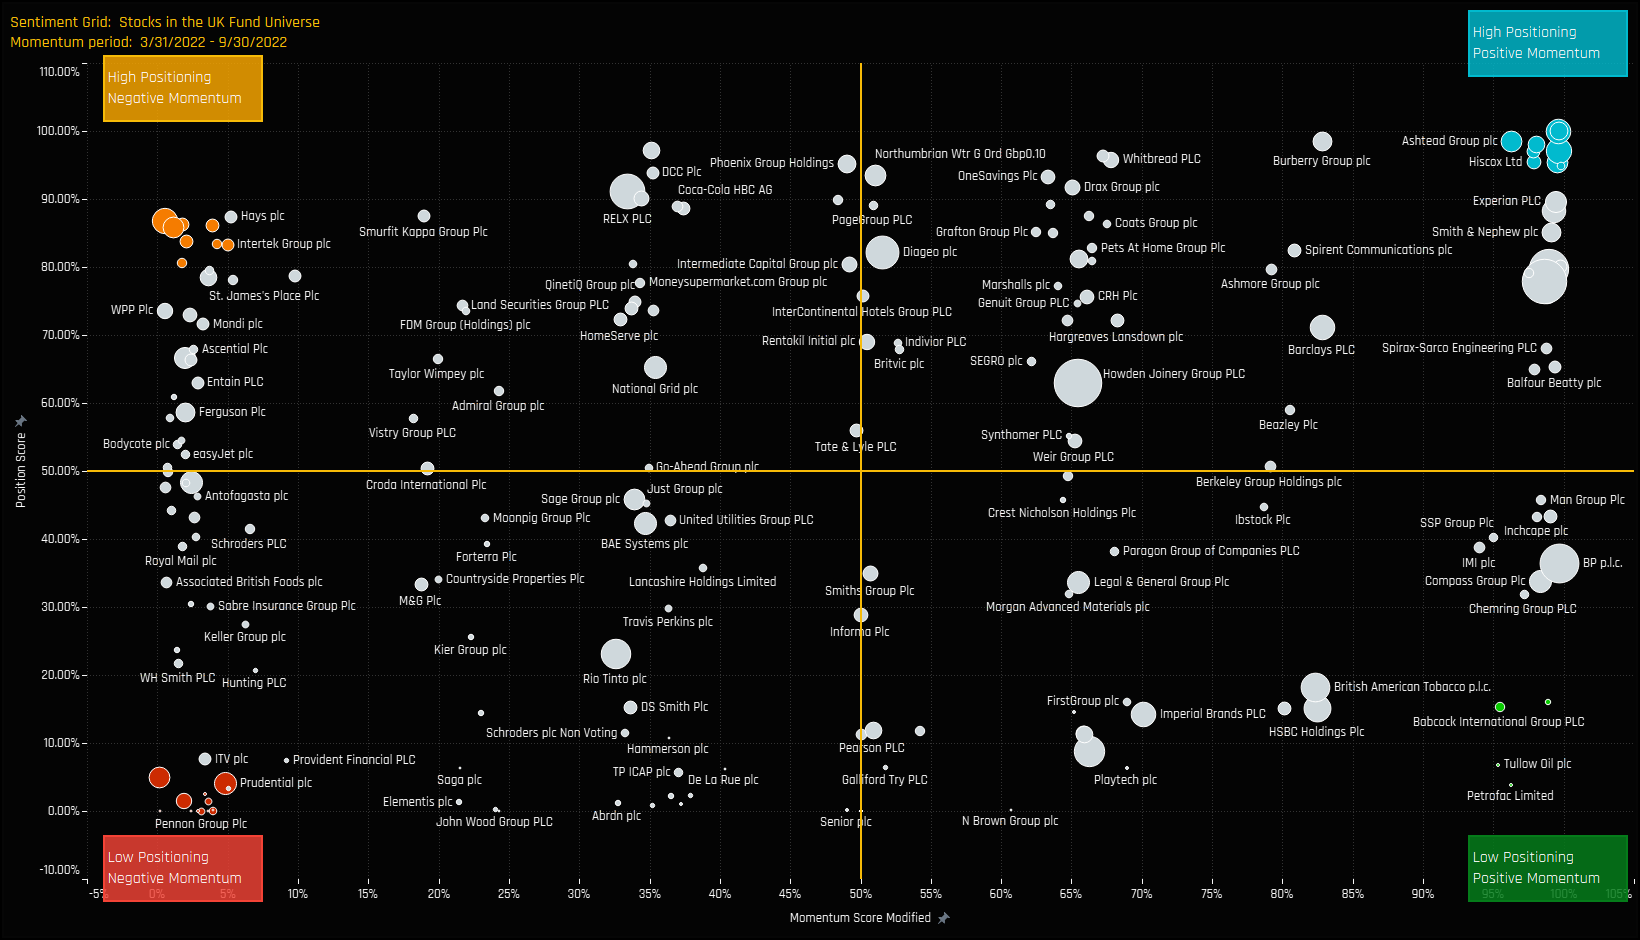
The Sentiment Grid below is designed to visualize the interplay between current fund positioning, long-term fund positioning and shorter-term fund manager activity for all stocks in the UK active fund universe. The Y-axis shows the ‘Position Score’, a measure of current positioning in each stock compared to its own history going back to 2011 on a scale of 0-100%. It takes in to account the percentage of funds invested in each stock versus history, the average fund weight versus history and the percentage of funds overweight the benchmark versus history. The higher the number, the more heavily a stock is owned by active UK managers compared to its own history.
The X-Axis shows the ‘Momentum Score’, a measure of fund manager activity for each stock between 03/31/2022 and 09/30/2022 on a scale of 0% (maximum negative activity) to 100% (maximum positive activity). The Momentum Score takes in to account the change in the percentage of funds invested in each stock over the period, the change in average weight and the change in the percentage of funds overweight. The chart also highlights the companies at the extreme ends of each quadrant by colour, which will shall explore in more detail below.
Extreme Stocks
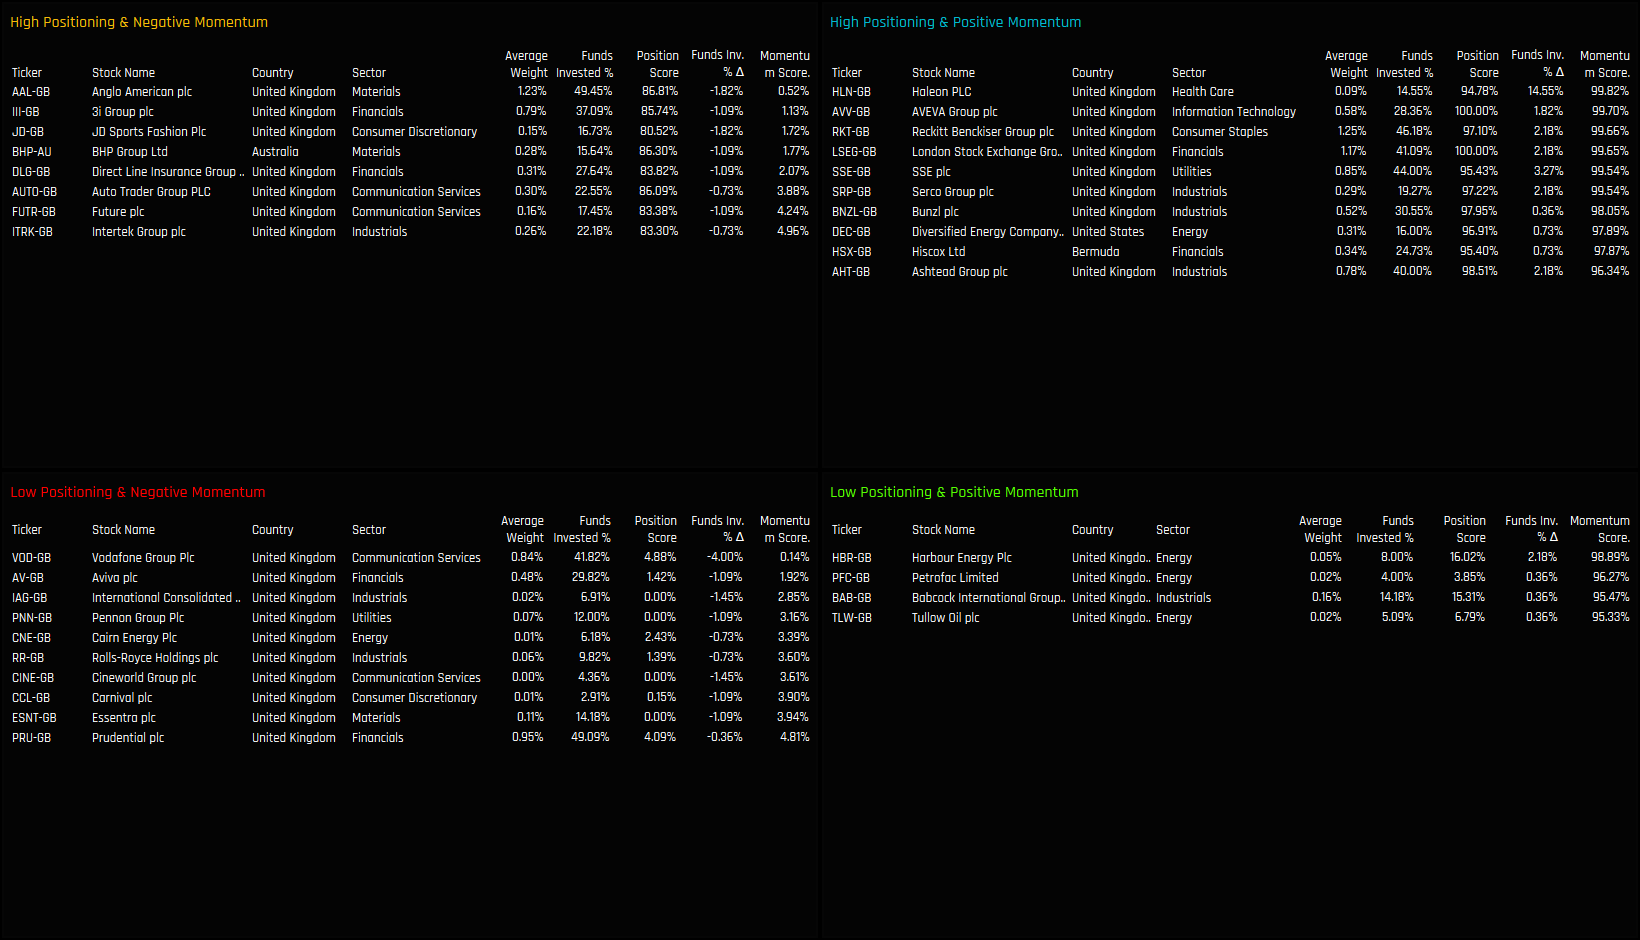
The tables below list the stocks in the extreme corners of each quadrant. The screening methodology is as follows:
High Positioning & Negative Momentum: Position Score > 80%. Momentum Score < 5%
High Positioning & Positive Momentum: Position Score > 90%. Momentum Score > 95%
Extreme Stocks
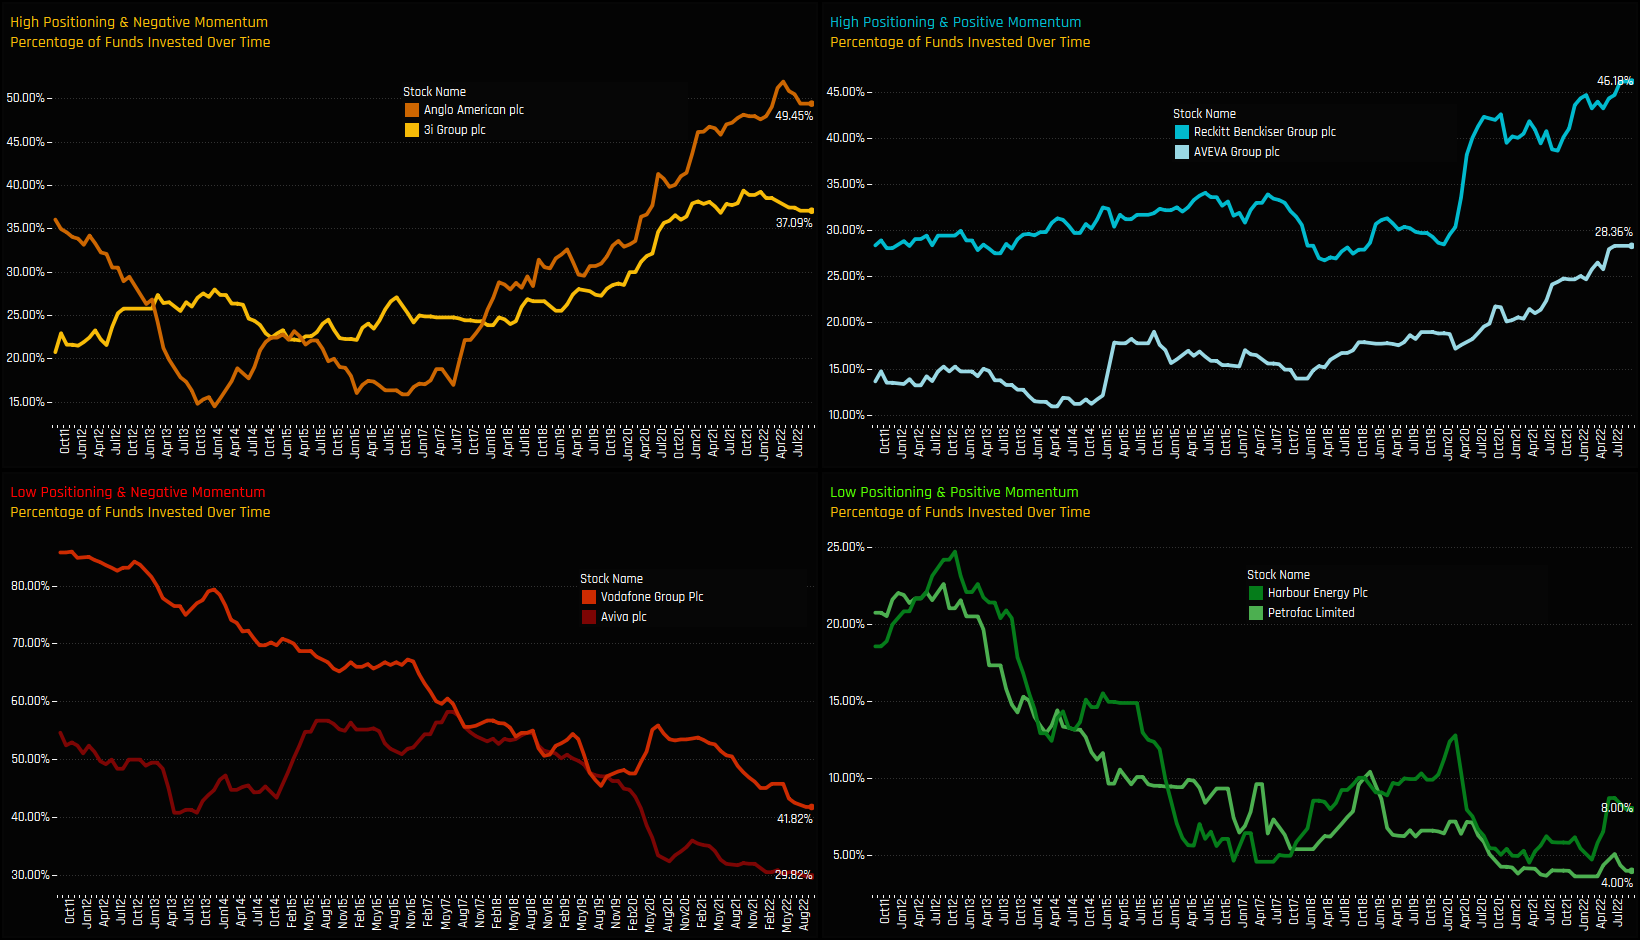
The charts below track the percentage of active funds invested in each of the top 2 stocks across the 4 categories. It’s another way to visualize how the Sentiment Grid works. For example, the top-left chart shows 3i Group and Anglo American seeing fund ownership reversing from peak levels after sustain multi-year growth. In the bottom-left chart, both Aviva plc and Vodafone Group used to be owned by over 50% and 80% of managers respectively, but have since seen ownership drop to their lowest levels in the last decade.
In the opposite case (bottom right), both Harbour Energy and Petrofac Limited are at the bottom of their historical ownership ranges but both have started to climb from the lows. Top right shows Reckitt Benckiser Group and AVEVA Group at peak ownership after sustained increases in fund ownership in recent months. In the charts that follow we provide more detailed profiles of each of the 8 stocks at the extreme corners of our Sentiment Grid.
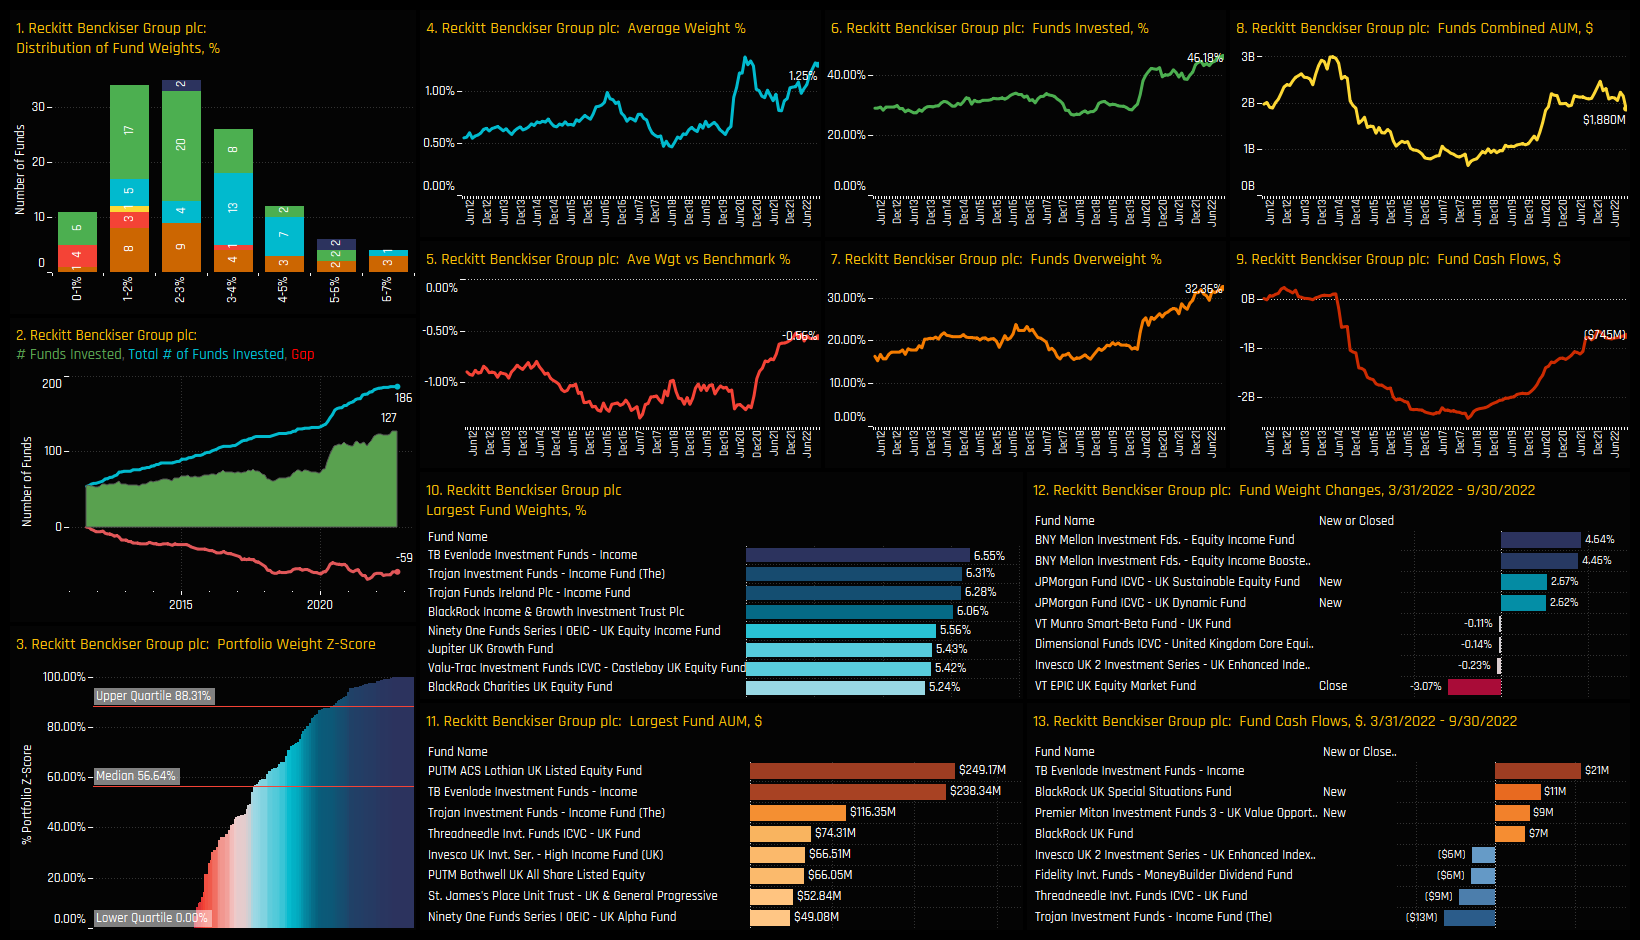
High Positioning, Positive Momentum: Reckitt Benckiser Group
Ownership among active UK funds hit fresh highs this month, with a record 46.18% of the 275 funds in our analysis holding a position in the stock. Over the last 6-months, new positions from JP Morgan Sustainable Equity (+2.67%) and JP Morgan UK Dynamic (+2.62%) have driven ownership levels higher, with sizeable positions from TB Evenlode UK Income (6.55%) and Trojan UK Income Fund (6.31%) reflecting high conviction among selected managers.
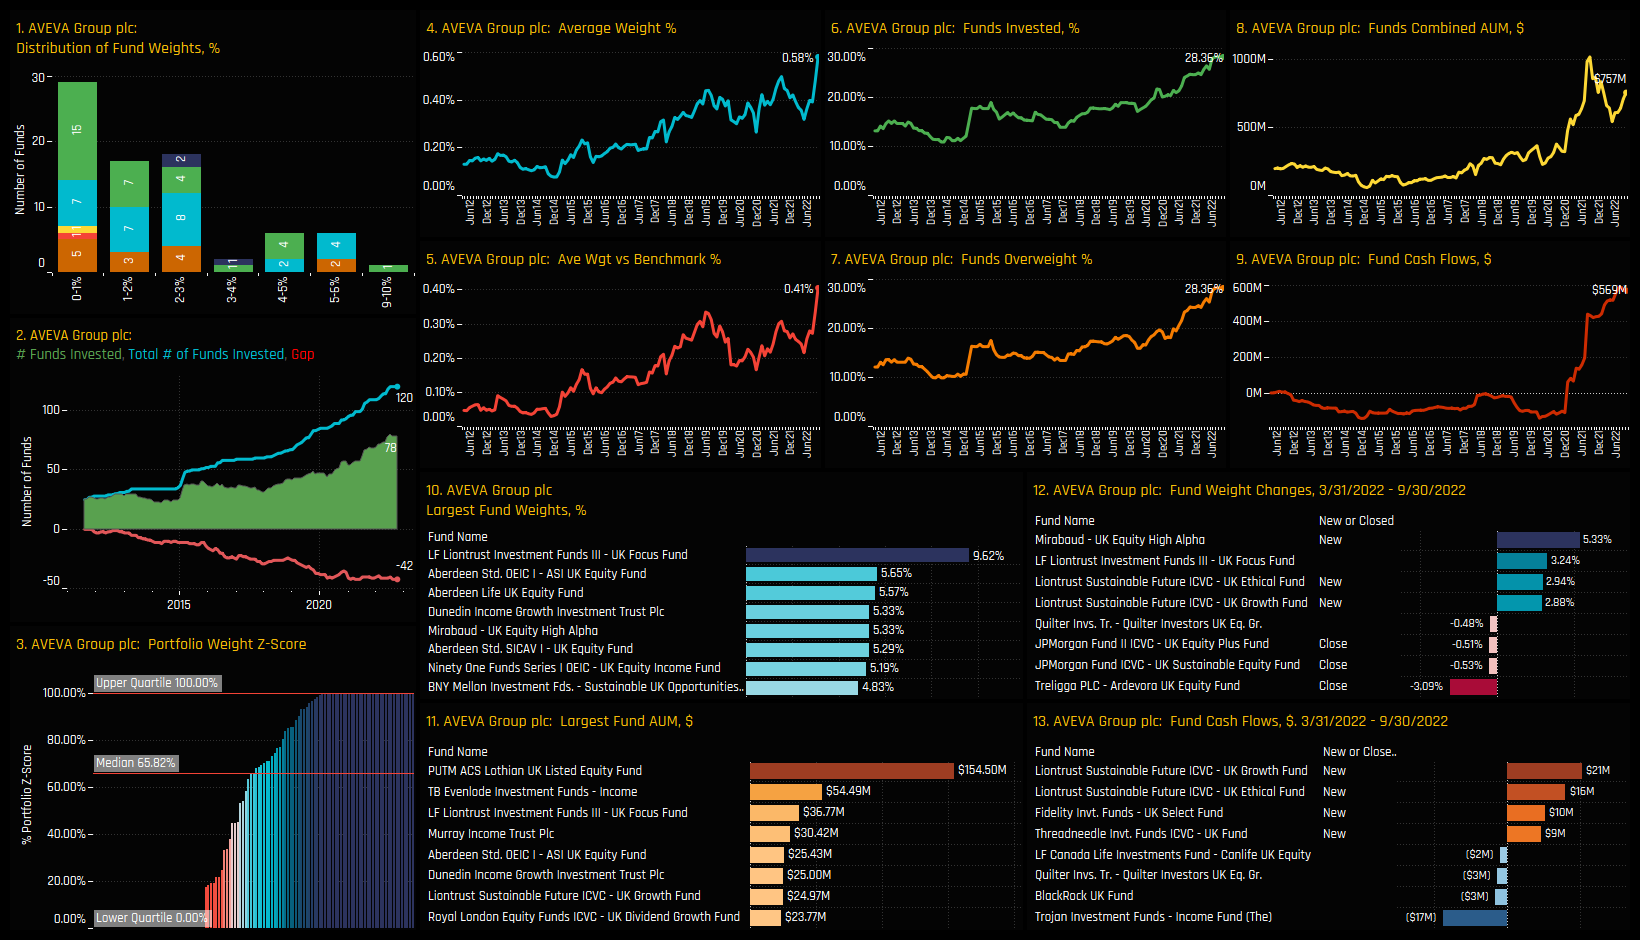
High Positioning, Positive Momentum: AVEVA Group plc
Average holding weights in AVEVA Group have surged higher this year to a record 0.58%. In conjunction, the percentage of funds invested is at record highs of 28.36%. High conviction positions from LF Liontrust UK Focus (9.62%) and Aberdeen UK Equity (5.65%) stand out, yet many previous investors are still sitting on the sidelines for now. Chart 2 shows 120 of the 275 funds in our analysis as having held a position in AVEVA Group at some point since 2012, yet only 78 are invested right now. The potential for ownership to grow further is there.
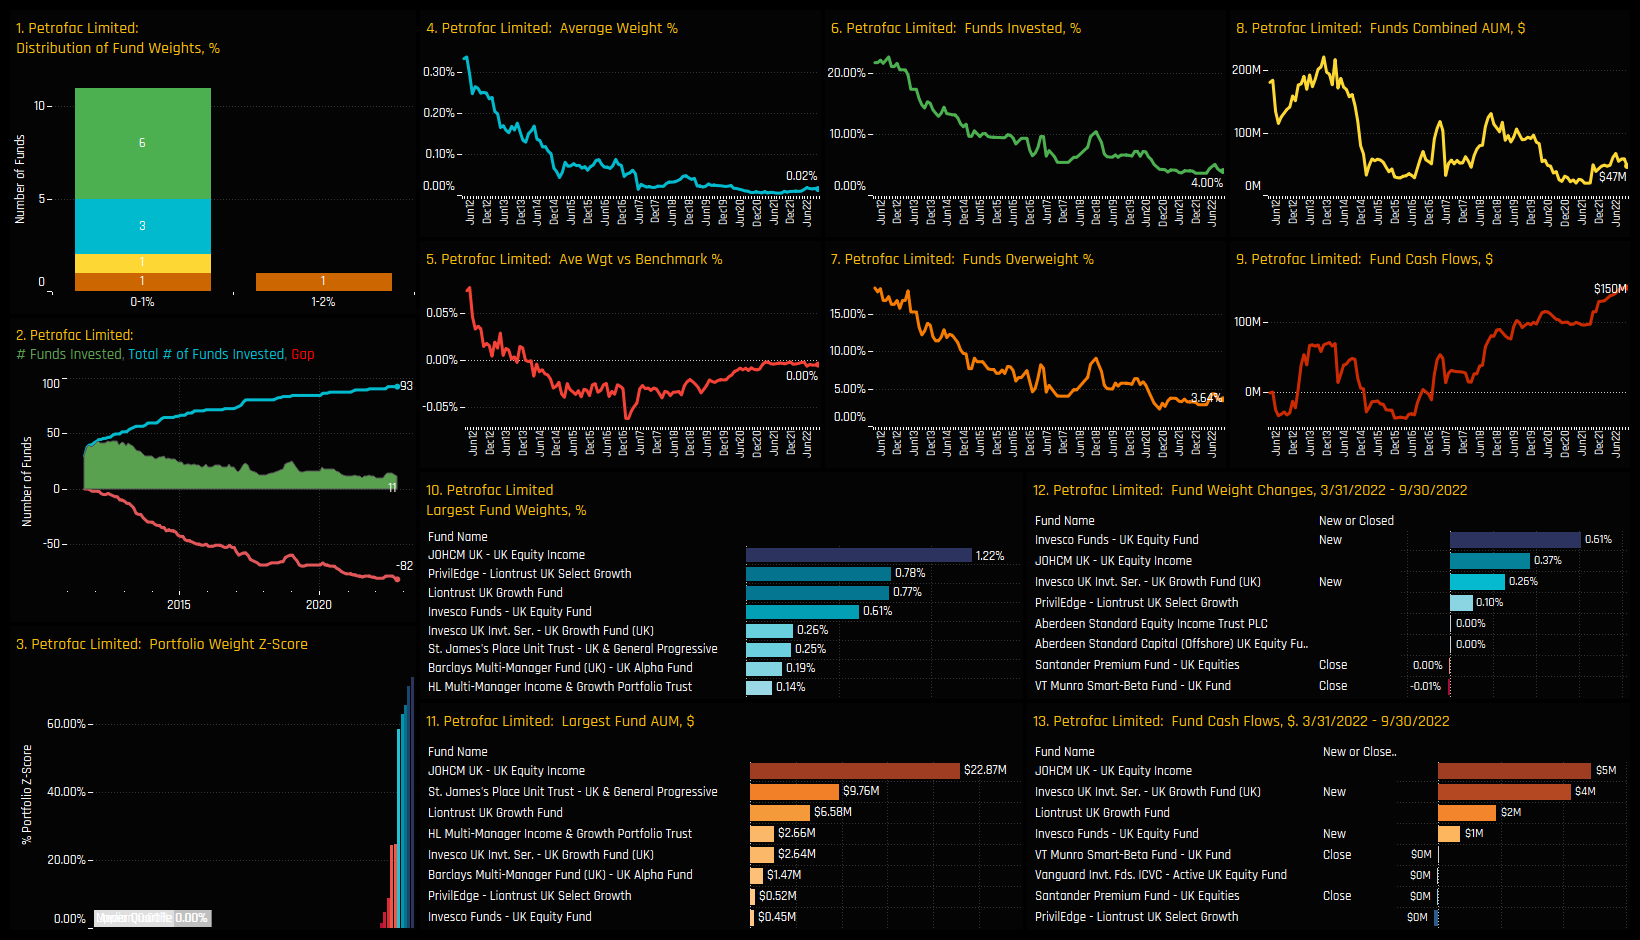
Active UK Fund ownership in Petrofac Limited is attempting a comeback after years of decline. Peak ownership of 22.6% of funds occurred back in 2012 and bottomed early this year at 3.64%. The recent reversal in sentiment has been underpinned by new positions from Invesco UK Equity (+0.61%) and Invesco UK Equity Growth (+0.26%), but these are small increases and not a full blown reflection of high conviction. It remains to be seen whether UK managers will build on these early signs of a recovery.
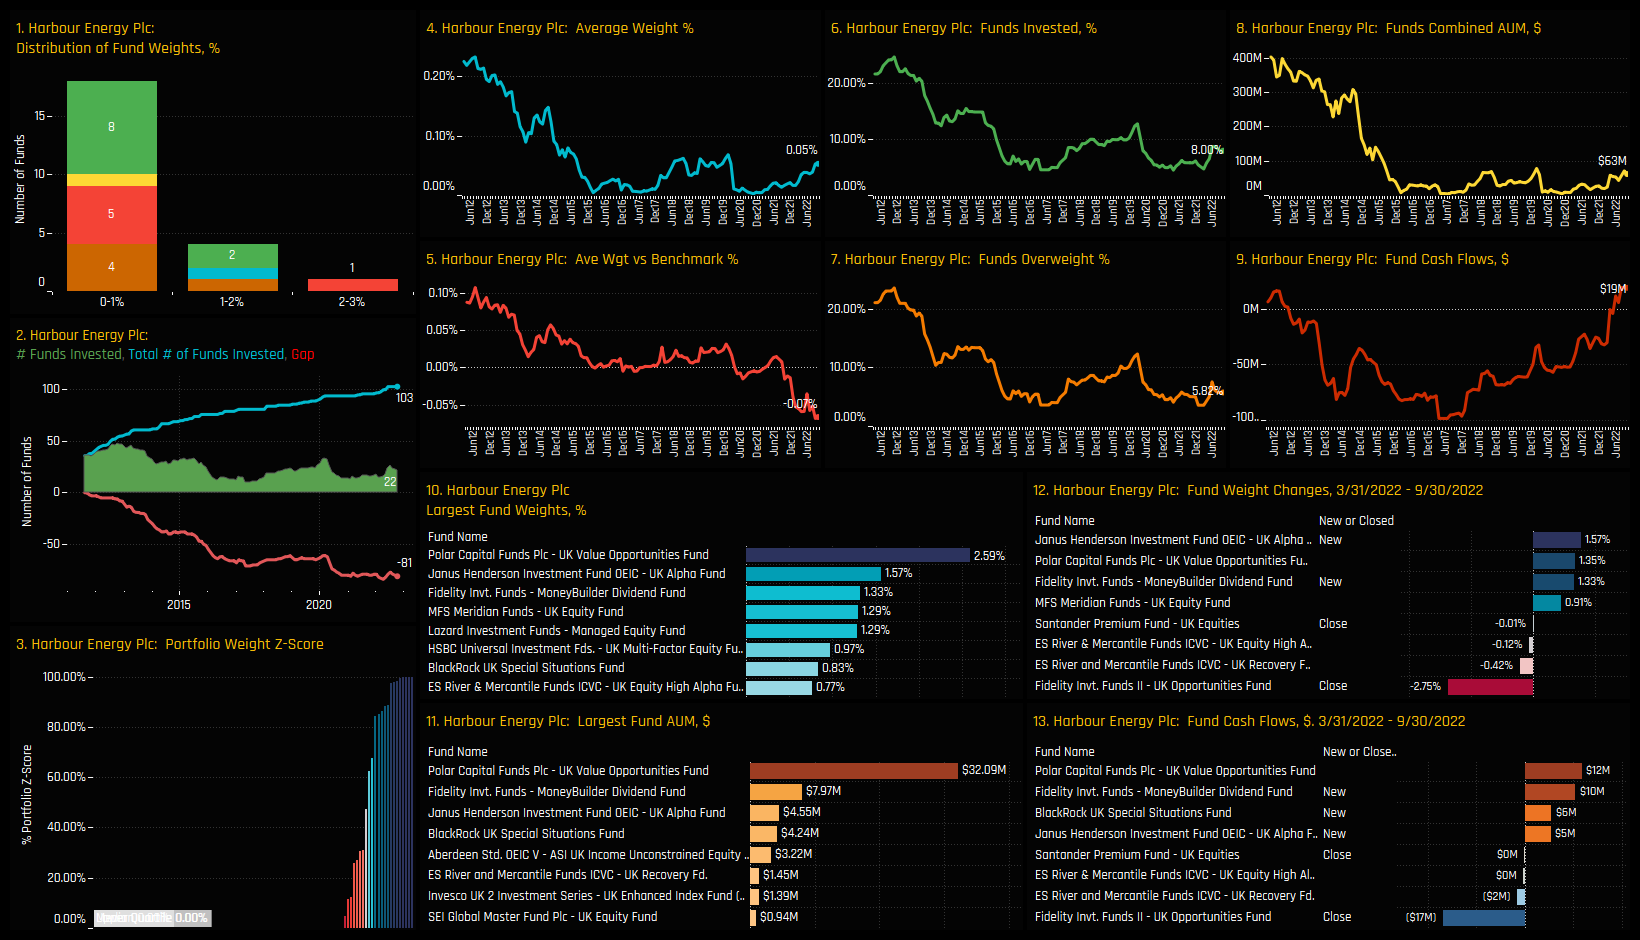
Low Positioning, Positive Momentum: Harbour Energy Plc
From an ownership base of almost zero, investment levels in Harbour Energy have started to reversed course. New positions from Fidelity MoneyBuilder Divided (+1.33%), Janus Henderson UK Alpha (+1.57%) over the last 6-months helped offset closures from Fidelity UK Opportunities (-2.75%) and Santander UK Equities (-0.01%). Ownership is still light, but if the investment case is starting to add up for these funds, will the 92% of funds that don’t own a position follow suit?
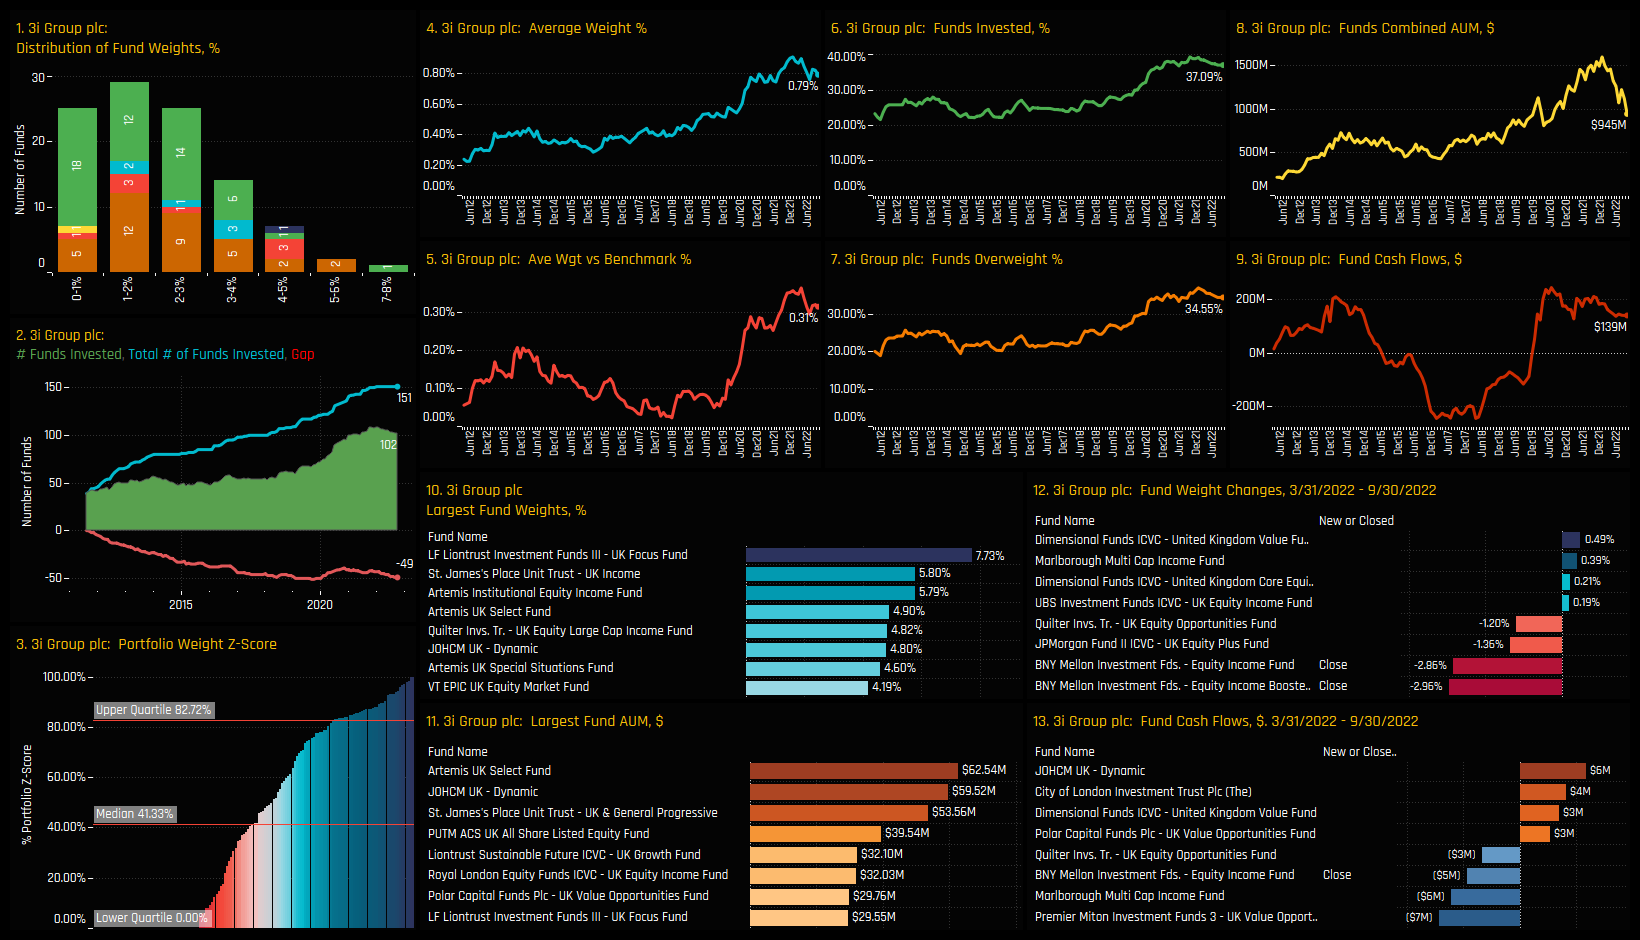
High Positioning, Negative Momentum: 3i Group plc
3i Group has seen a tremendous growth in ownership among active UK funds over the last decade. From an investor base of 20% of managers in 2012, momentum really started to pick up in 2020 and peaked late last year with 39.42% of the funds in our analysis holding a position. Since then, closing positions from BNY Mellon Equity Income Booster (-2.96%), Equity Income (-2.86%) has sent the ownership trend in to reverse. Its early days, but 3i Group is still heavily invested among the UK active fund community, this year’s underperformance may make others reassess the investment case.
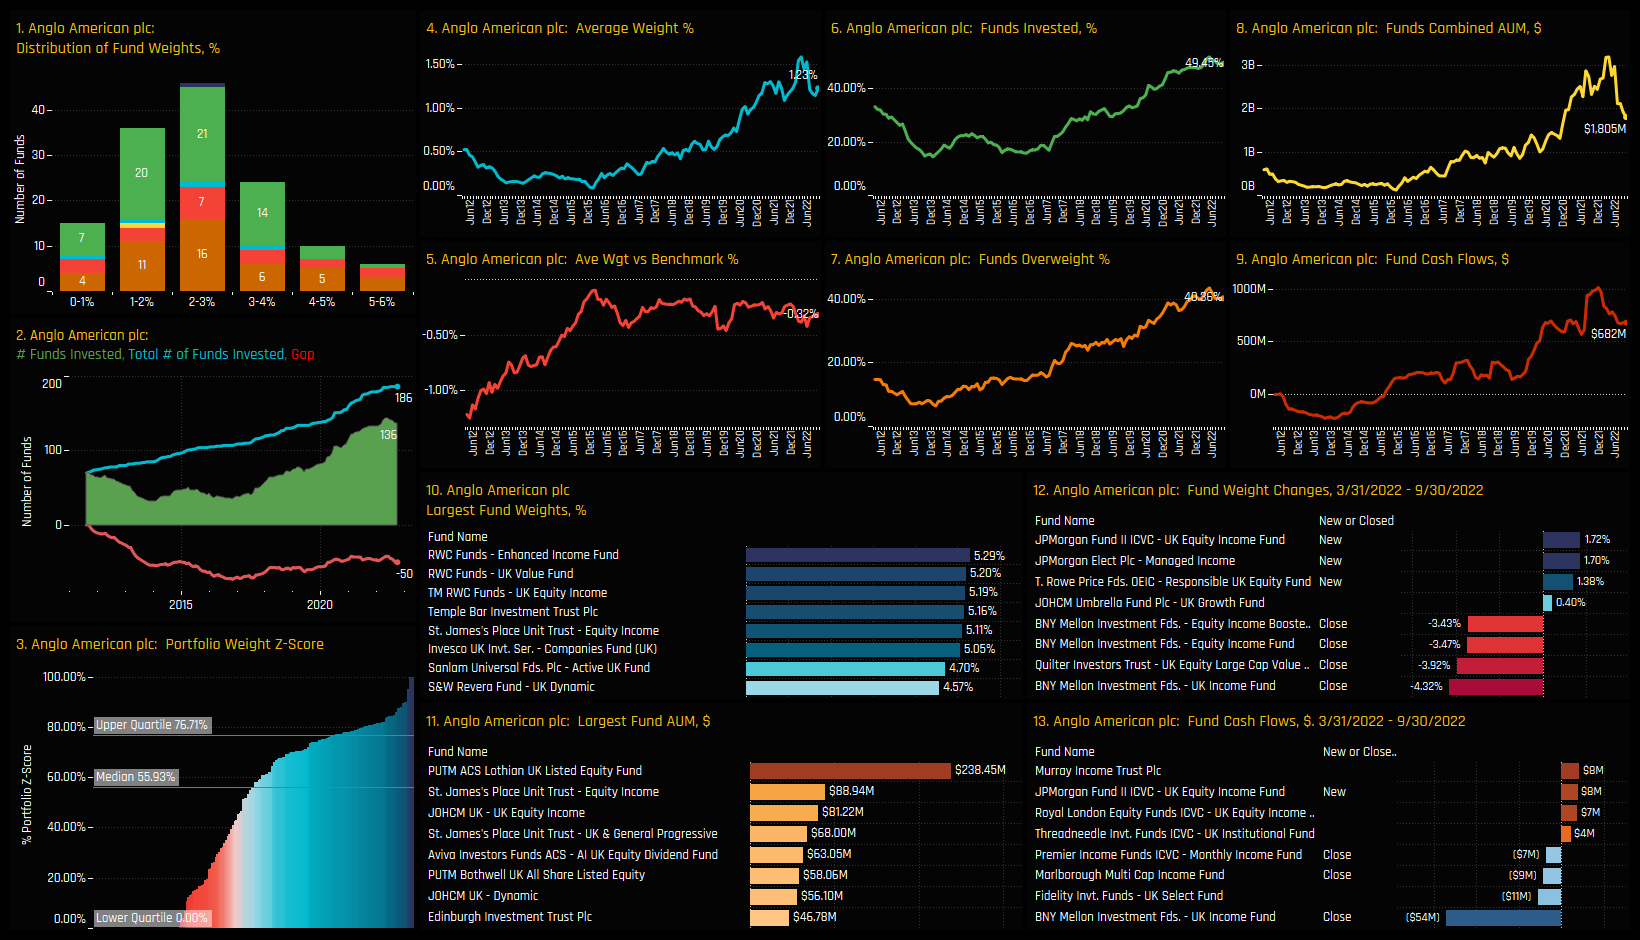
High Positioning, Negative Momentum: Anglo American plc
Stalling ownership growth is also a theme for Anglo American. UK fund ownership in the name has carved a positive path since 2017, with the percentage of funds invested increasing from 17.9% to 52% in April of this year. Since then, we have witnessed some consolidation, though it hasn’t been all one-way traffic. Closing positions active funds closing underweights more aggressively between 2019 to 2020. Fund ownership peaked earlier this year, with Smith & Williamson UK Equity Growth (-2.24%) and HSBC UK Multi Factor (-0.53%) closing out holdings. Coca Cola HBC is hardly a high conviction holding for the remaining investor base, with the maximum holding that of Dunedin Income Growth (3.34%) and the majority holding less than a 0.5% weight. Still, the reversal could mark a turning point in sentiment.
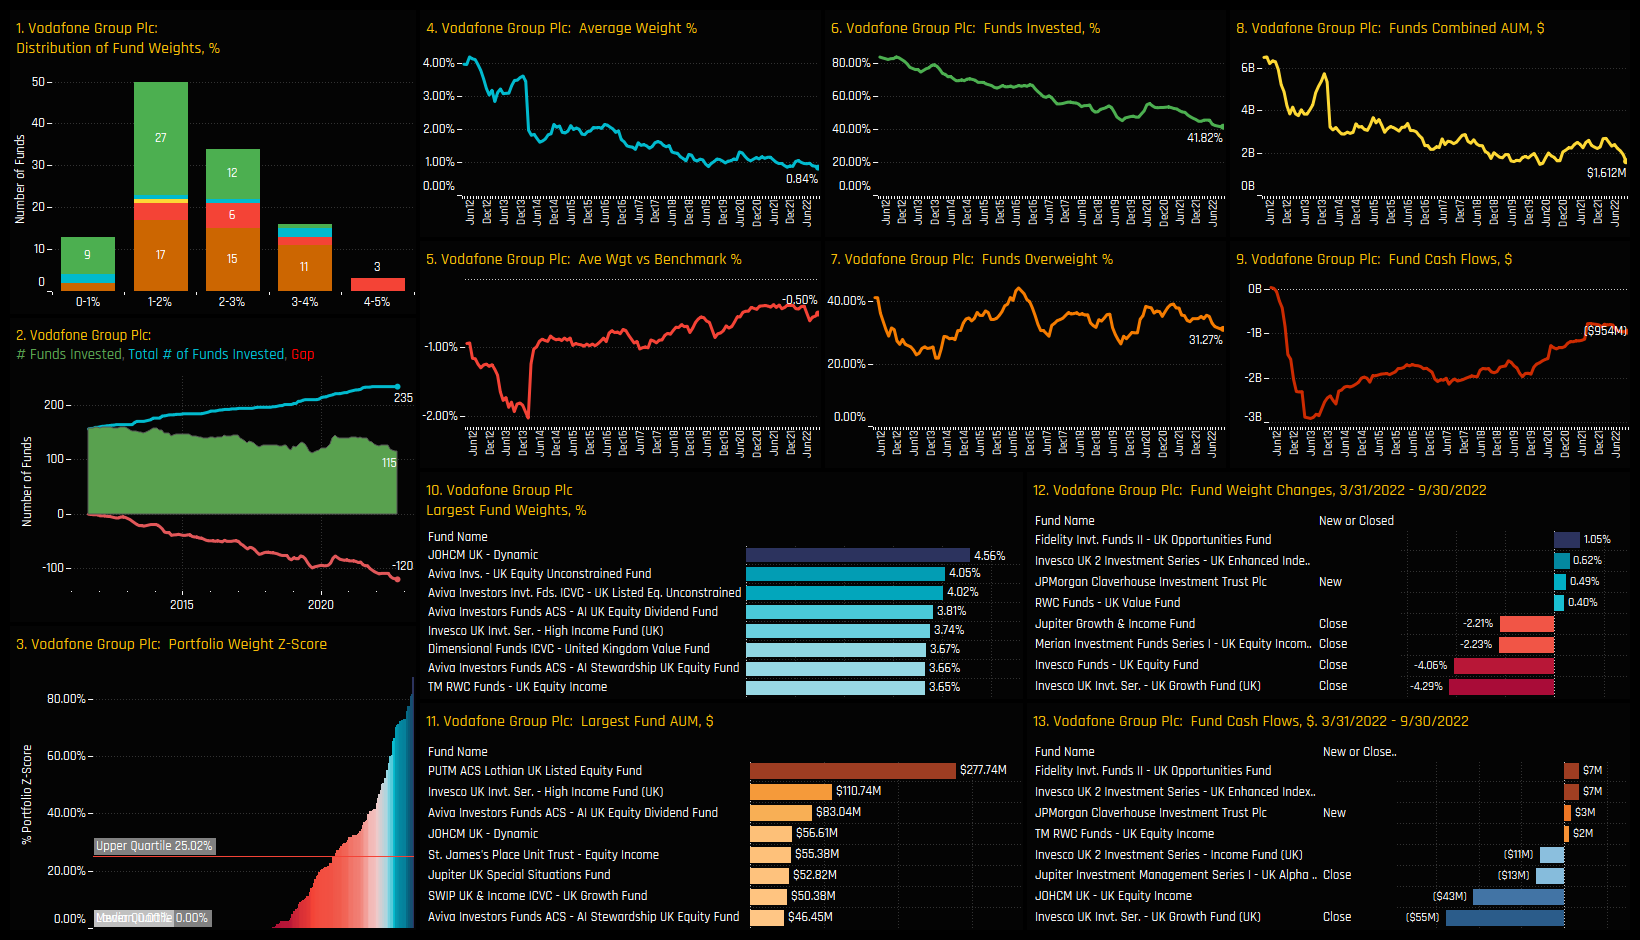
Low Positioning, Negative Momentum: Vodafone Group plc
UK active equity fund ownership in Vodafone Group is at its lowest point in history. Once held by over 80% of UK managers, year on year declines has seen that half to just 41.82% today. Recent closures from Invesco UK Growth (-4.29%), Invesco UK Equity (-4.06%), Merian UK Equity Income (-2.23%) and Jupiter Growth and Income (-2.21%) have contributed to the decline, yet Vodafone remains a well held name. High conviction positions from JOHCM UK Dynamic (4.56%) and a suite of Aviva strategies highlight a level of faith in the name, but there is no denying the strong decline in sentiment among active UK managers.
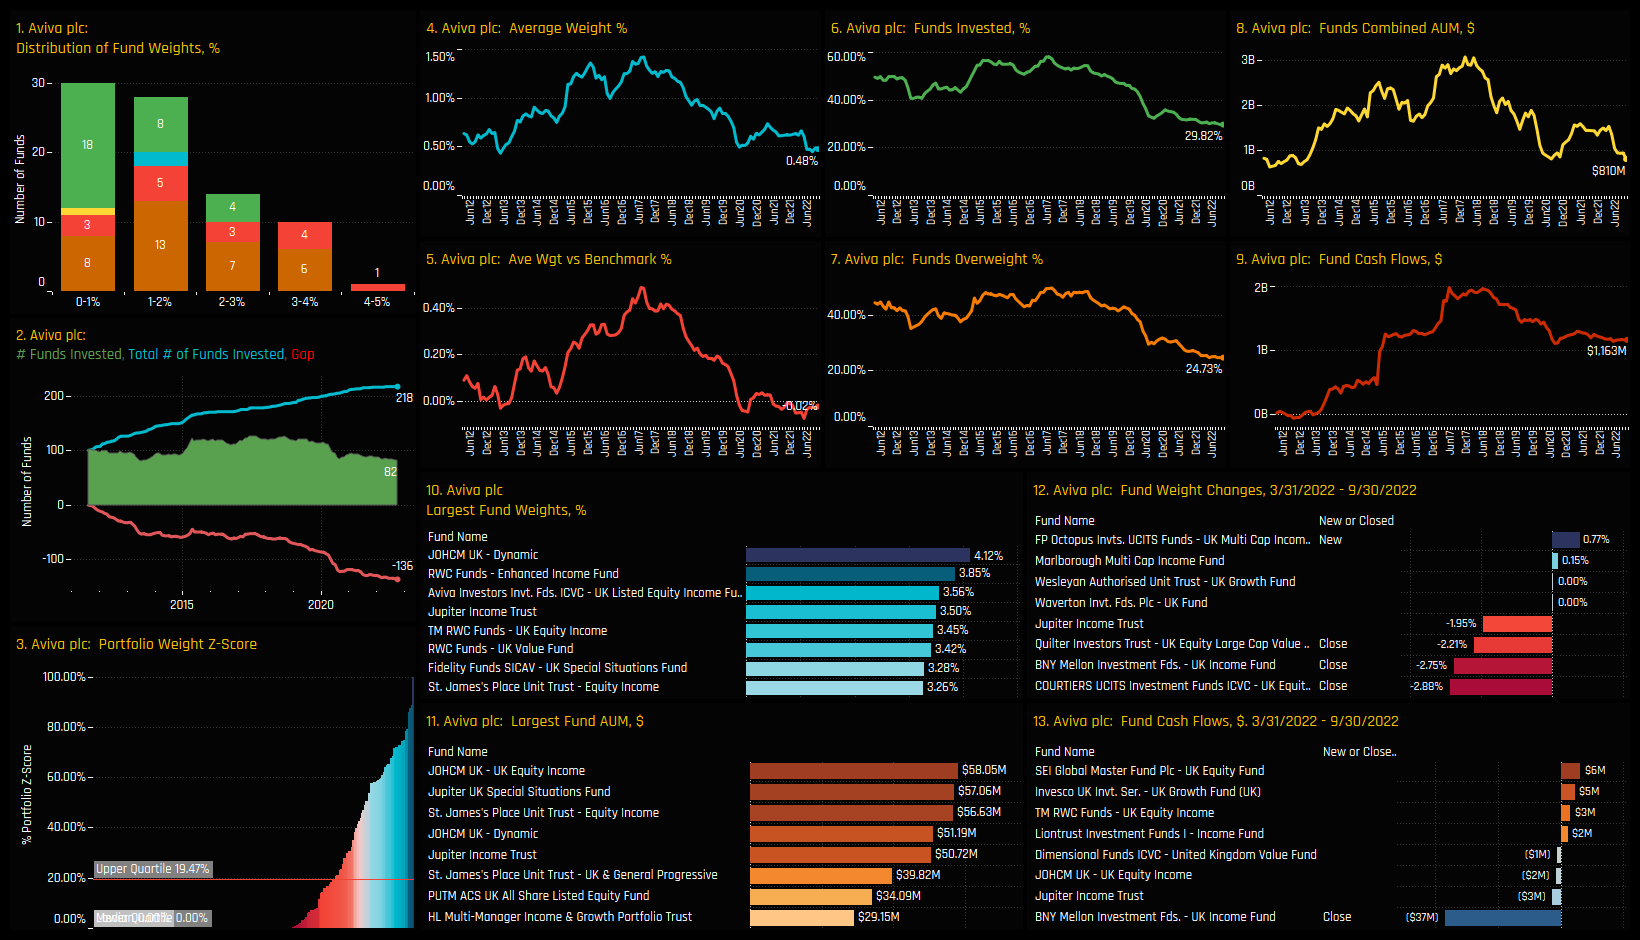
Low Positioning, Negative Momentum: Aviva plc
Things don’t look a whole lot better for Aviva pls. Again, UK active fund ownership is at an all-time low, with 29.8% of funds invested over half from the peak in 2017. Over the last 6-months, closures from Courtiers UK Equity (-2.88%), BNY Mellon Equity Income (-2.75%) and Quilter UK Large Cap Value (-2.21%) highlight a continuation of the longer-term downward trend. As it stands, there are very few signs of a reversal in sentiment, with instead a considerable overhang from the 82 funds who remain invested.
For more analysis, data or information on active investor positioning in your market, please get in touch with me on steven.holden@copleyfundresearch.com


