Asia Ex-Japan Funds: 2022 Performance & Attribution Report

91 Active Asia Ex-Japan Funds, AUM $70bn.

2022 Performance & Attribution Report

In this report, we provide an overview of 2022 performance among the Asia Ex-Japan active funds in our analysis. We look at annual performance broken down by Style and Market Cap focus, together with longer-term analysis of active versus passive. We then identify the drivers behind 2022 performance based on the average active Asia Ex-Japan fund stock portfolio versus the iShares Asia Ex-Japan ETF (AAXJ).

2022 was a year to forget for active Asia Ex-Japan equity managers. Average fund returns came in at -22.64%, underperforming the MSCI Asia Ex-Japan index by -2.96% with just over three quarters of the 91 strategies in our analysis underperforming the index.  The small number of Value funds in our analysis were among the top performers, with Large/Megacap and Yield bringing up the rear.

The top and bottom performers on the year are listed below.  The Value strategies of Eastspring Asian Dynamic and Hermes Asia Ex-Japan were some way ahead of the pack.  


Returns by Style & Market Cap Focus

The grid below shows the top 3 and bottom 3 performers in each Style and Market Cap bucket

Time-Series Active v Passive

Month on month performance versus the benchmark is shown below, with the damage done in the first 4 months of the year.  

This makes 2022 the worst performing year in a decade when compared to benchmark, snapping a run of 3 consecutive years of outperformance among active managers.  

Performance by Style and Active Category

The charts below show the average annual performance (top) and cumulative performance (bottom) split by fund Style over the last decade.  Despite the outperformance of Value funds last year, over the longer term, Growth and GARP strategies have been the top performers, and the only Style groups to outperform the MSCI Asia Ex-Japan index.

Fund performance split by active category provides evidence that an active approach is the way to go in Asia Ex-Japan.  High Active funds (active shares >75%) appear to have an advantage, outperforming the MSCI Asia Ex-Japan index by 10% over the last decade.  Benchmark hugging in Asia Ex-Japan has not yielded favorable results.  

10-Year Performance Summary

Fund Performance Contribution

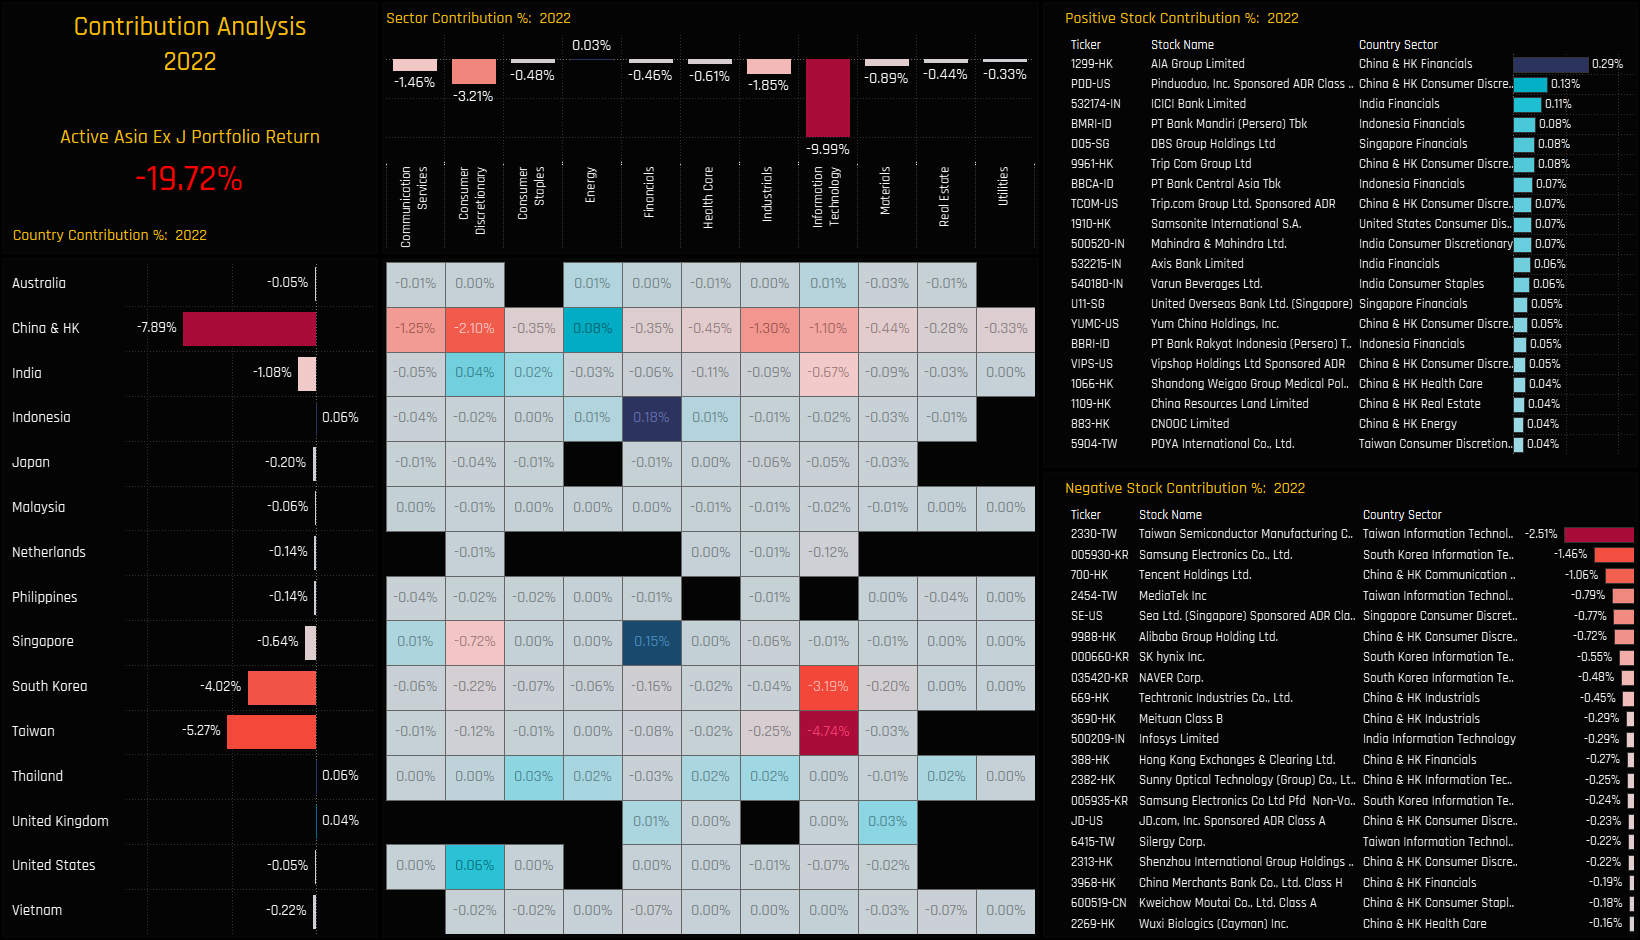
We now look at the drivers behind last year’s absolute and relative performance.  We do this by creating a portfolio based on the average allocations of the 91 active strategies in our analysis.  This theoretical portfolio, with no fees and based on monthly holding observations returned -19.72% on the year.  On a country level, -7.9% of that was driven by China & HK holdings and a further -9.3% from Taiwan and South Korea combined.  On a sector level, all sectors except Energy produced negative returns on the year, led by Tech (-9.99%), Consumer Discretionary (-3.21%) and Industrials (-1.85%).  On a stock level, TSMC was the major drag on performance, contributing -2.52% in negative returns for the portfolio, in addition to Samsung Electronics (-1.46%) and Tencent Holdings (-1.06%).  

Portfolio Attribution

We measure the performance of this portfolio versus a representation of the benchmark based on the iShares MSCI Asia Ex-Japan ETF (AAXJ).  The portfolio underperformed by -0.66% in 2022, a summary of the key drivers are documented below.

What worked:  

  • Cash holdings, Indonesia Overweights, India Financials Overweights
  • Consumer Discretionary stock selection, Consumer Staples overweights
  • Underweights in Nio Inc, XPeng Inc, Xiaomi Corp
  • Overweights in HDFC Banks, AIA Group, Samsonite International

What didn’t:  

  • China Financials underweights, Thailand underweights, Taiwan Tech stock selection.
  • Financials and Energy underweights, Tech overweights
  • Overweights in MediaTek, Sea Ltd, Techtronic Industries
  • Underweights in China Construction Bank, Bank of China, Adani Enterprises

For more analysis, data or information on active investor positioning, please get in touch with me on steven.holden@copleyfundresearch.com