18 December
Asia
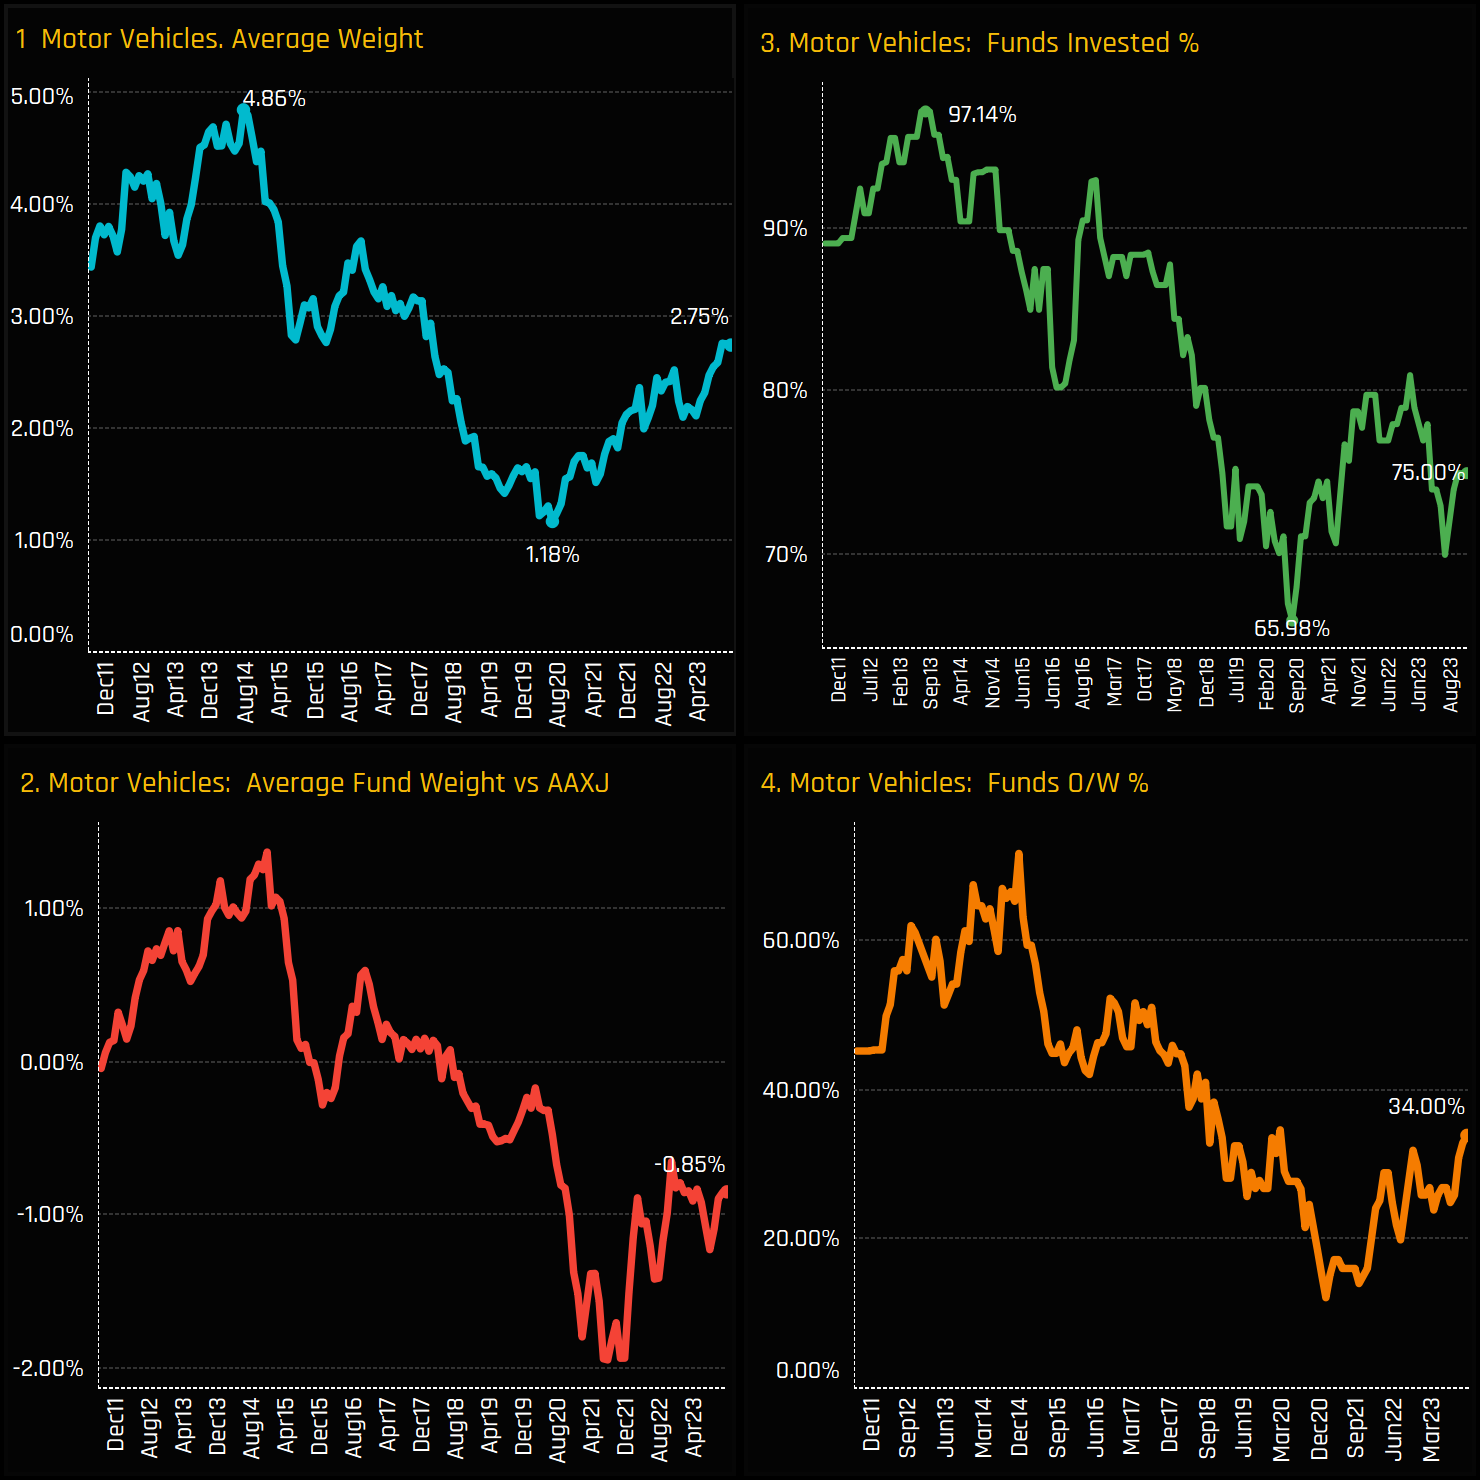
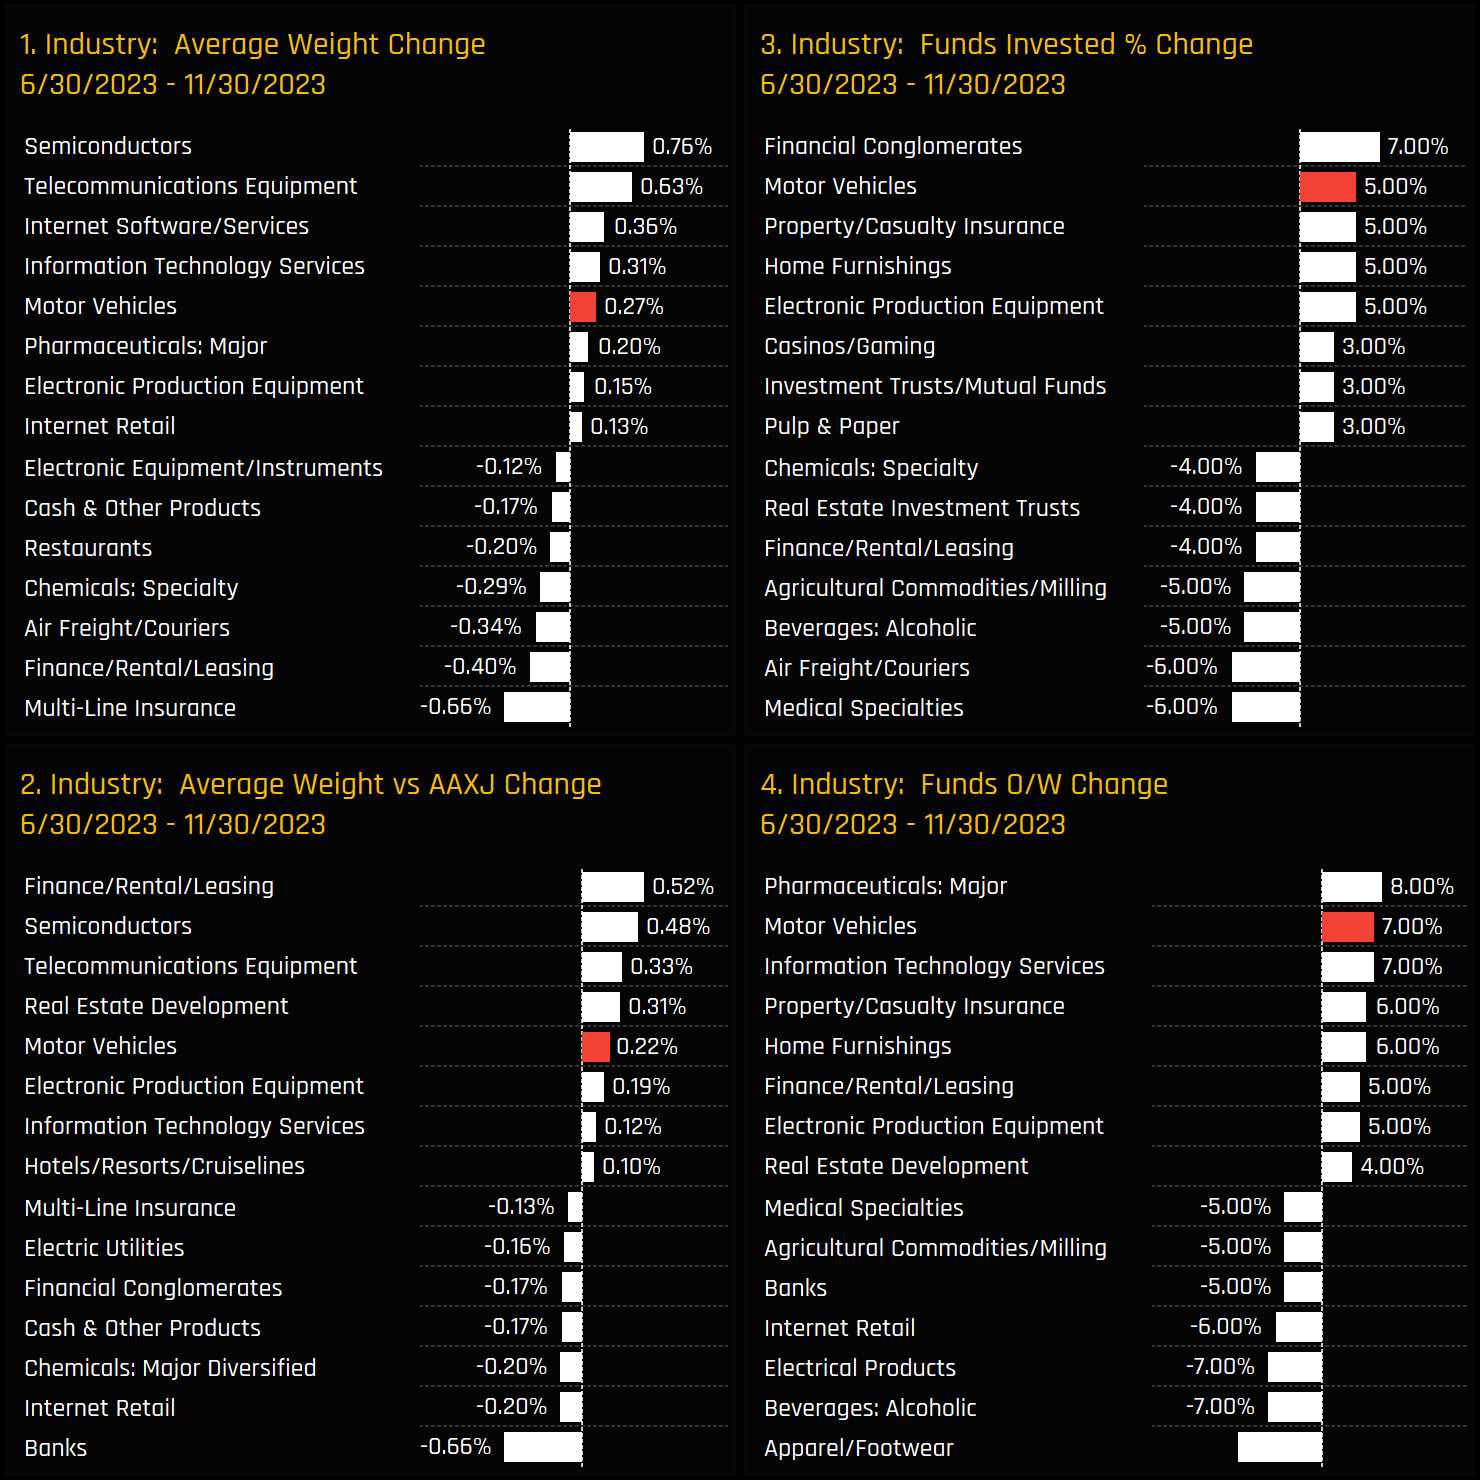
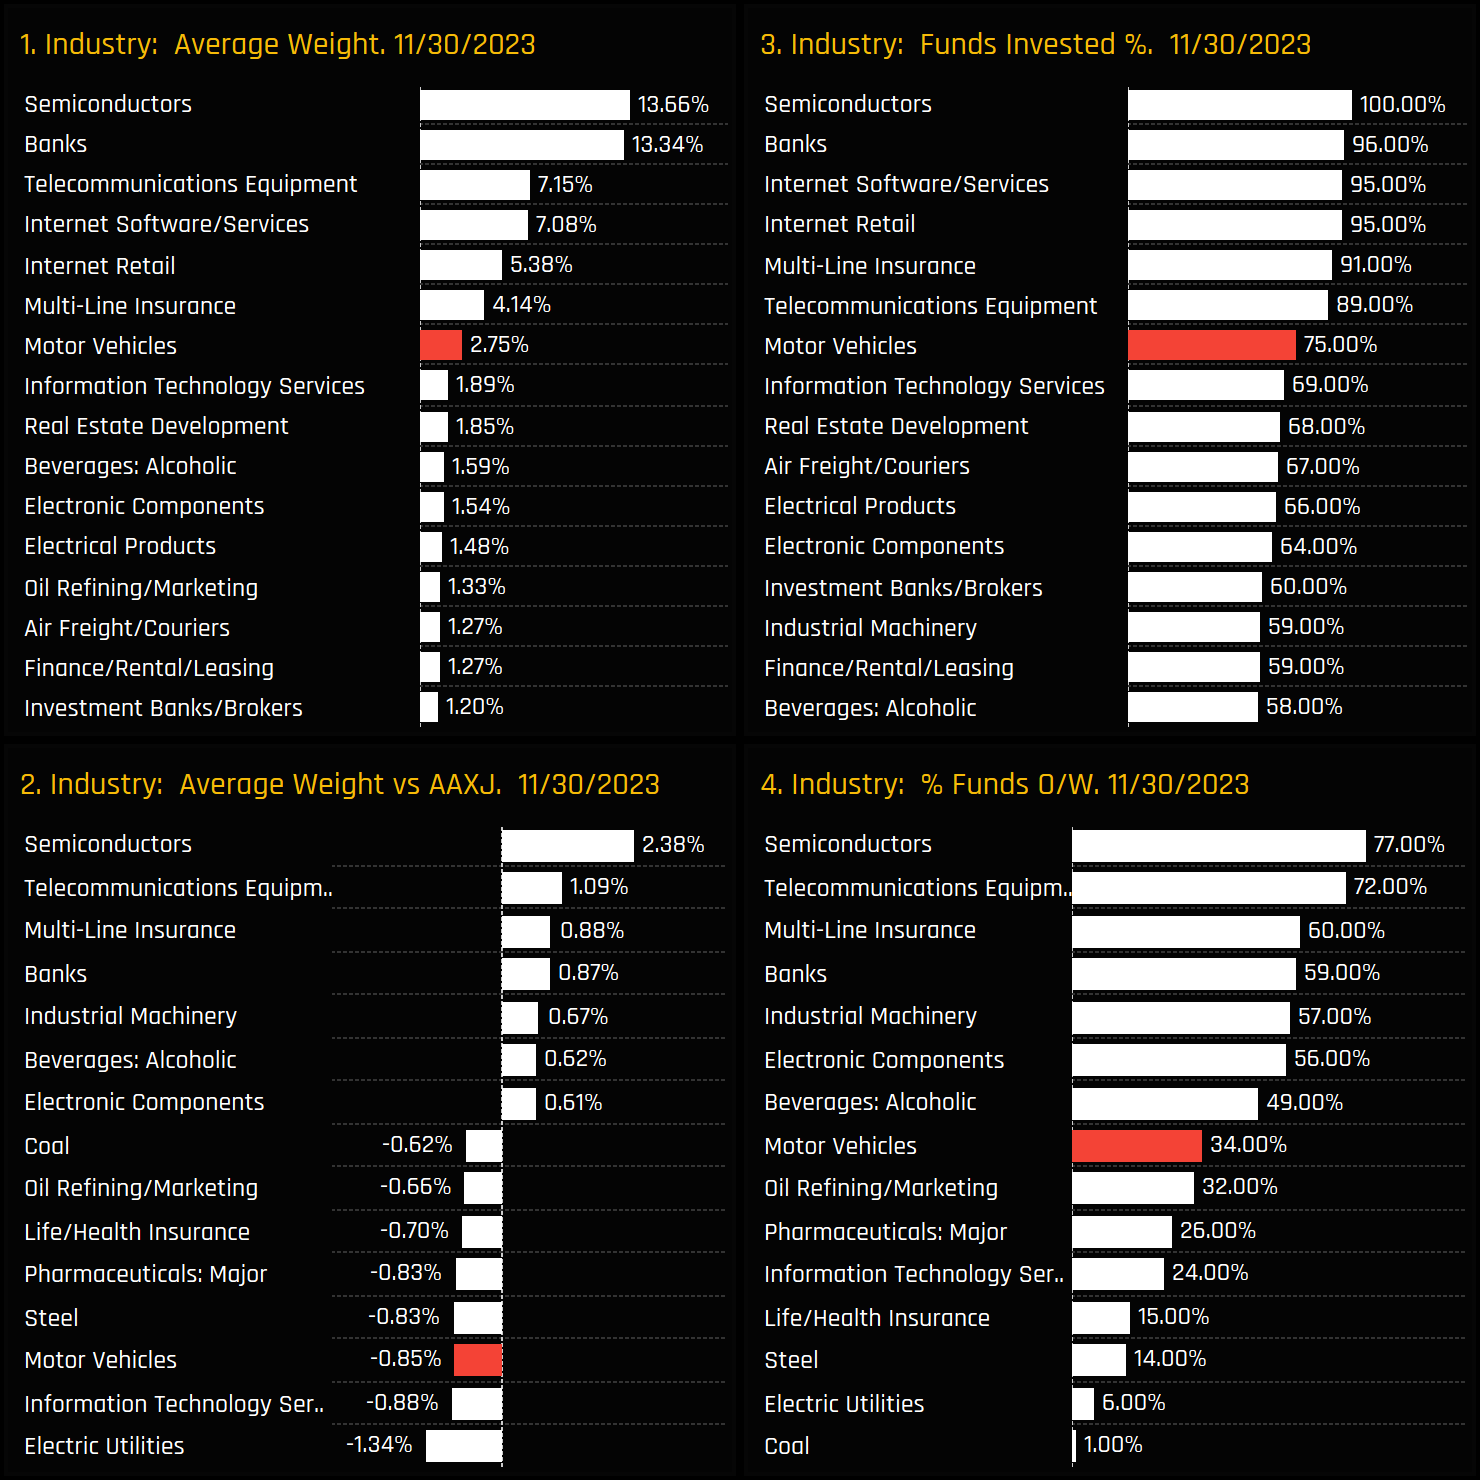
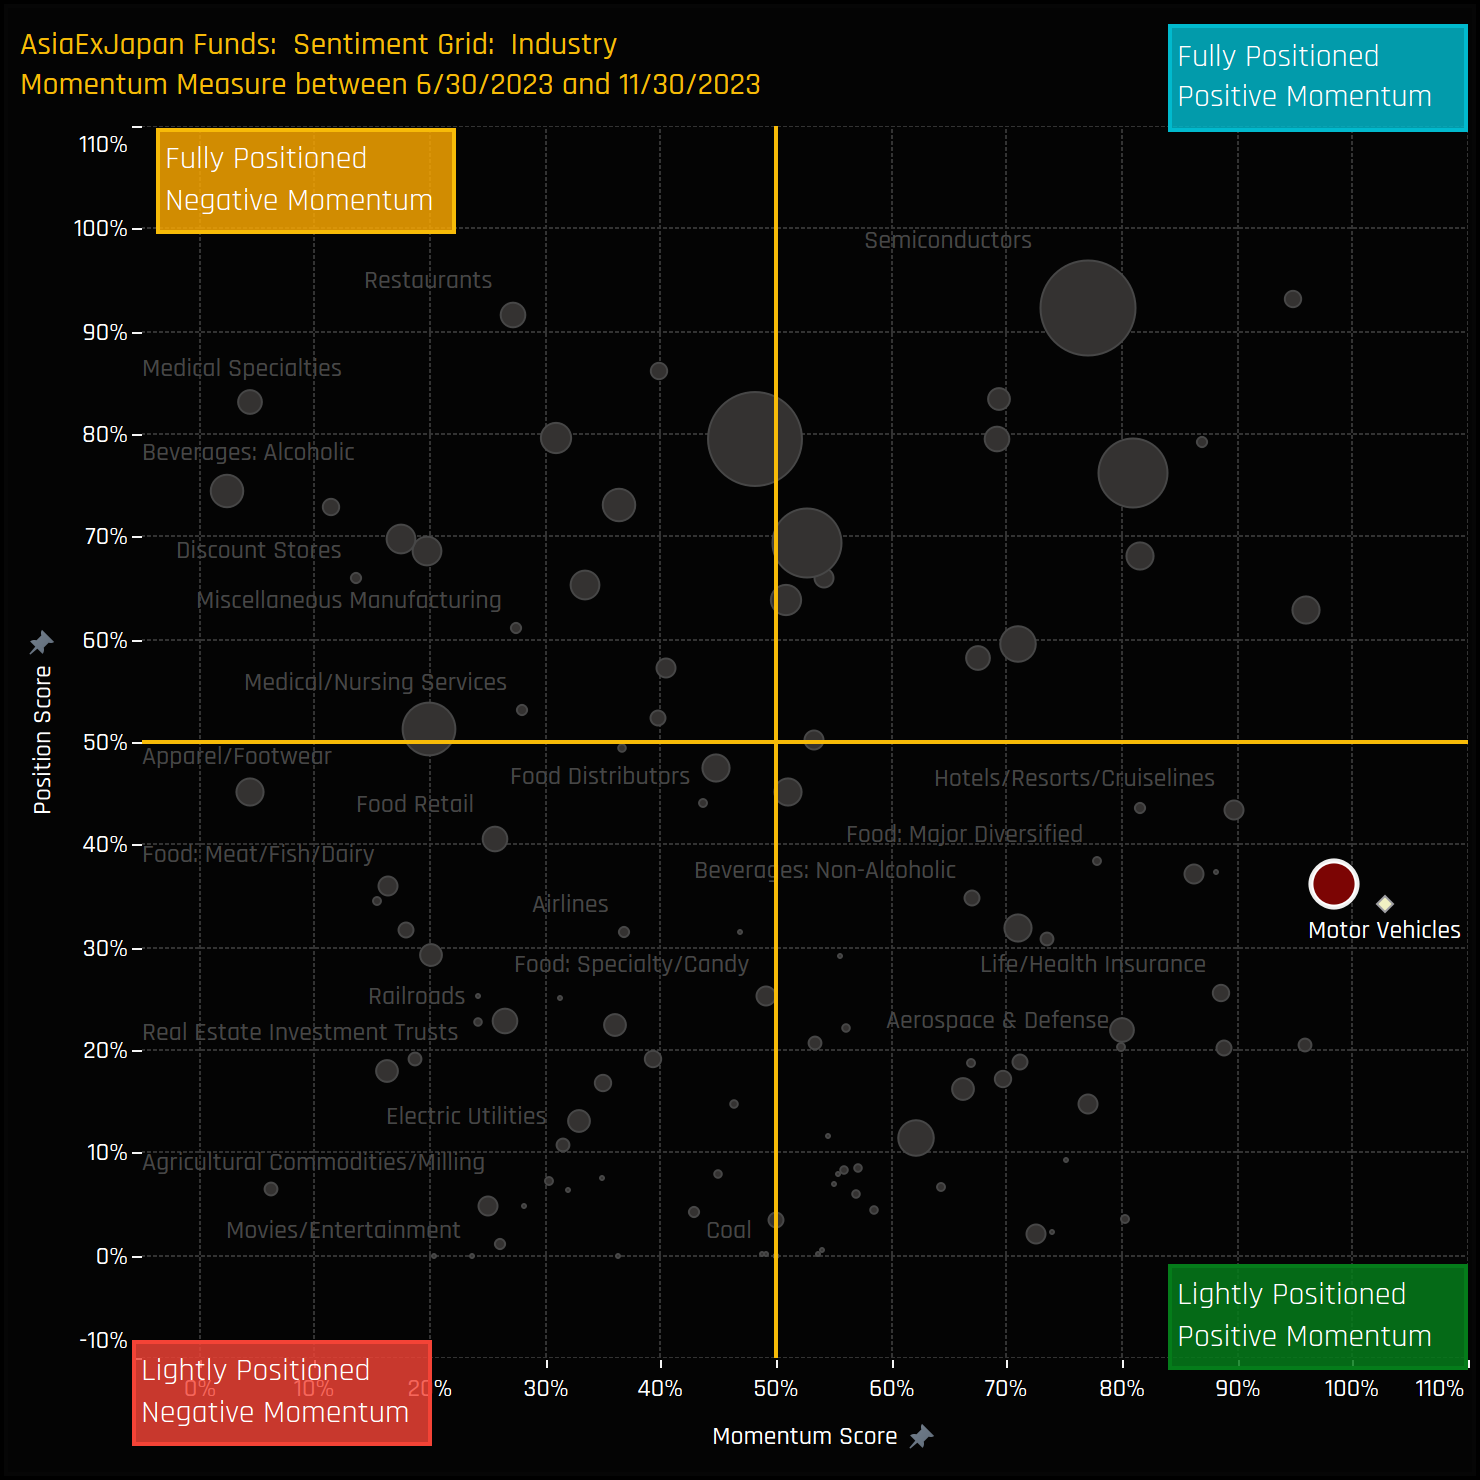
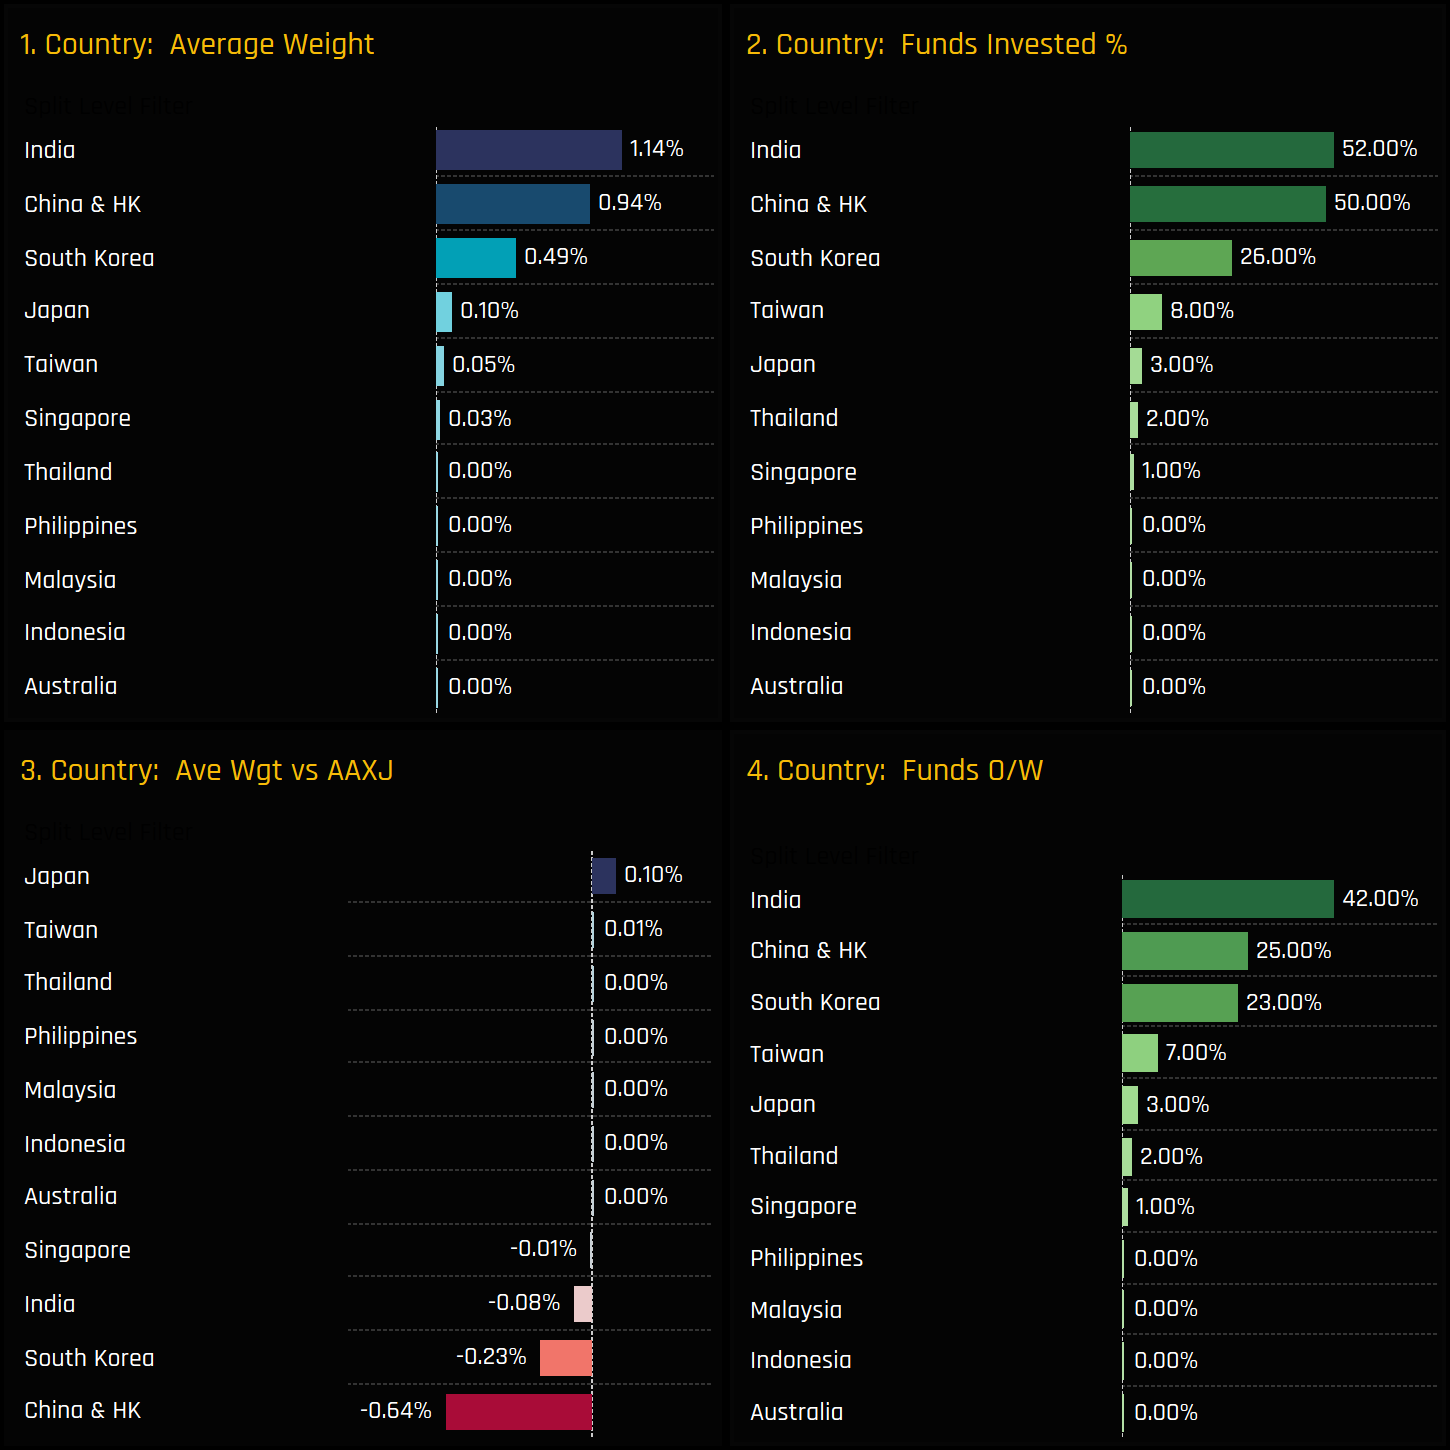
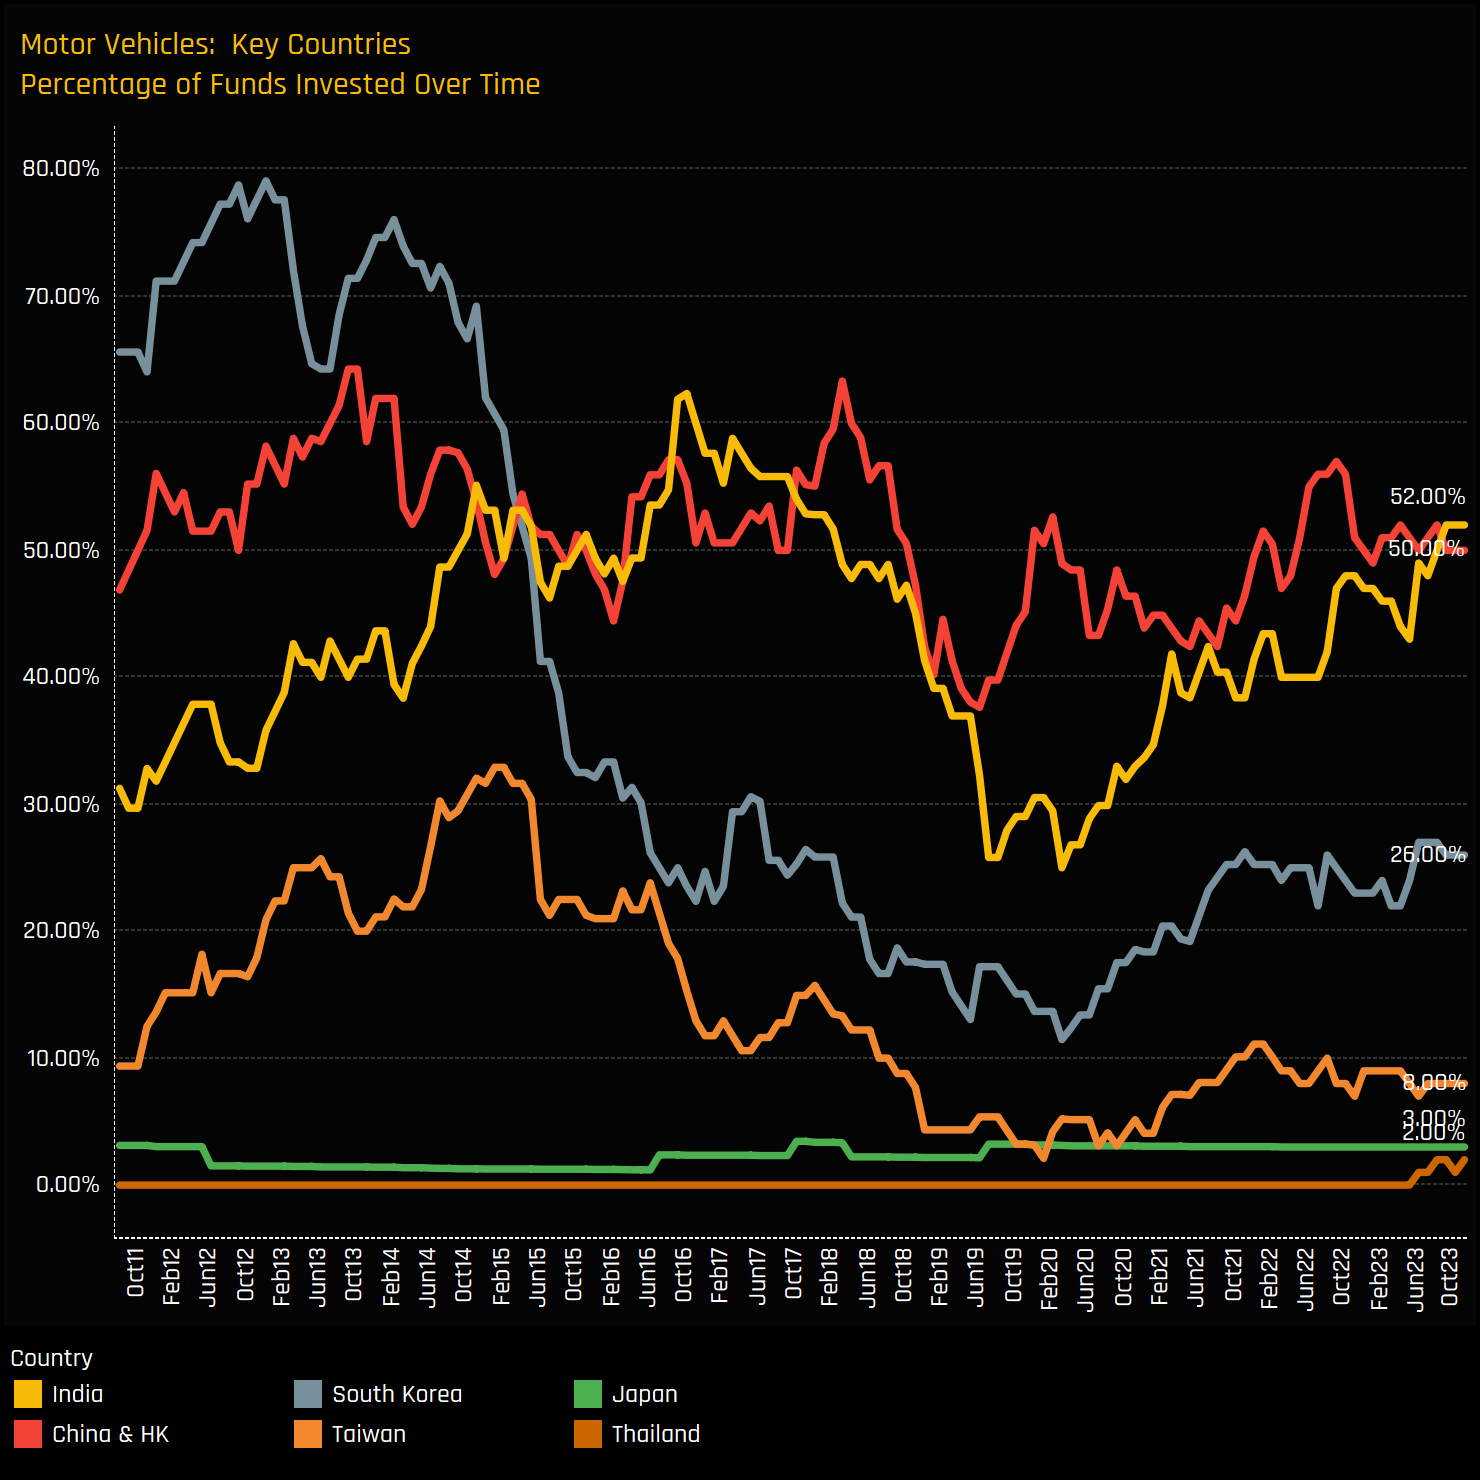
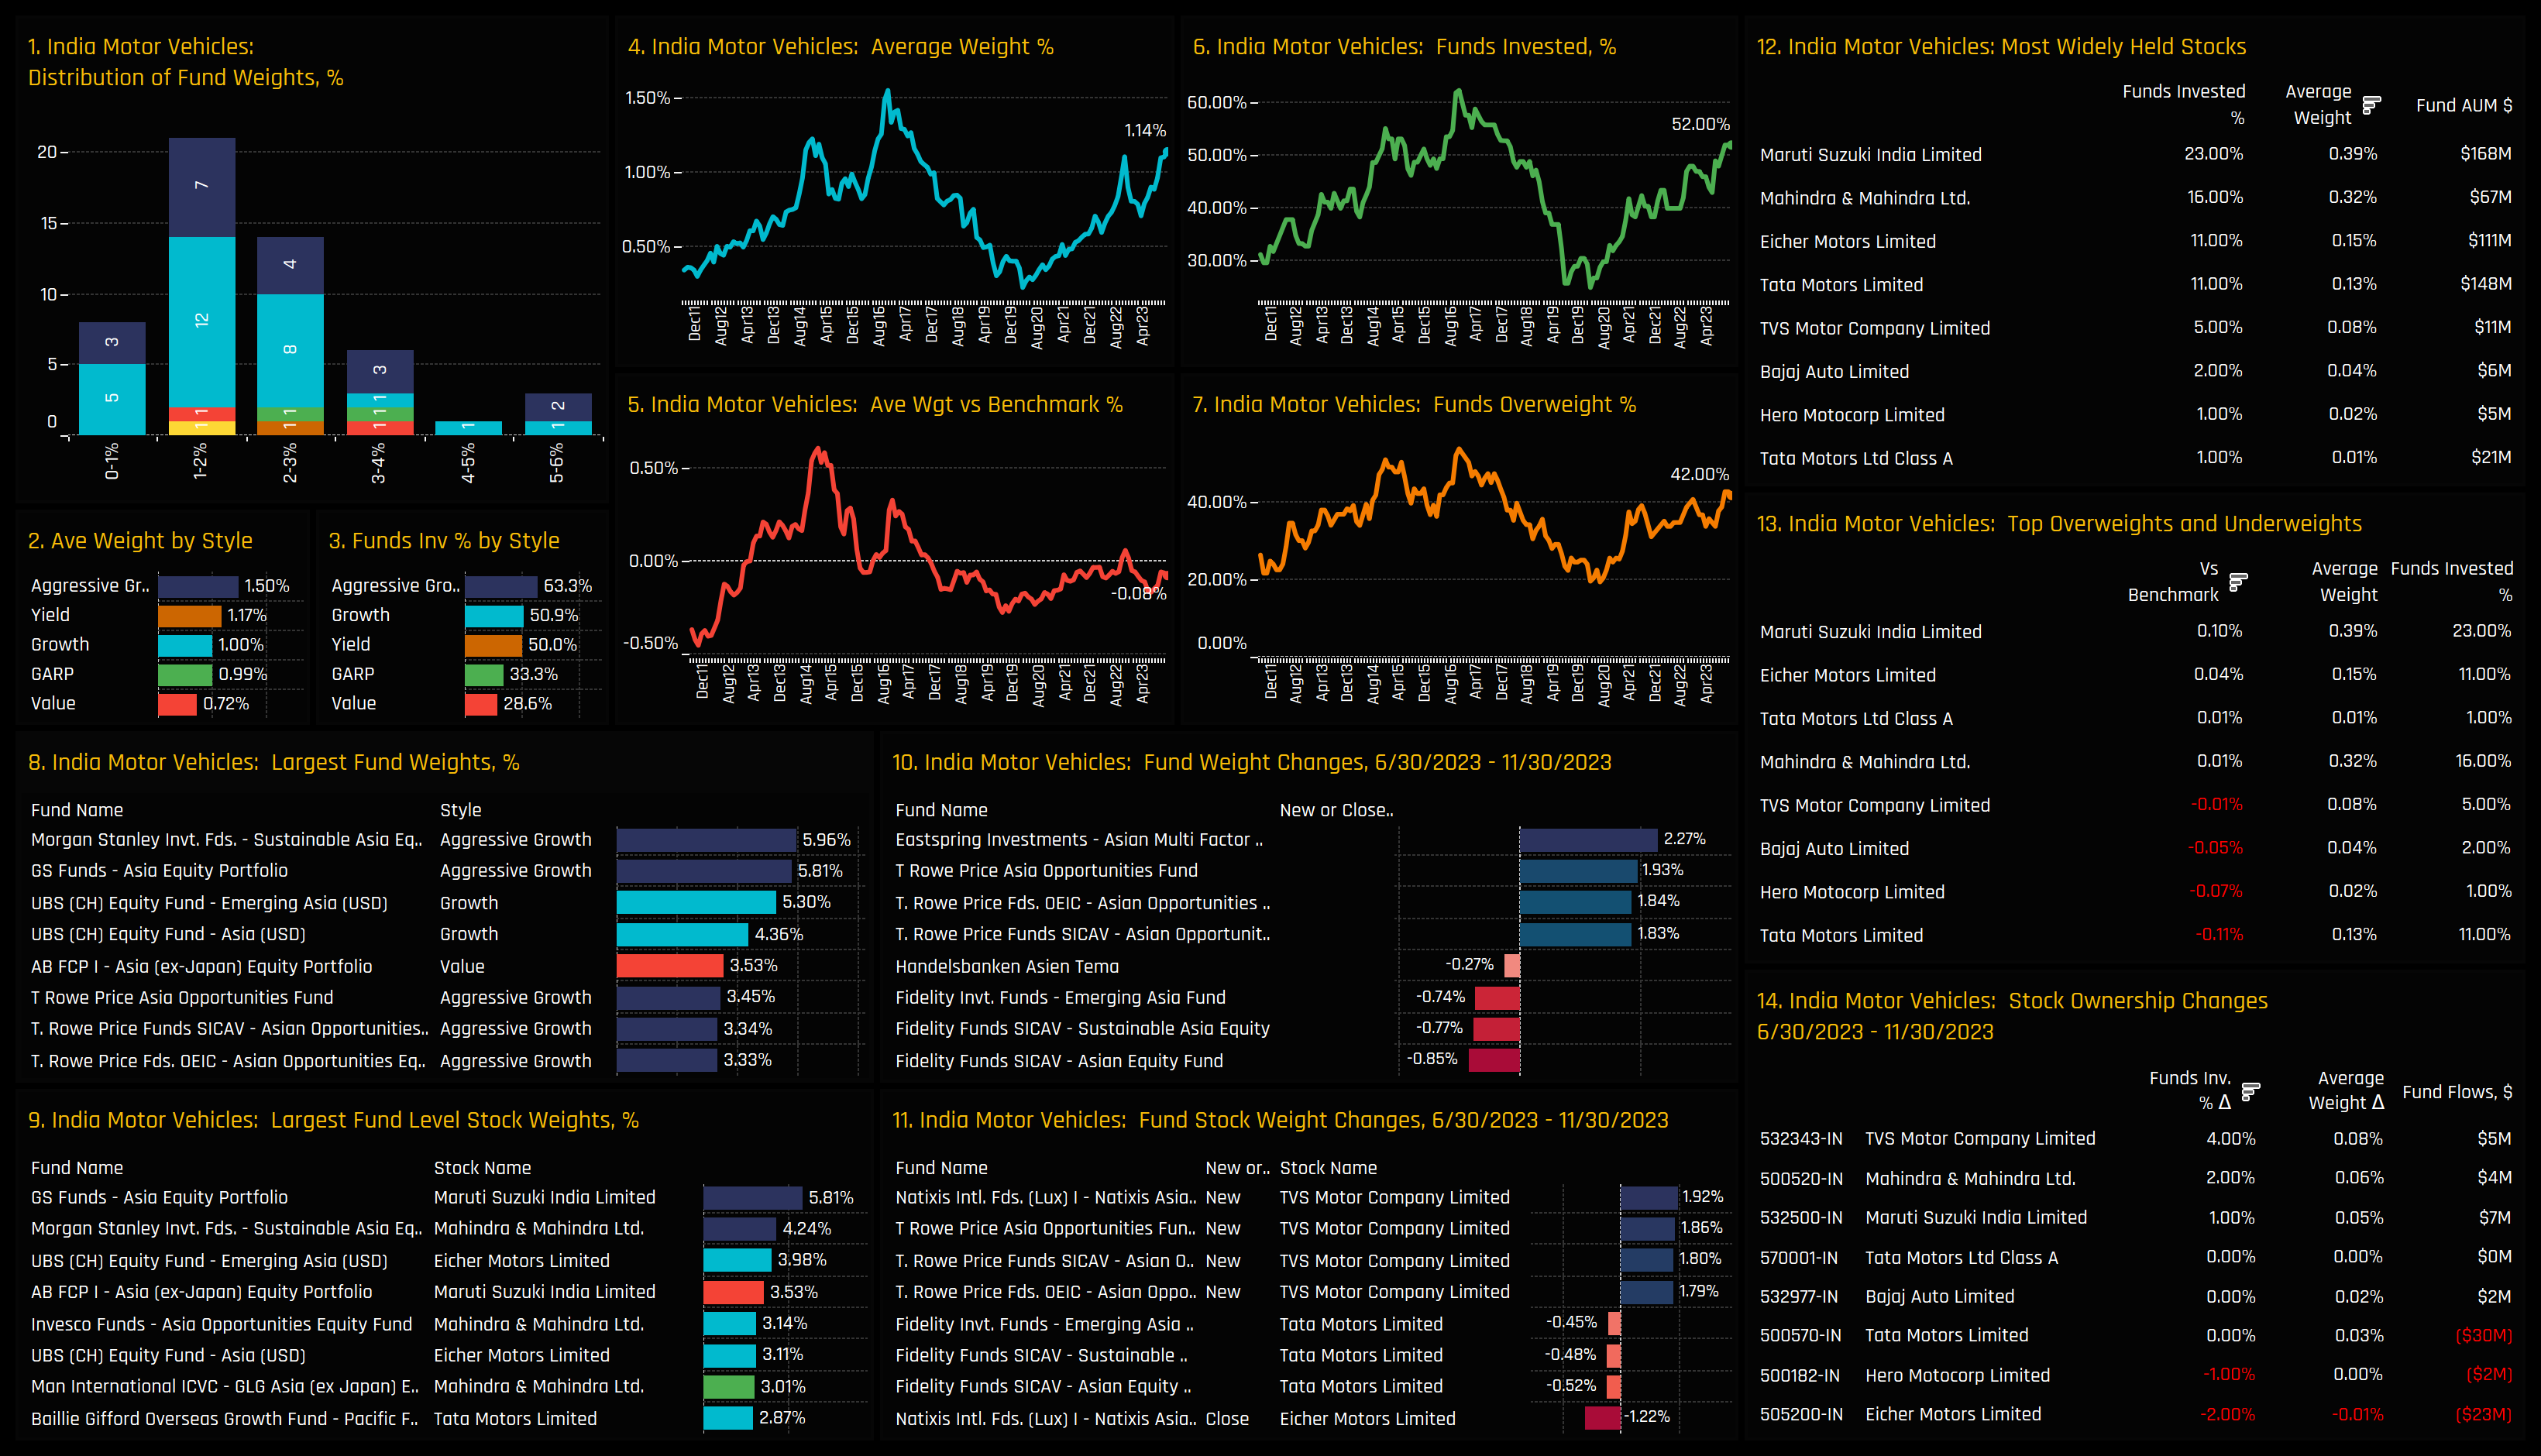
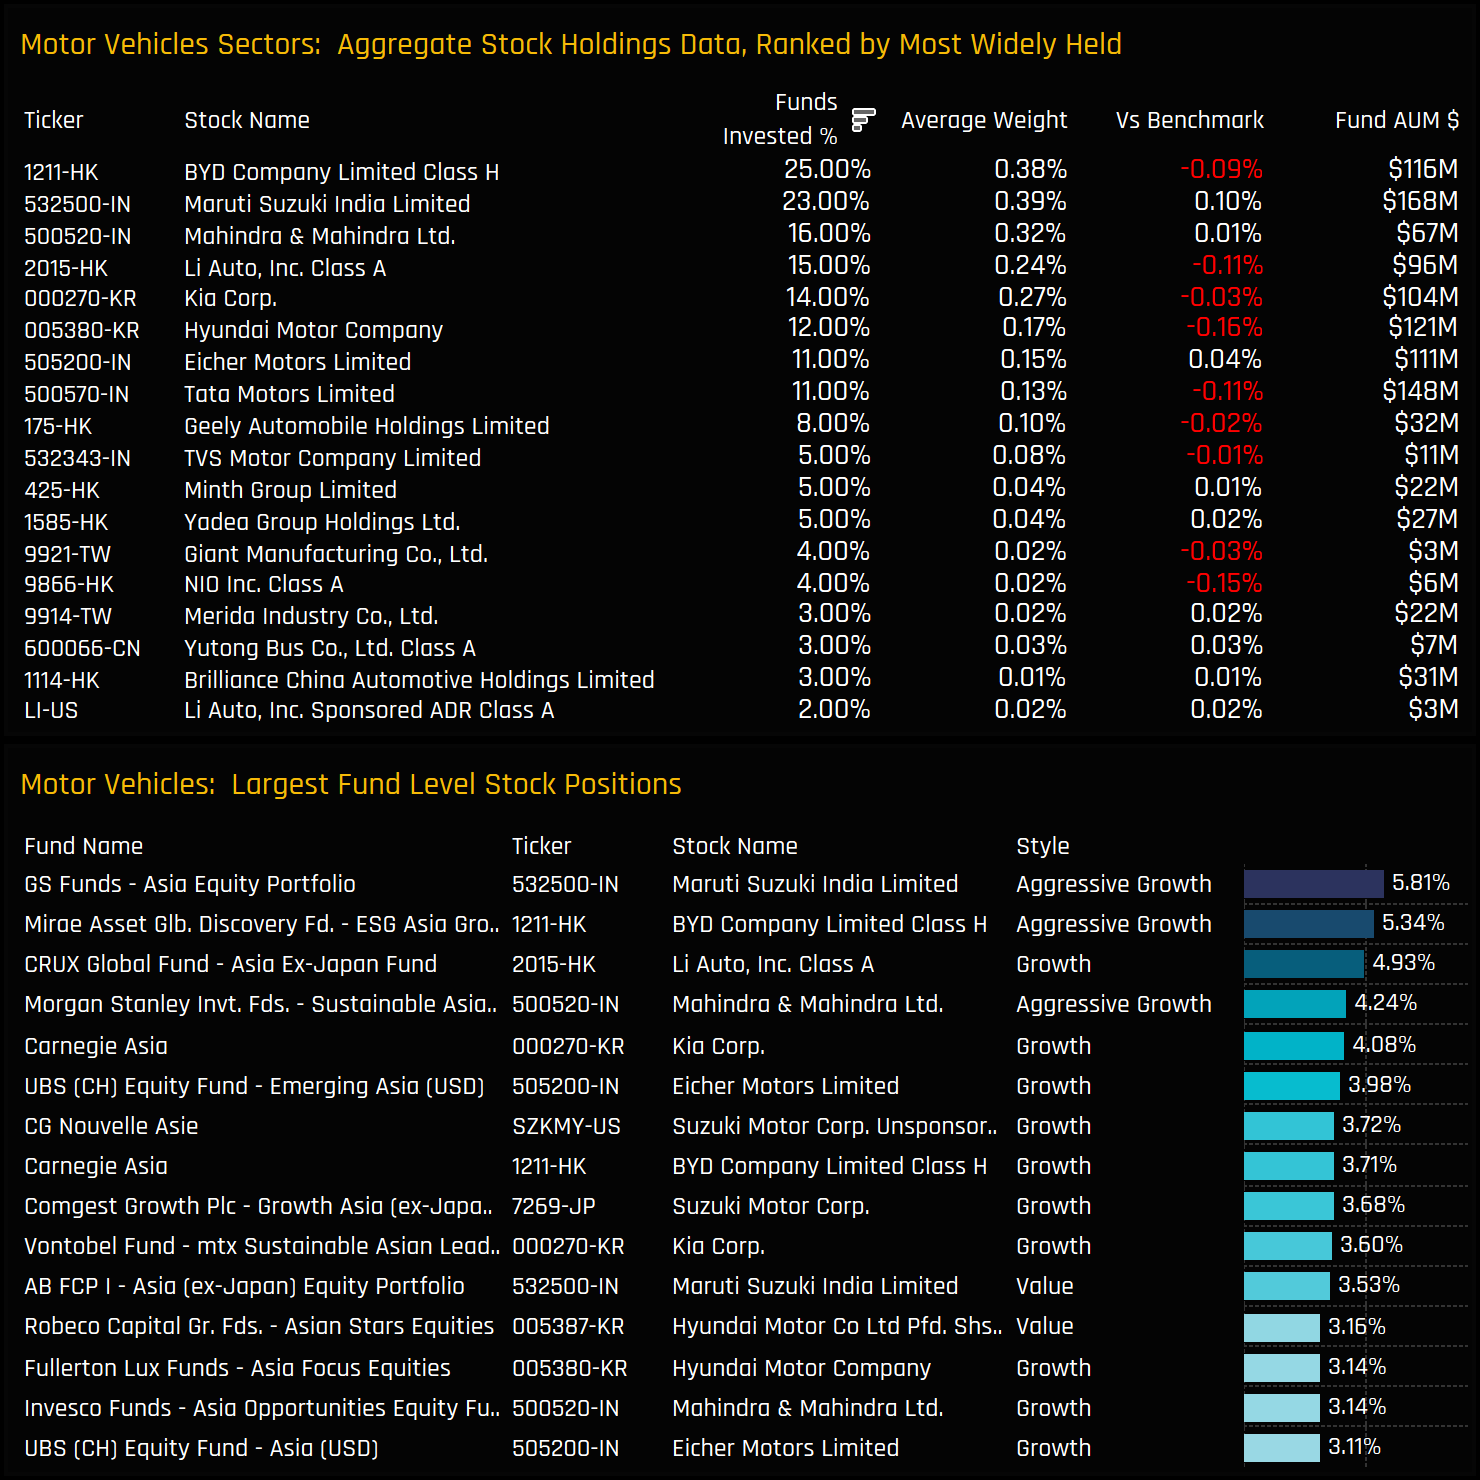
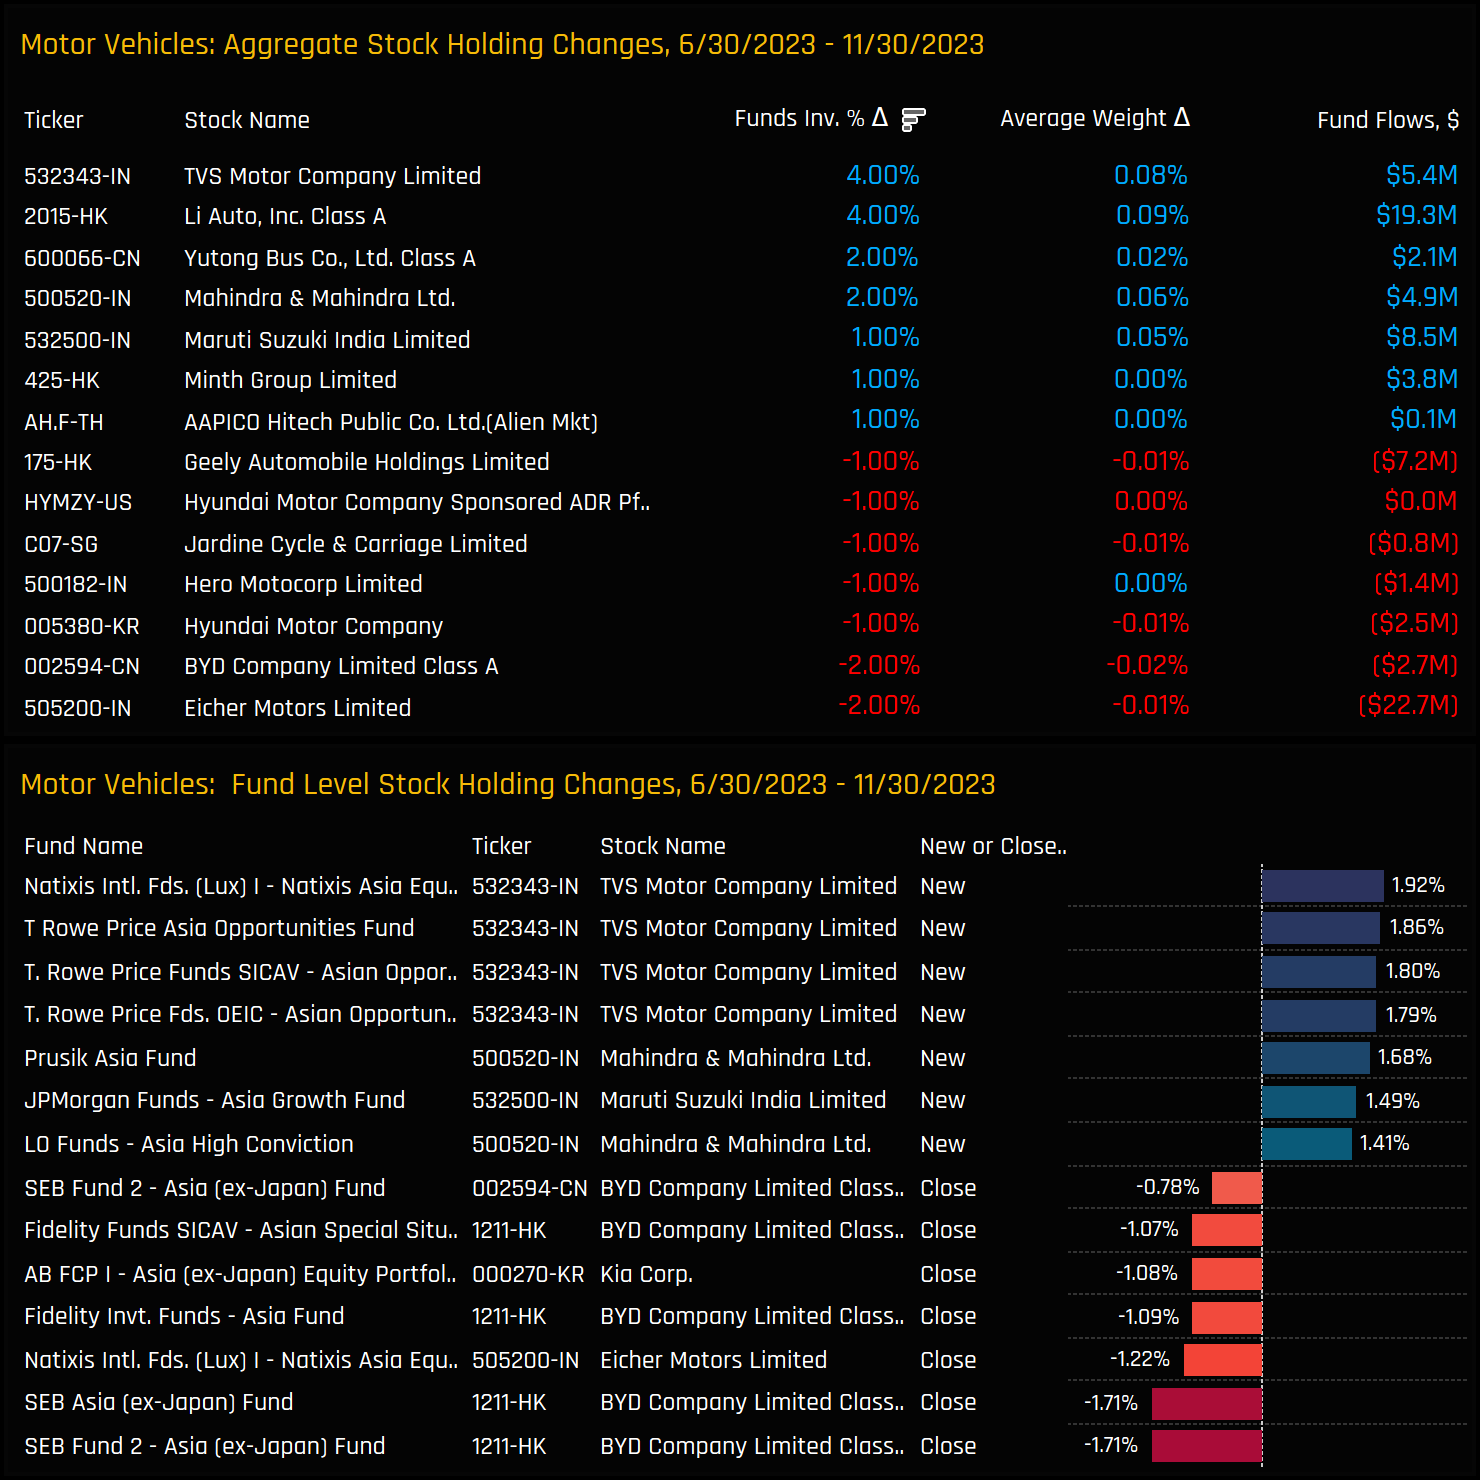
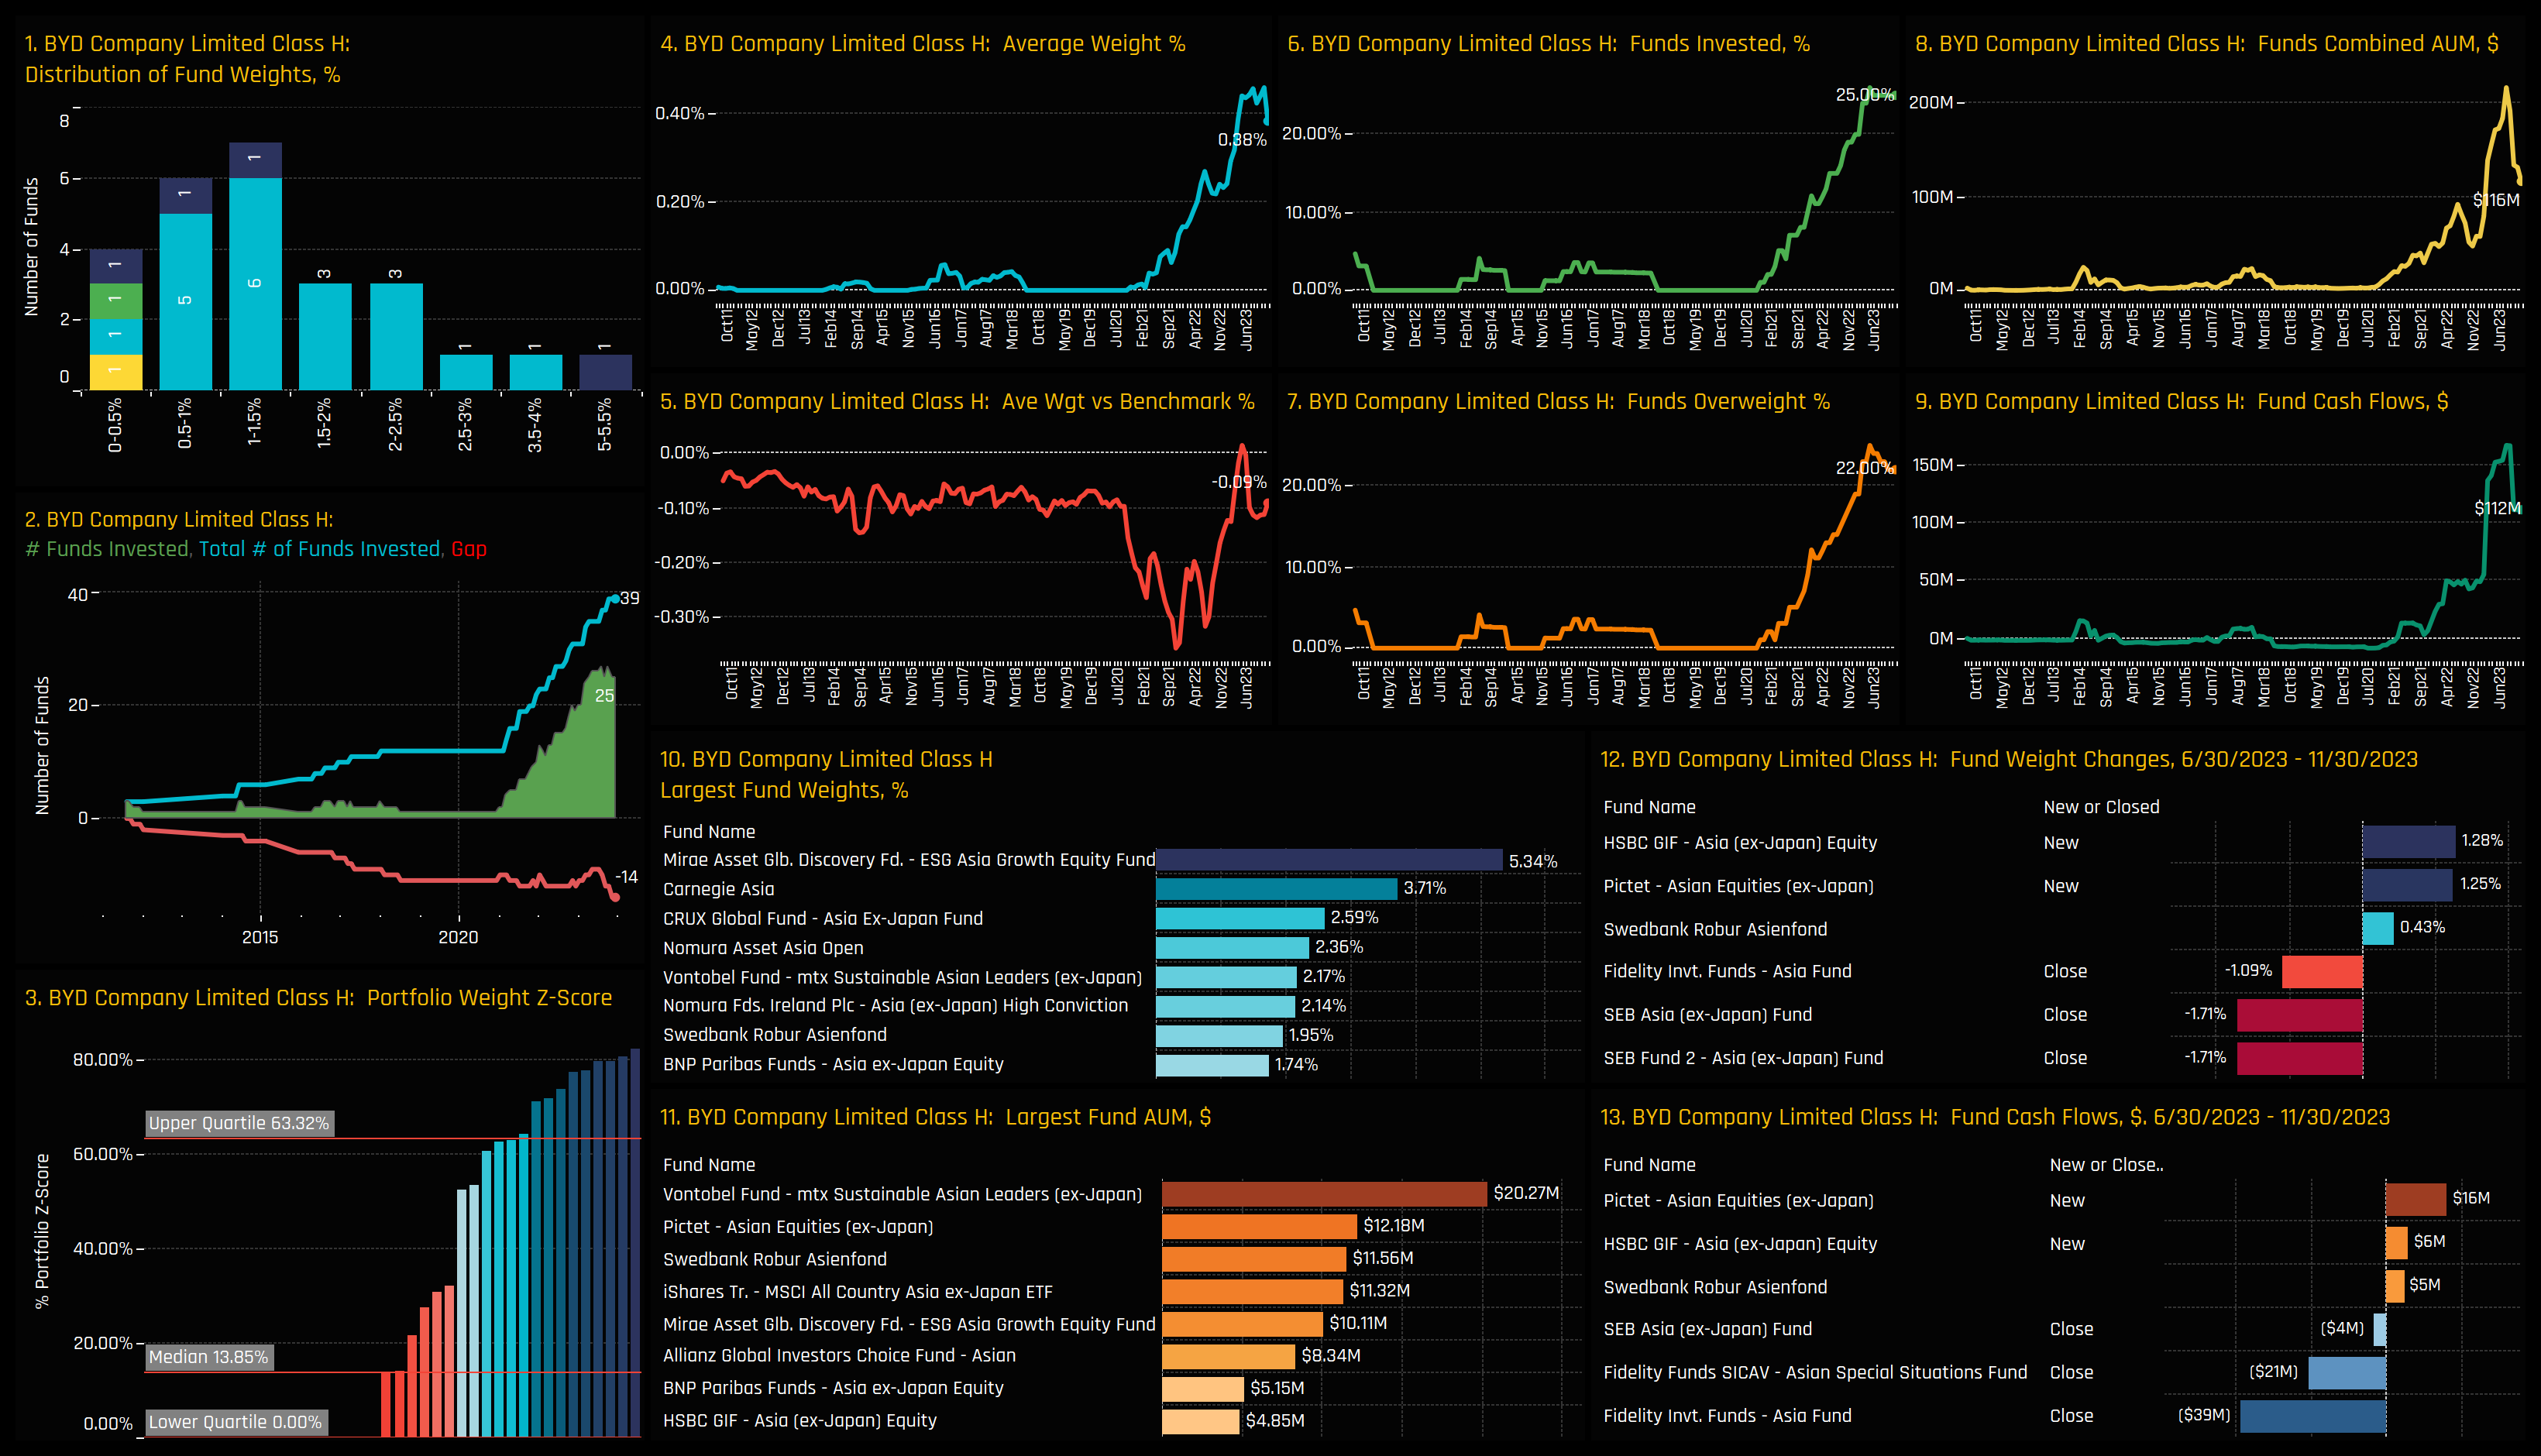
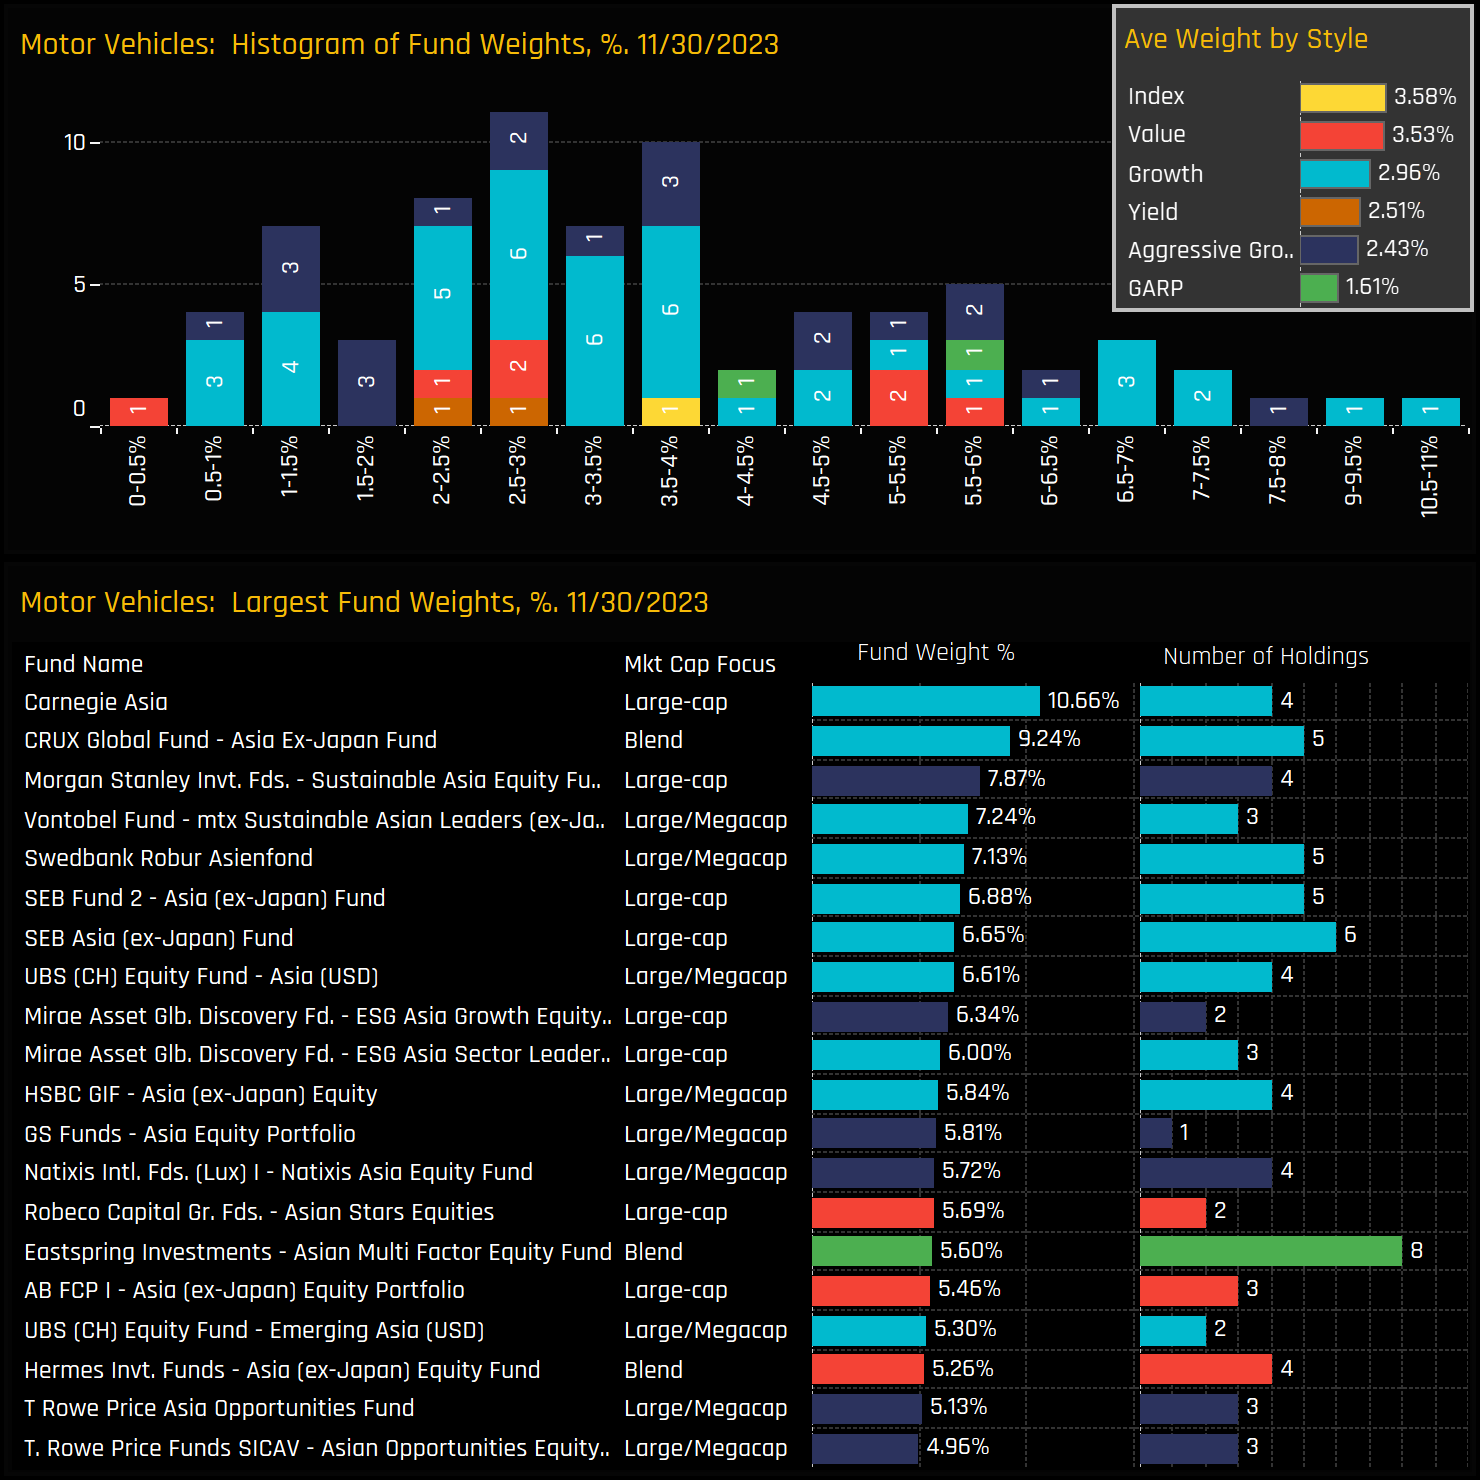
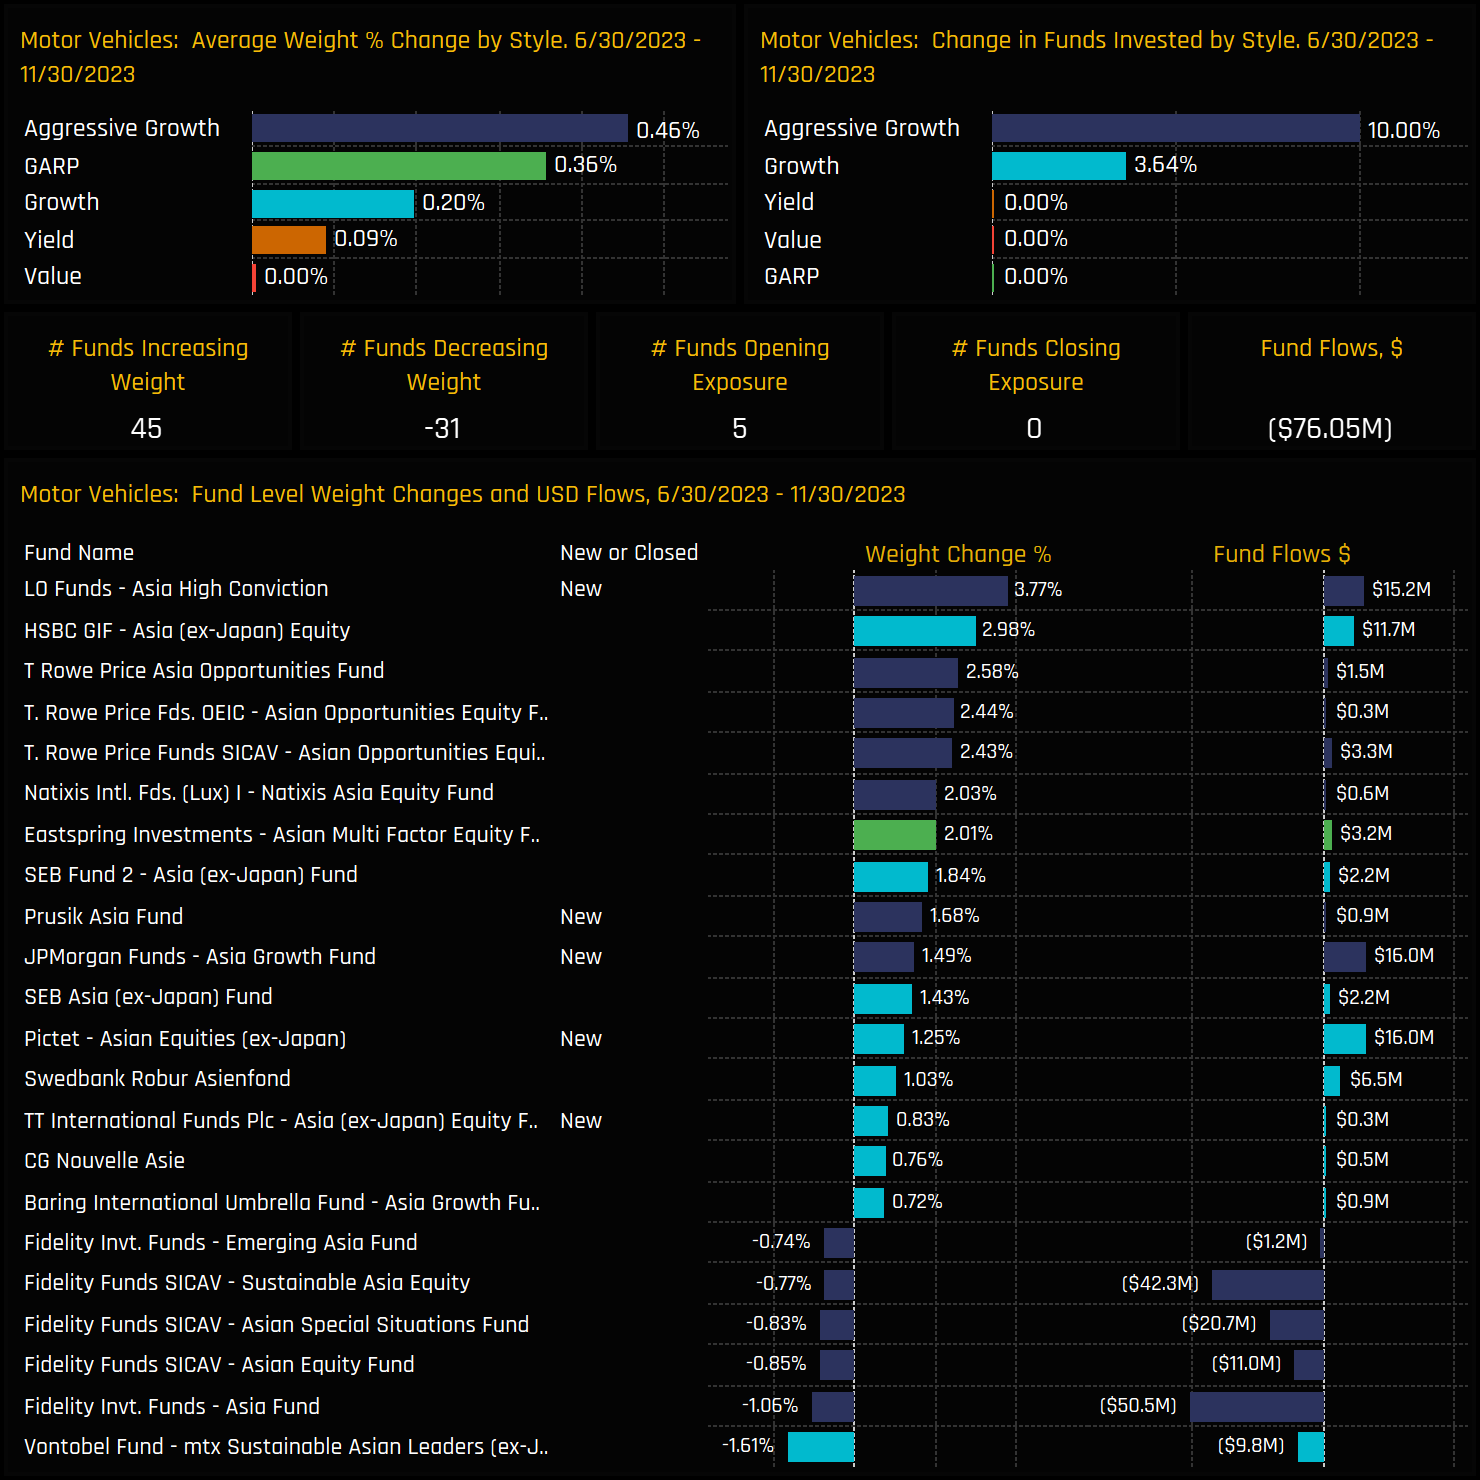
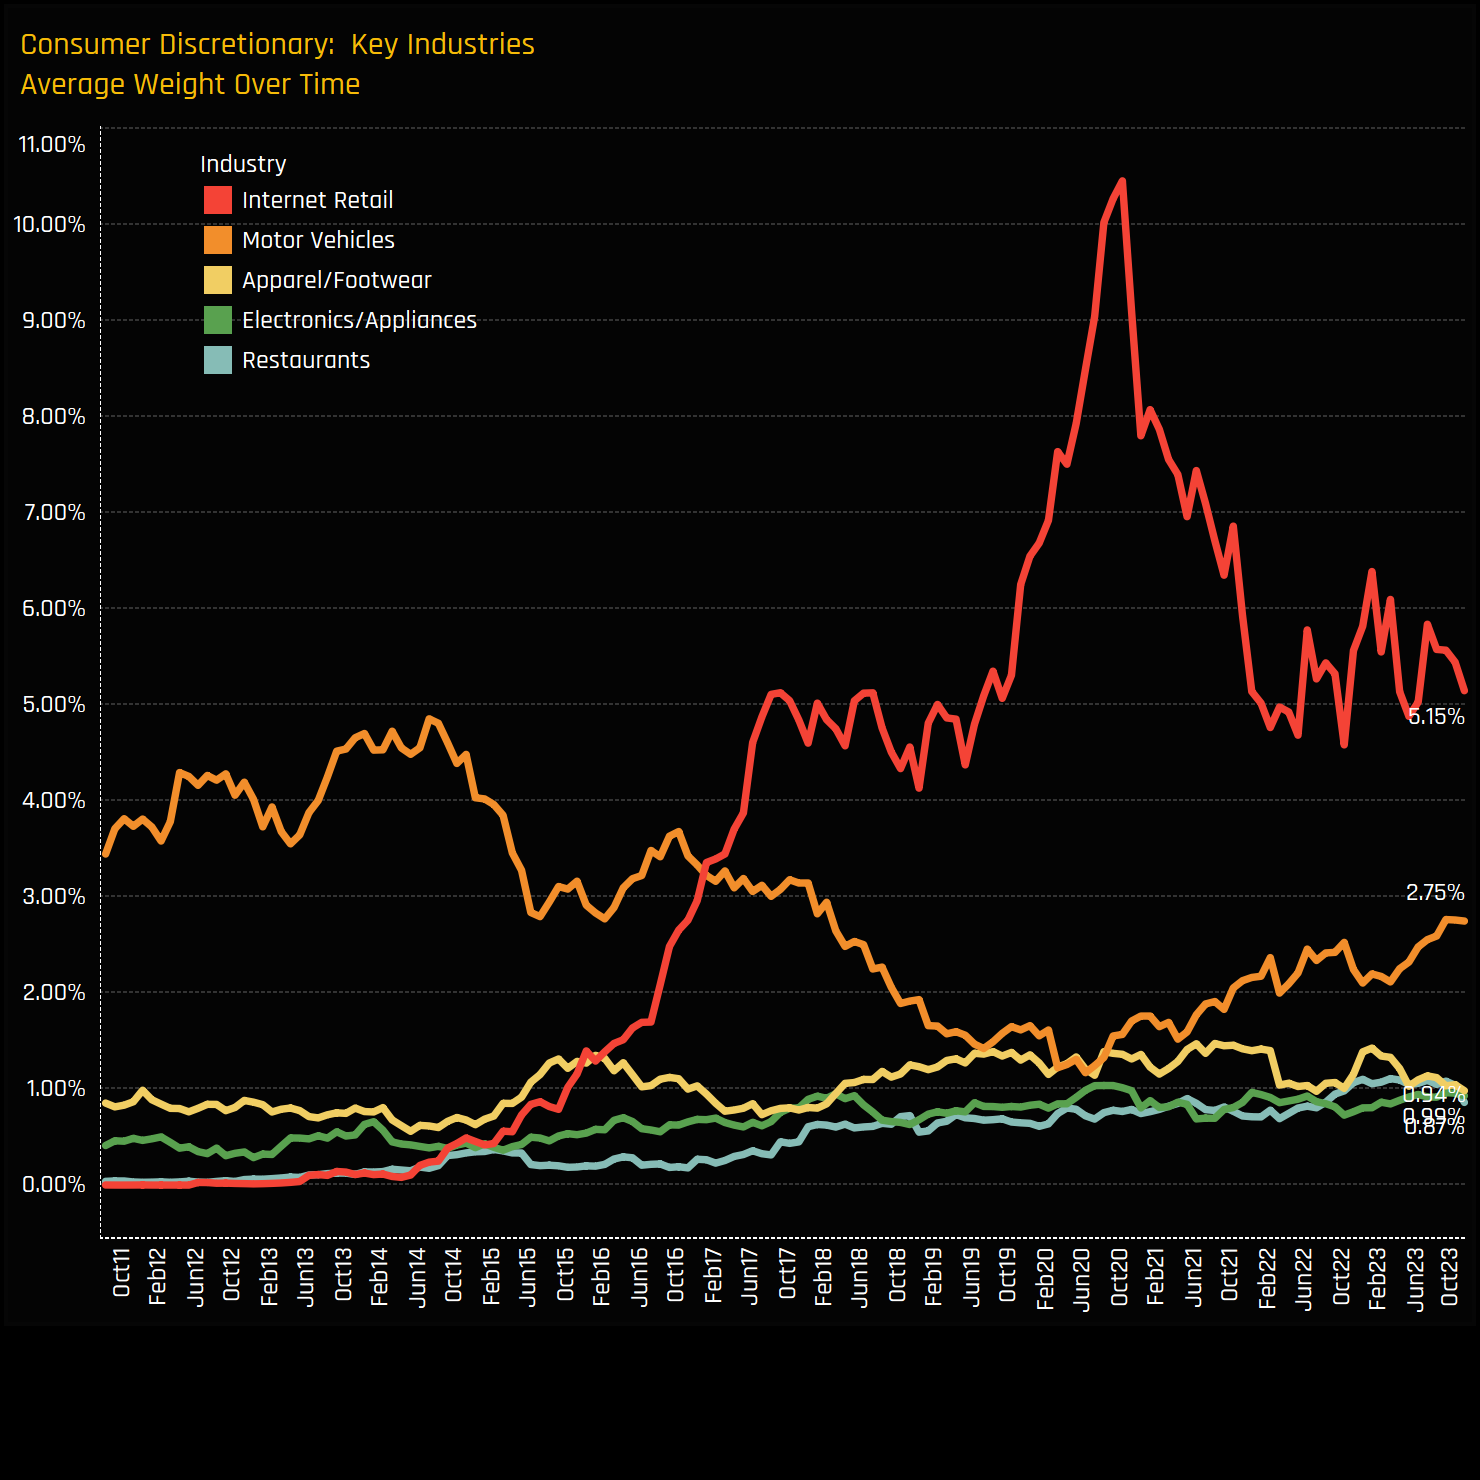
Asian Autos: Increasing Exposure Reflects Rising Market Confidence
- Steve Holden
- 0 Comments
Related Posts

