13 December
Emerging Markets
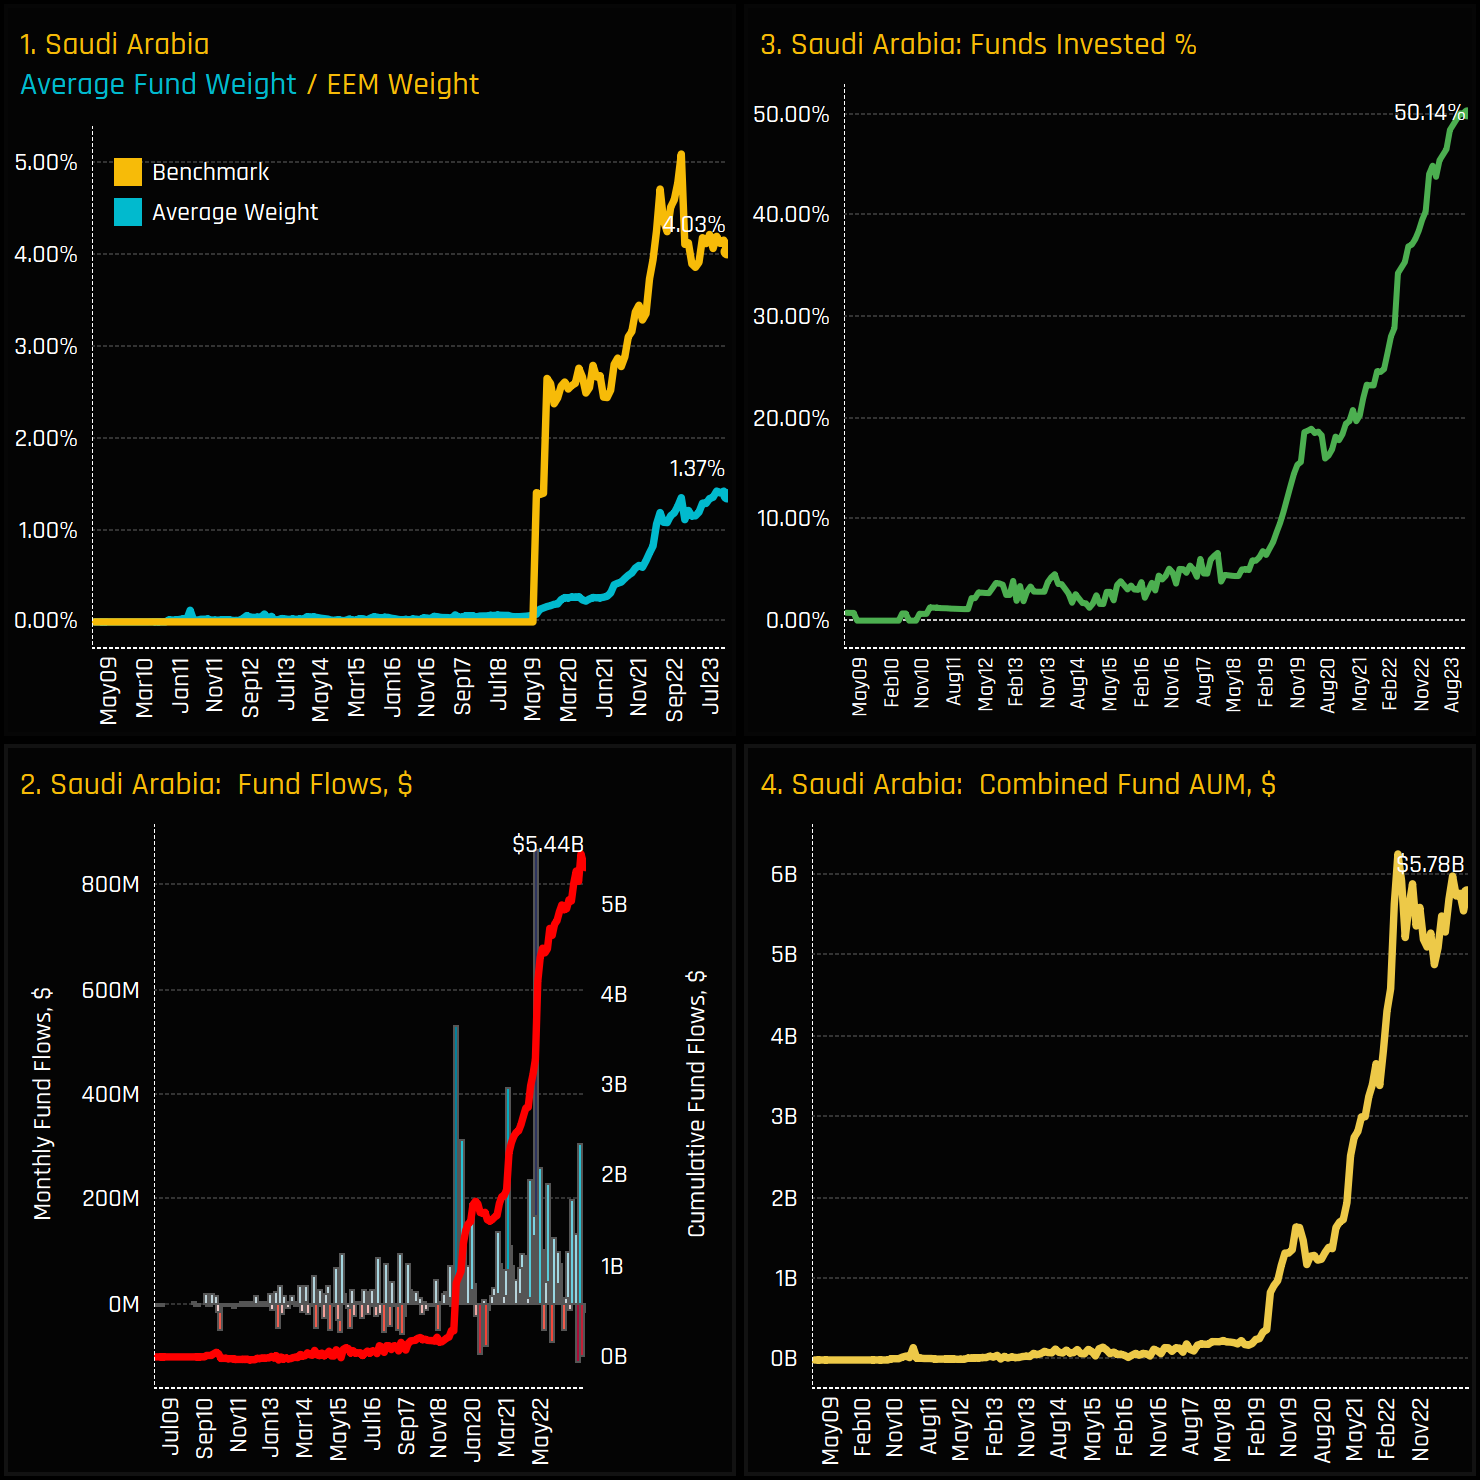
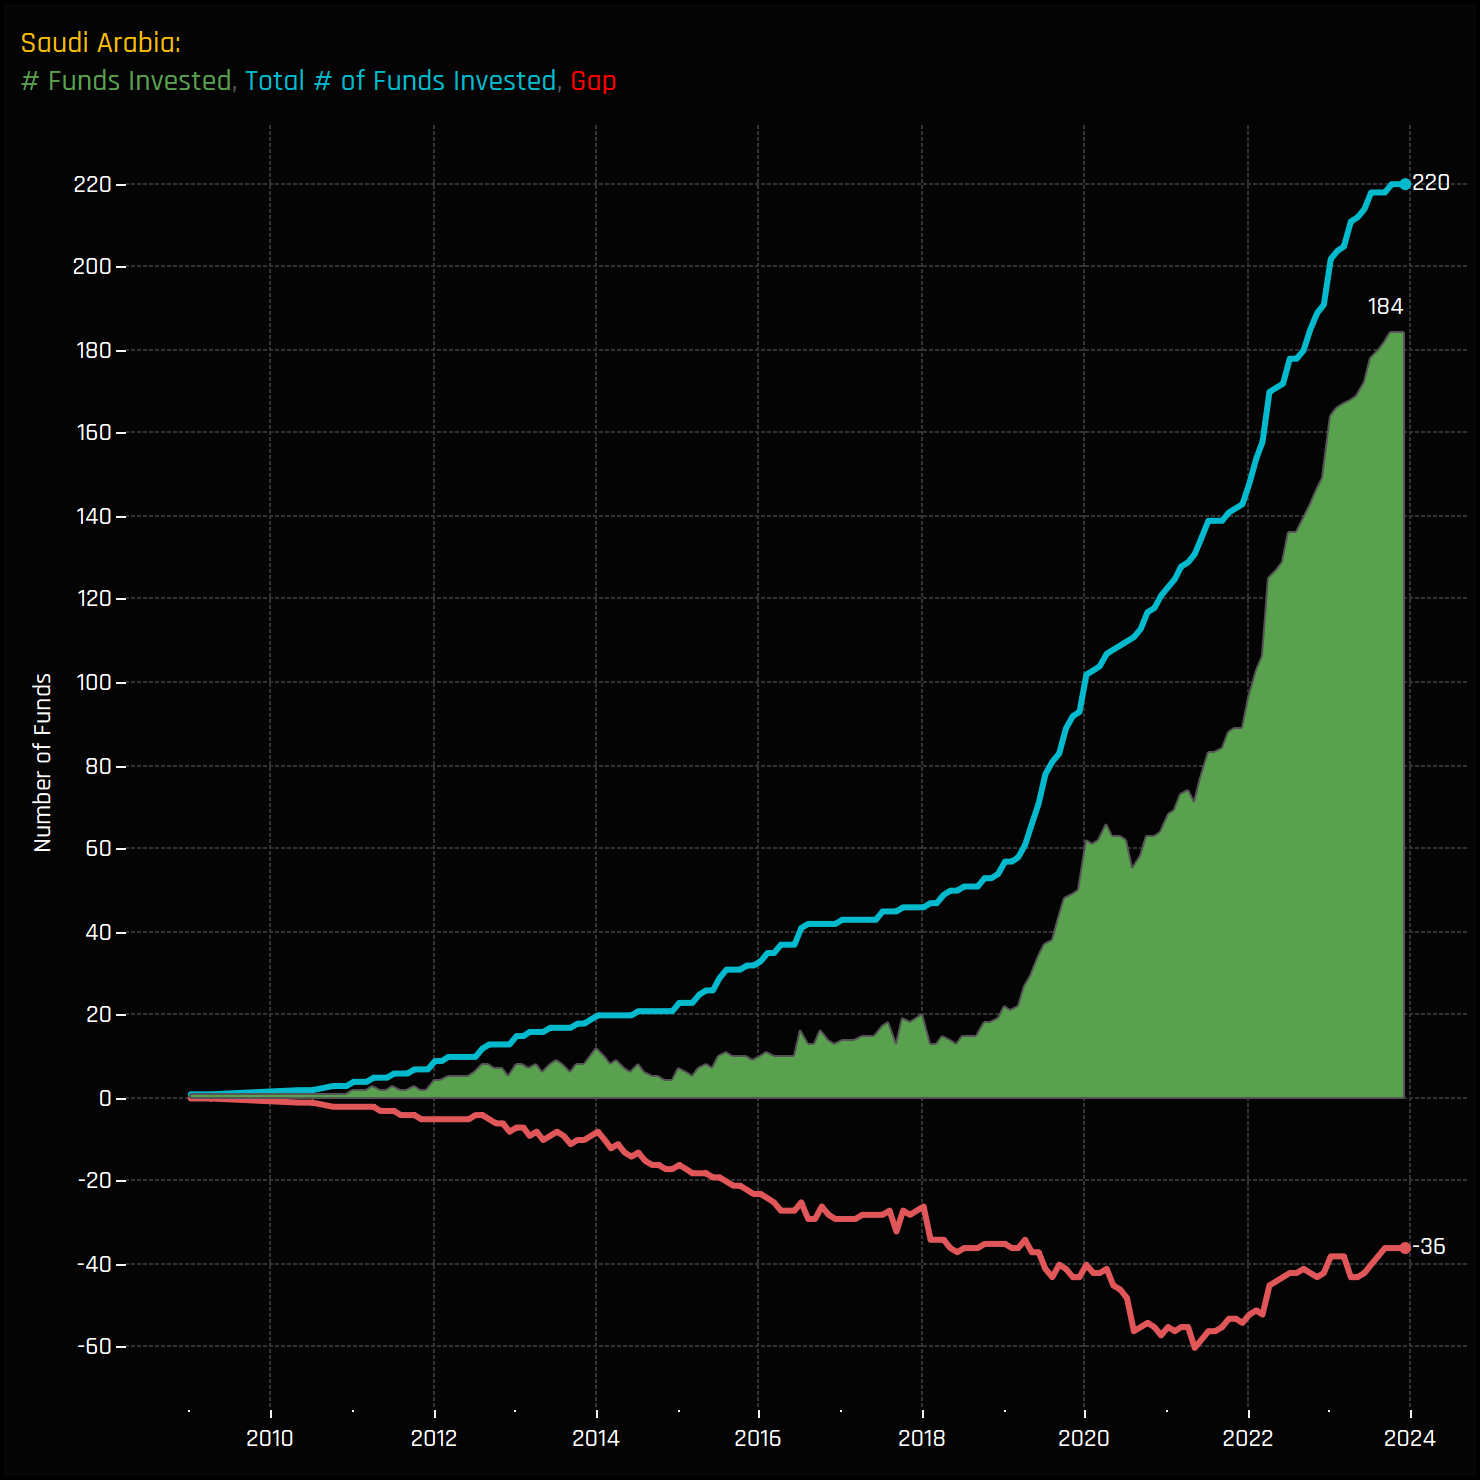
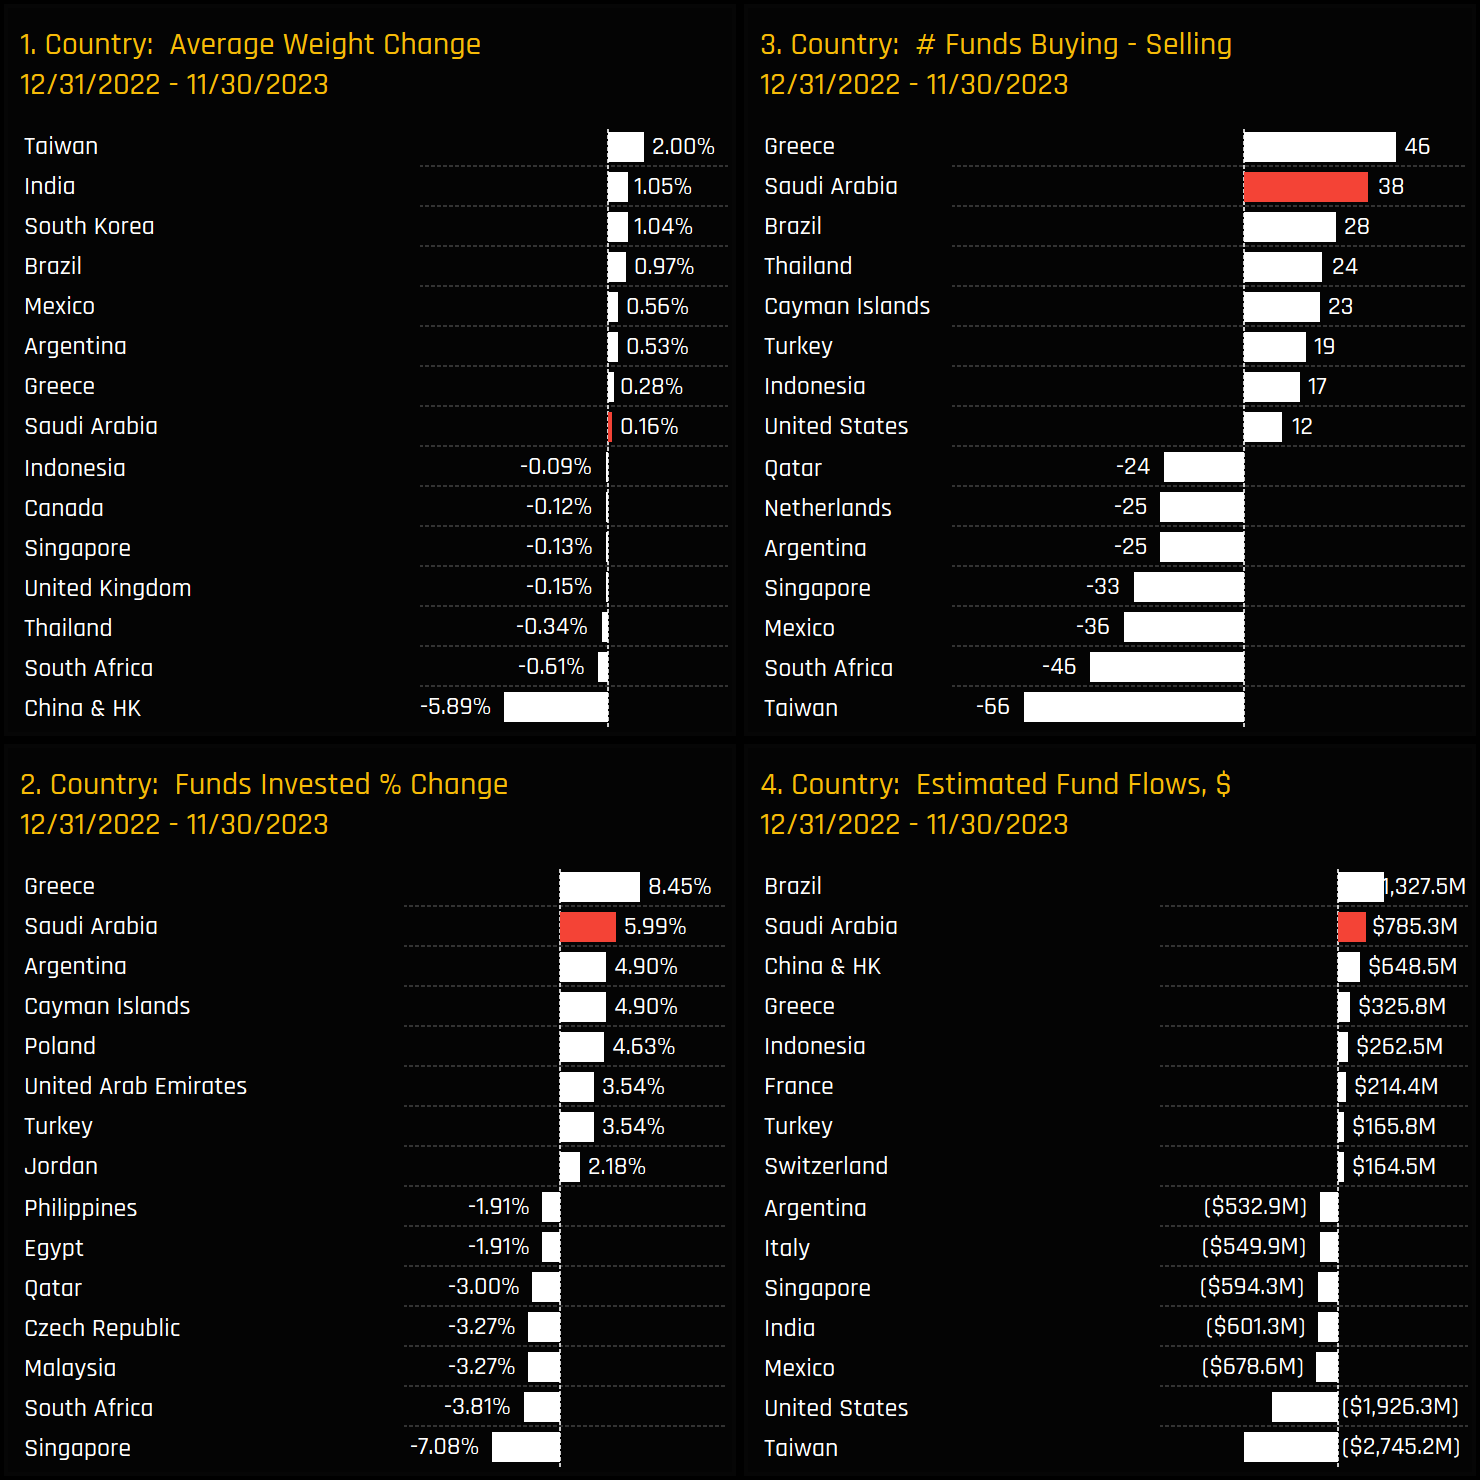
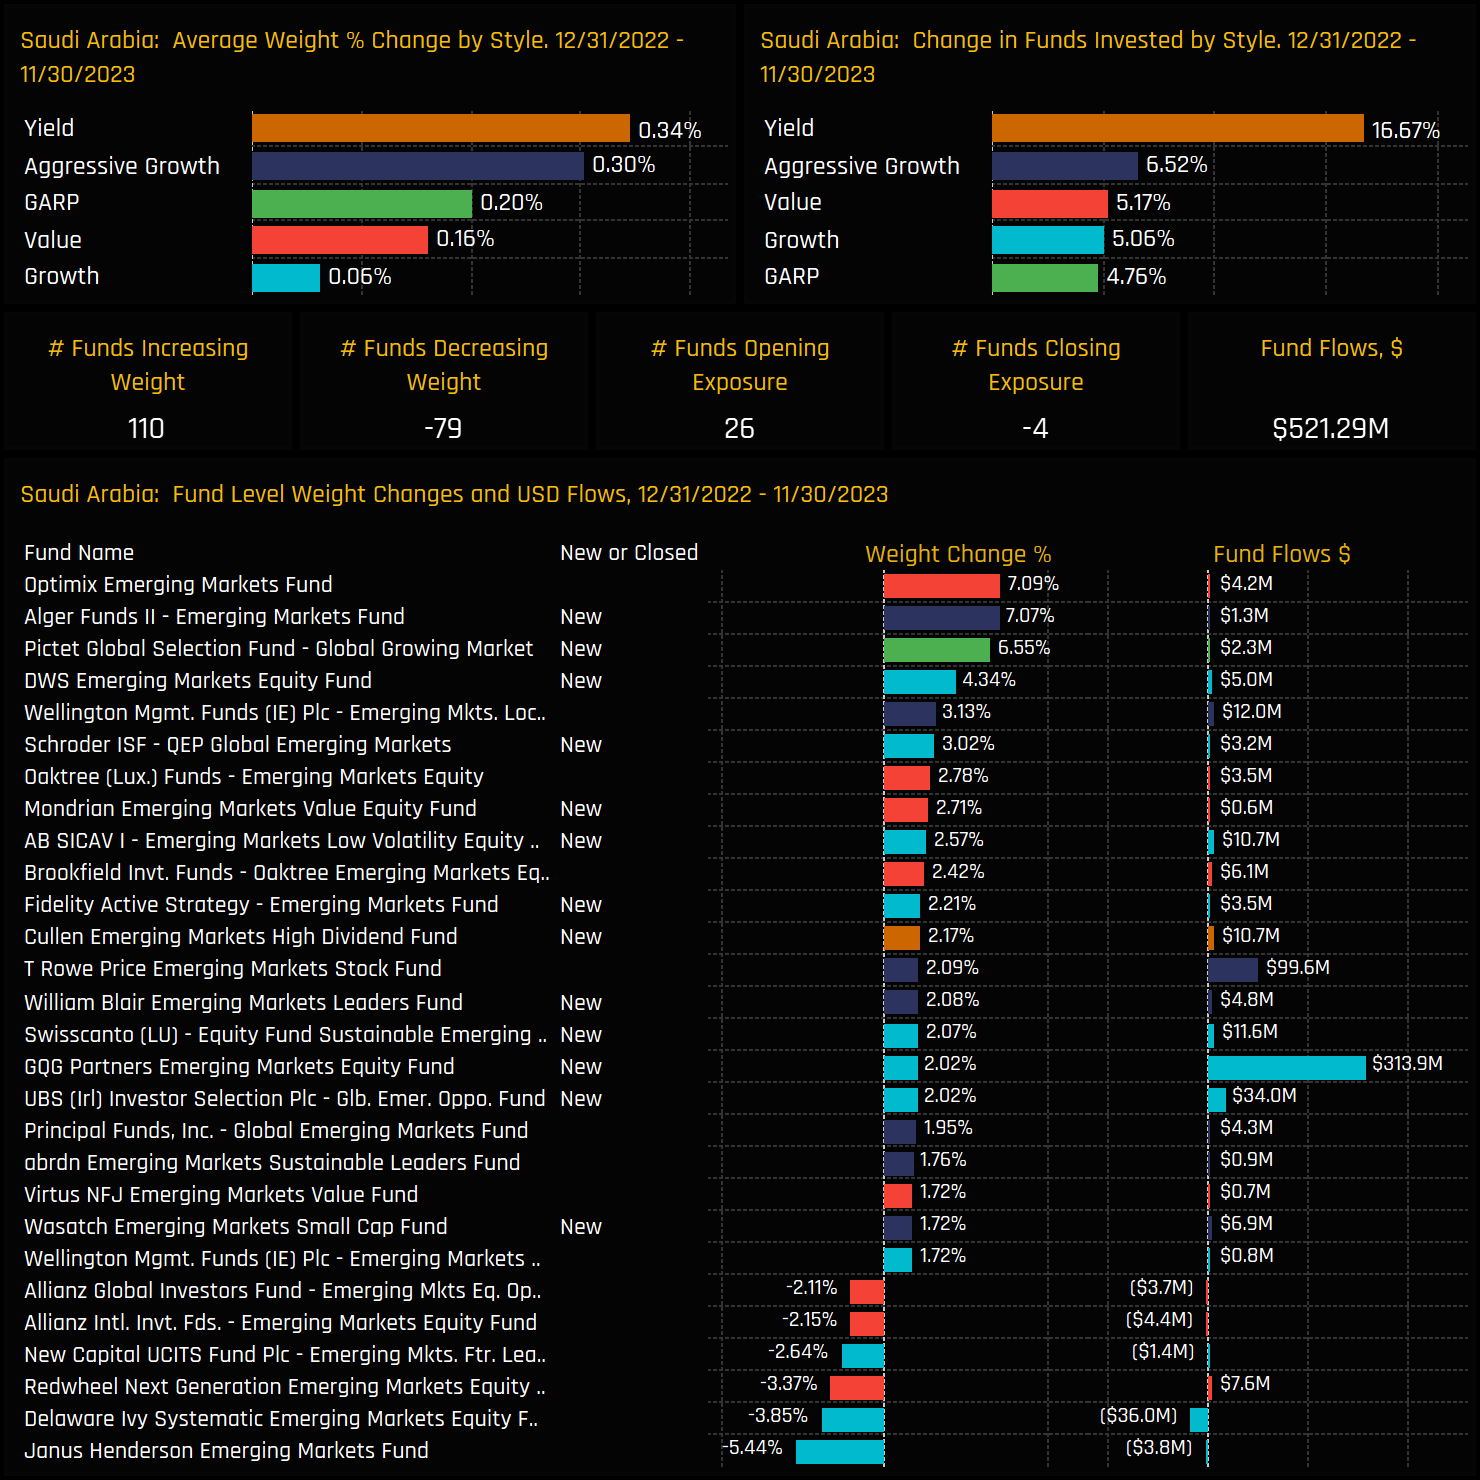
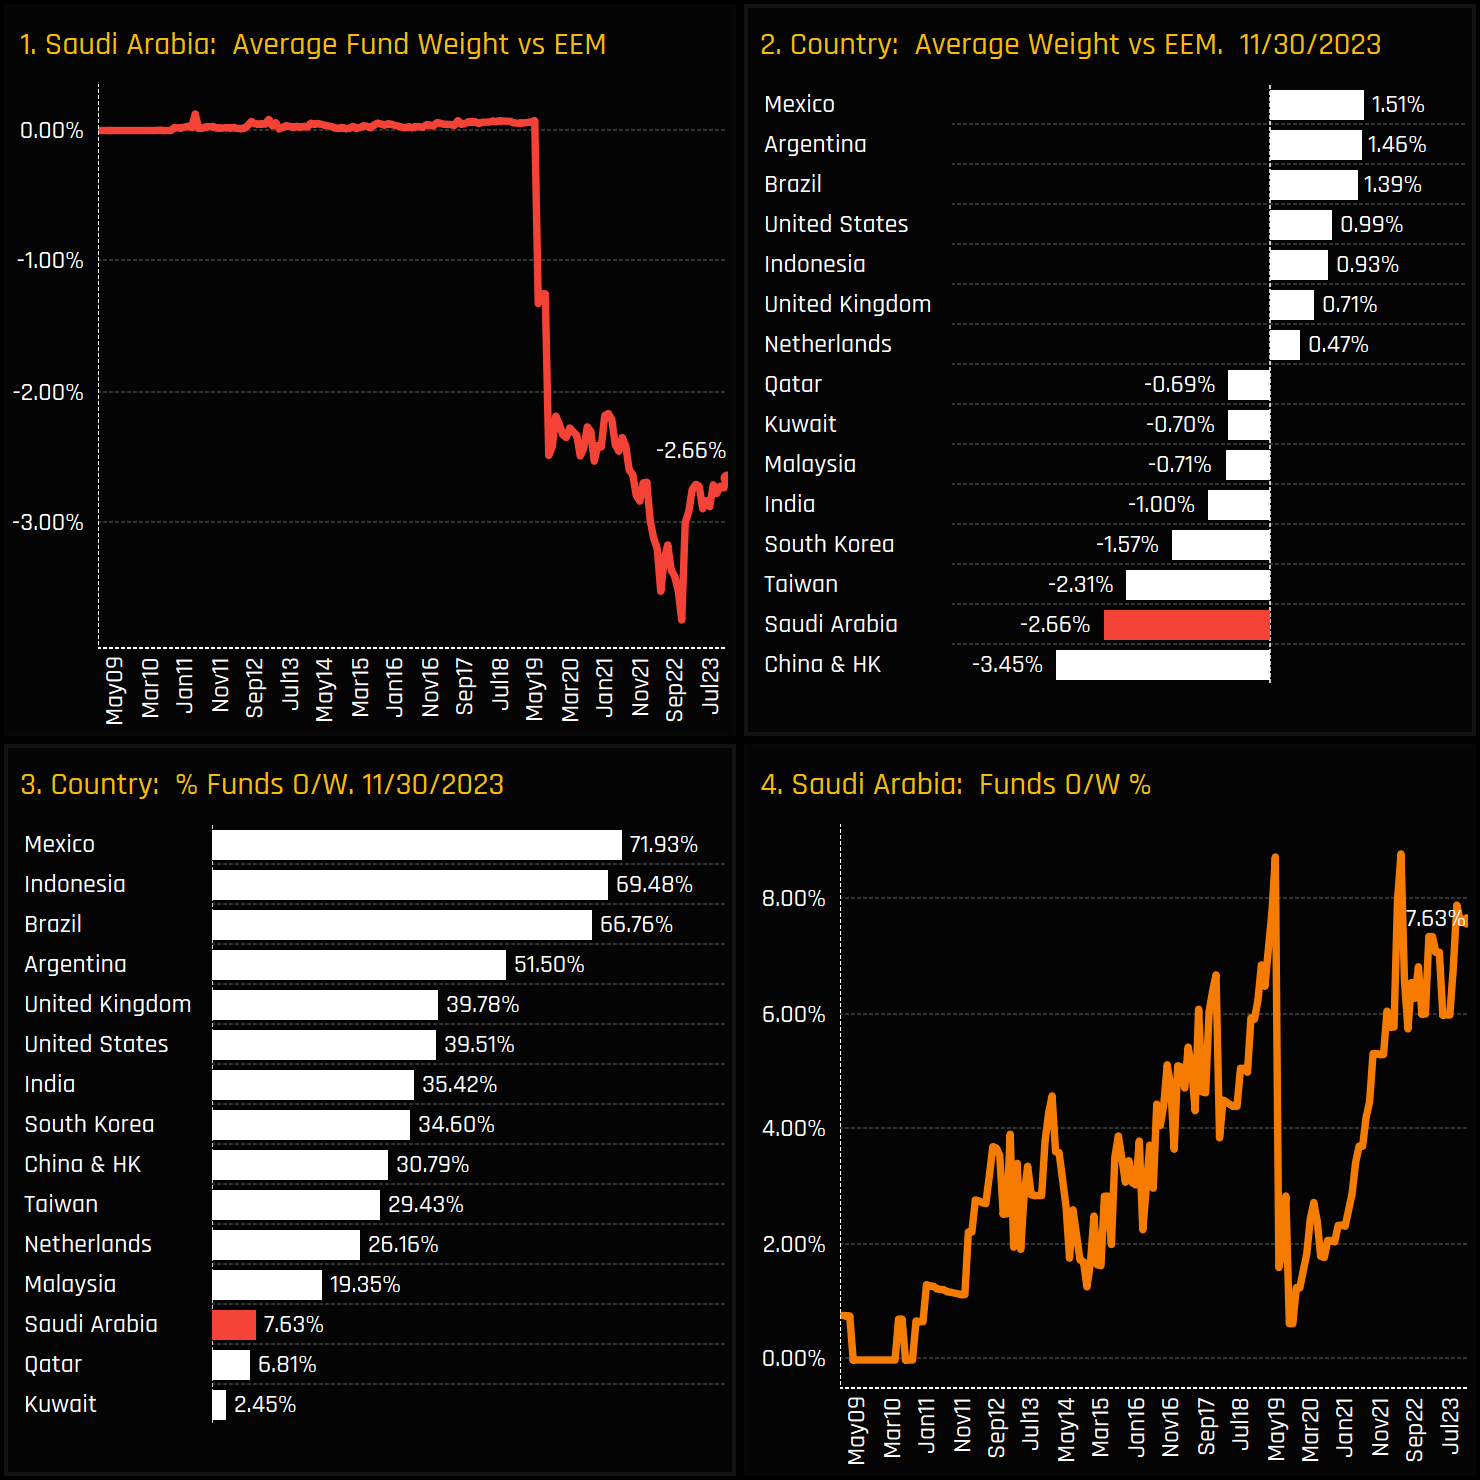
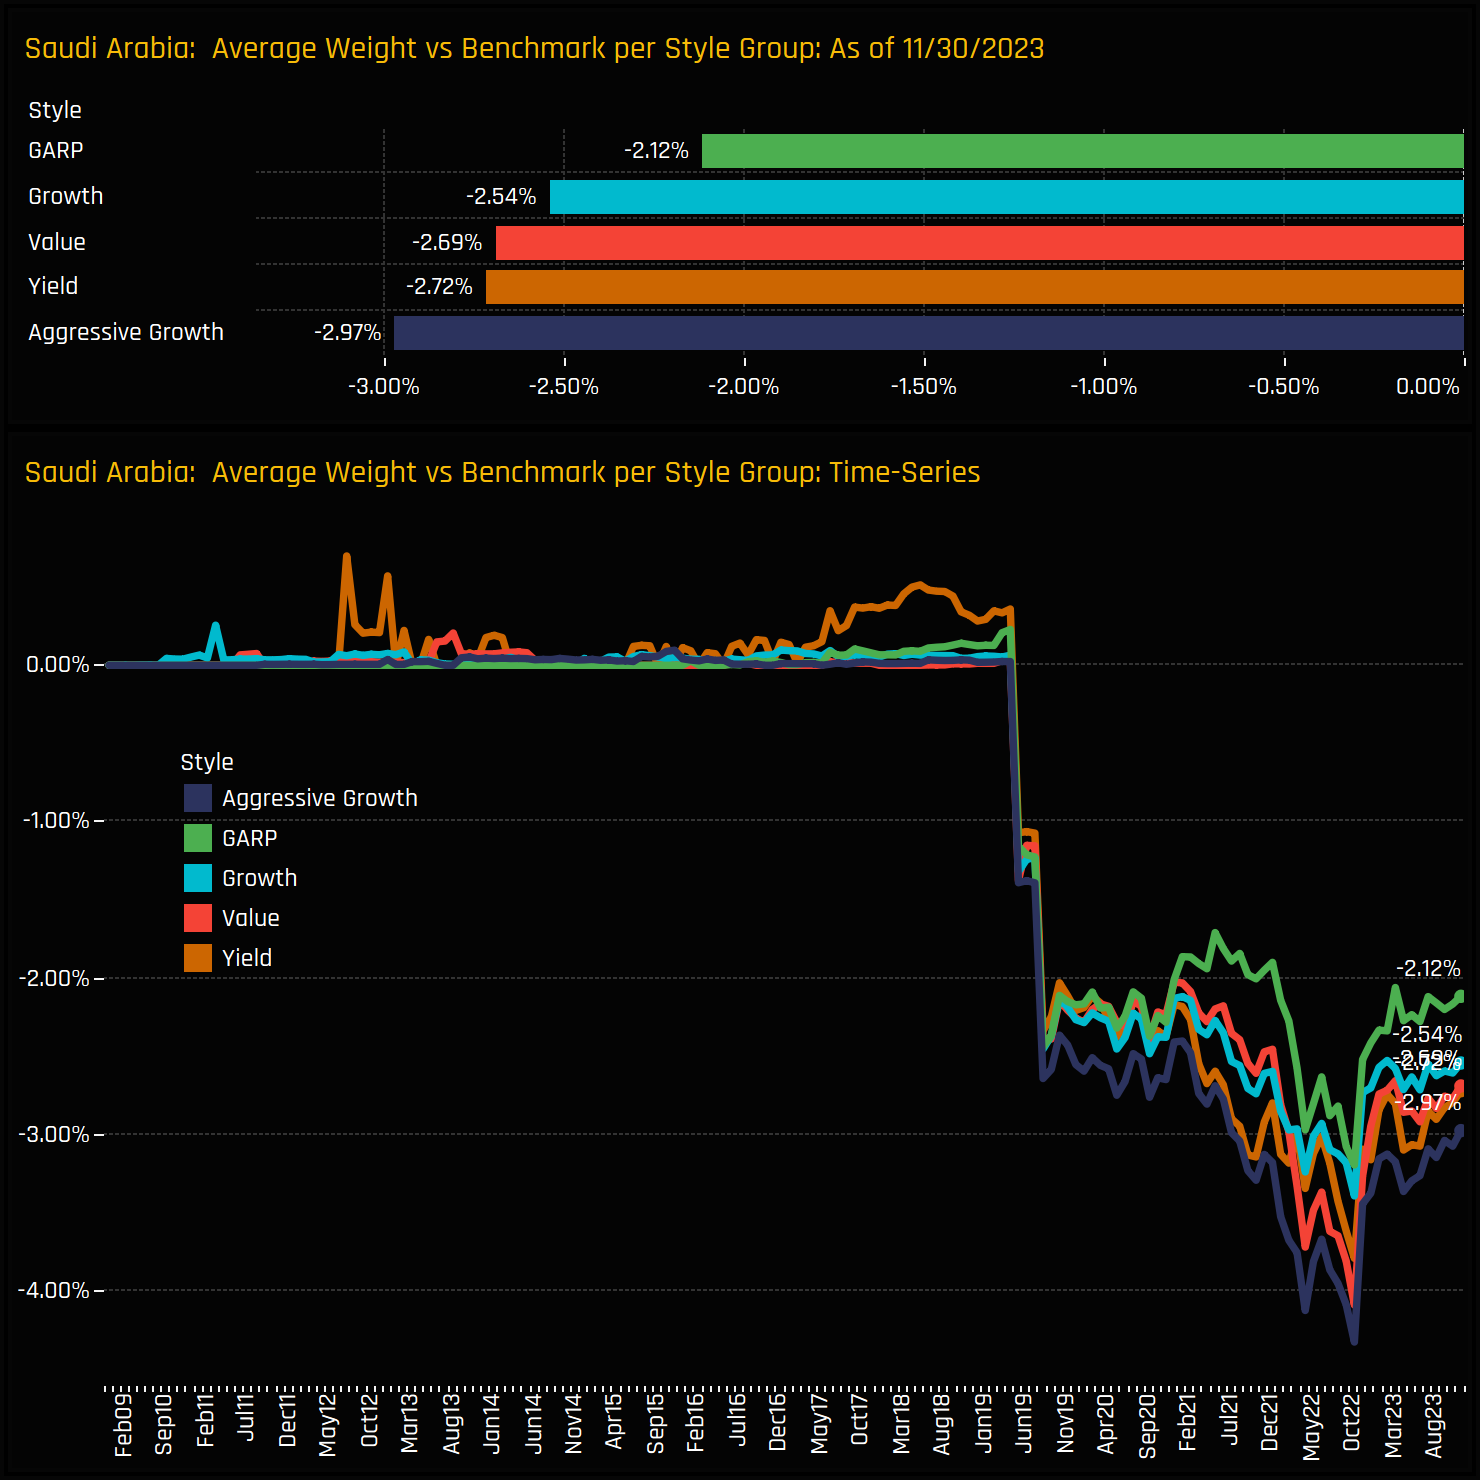
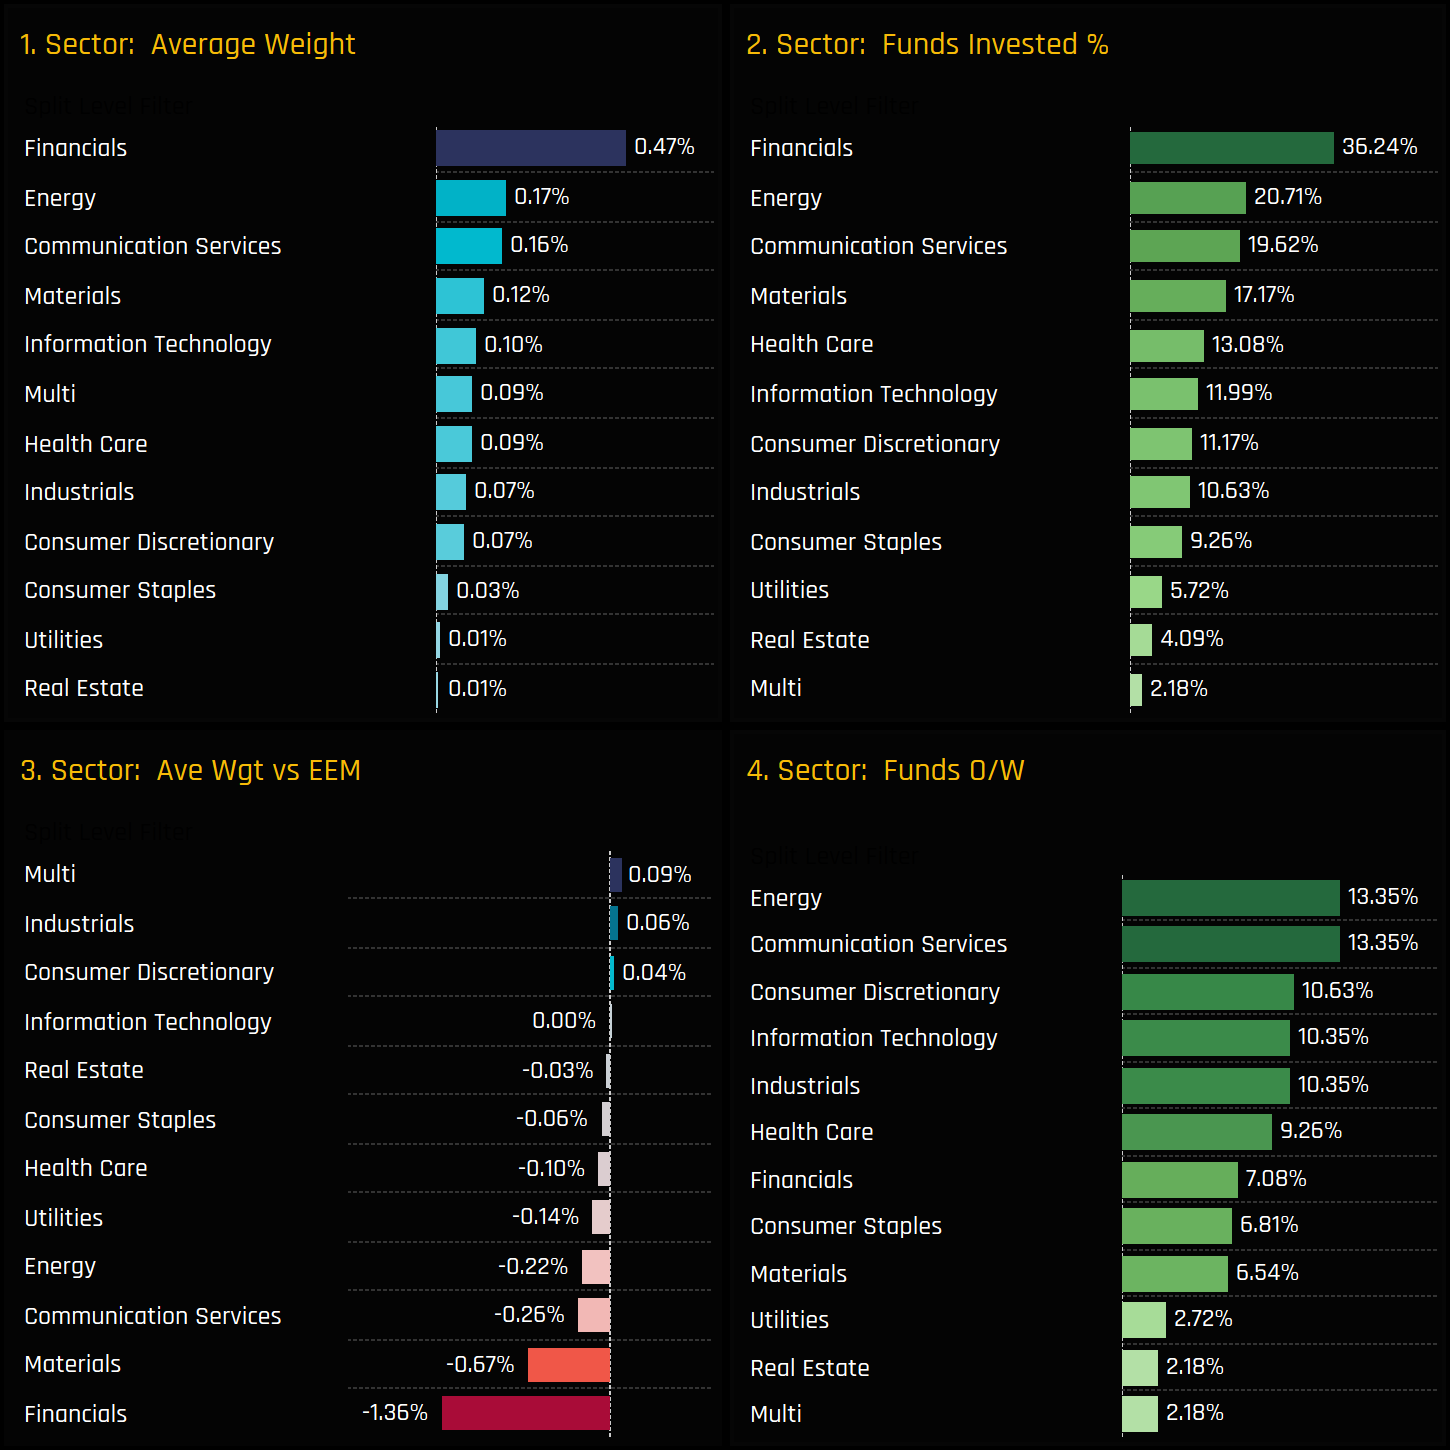
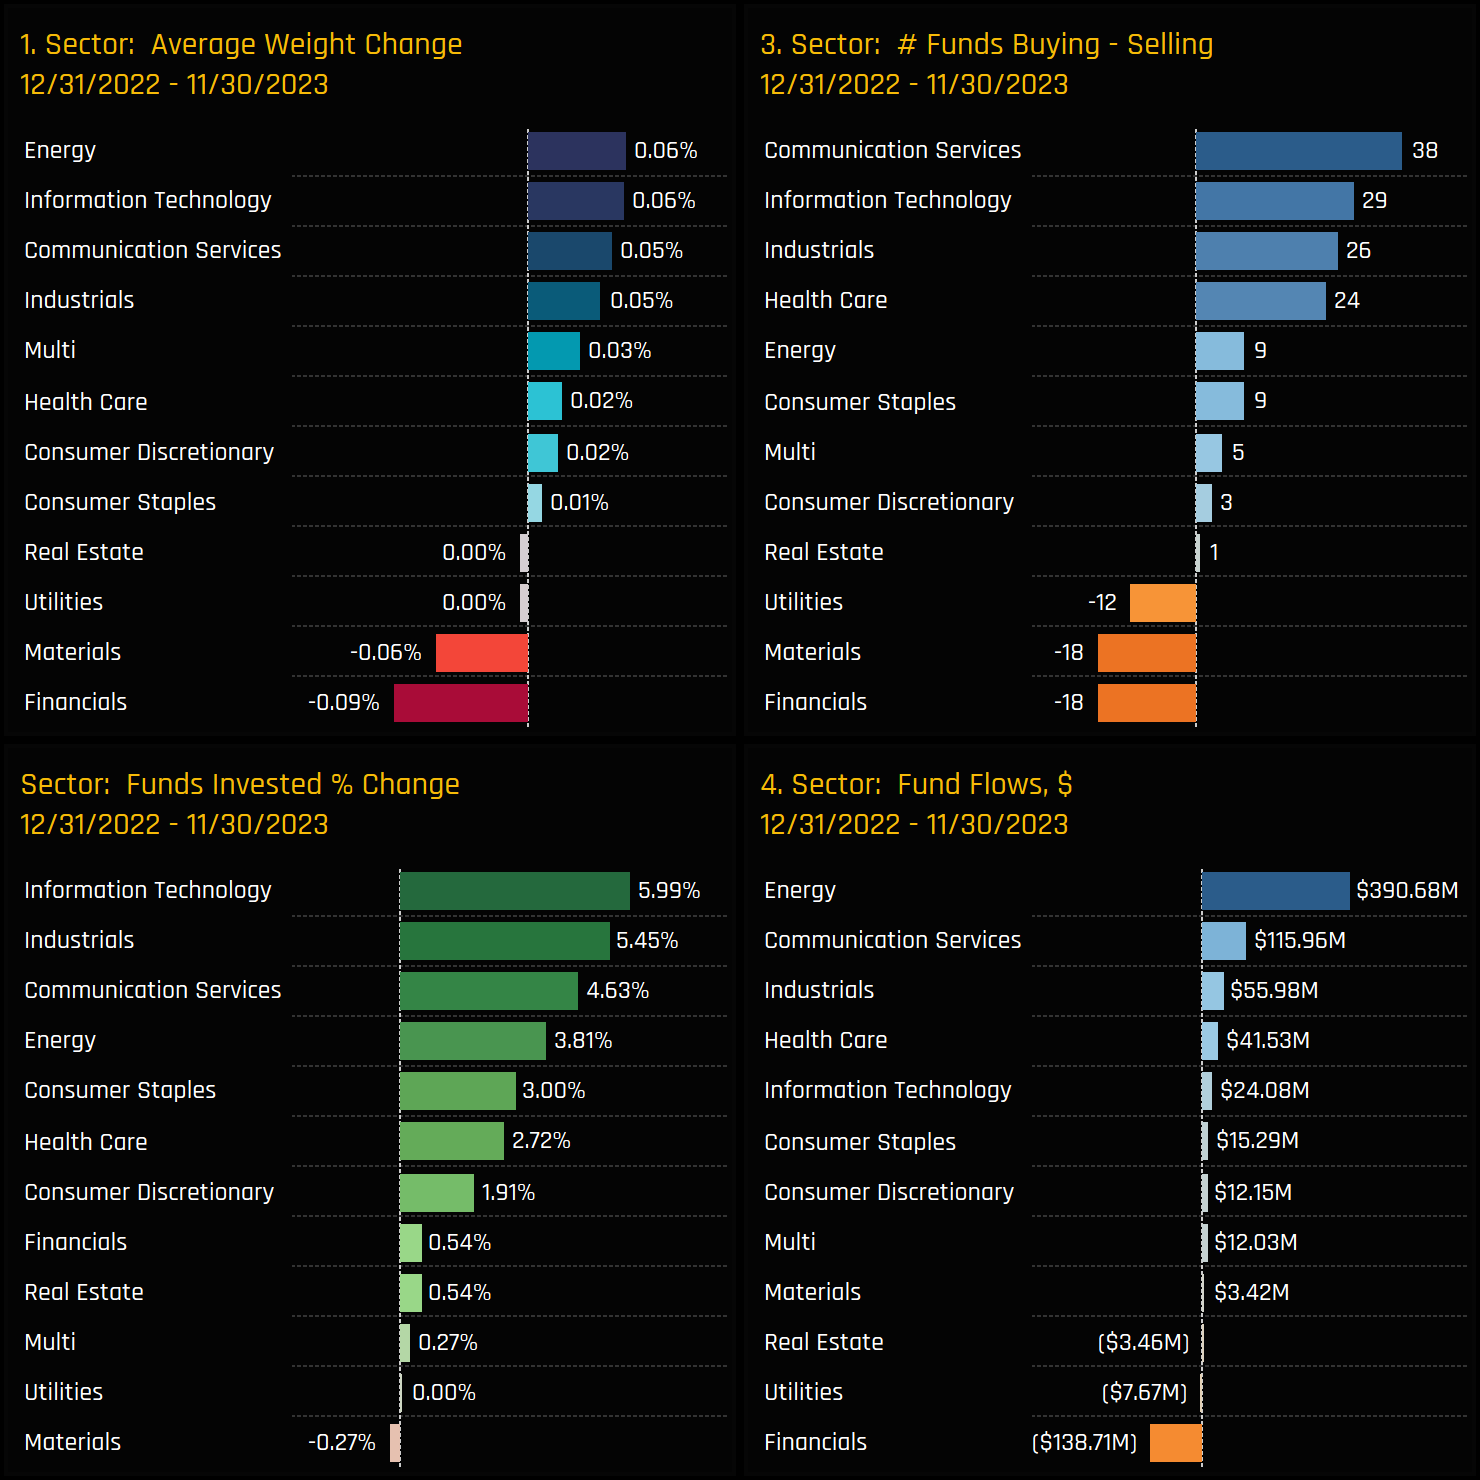
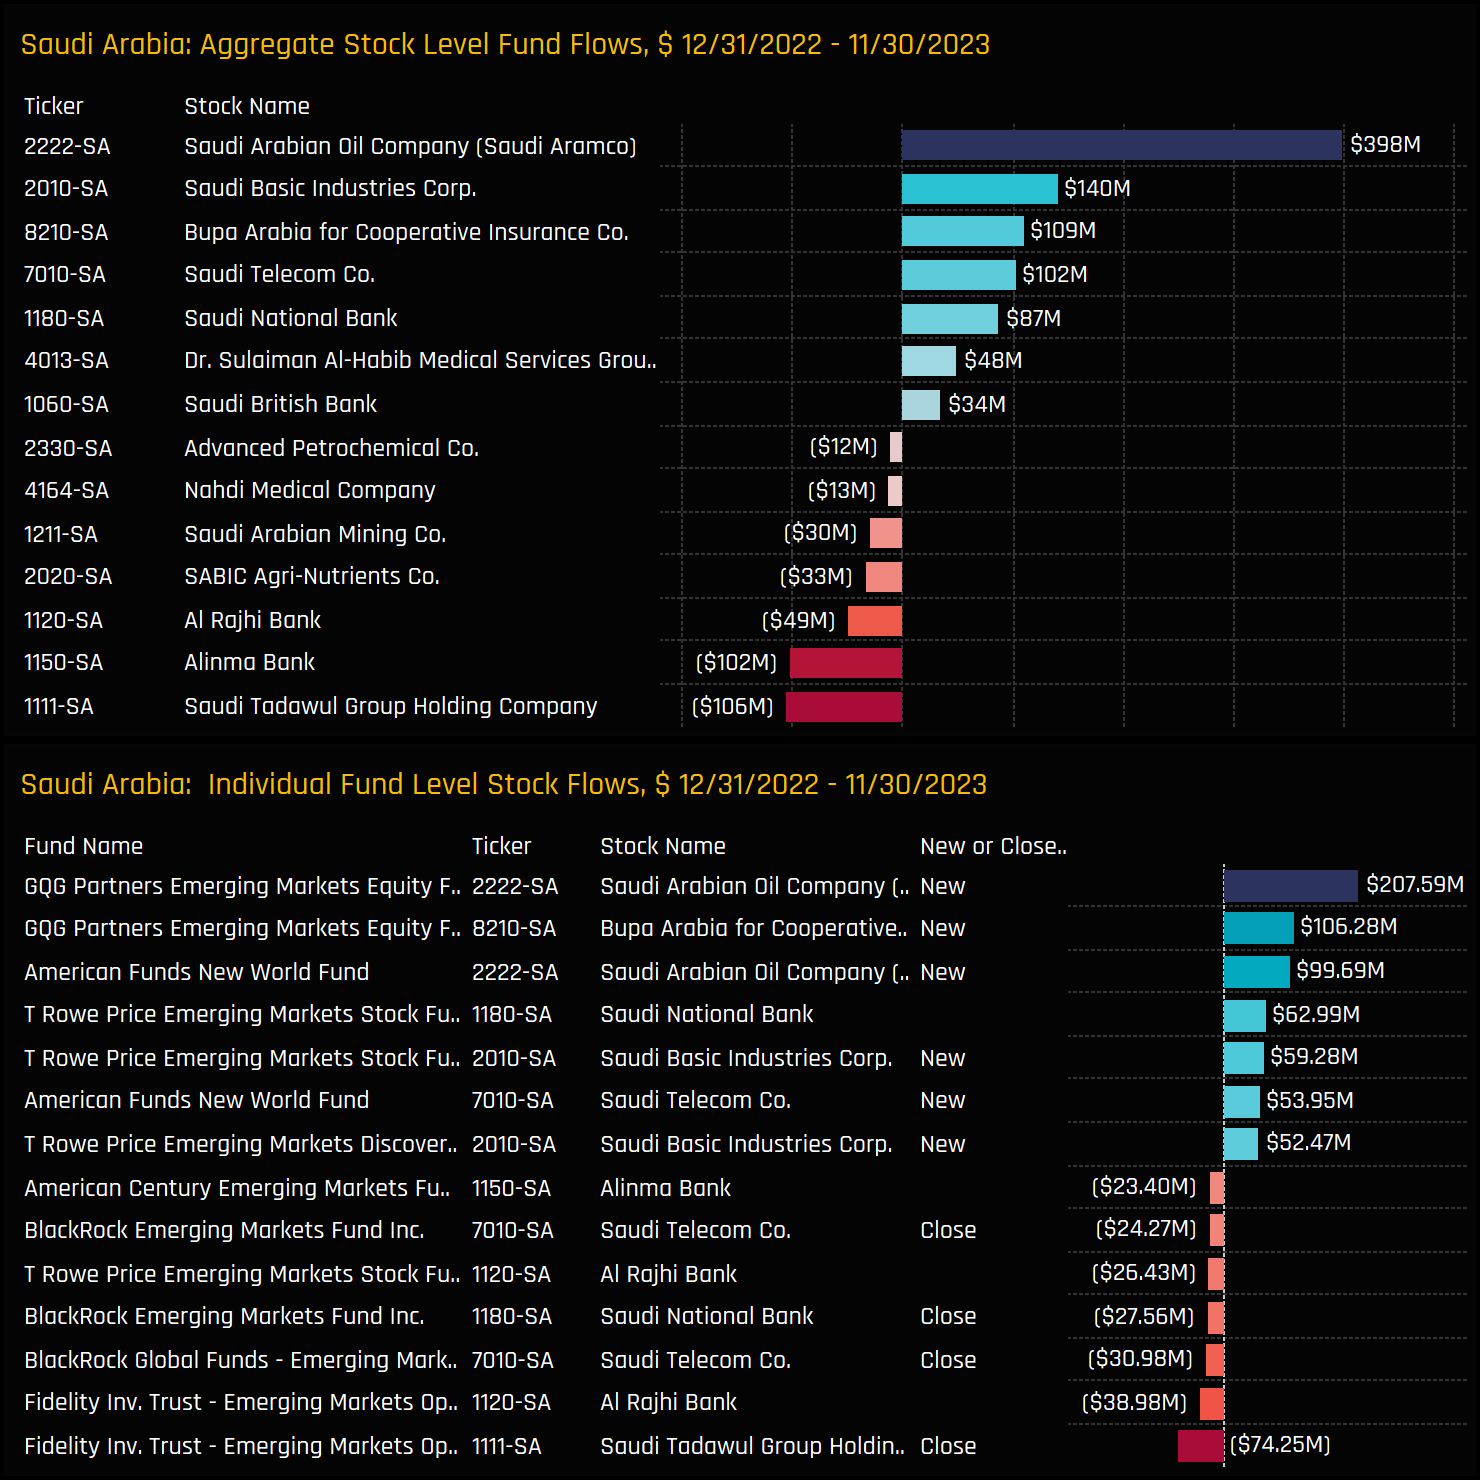
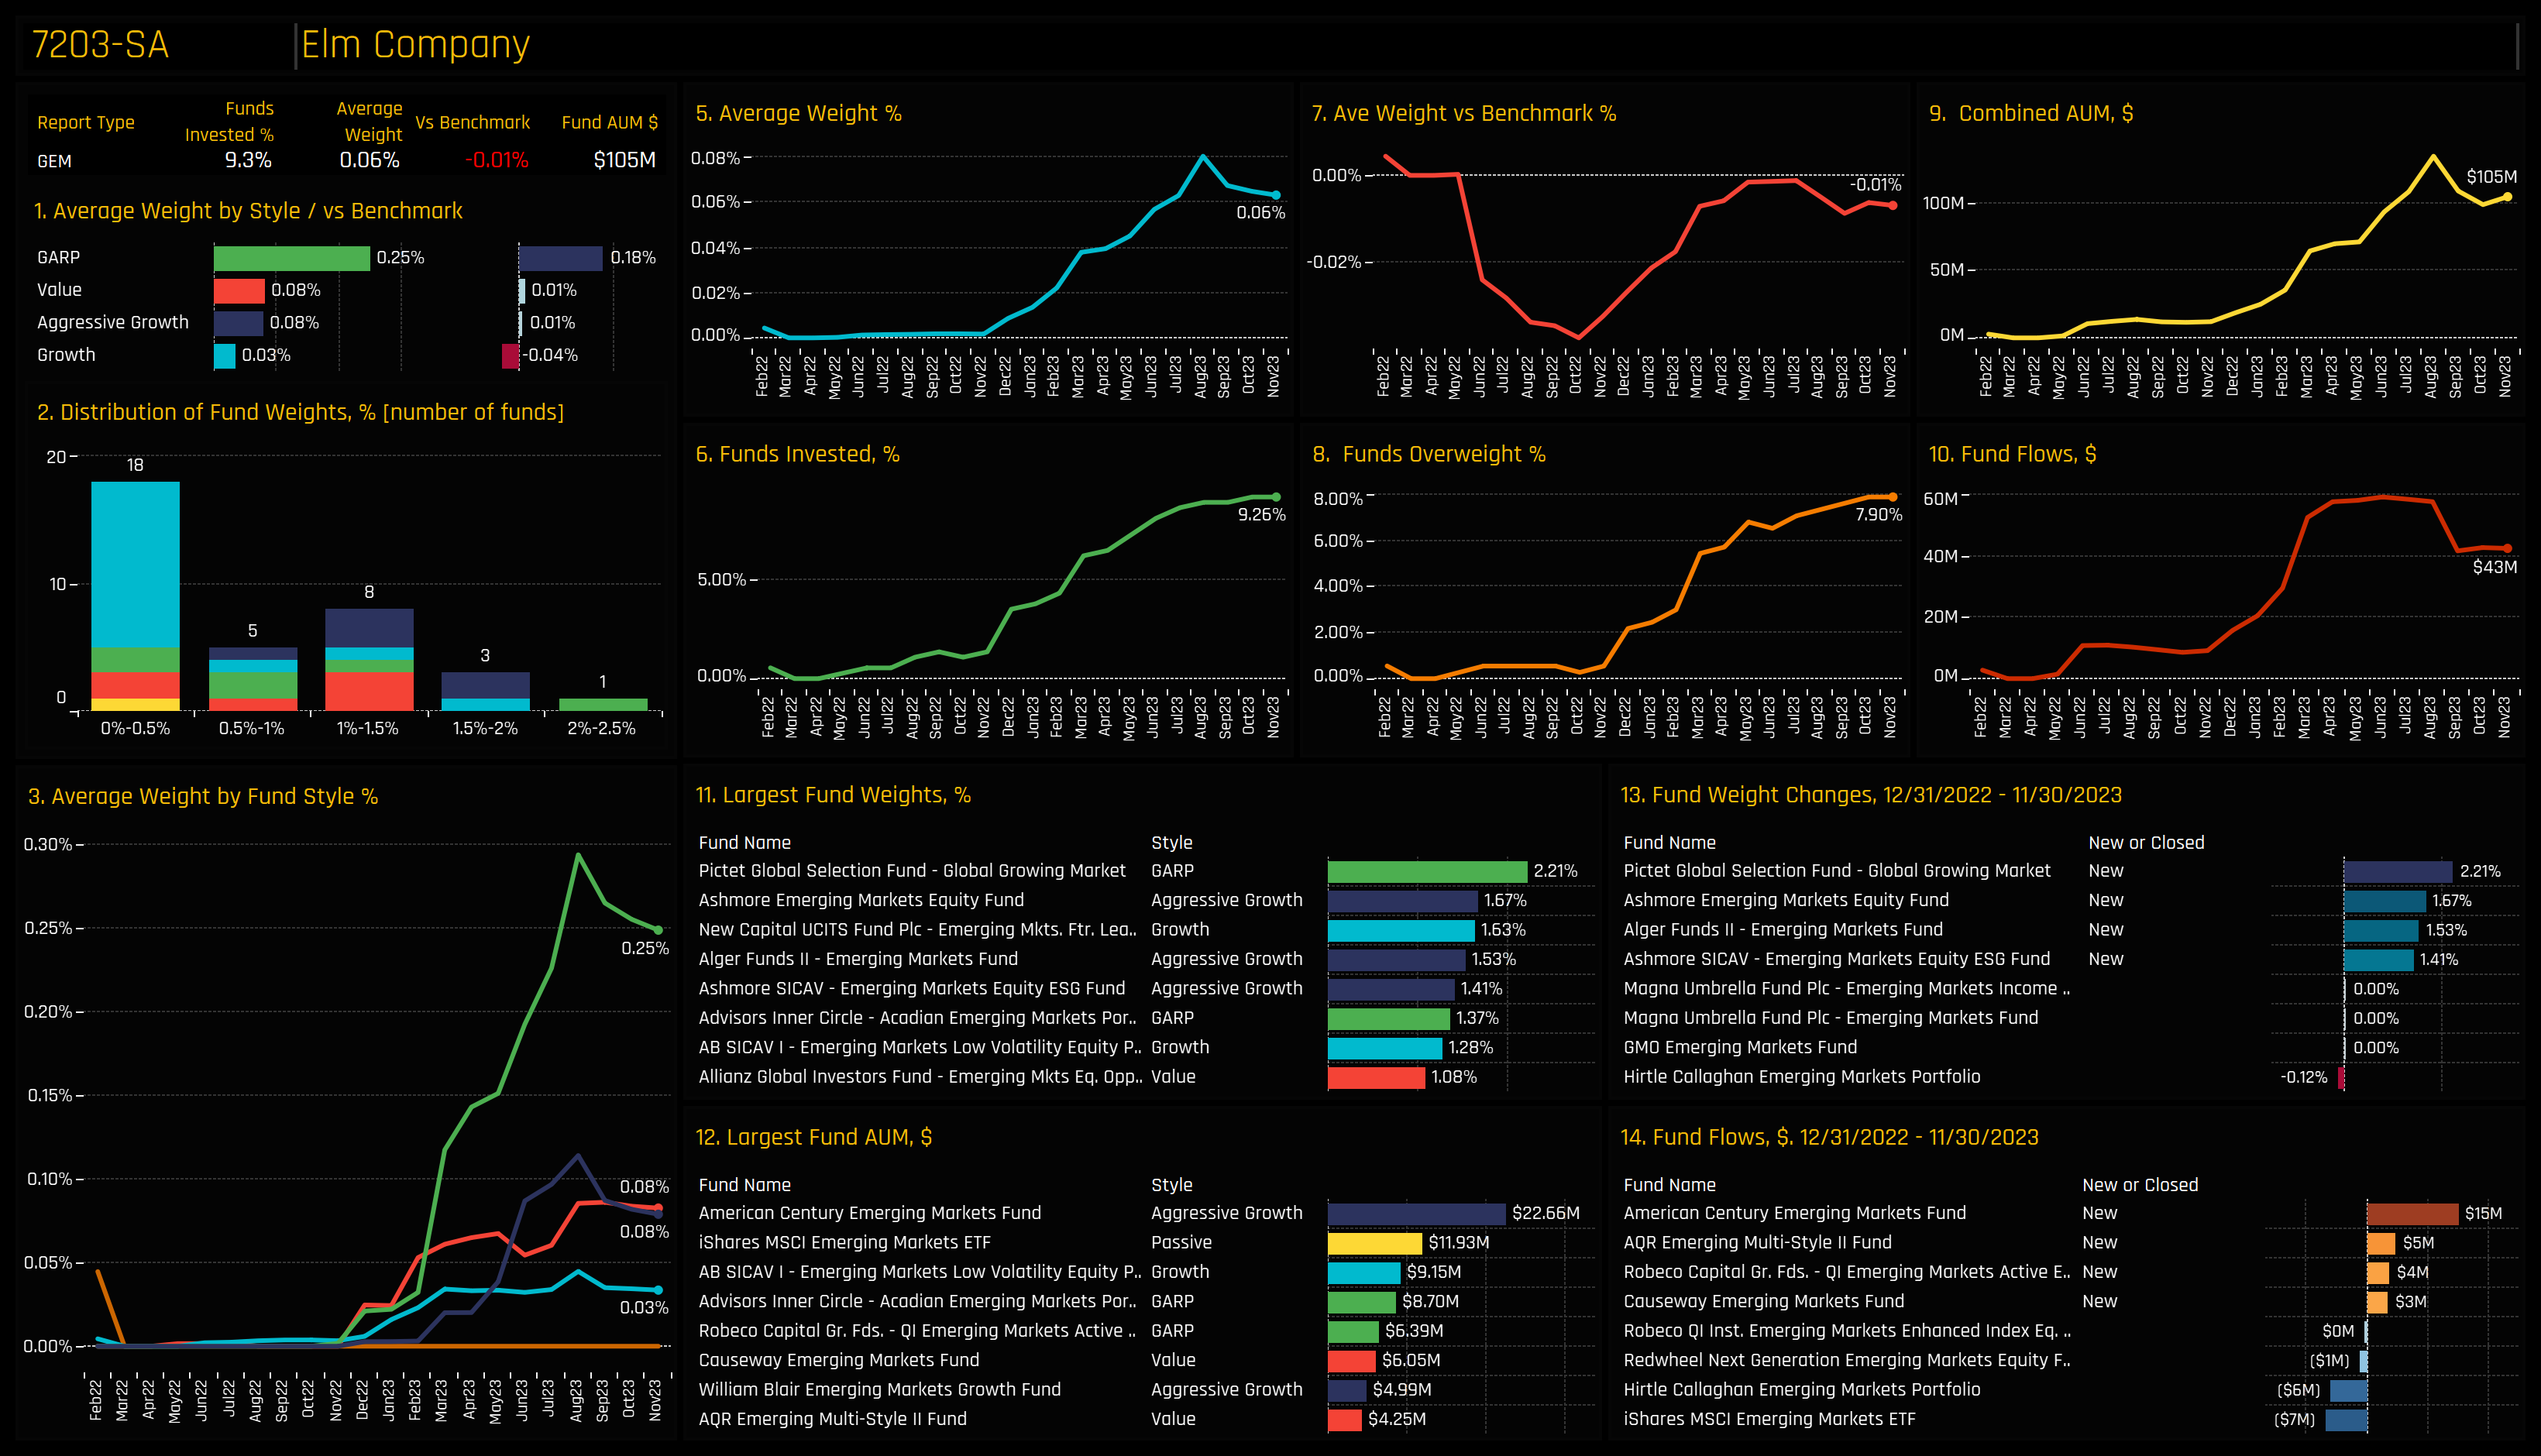
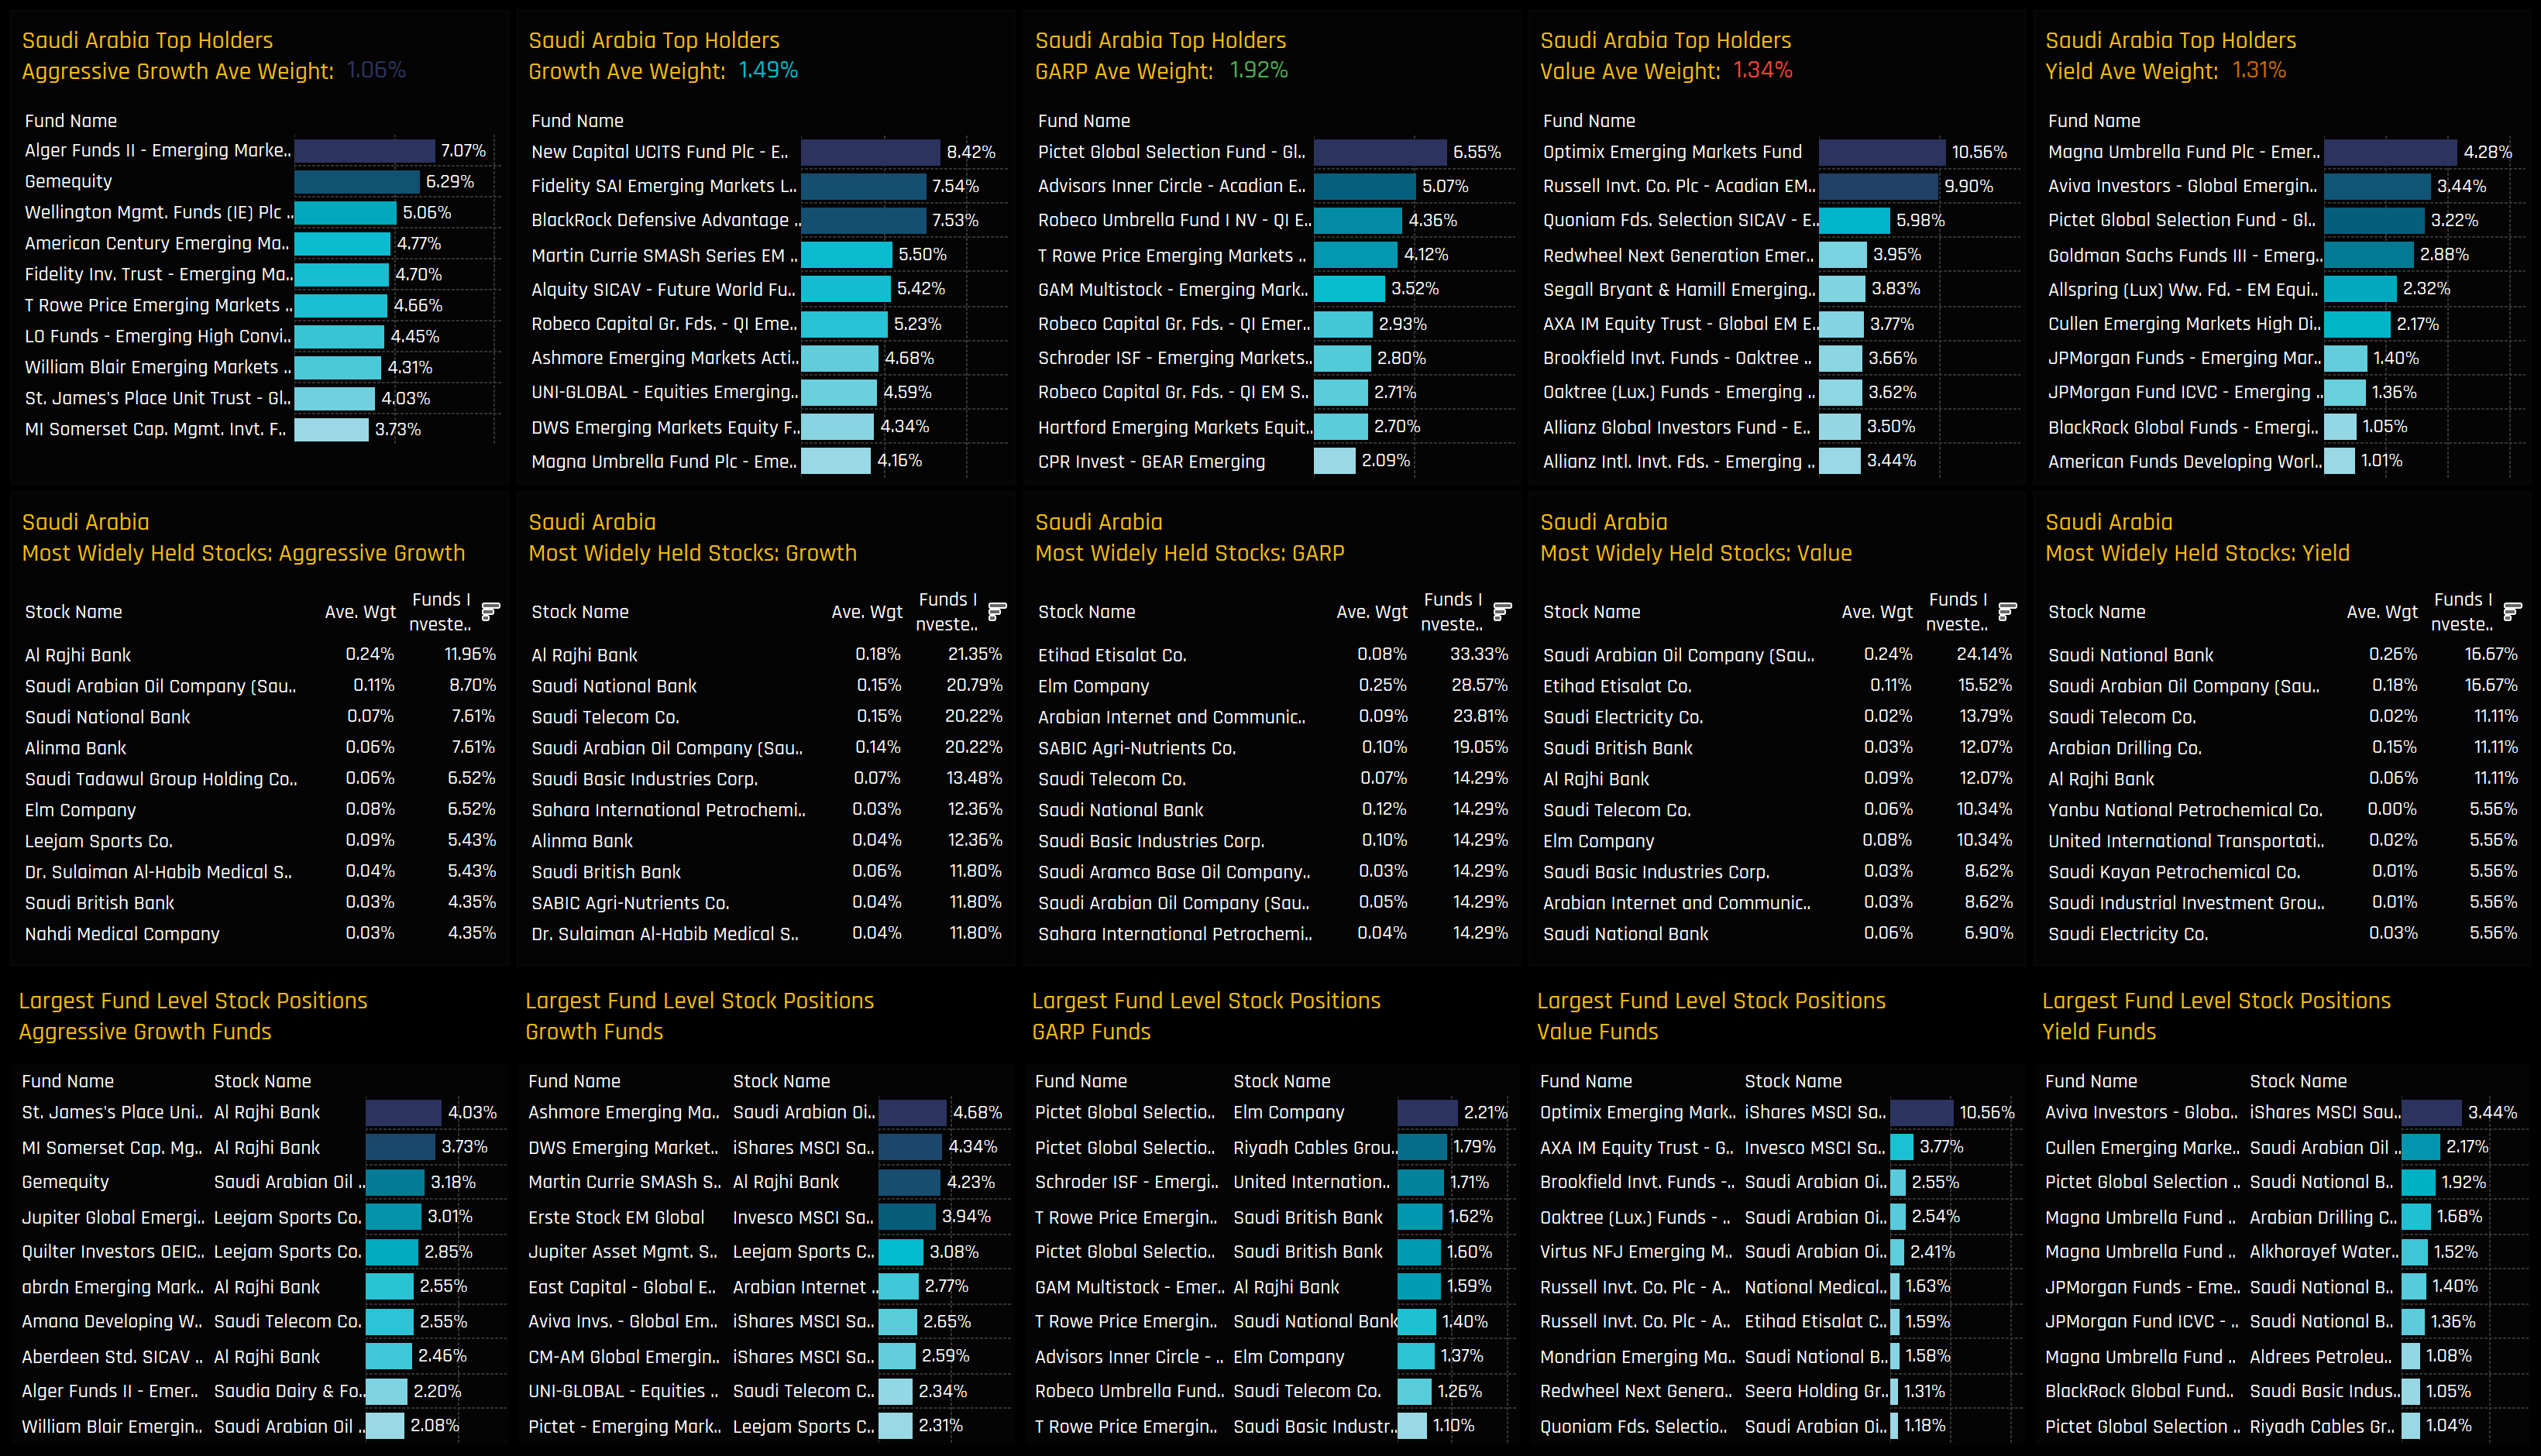
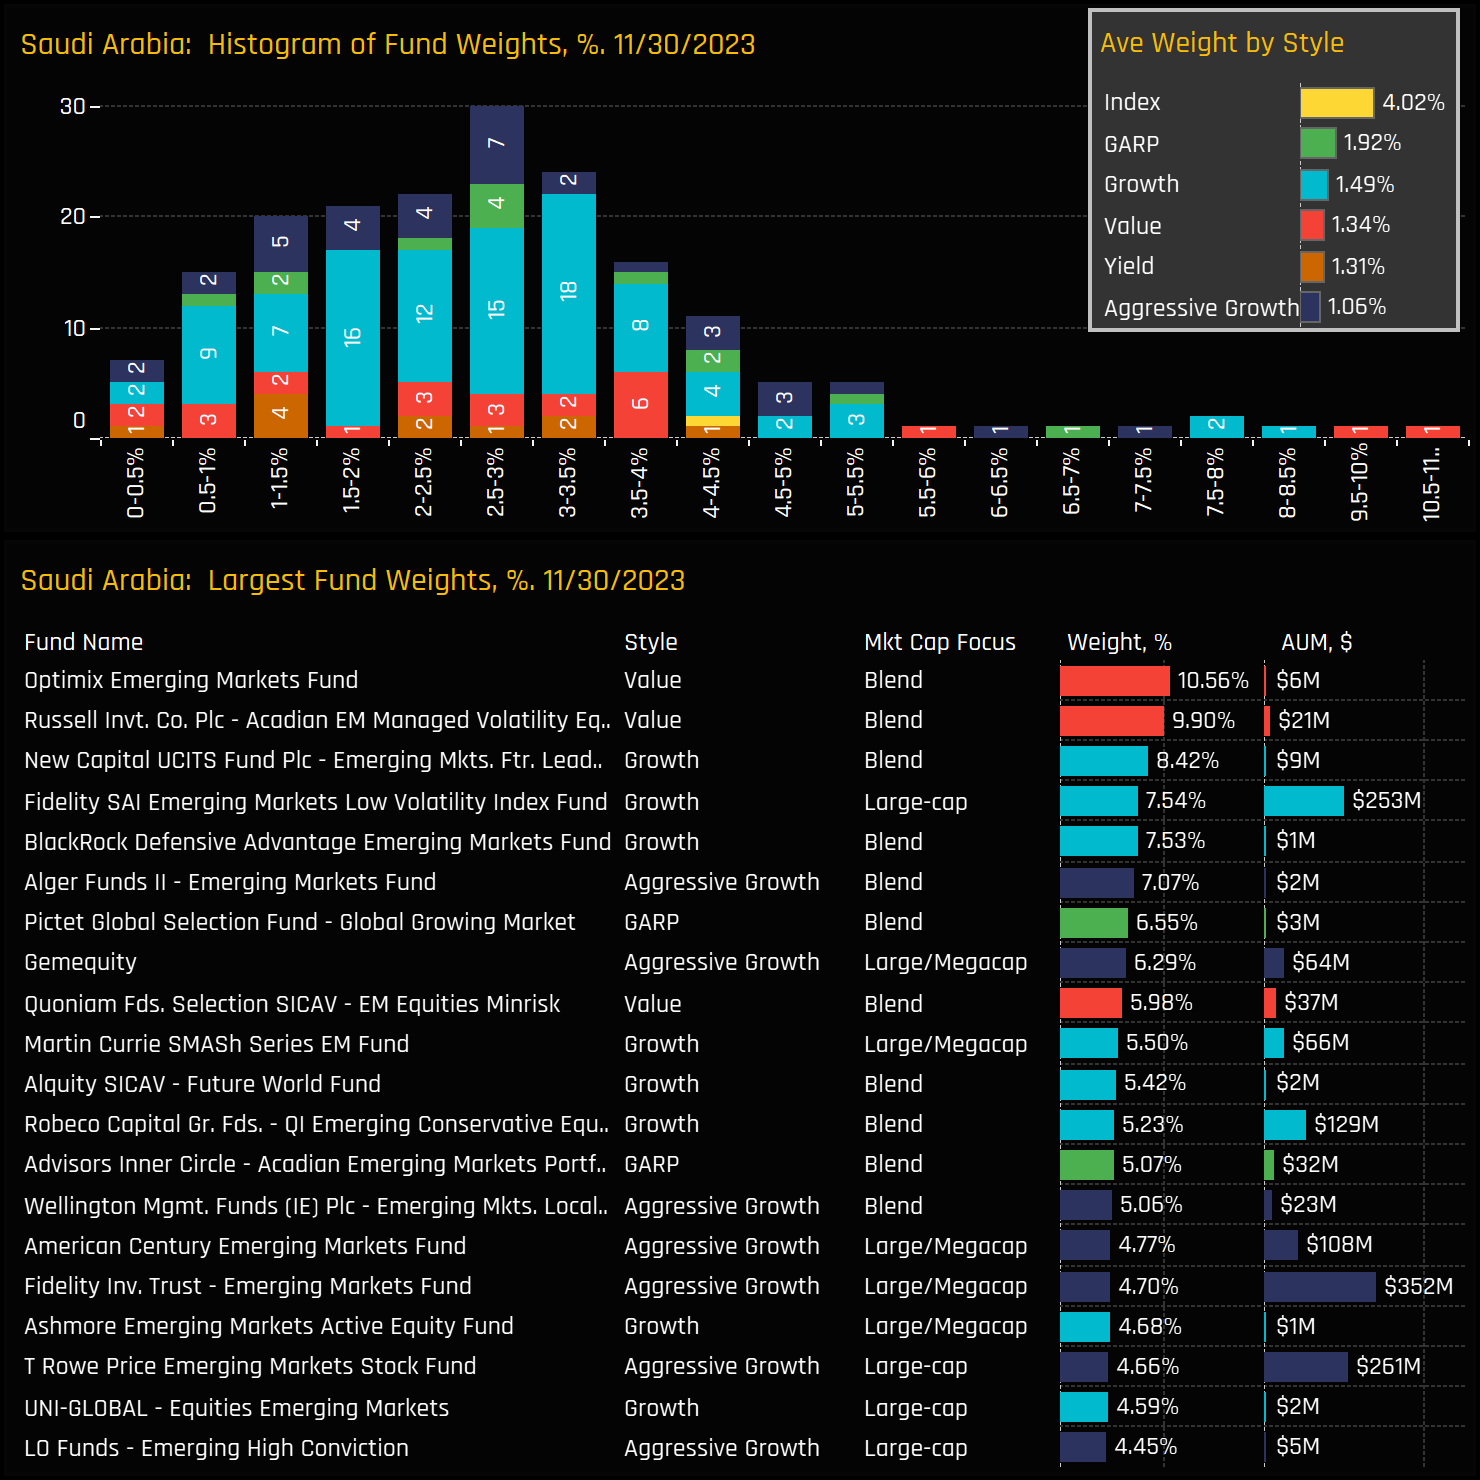
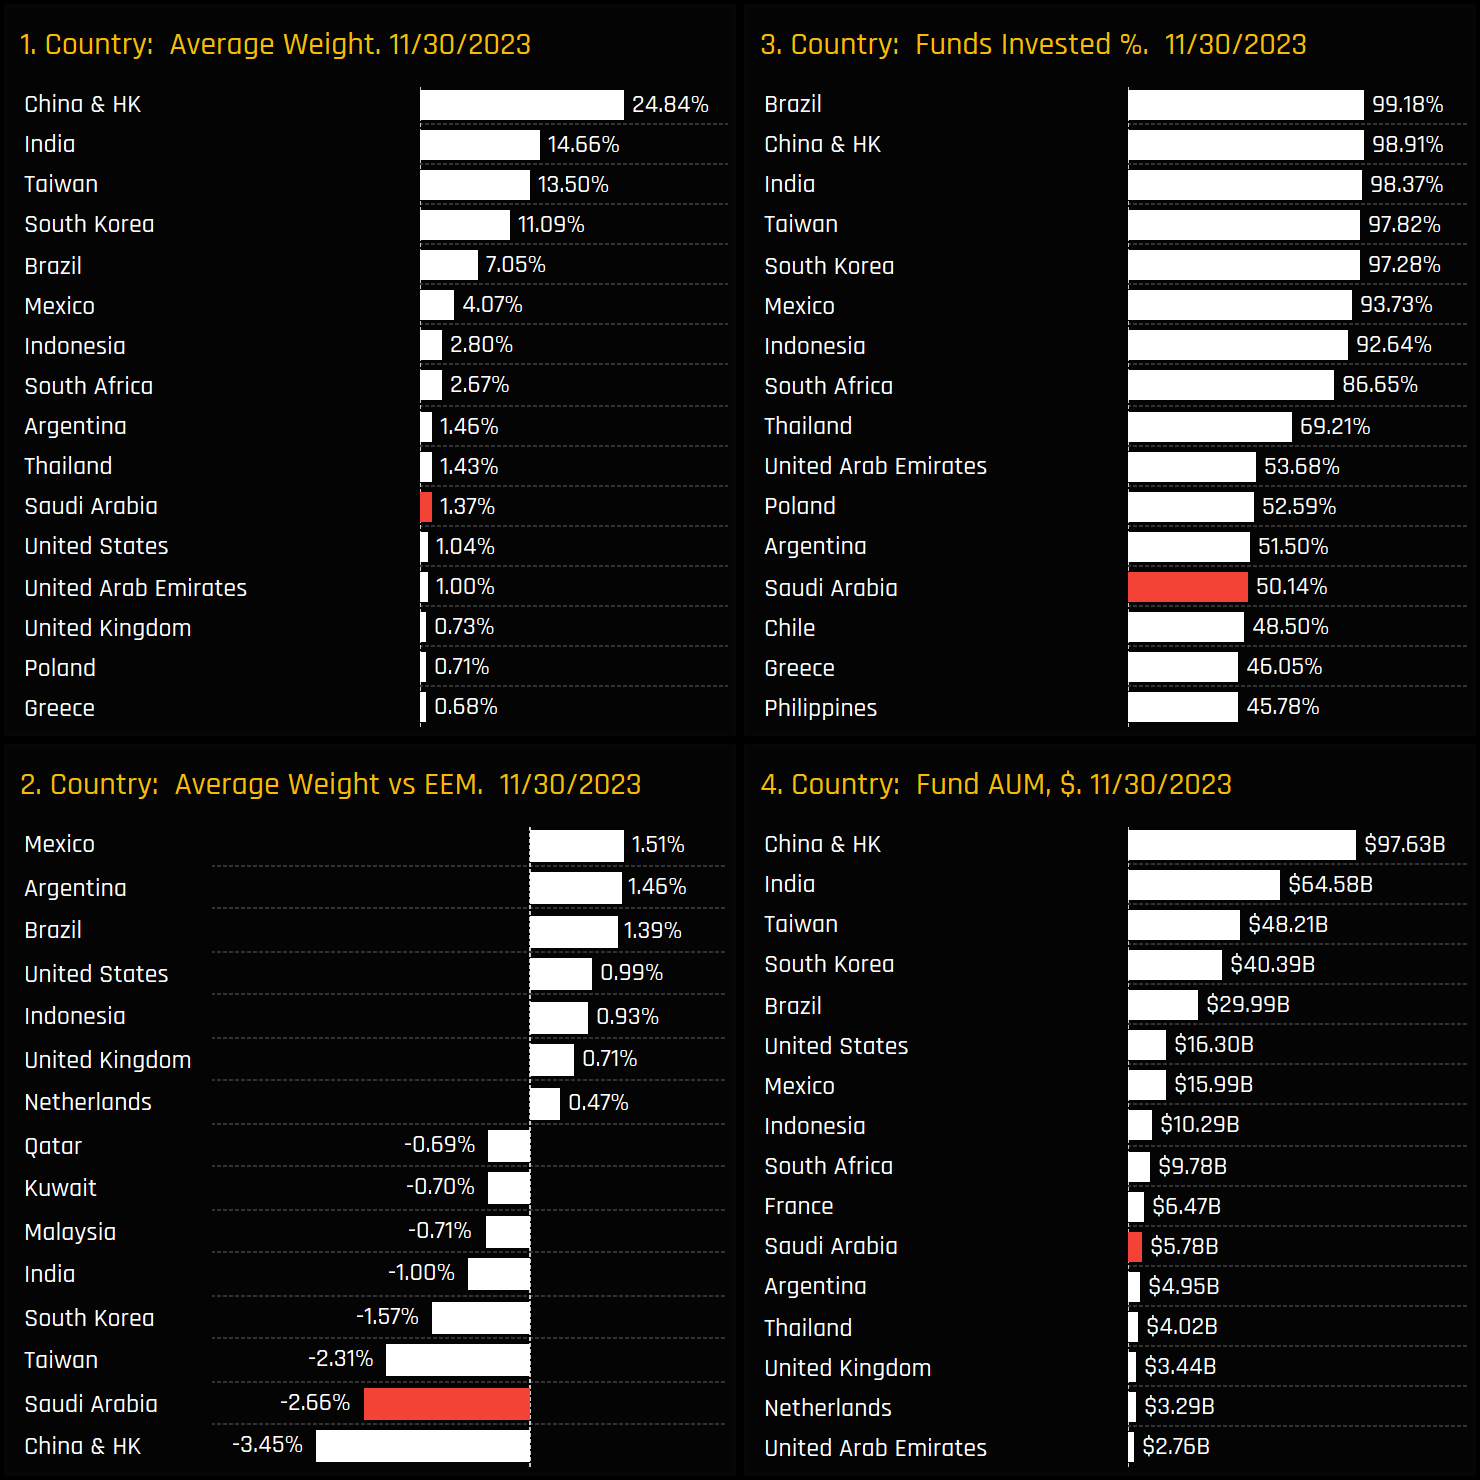
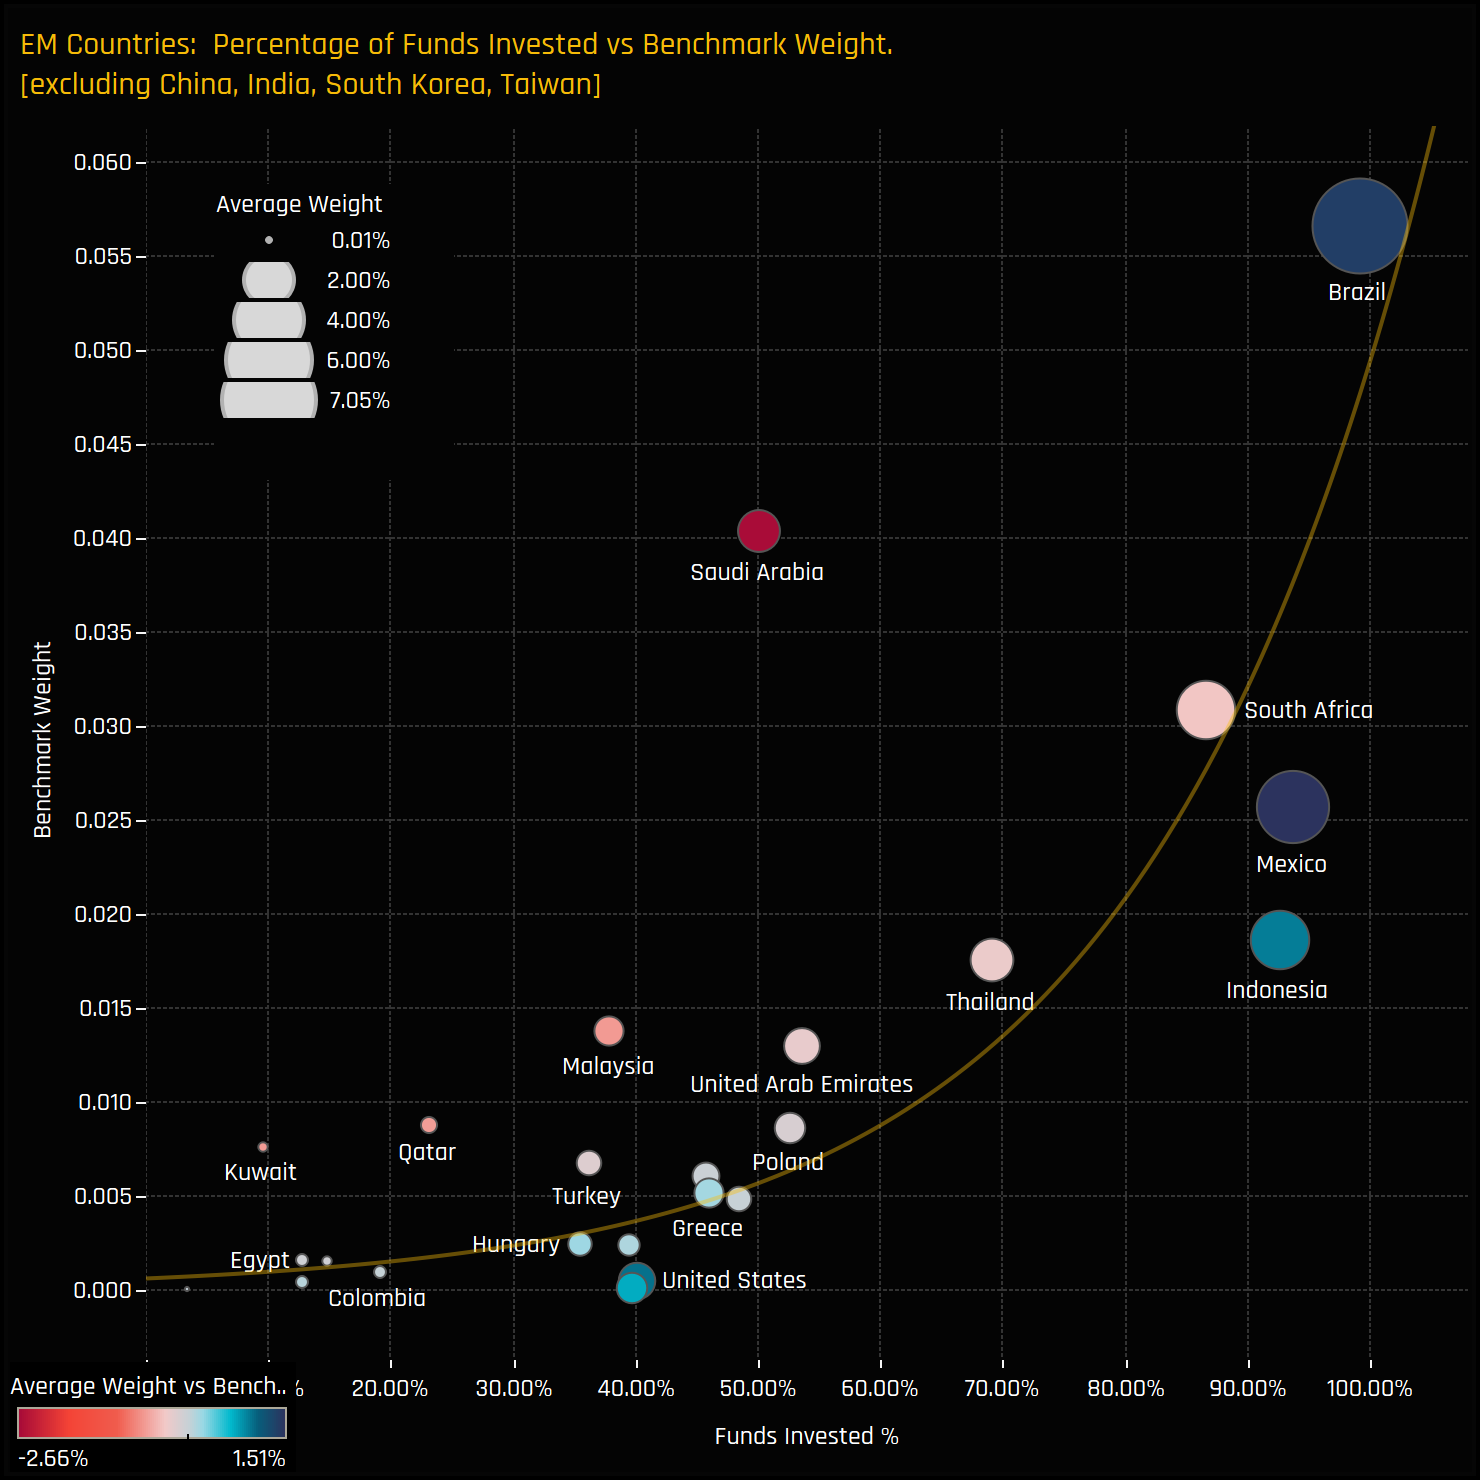
Saudi Arabia Special Report: A Tipping Point in EM Equity Allocations
- Steve Holden
- 0 Comments
Related Posts


