In this issue:
EMEA Financials: Uneven Recovery
JD.com: Test of Investor Resolve as Selling Continues
GEM Funds Stock Radar
370 emerging market Funds, AUM $368bn
EMEA Financials: Uneven Recovery
• EM Funds are at historically low levels of exposure to the EMEA Financials sector.
• EMEA Financials are the largest Regional Sector underweight in global EM, with just 11.6% of managers positioned ahead of the MSCI EM index.
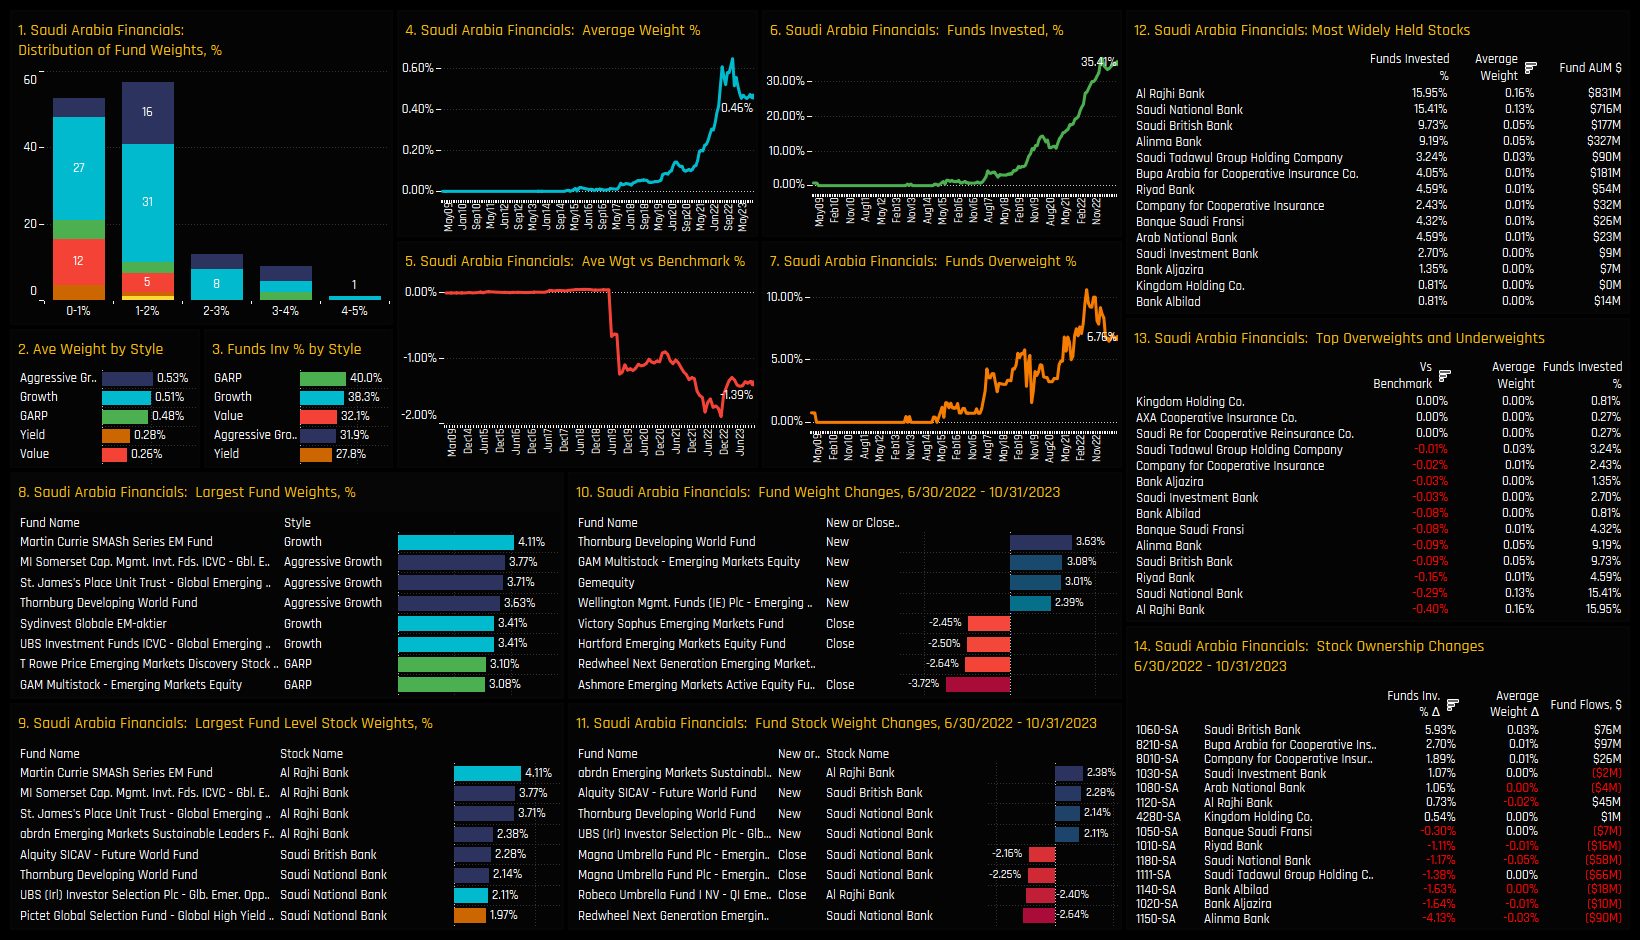
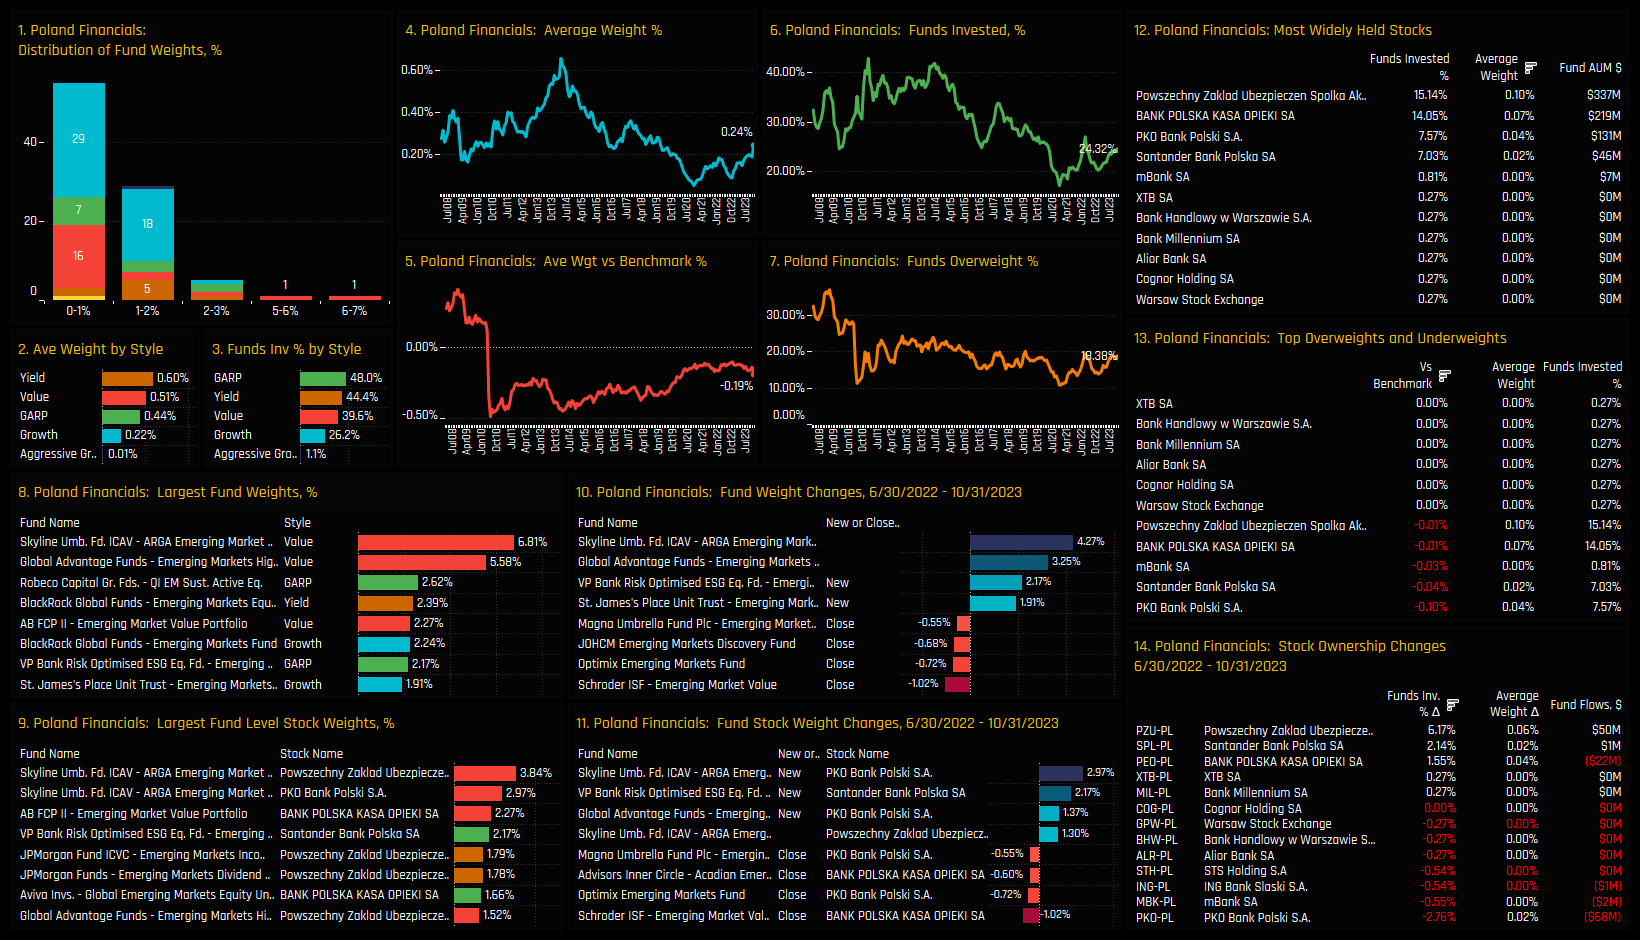
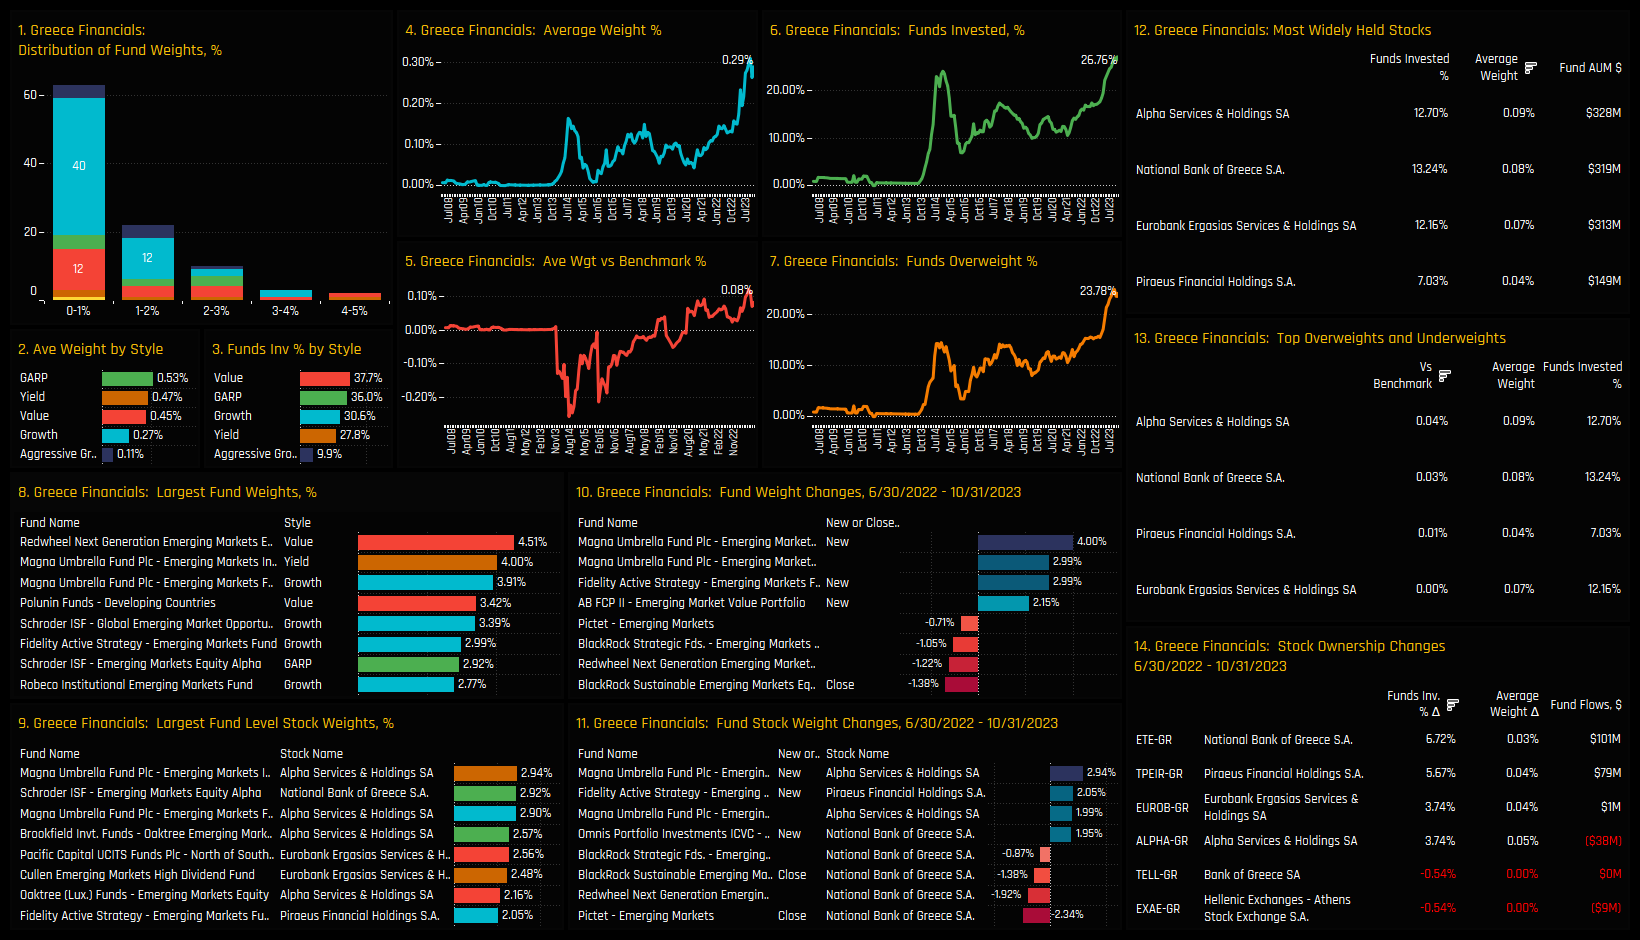
• Moderate but uneven recovery underway, with buying in Greece, Saudi, Kuwait and Poland Financials.
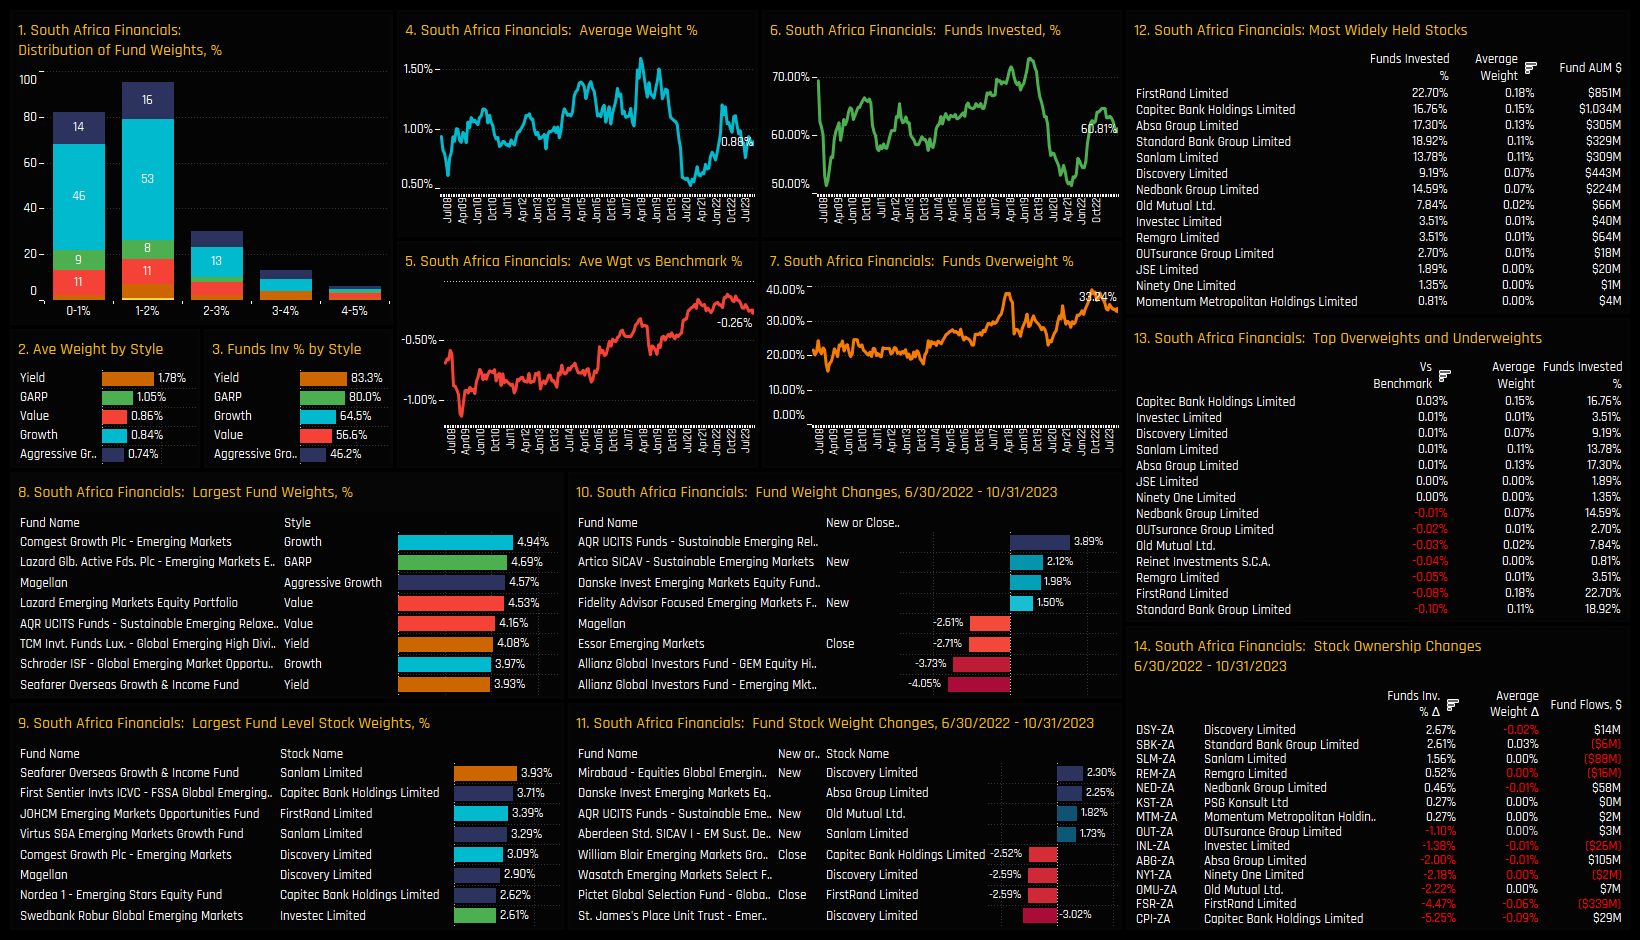
• Despite being the sector's predominant country holding, South African Financials are experiencing a halt in growth; nonetheless, FirstRand and Standard Bank continue to be key holdings.
Time-Series & Regional Sector Activity
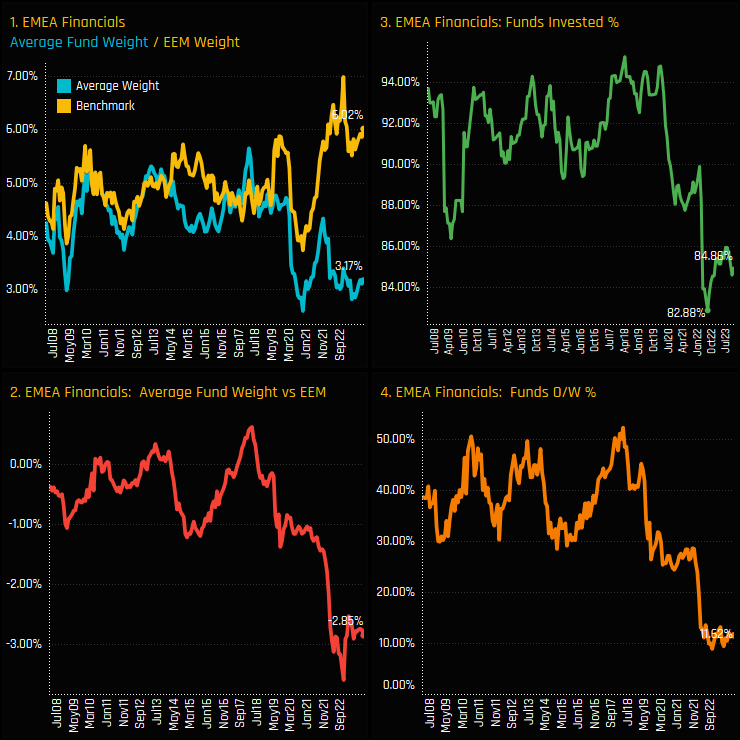
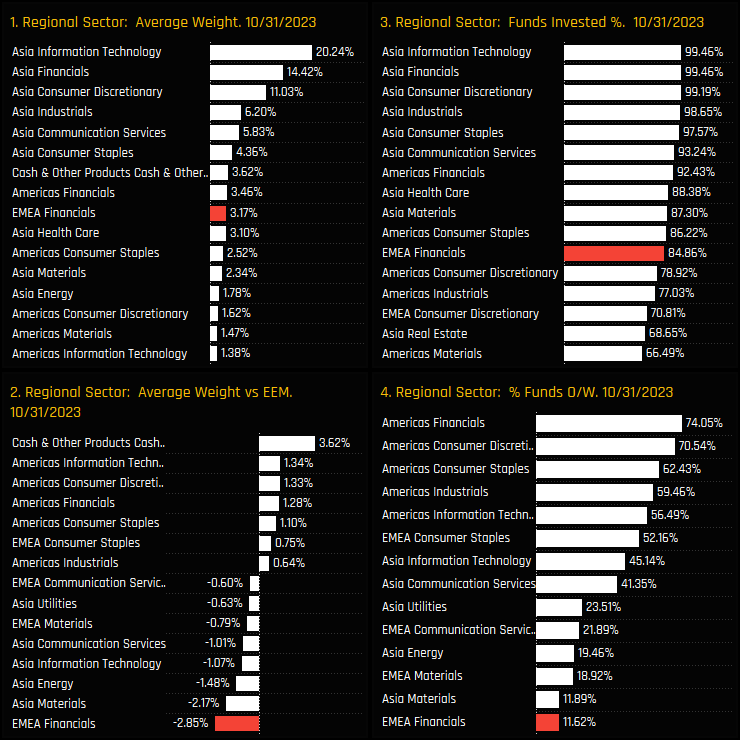
Positioning in the EMEA Financials sector can hardly be described as ‘bullish’. The average holding weight of 3.17% sits towards the lower end of it’s 15-year range and well below the iShares MSCI Emerging Market ETF weight of 6.02% (ch1). Much of this decline can be attributed to both Russian Financials, which were once a key overweight pre-Ukraine, and also the addition of Saudi Financials to the benchmark index in 2021. Both of these factors combined to leave just 11.6% of the 370 funds in our analysis positioned overweight the MSCI EM Benchmark (ch4). There appears to be little expectation of outperformance.
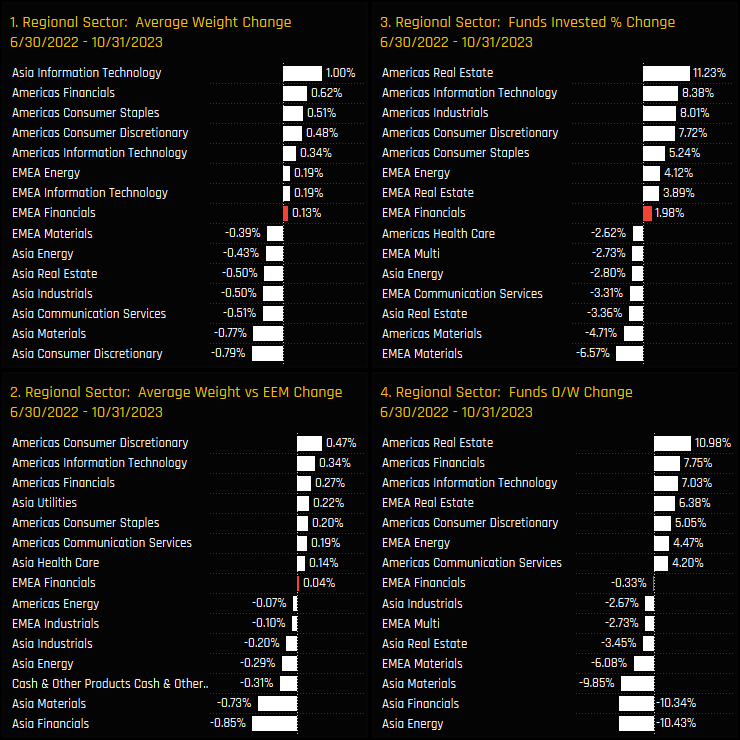
The trough in outright positioning occurred in June of last year, with 82.9% of funds invested (see chart 3 opposite). Since then there has been a moderate effort by active EM managers to regain some exposure. The charts below show the changes in Regional Sector exposures between that low and the end of last month. Whilst the percentage of funds invested and average weight did move higher for EMEA Financials, they were well eclipsed by larger moves in numerous Latin American sectors and Asian Technology. This was not an out-and-out bullish rotation by any means.
Fund Holdings & Activity
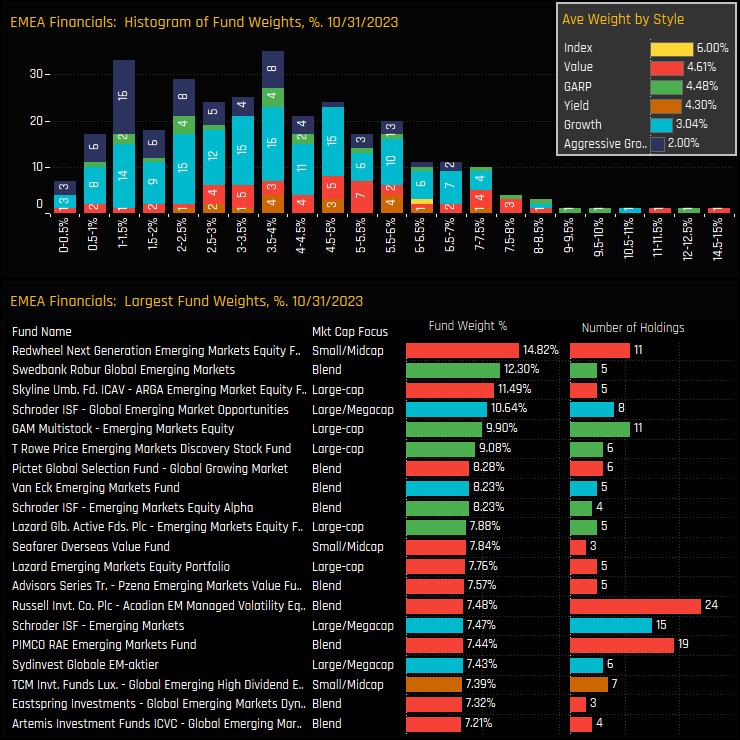
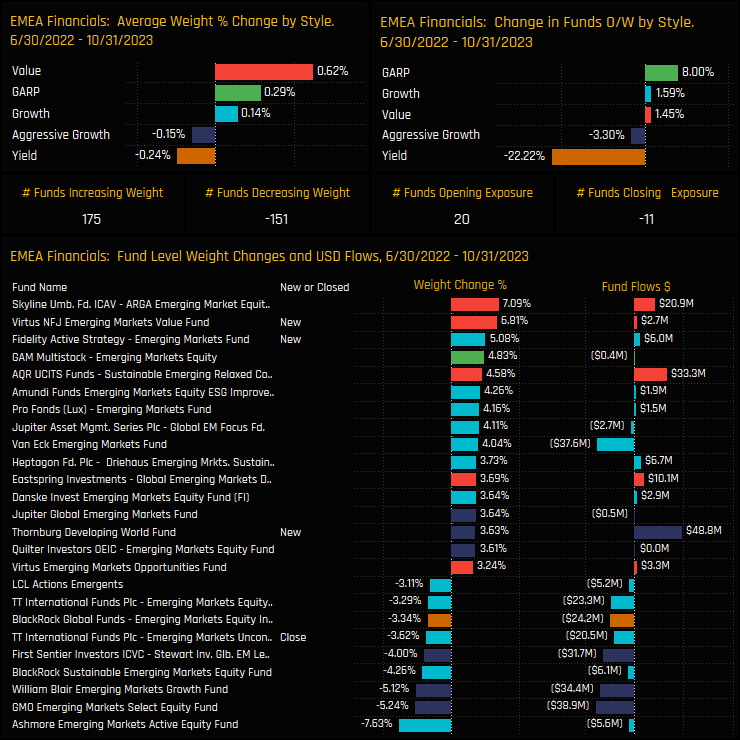
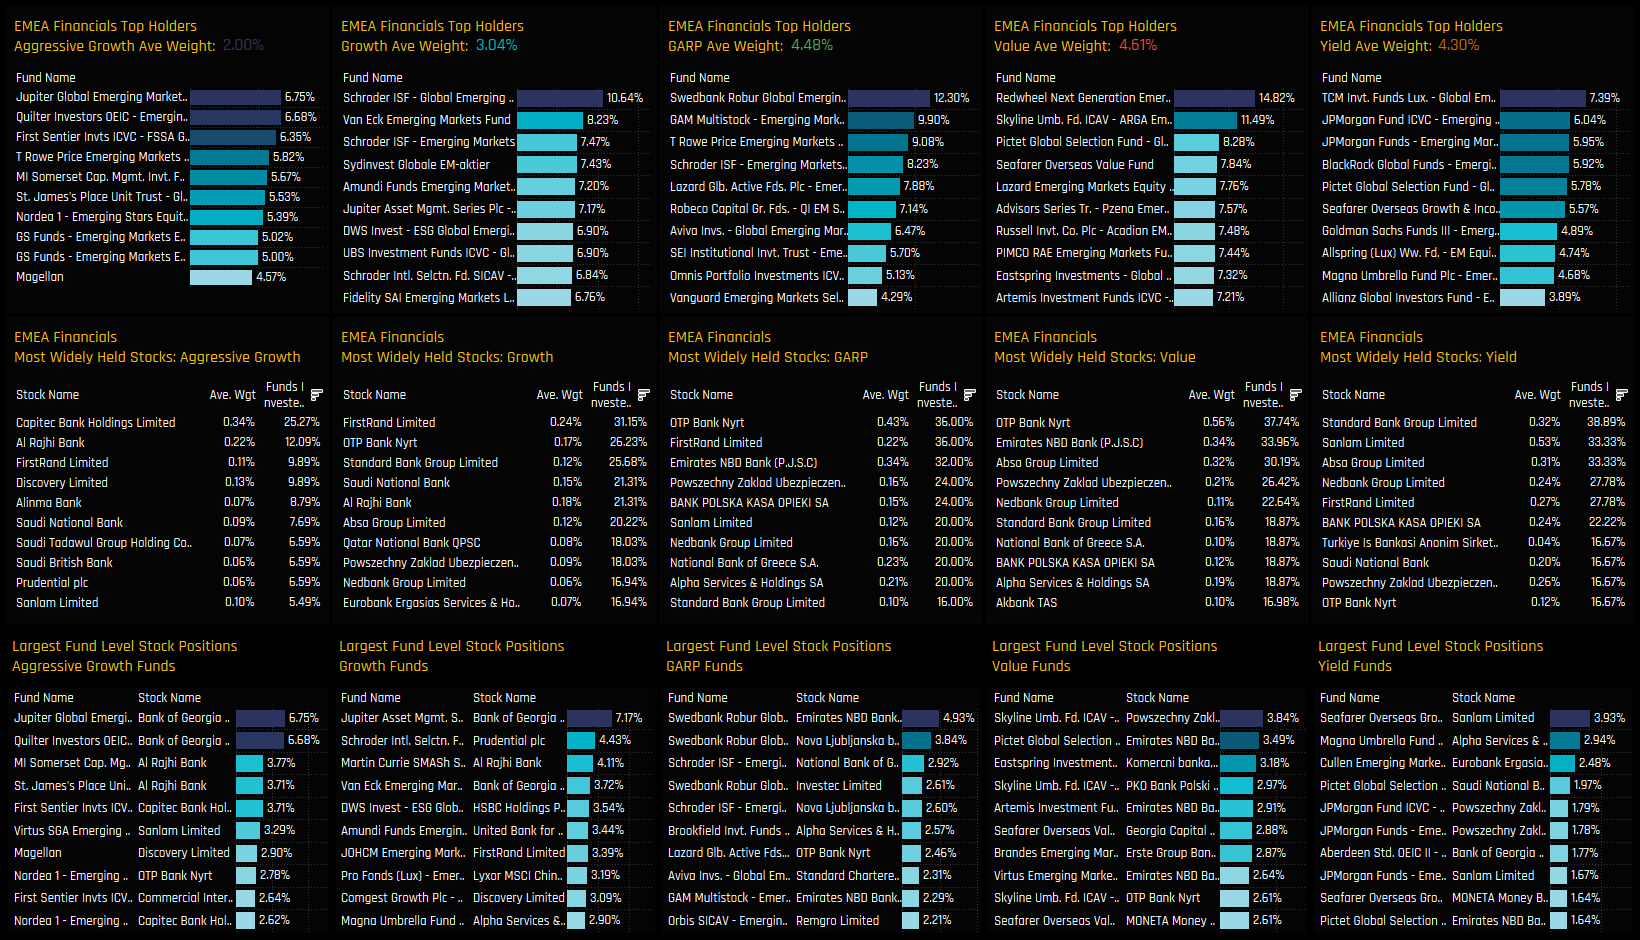
Current allocations in the EMEA Financials sector indicate a preference for moderate exposure. The majority of strategies cluster within the 2% to 5% range, as depicted in the histogram below, with only four strategies venturing above the 10% level. Allocations are correlated to Style, with Value averages twice those of Aggressive Growth, yet all Style groups sit comfortably below the MSCI EM Index.
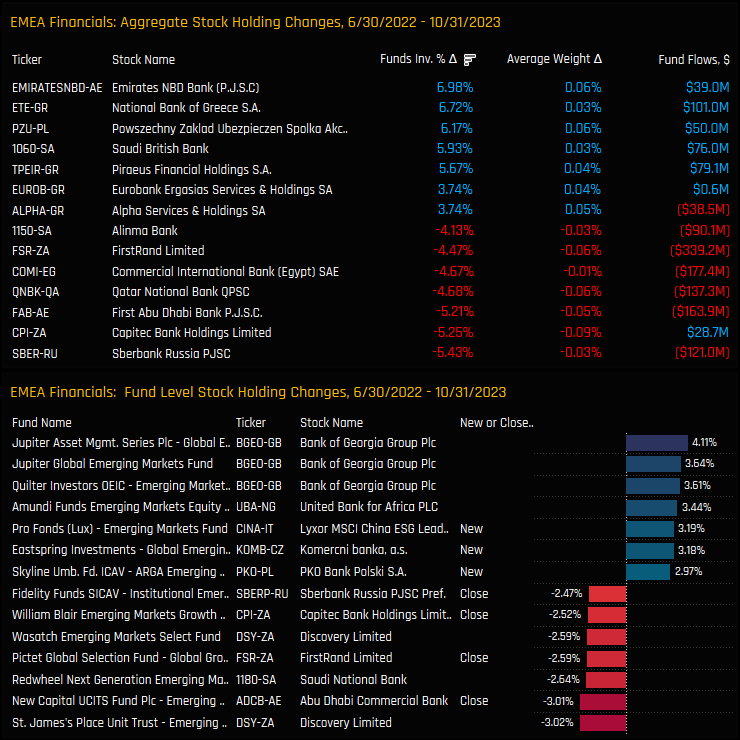
Fund level activity between 06/30/2022 and 10/31/2023 reflects the moderate move higher in aggregate exposure. 20 funds opened positions compared to 11 closures, with Virtus EM Value (+6.8%) and Fidelity Emerging Markets (+5.1%) among the larger openers, opposing decreases in exposure from Ashmore EM Active (-7.6%) and GMO Emerging Markets Select (-5.2%), among others.
Country Holdings & Activity
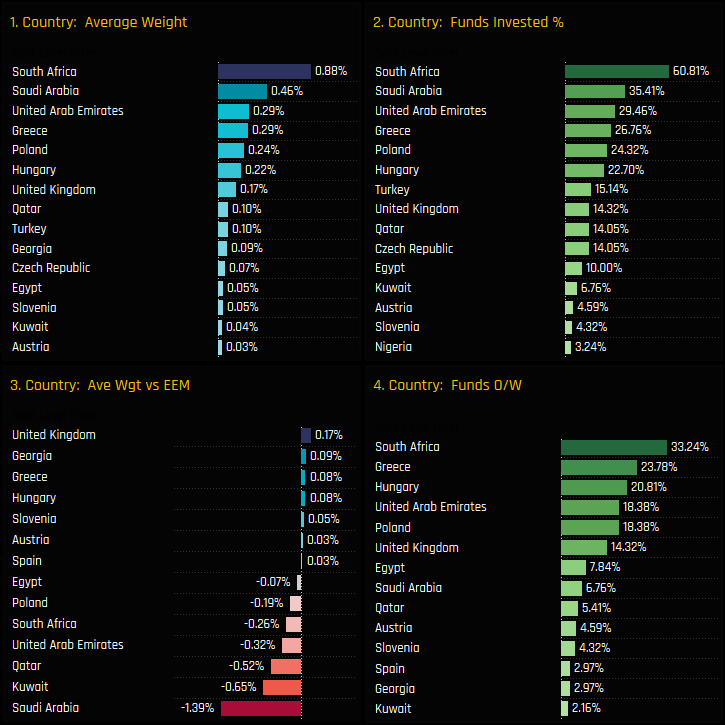
The split of country exposures within the EMEA Financials sector is shown in the charts below. South African Financials are the dominate exposure and most widely held country group, with 60.8% of funds invested at an average 0.88% weight. The Financials underweight is almost exclusively driven by the MENA nations of Saudi Arabia, Kuwait, Qatar and the U.A.E.
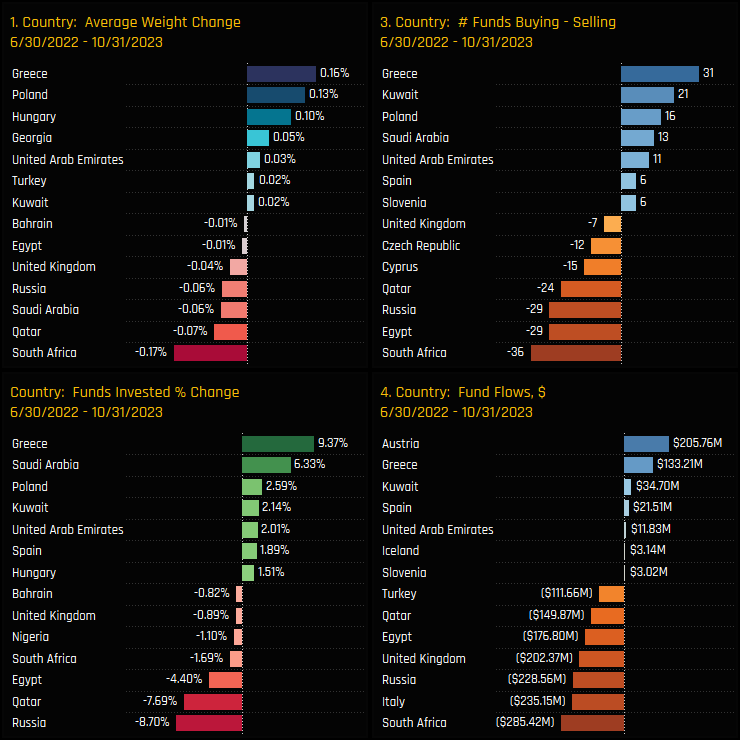
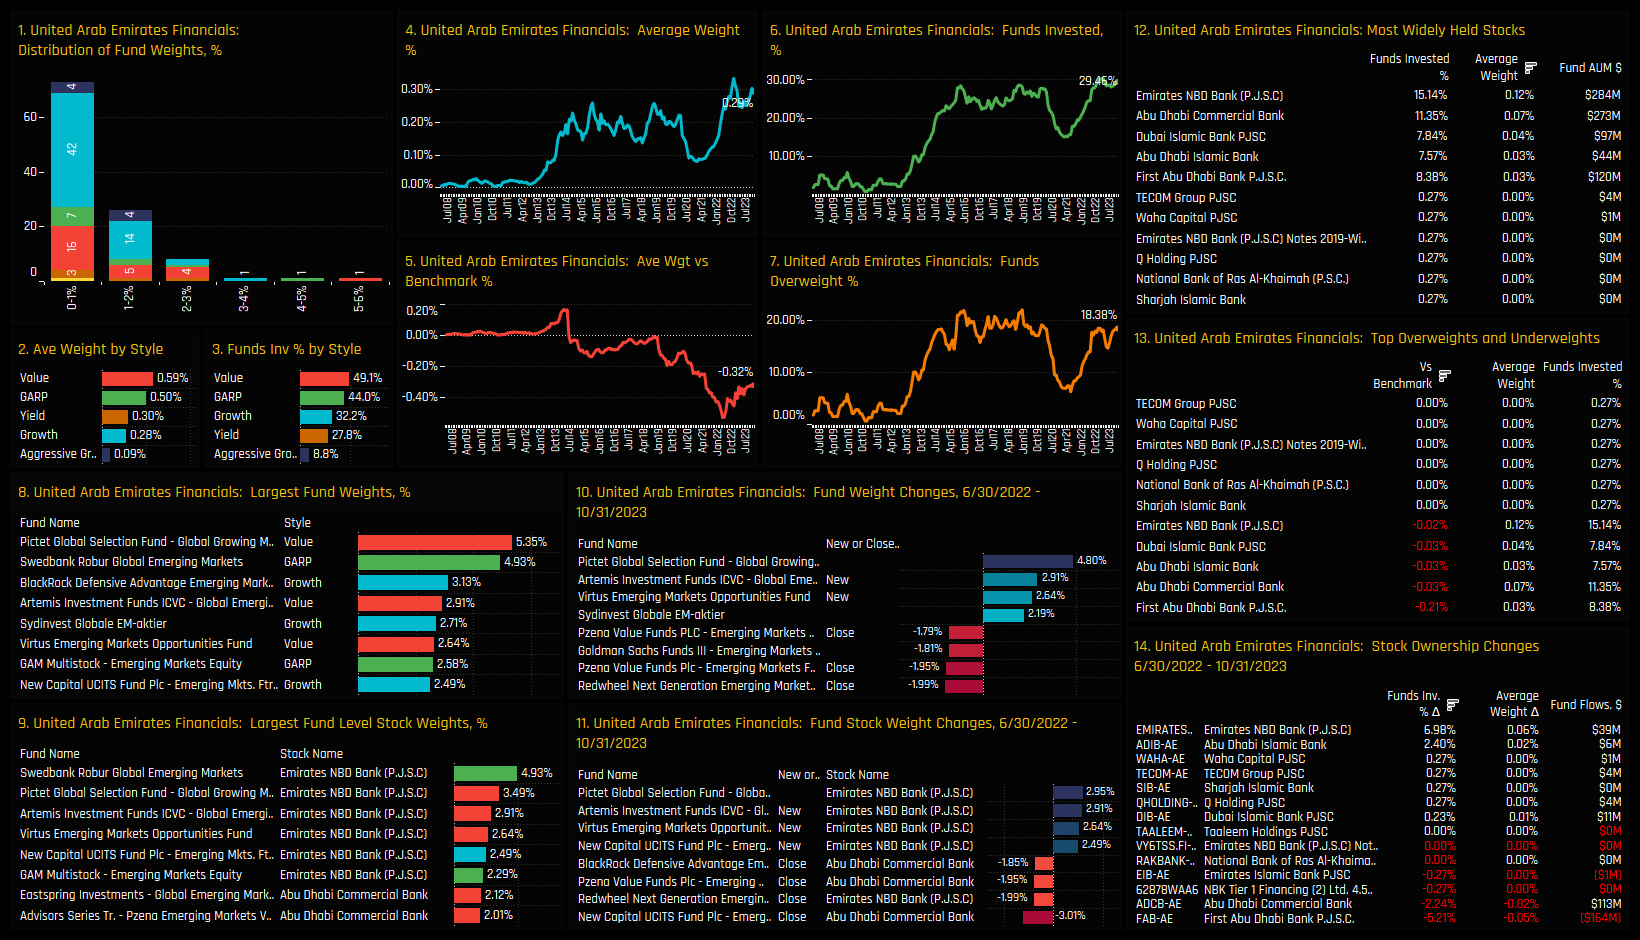
The moderate increase in EMEA Financials allocations post-2022’s trough can be partly explained by divergent country-specific trends. We’ve seen a clear dichotomy in country-level strategy, with Emerging Market funds increasing their exposure to Greece, Kuwait, and Poland, while markedly reducing their positions in South Africa, Egypt, and Qatar. This stark contrast in country rotation has shaped the sector’s cautious rebound.
Country Sentiment & Long-Term Trends
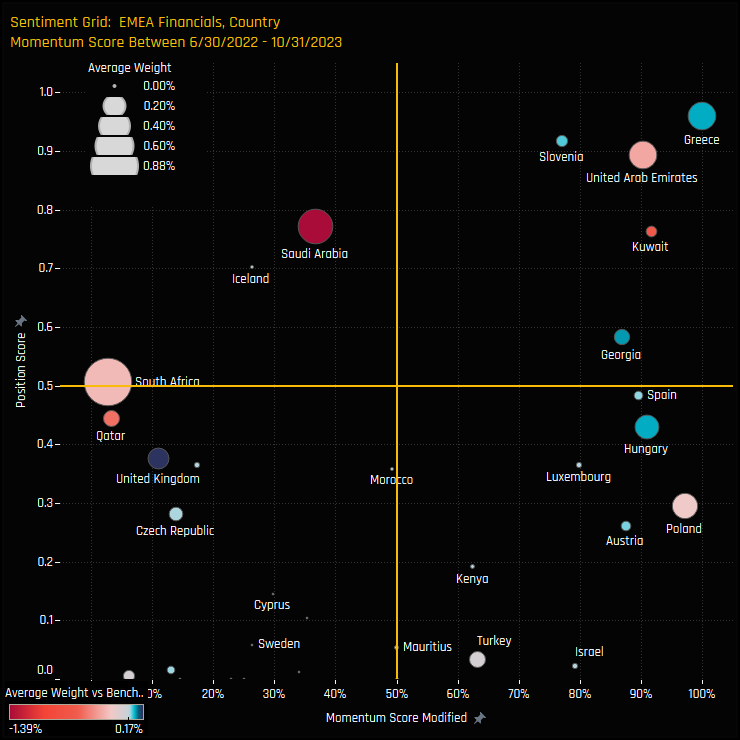
The Sentiment Grid below provides more insight in to EMEA Financials country level positioning. The Y-axis shows the ‘Position Score’, a measure of current positioning in each Country compared to its own history going back to 2008 on a scale of 0-100%. The X-Axis shows the ‘Momentum Score’, a measure of fund manager activity for each Country between 06/30/2022 and 10/31/2023 on a scale of 0% (maximum negative activity) to 100% (maximum positive activity). It shows Greece and the U.A.E nearing record levels of exposure as they benefit from fund rotation, whilst Poland and Hungary are coming from a much lower base. South African Financials are out of favour, with current positioning trailing previous highs and the most substantial downward momentum in the region.
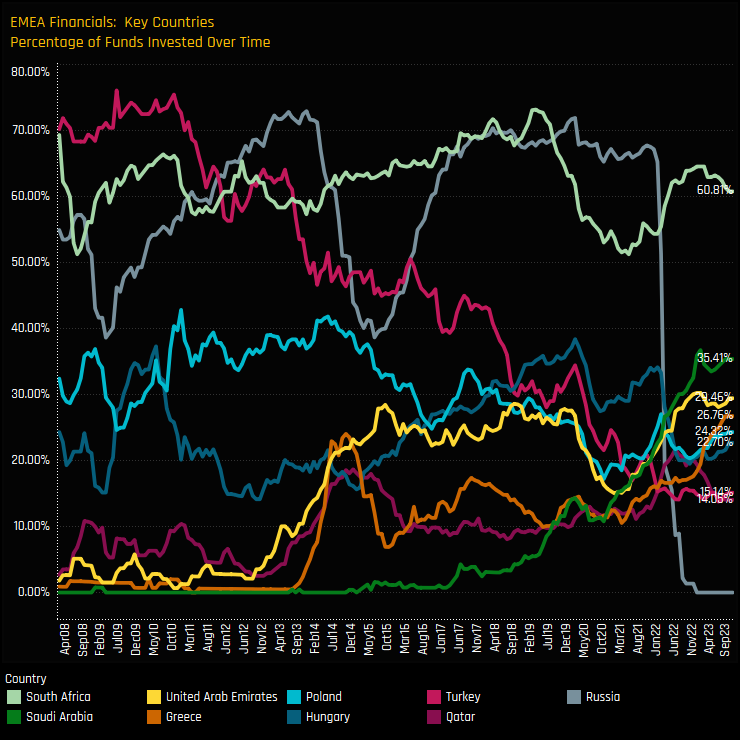
To see country level positioning in a different light, the below chart shows the percentage of funds invested in each country within the EMEA Financials sector since 2008. The big declines were seen in Russian Financials, for obvious reasons, whilst the decline in Turkish Financials has played out over a much longer period. South Africa and Qatar Financials have stalled, but the former remains a well held position among managers. The real stars of the sector are Greece, U.A.E and Saudi Arabian Financials, with consistent ownership growth witnessed over the last 3 years. Poland has some way to go to reach its previous highs, but appears to be moving in the right direction.
Stock Holdings & Activity
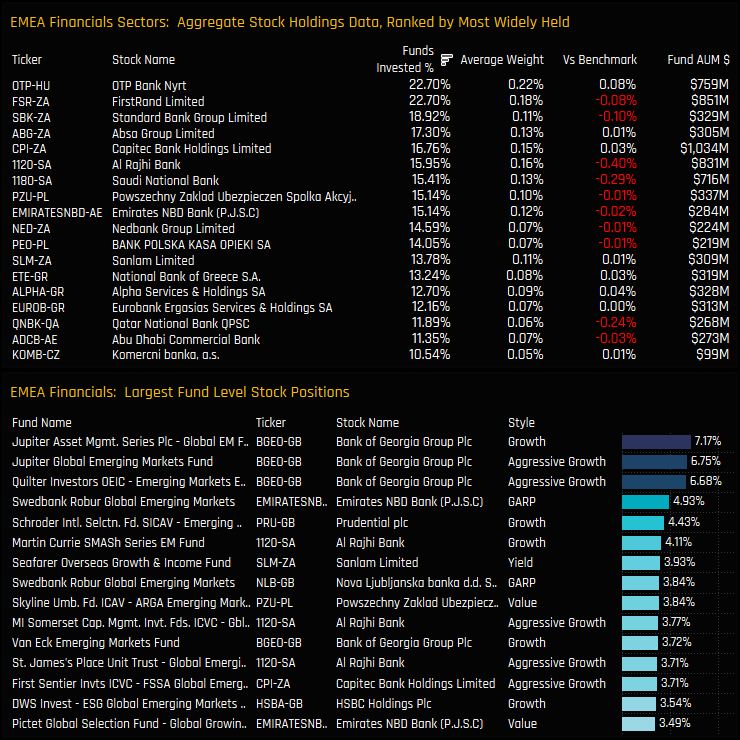
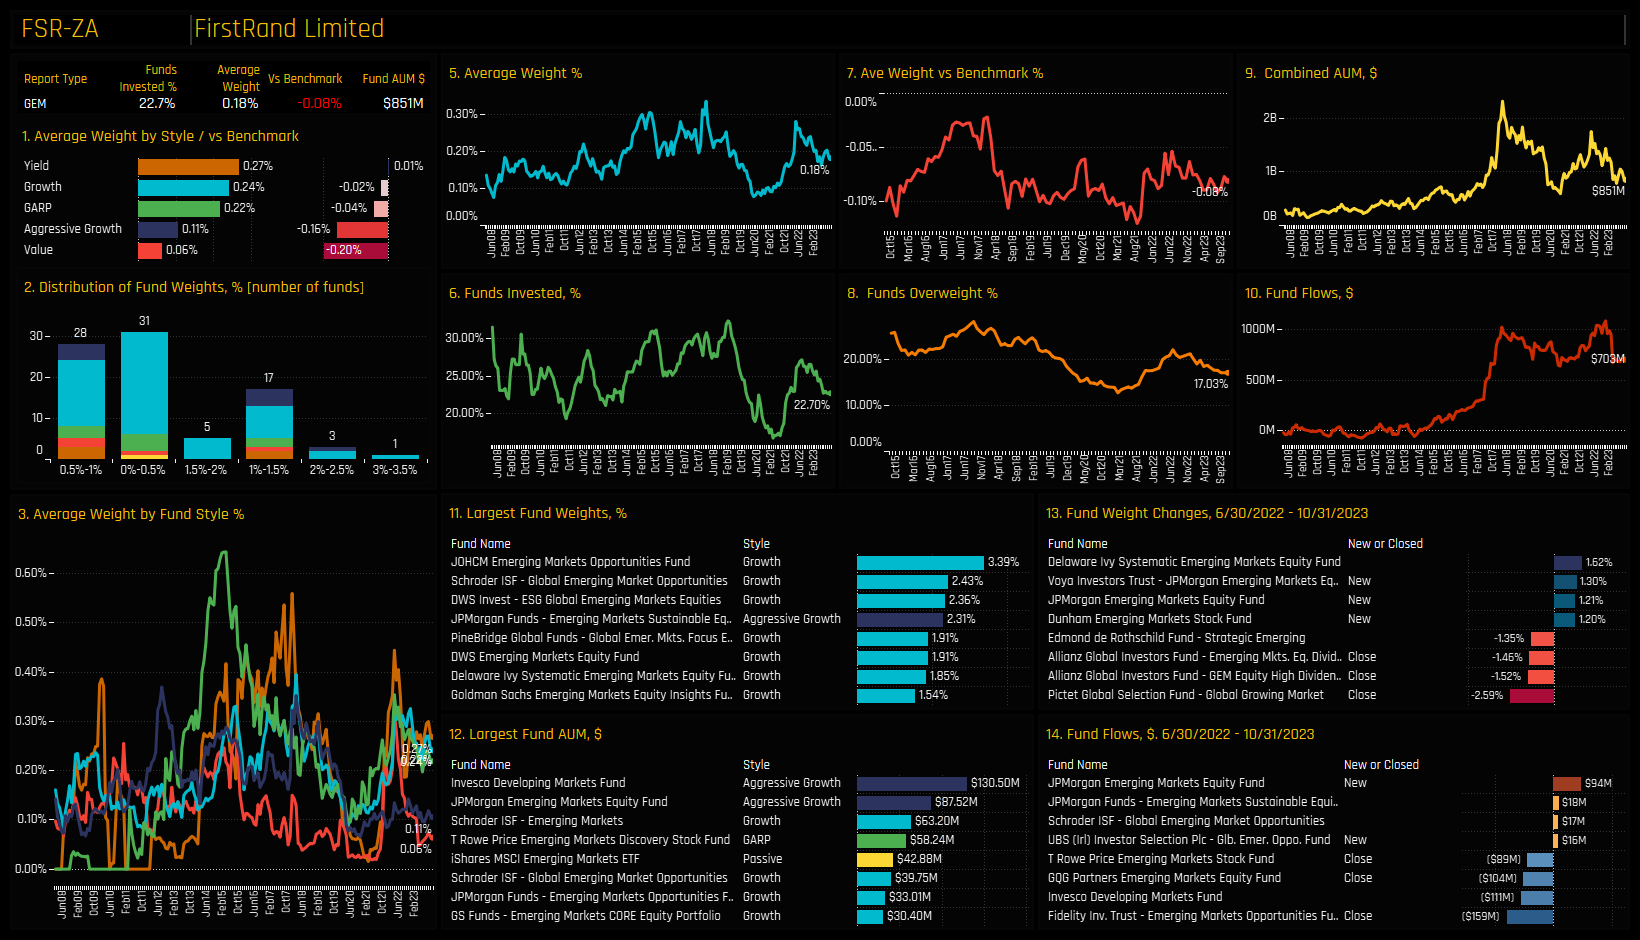
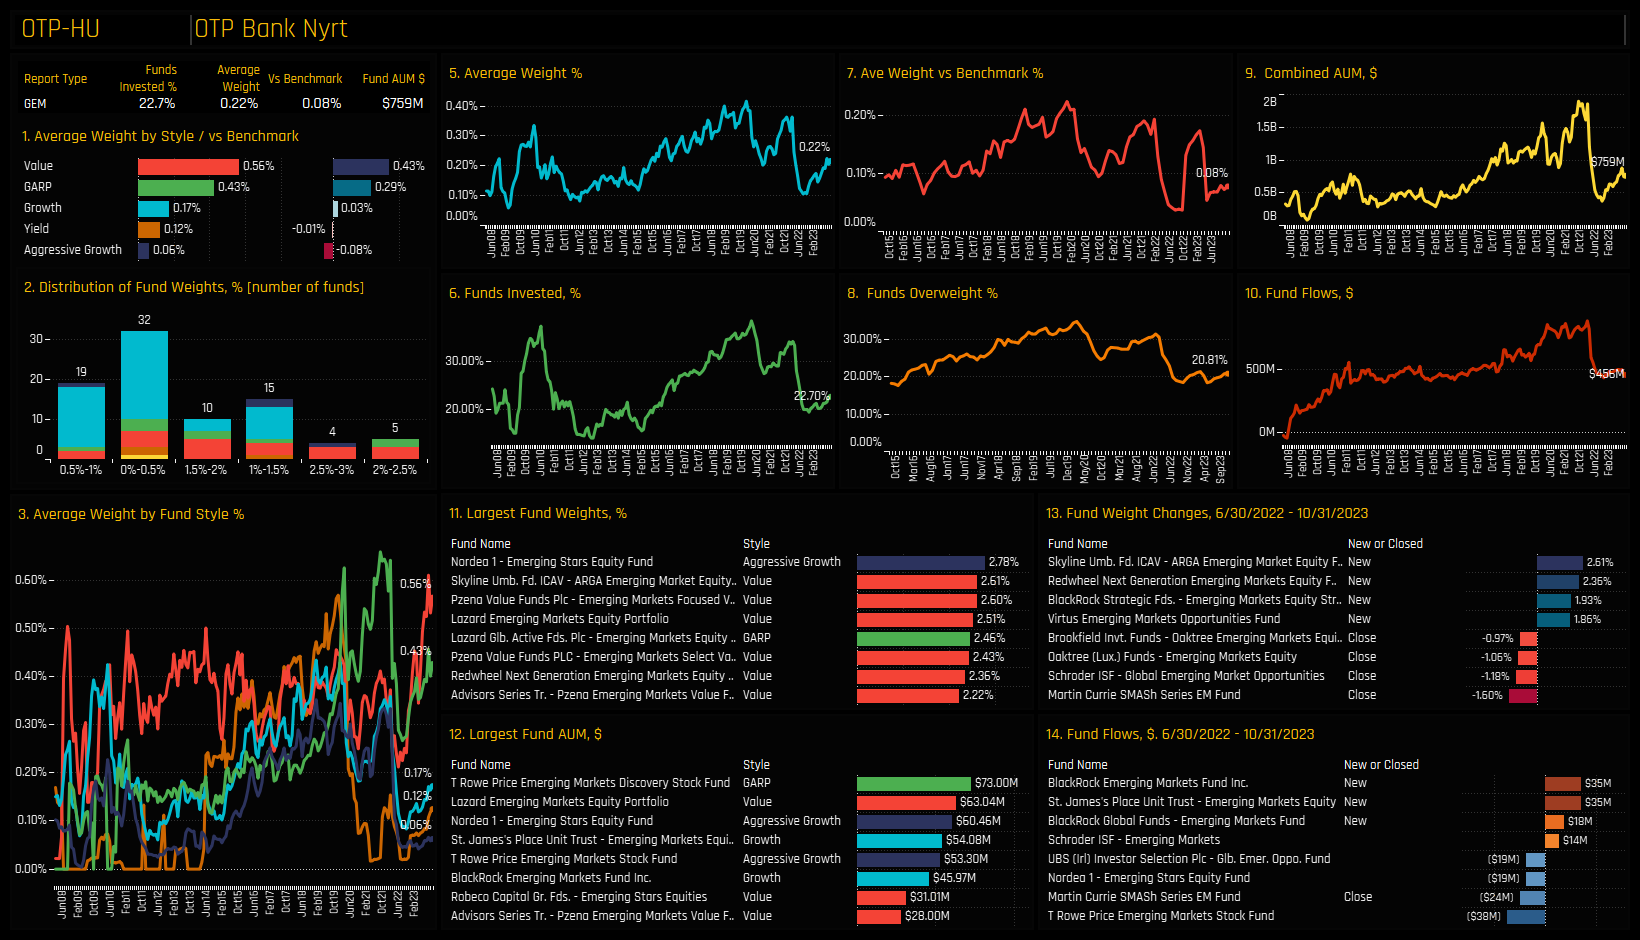
The most widely held stocks in the sector are OTP Bank Nyrt and FirstRank Limited, both owned by 22.7% of the funds in our analysis and at average weights of 022% and 0.18% respectively. Standard Bank Group leads a pack of 7 additional companies that are held by more than 15% of funds, with notable underweights in Al Rajhi Bank and Saudi National Banks. Out-of-the-box positions in Bank of Georgia Group by Jupiter and Quilter top the list of the largest individual fund level positions in the sector, though Al Rajhi Bank is also prevalent among the larger holdings.
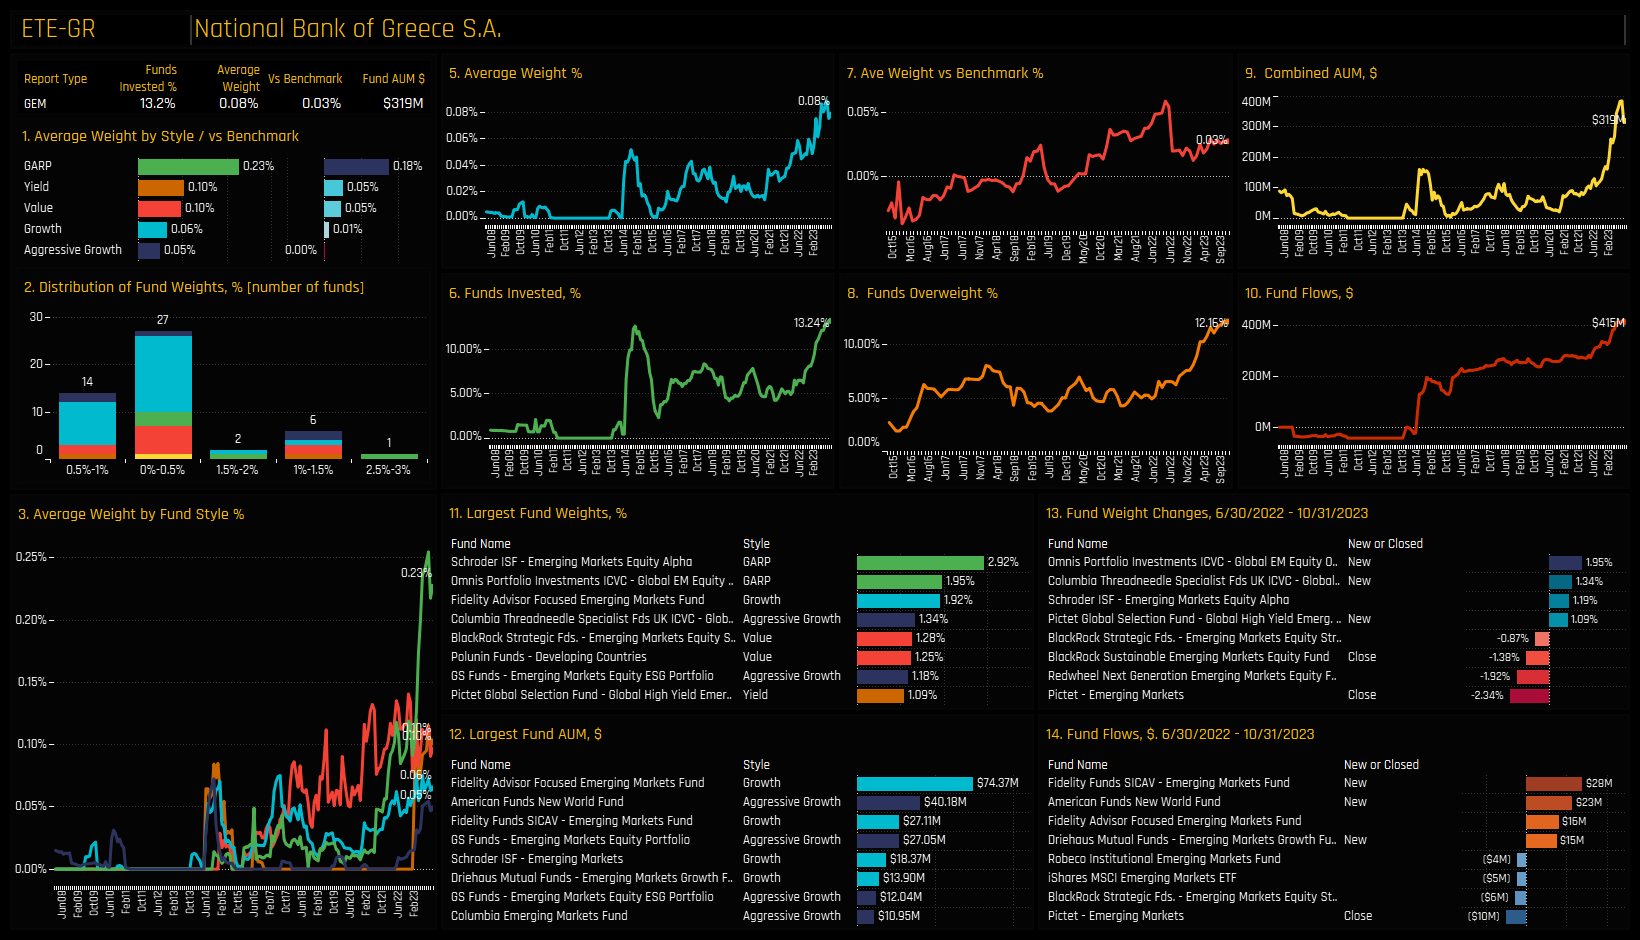
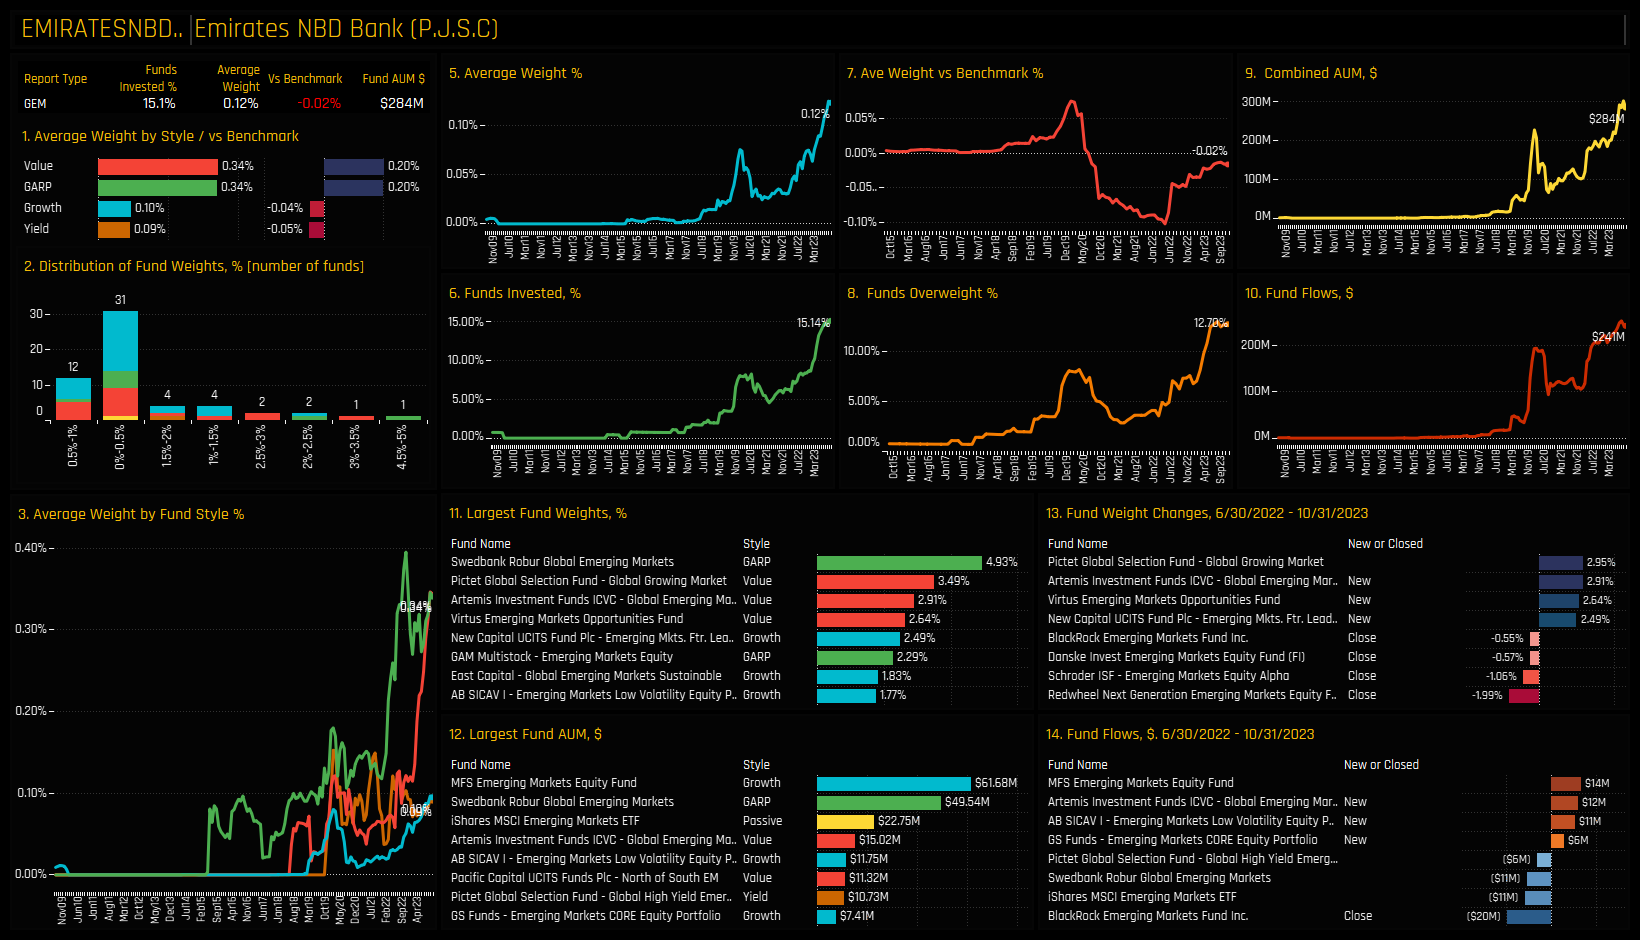
Stock level activity was mixed, with strong ownership changes on both sides of the fence. Stocks capturing increases in ownership were led by Emirates NBD Bank, National Bank of Greece and PZU, whilst managers reduced holdings in Capitec Bank Holdings, First Abu Dhabi Bank and Qatar National Bank. The Sberbank decline is as a result of selected legacy positions that remained on holding statements before 06/30/2022.
Fund Holdings by Style
Splitting company level holdings by fund Style reveals a fair amount of diversion between strategies. Aggressive Growth funds are the only group to hold Capitec Bank Holdings in any size, whilst Al Rajhi Bank’s appeal broadens to include Growth investors. OTP Bank has cross-style appeal, being a primary holding for Growth, GARP, and Value funds, whilst Standard Bank Group is the most widely held financial among Yield investors.
Conclusions & Data Report
The charts to the right show the latest ownership statistics for Regional Sectors among the 370 active GEM funds in our analysis. EMEA Financials are the 8th largest Regional Sector by average weight and the 11th most widely owned. More significant are the positioning stats compared the benchmark index, with EMEA Financials comfortably the largest underweight regional sector globally, and with fewer funds positioned overweight than any other major Sector group.
Country-level positioning is playing a critical role, with significant differences in positioning and recent fund activity among managers. Funds seem to be actively addressing underweights in Saudi and Kuwait Financials, while investment in Greece and Poland is on the rise. Conversely, South African Financials, while stable and traditionally favored, are not currently in the spotlight.
Click on the link below for a detailed report on fund positioning in the EMEA Financials sector. Scroll down for stock profiles on First Rand Limited, National Bank of Greece, Emirates NBD Bank and OTP Bank. Scroll further for Regional Sector profiles on South Africa, Saudi Arabia, Greece, U.A.E and Poland Financials.
JD.com: Test of Investor Resolve as Selling Continues
• Fund ownership in JD.com continues to fall. Average weights slip to 4-year low as managers close out en-mass.
• Between February 2023 and October 2023, there were 56 closures versus 6 openings in JD.com, led by managers at the growth end of the spectrum.
• Despite this, JD.com is still the 16th most widely held stock globally, with combined AUM among the funds in this analysis of $1.27bn.
Time-Series & Stock Rotation
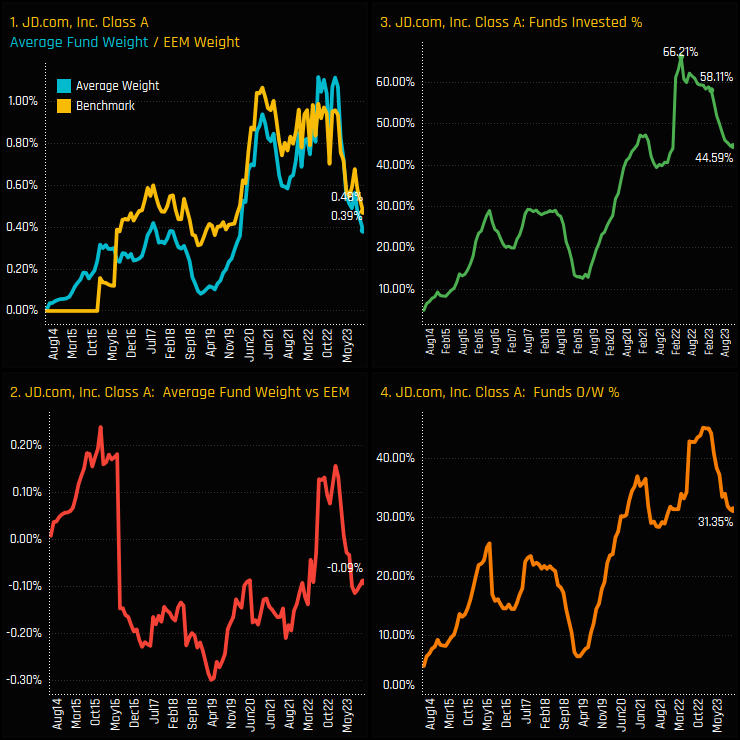
Investment levels in JD.Com are falling. From a peak of 66.2% of funds invested back in March 2022, Global EM funds reversed course and closed out exposures in big numbers (ch3). JD.com lost 8% of funds in the proceeding 11 months but then the closures accelerated, with the percentage of funds invested falling from 58.1% to 44.6% between February 2023 and the end of last month. That’s a total of 96 funds in just an 18 month period – as aggressive a sell-off as we generally see in our data.
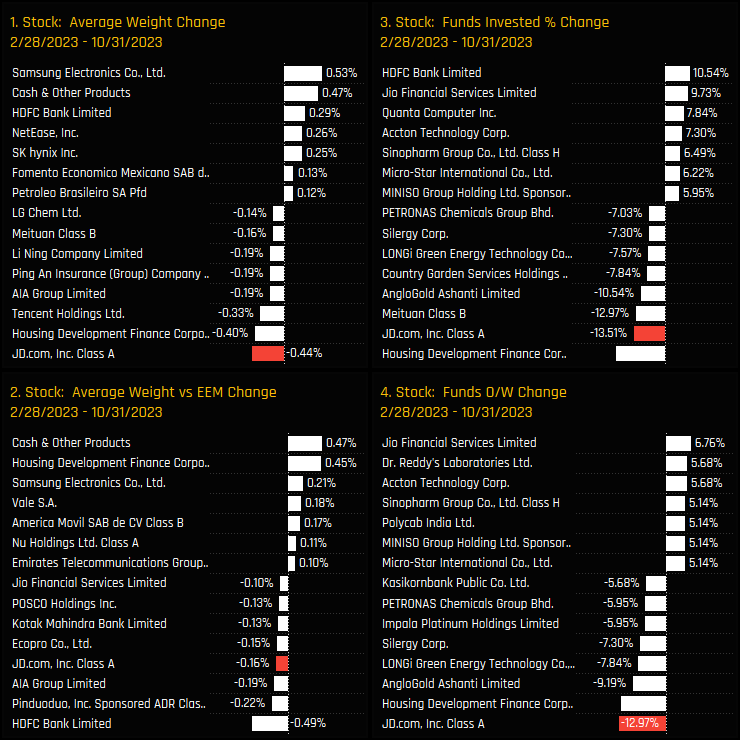
Fund activity for JD.Com between the the last peak of 02/28/2023 and 10/31/2023 has been among the most negative of any stock. A total of 13.5% of funds closed out entirely (ch3), average weights fell by -044% (ch1) and overweights collapsed by -0.16% (ch2). Ignore the corporate action related declines in Housing Development Finance Corp – the JD.com decline was head and shoulders above all stocks in the EM investible Universe over the period.
Fund Activity & Holdings
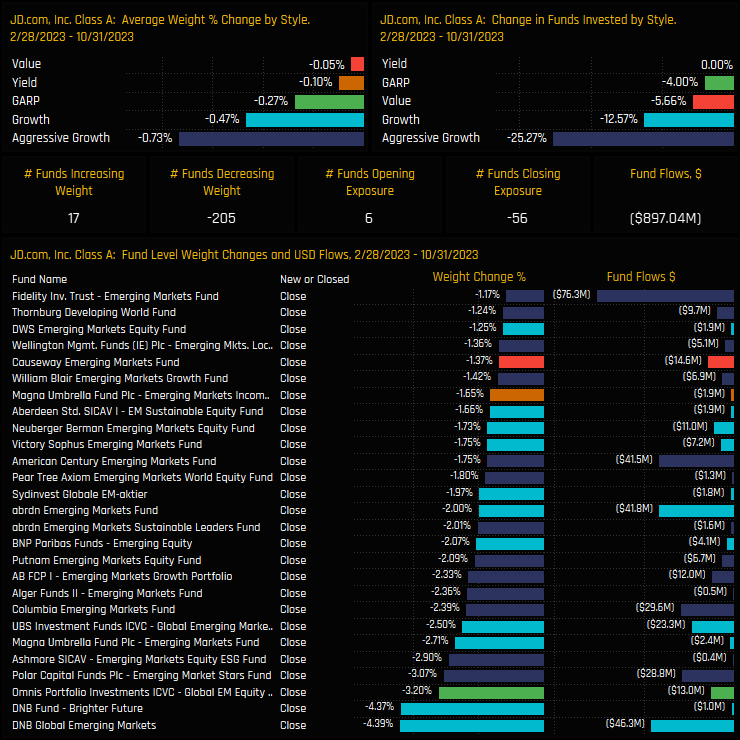
The funds underpinning this allocation shift are shown in the bottom chart, with DNB, Omnis, Polar Capital and Ashmore among the larger close-outs. Closures dominated openings by a factor of 9 (56 closures vs 6 openings) with net fund outflows of $897m. All Style groups saw allocations move lower, though Aggressive Growth and Growth funds were the standouts, with a quarter of Aggressive Growth strategies closing JD.com positions over the period.
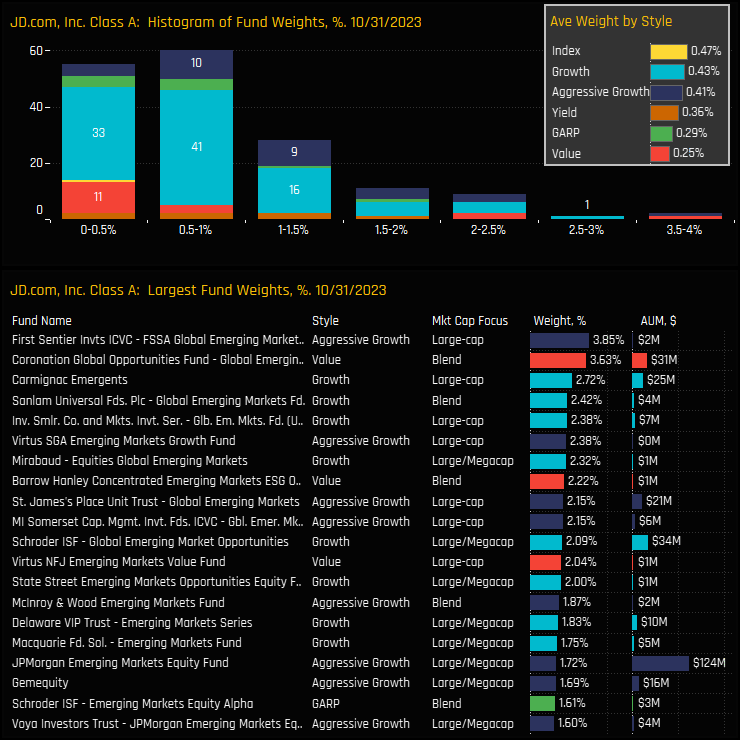
The latest fund holdings in JD.com are highlighted in the charts below. The histogram shows the bulk of current owners hold a sub-1% weight, with the top holders of First Sentier Global EM (3.85%) and Coronation Global Opportunities (3.63%) the only funds to hold a 3%+ stake. All Style groups are now positioned underweight the benchmark iShares MSCI EM ETF on average, with Value funds and GARP the lowest allocators.
Conclusions & Data Report
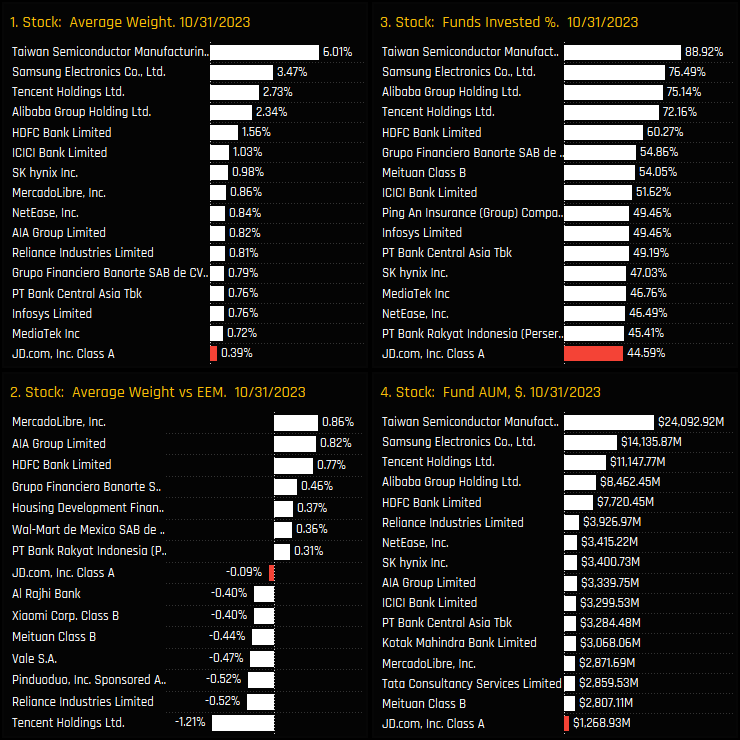
Such was the meteoric rise in JD.com investment prior to the peak in March 2022 that even with the aggressive close outs, JD.com remains a well-held company. The chart opposite shows the latest ownership statistics for all stocks in the Emerging Market universe. JD.com is still the 16th most widely held stock globally, with combined AUM among the funds in this analysis of $1.27bn.
Investors committed to JD.com amidst its decline now face a difficult decision, particularly in light of the stock’s 50% plummet this year. The departure of numerous key investors, paired with the still sizeable base of remaining investors, heightens the risk of an additional sell-off, casting a shadow on any potential share price recovery in the near term.
Incidentally, we are seeing the same trend in our Asia Ex-Japan research, which you can read on this link:
• Investment levels vary significantly across the Global investible universe, with some stocks being widely held while others are scarcely owned, and these ownership levels fluctuate monthly.
• Our analysis synthesizes current and historical data on fund positioning with recent manager activity to accurately assess sentiment for each stock within our Global coverage.
• We spotlight eight stocks that not only sit at the extreme ends of their historical position ranges, but have also experienced notable shifts in fund ownership in recent months.
Stock Sentiment
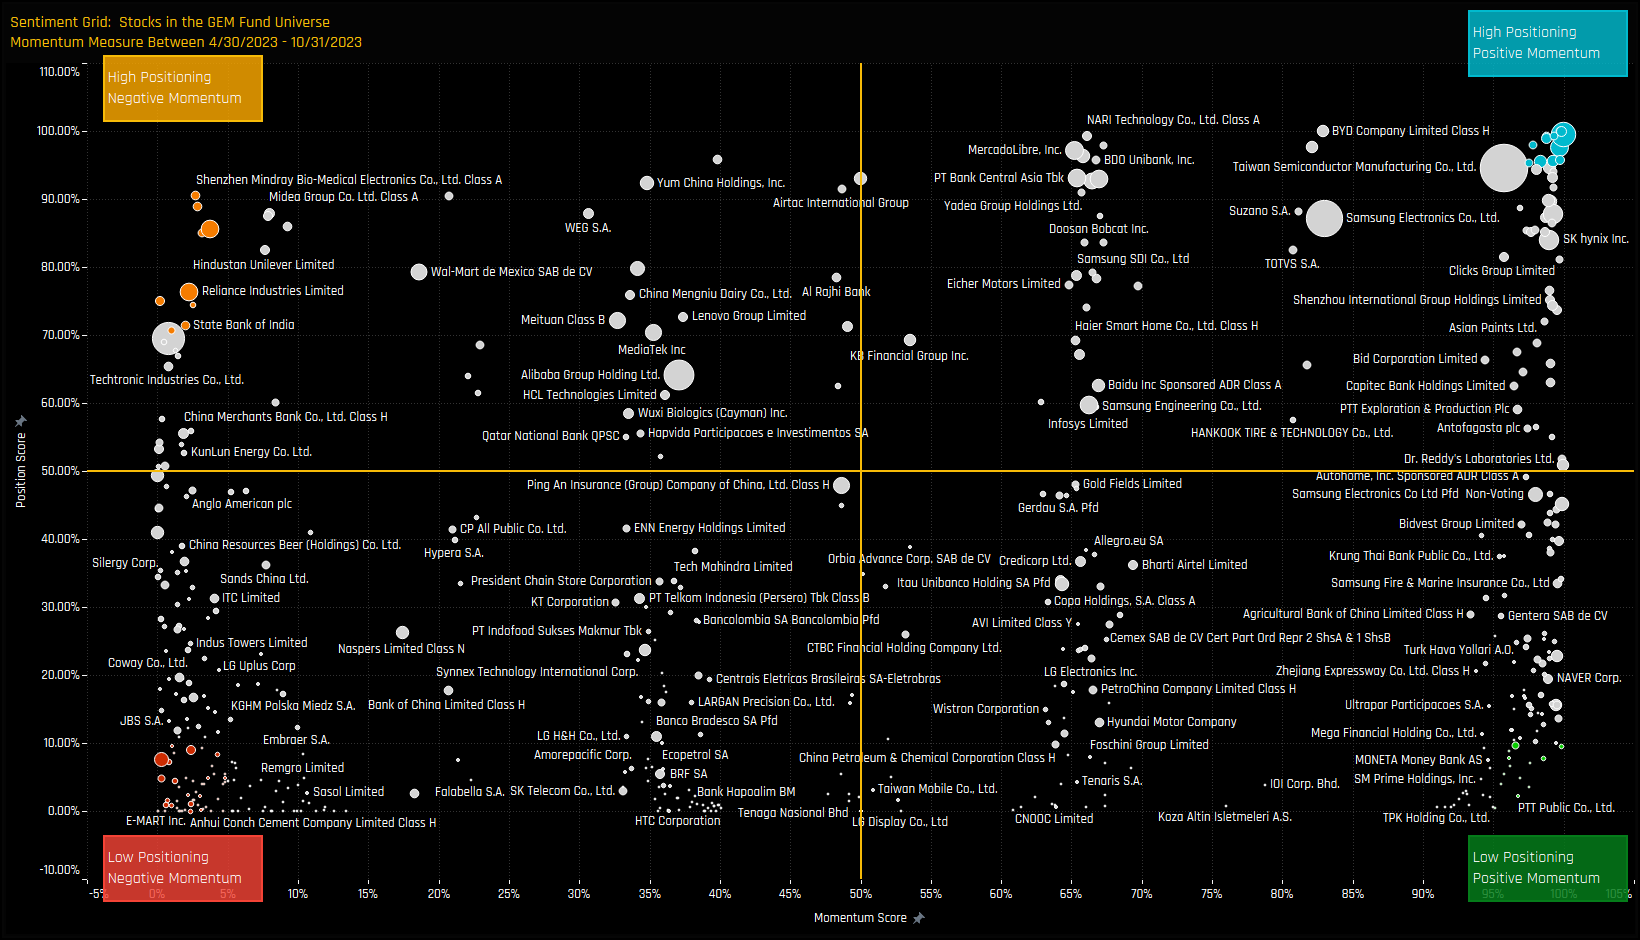
The Sentiment Grid below is designed to visualize the interplay between current fund positioning, long-term fund positioning and shorter-term fund manager activity for all stocks in the GEM fund active universe. The Y-axis shows the ‘Position Score’, a measure of current positioning in each stock compared to its own history going back to 2008 on a scale of 0-100%. It takes in to account the percentage of funds invested in each stock versus history, the average fund weight versus history and the percentage of funds overweight the benchmark versus history. The higher the number, the more heavily a stock is owned by active EM managers compared to its own history.
The X-Axis shows the ‘Momentum Score’, a measure of fund manager activity for each stock between 04/30/2022 and 10/31/2023 on a scale of 0% (maximum negative activity) to 100% (maximum positive activity). The Momentum Score takes in to account the change in the percentage of funds invested in each stock over the period, the change in average weight and the change in the percentage of funds overweight. The chart also highlights the companies at the extreme ends of each quadrant by colour, which will shall explore in more detail below.
Extreme Stocks
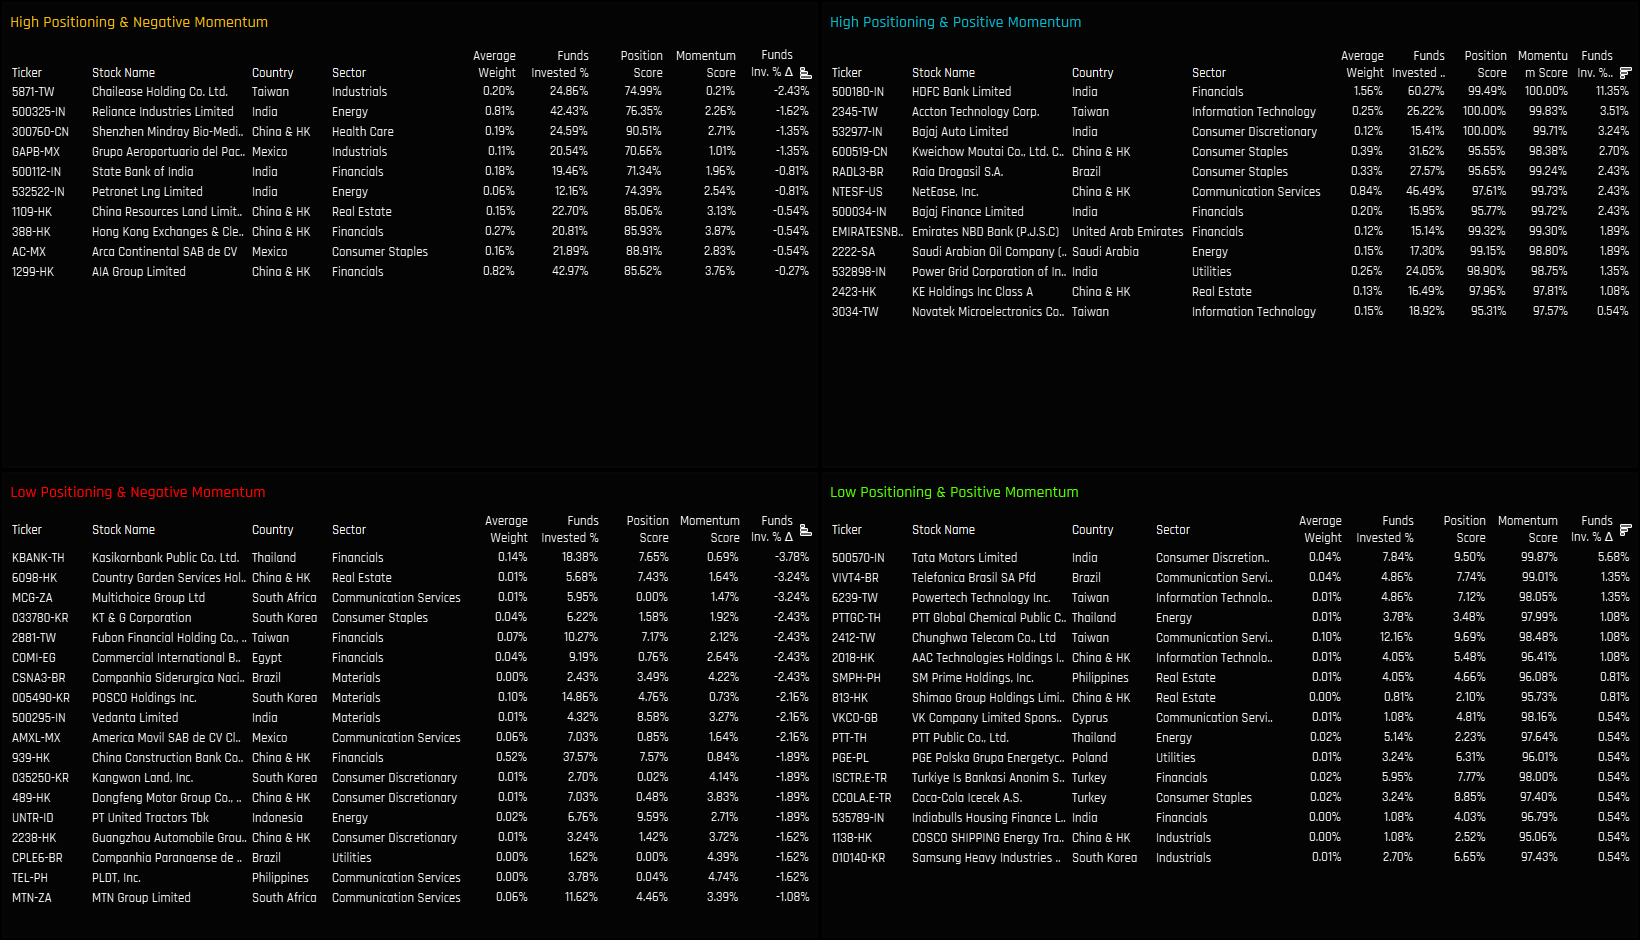
The tables below list the stocks in the extreme corners of each quadrant. The screening methodology is as follows:
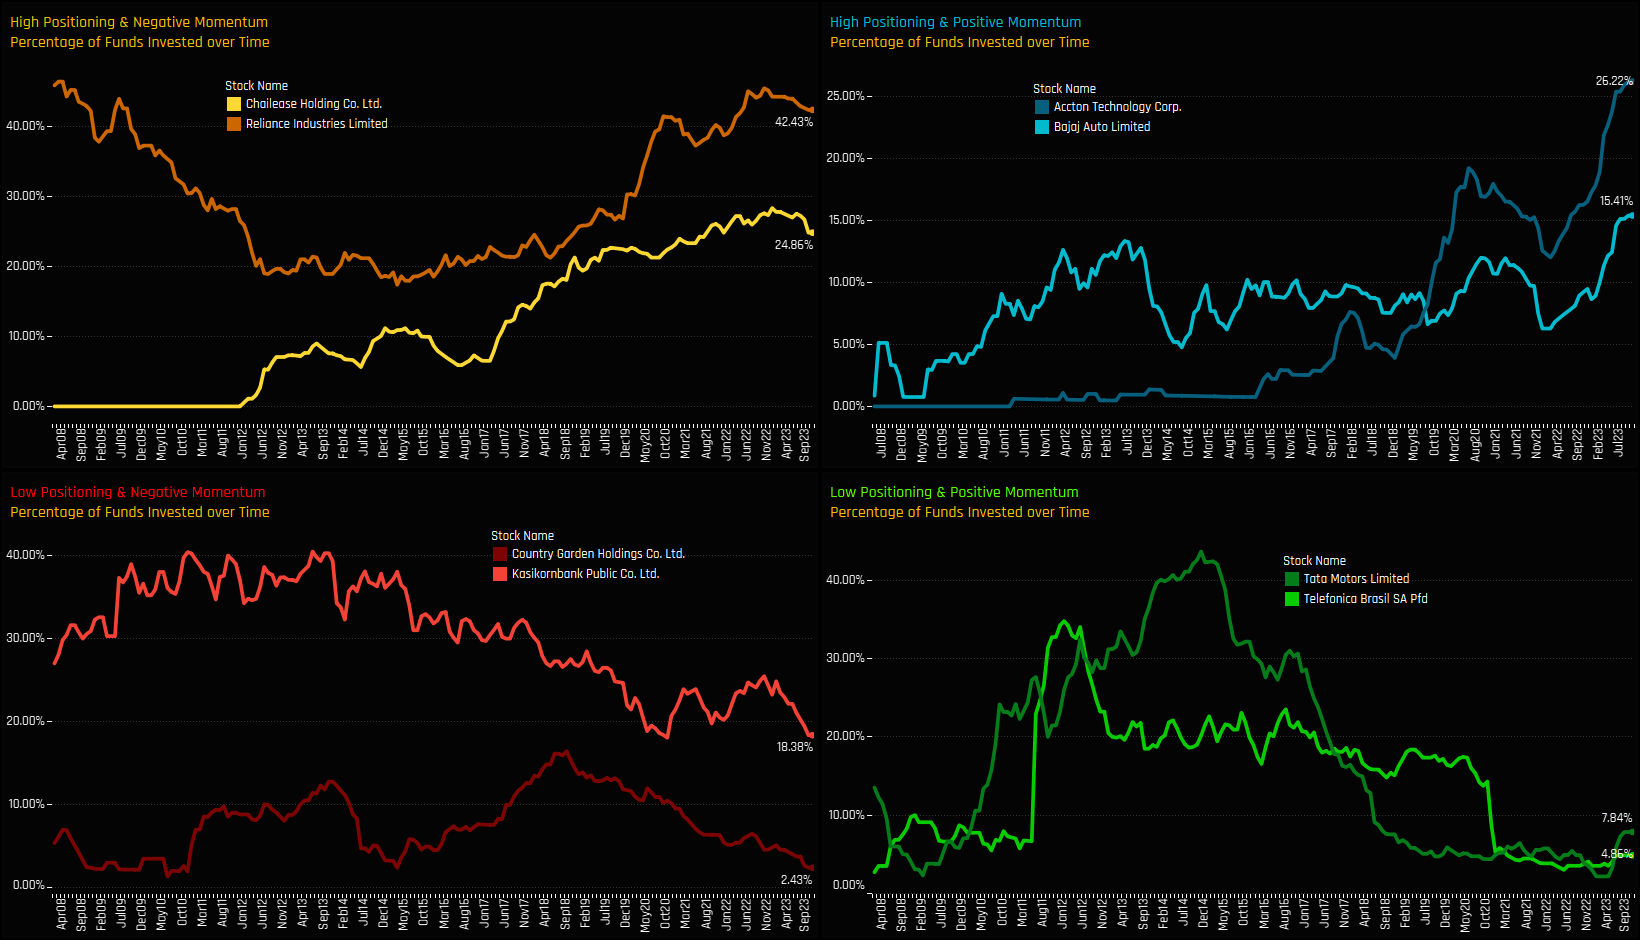
High Positioning & Negative Momentum: Position Score > 70%. Momentum Score < 5%
High Positioning & Positive Momentum: Position Score > 95%. Momentum Score > 95%
Extreme Stocks Focus
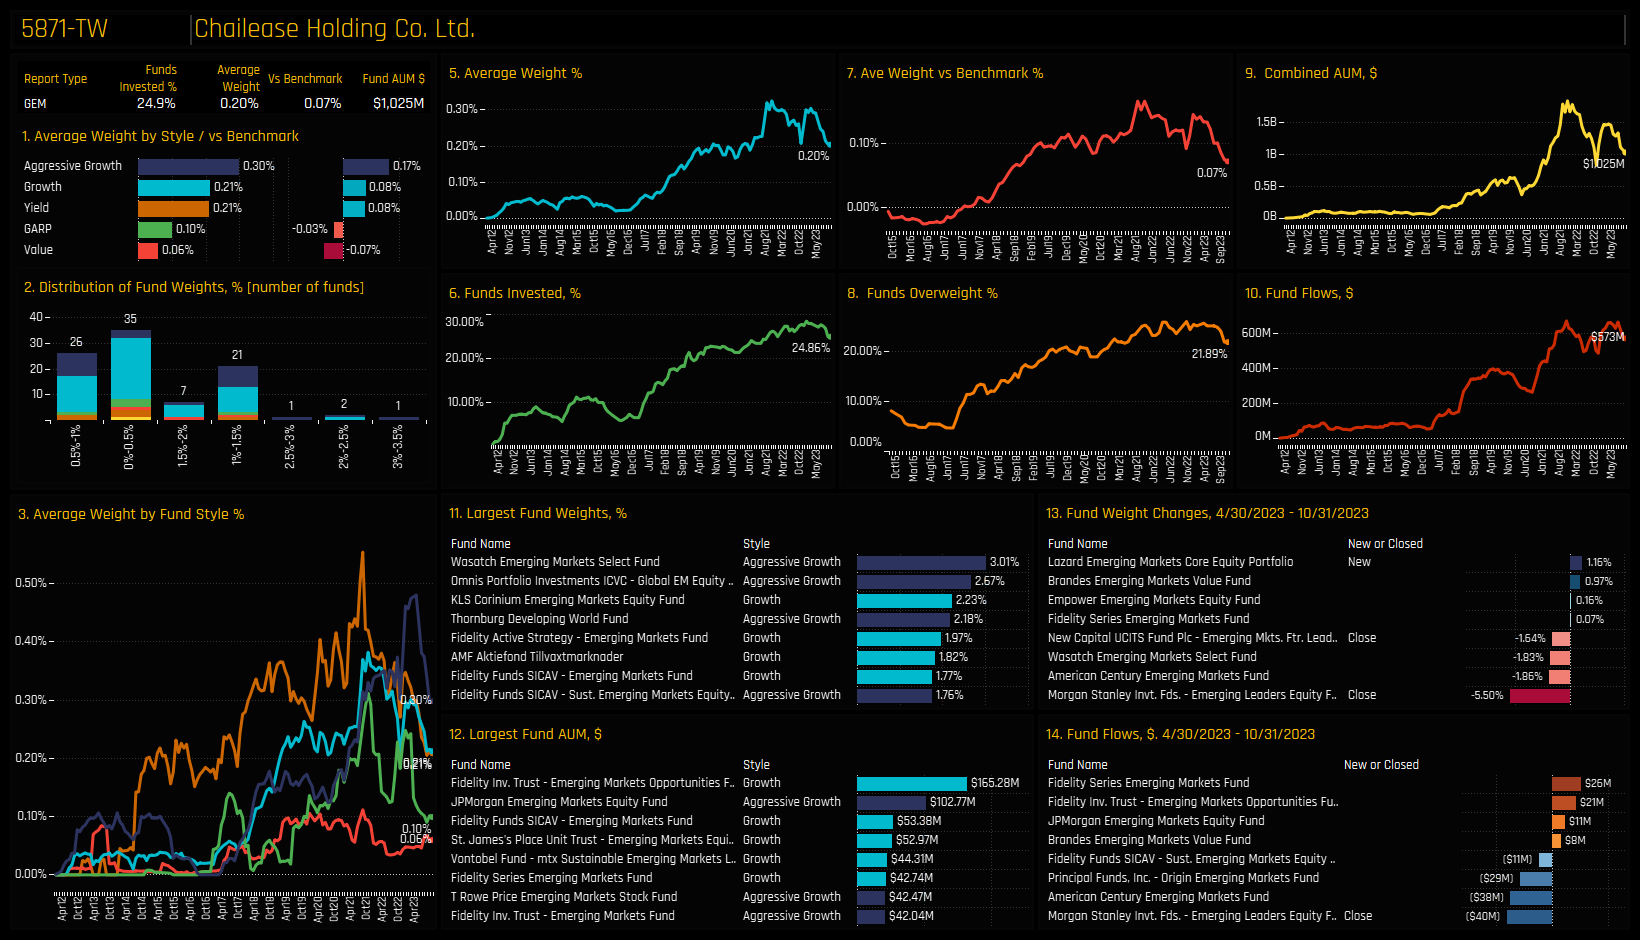
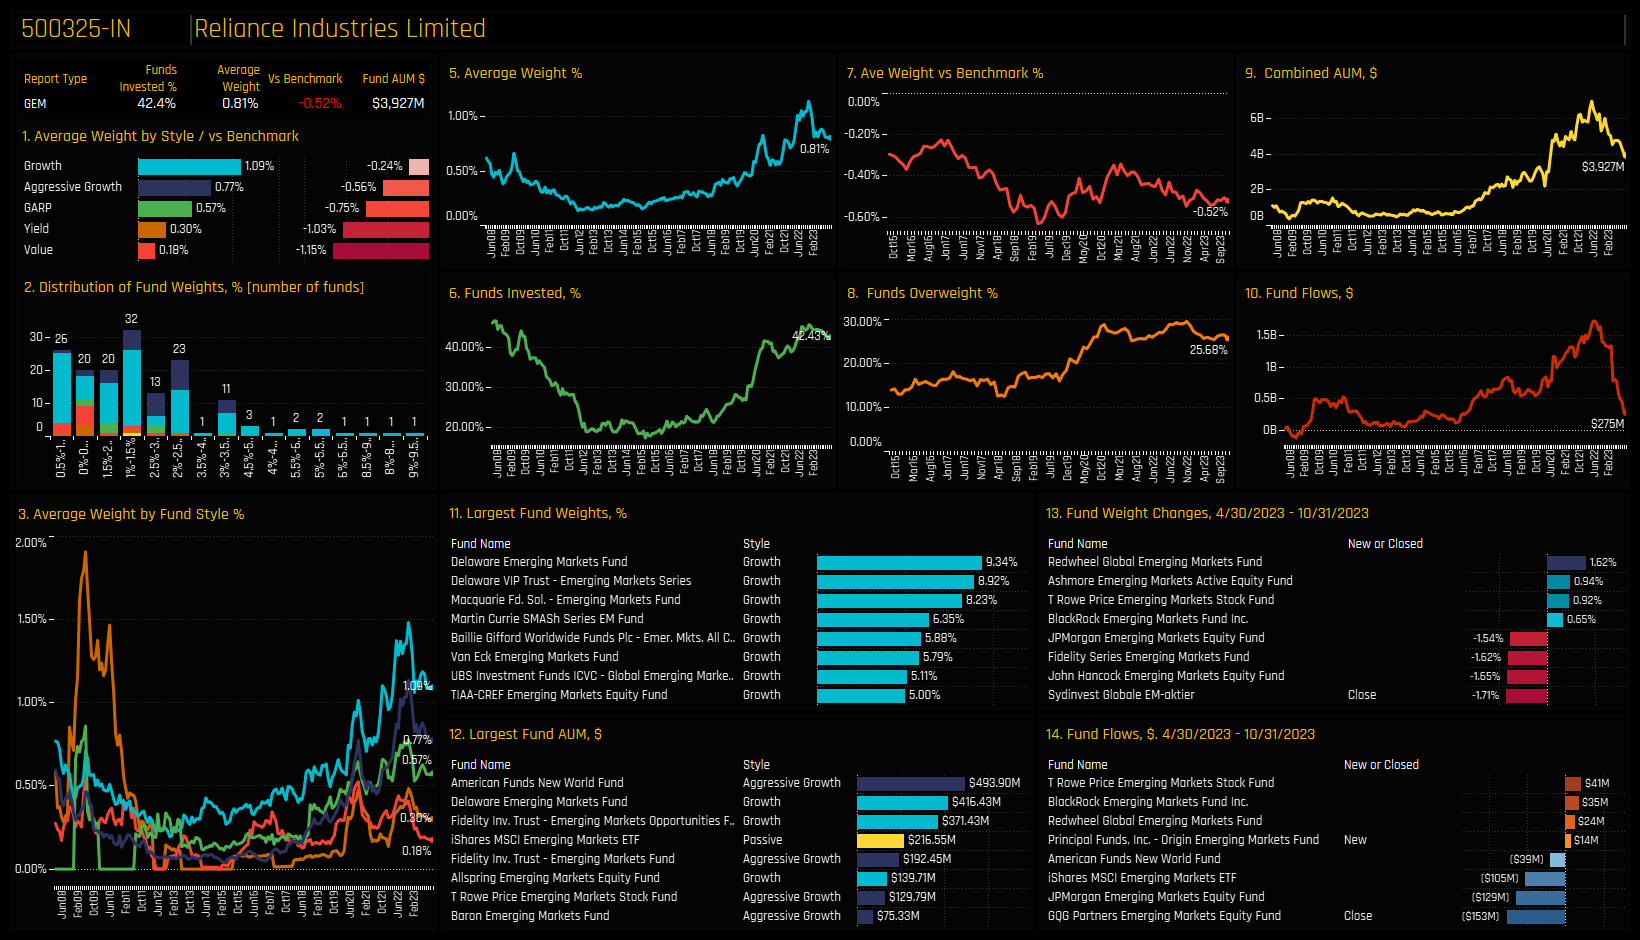
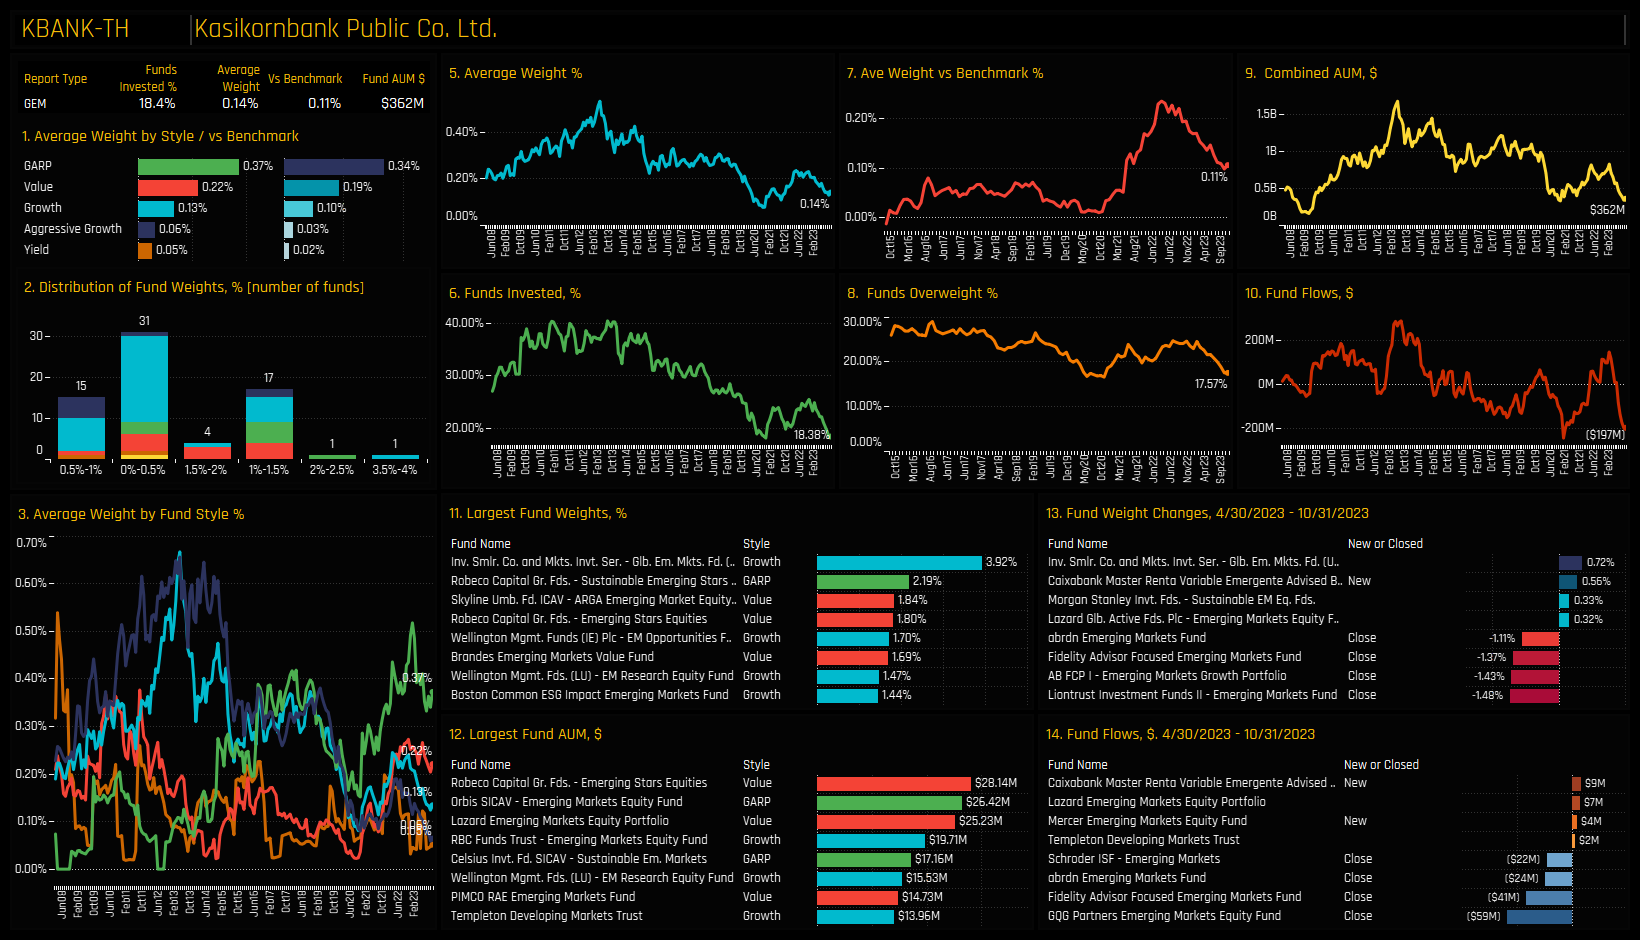
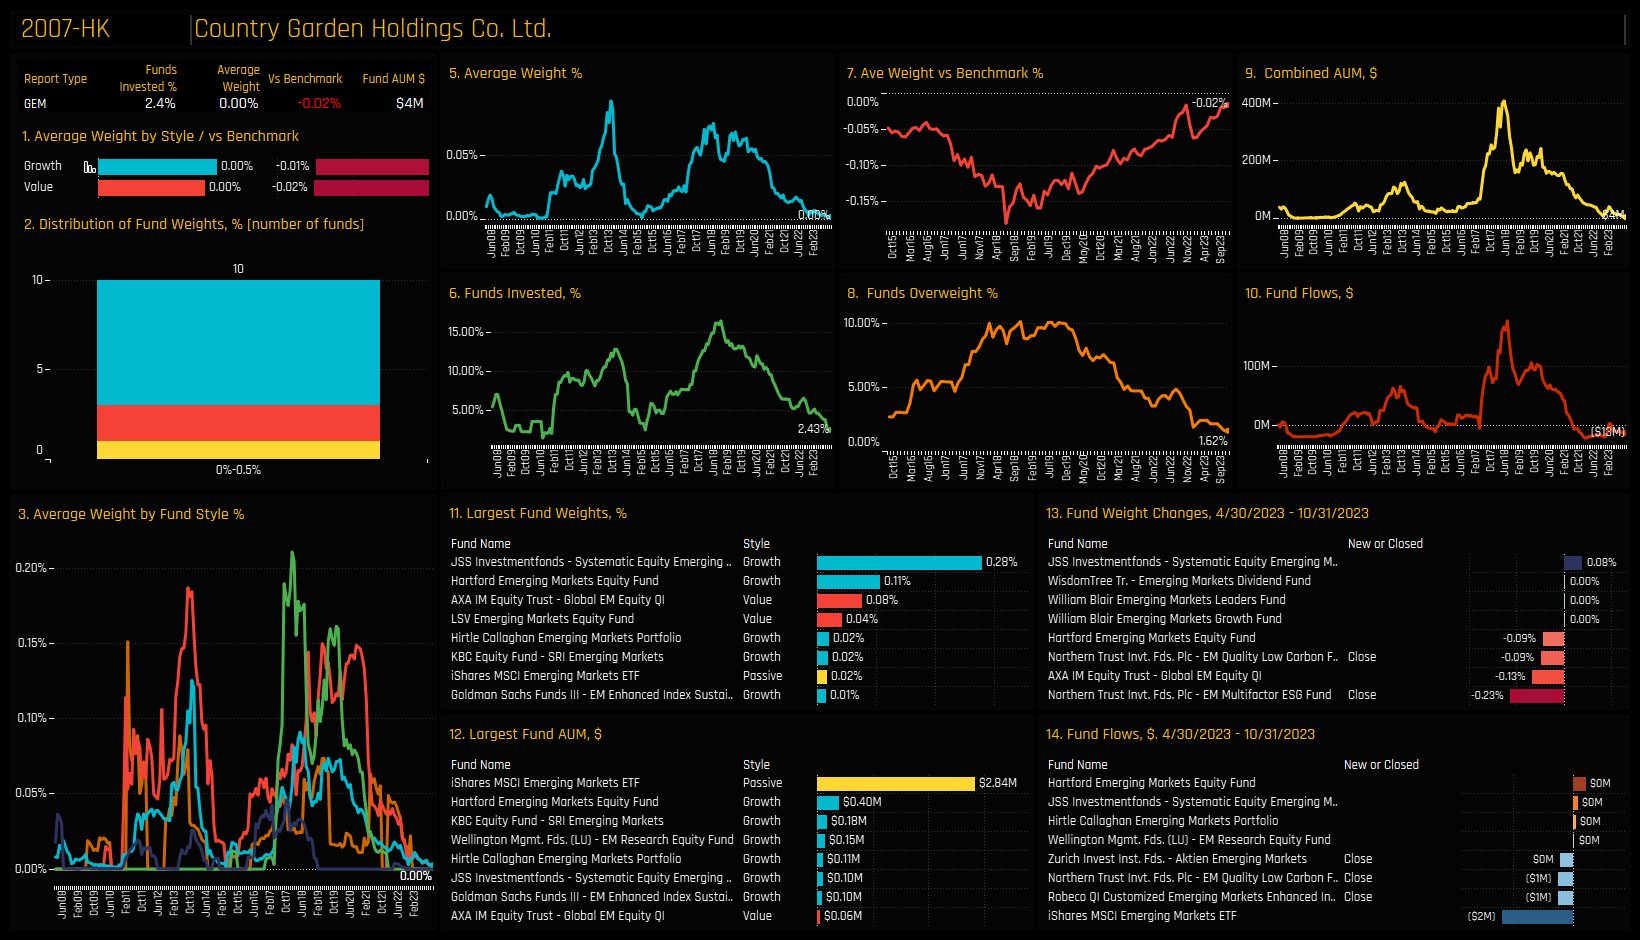
The following charts illustrate the proportion of active funds invested in the top 2 stocks within each of the 4 categories. This visualization provides an additional perspective on how the Sentiment Grid works. The top-left chart reveals a downturn in holdings for Chailease Holdings and Reliance Industries following a sustained period of growth. In contrast, the bottom-left chart illustrates a consistent decrease in fund investment in Country Garden Holdings and Kasikornbank Public Co, with recent sell-offs driving ownership to a 15-year low.
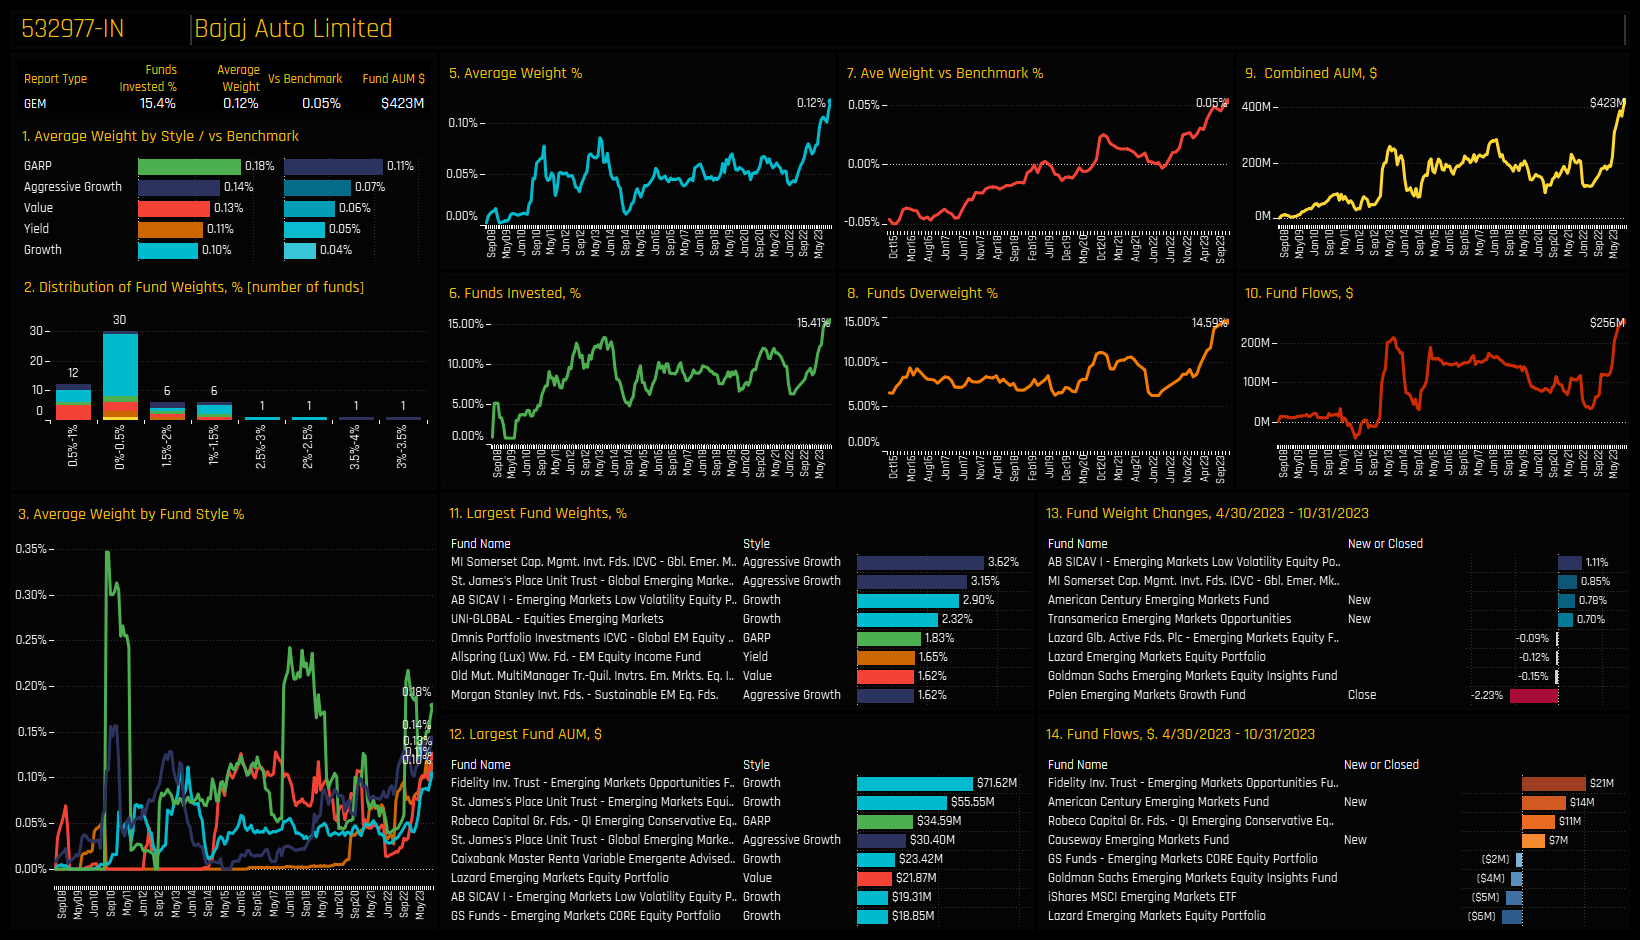
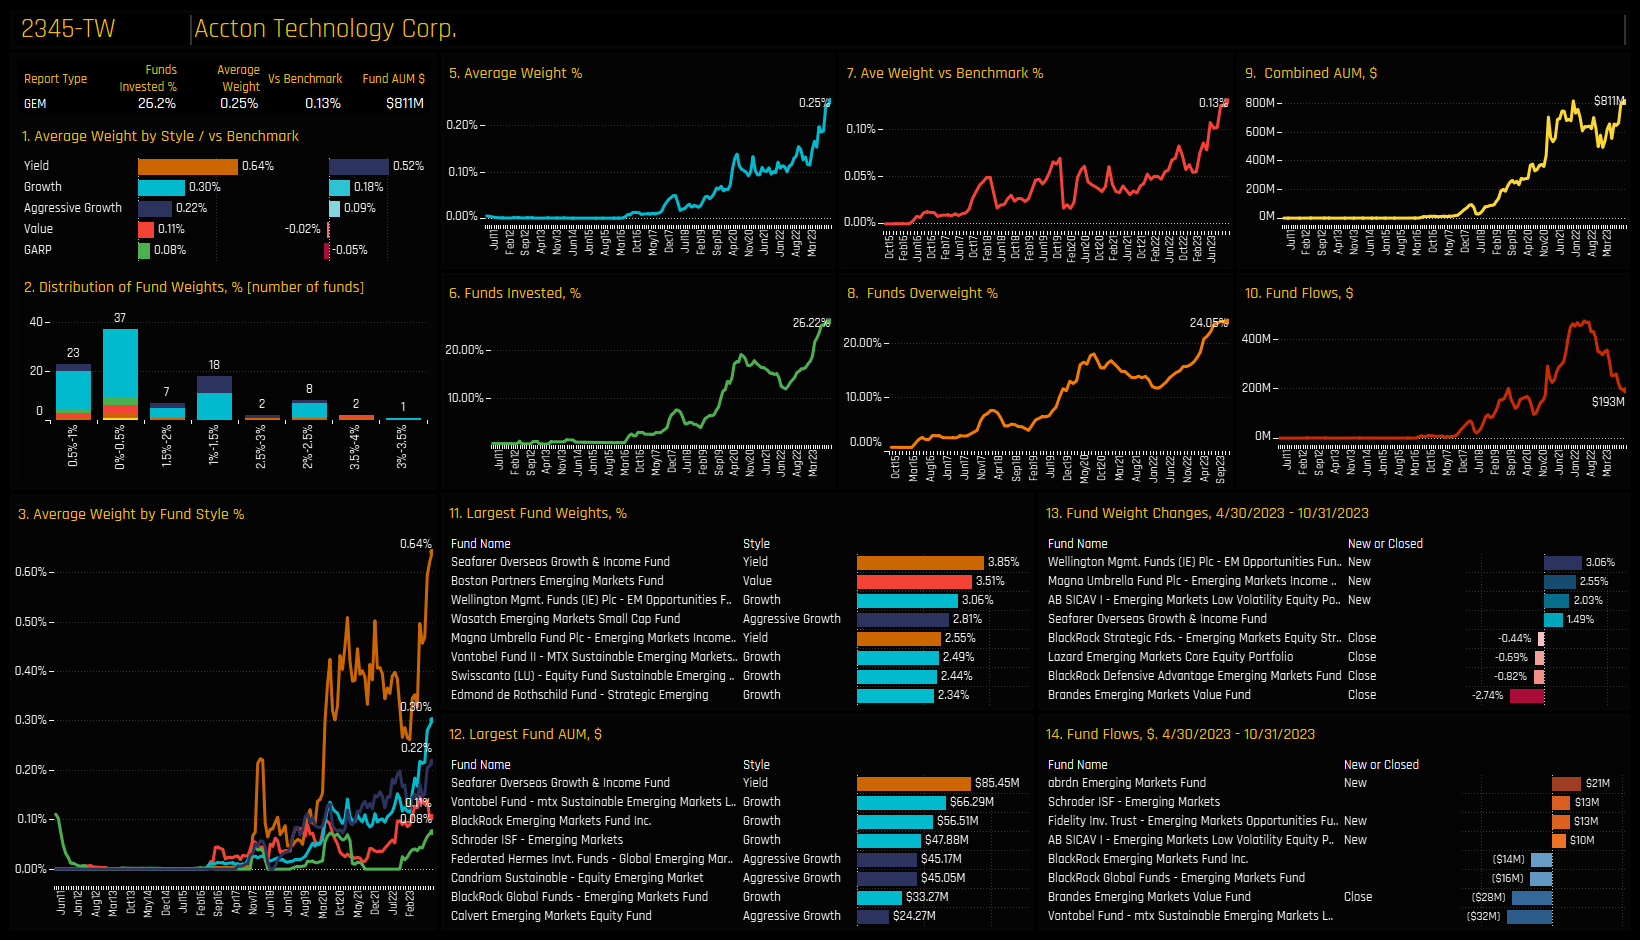
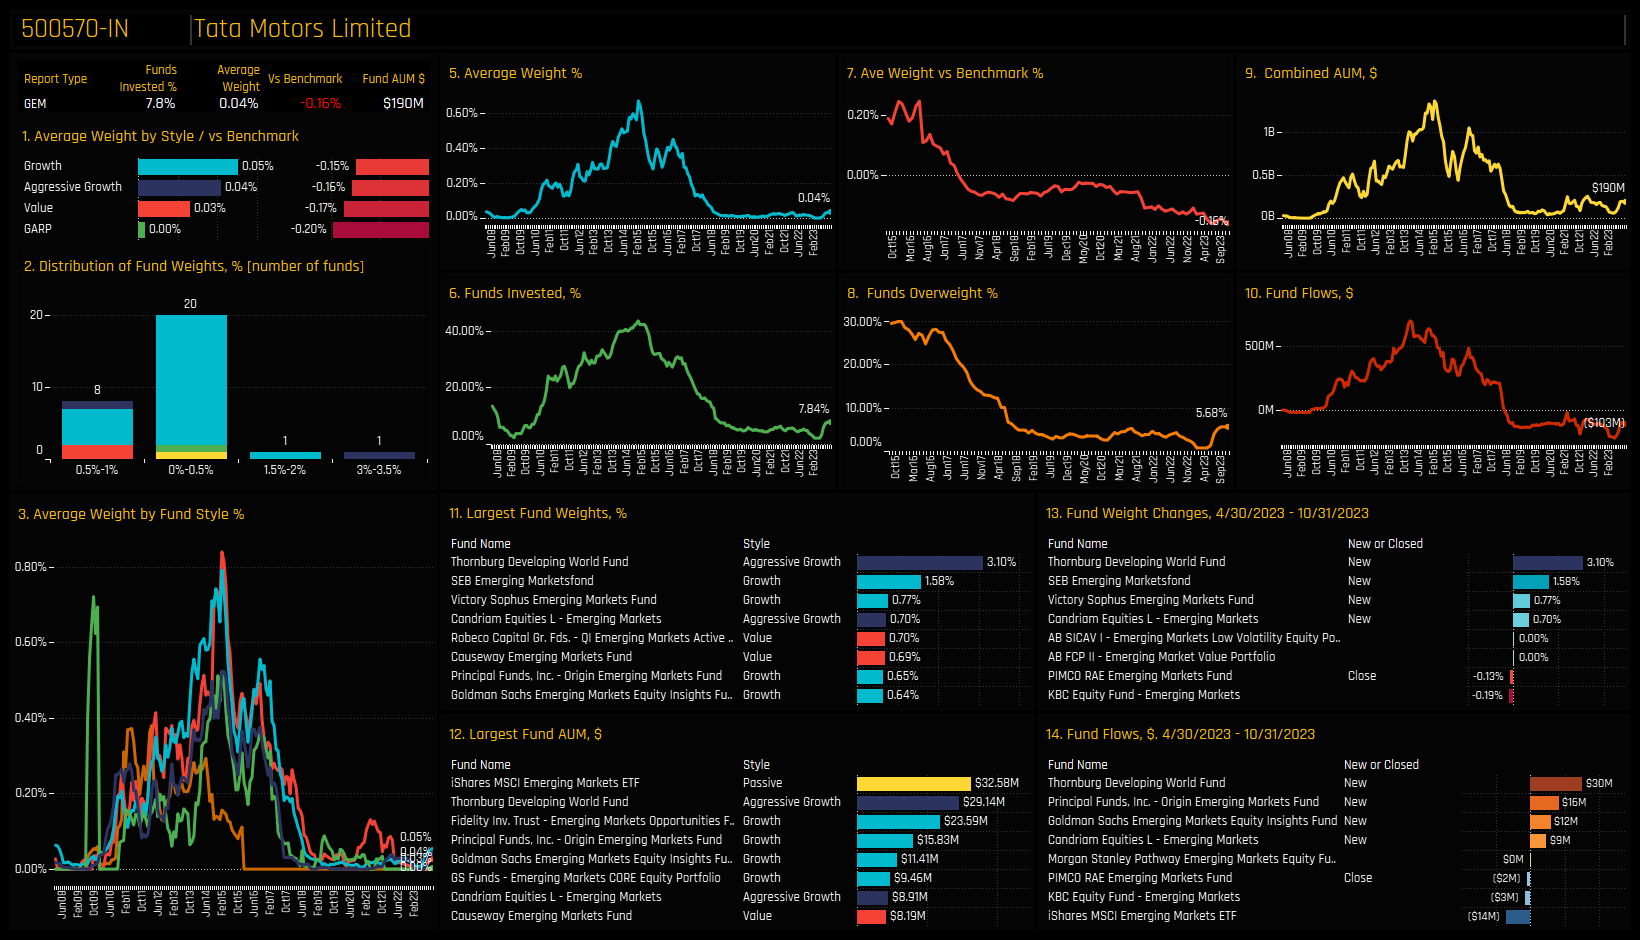
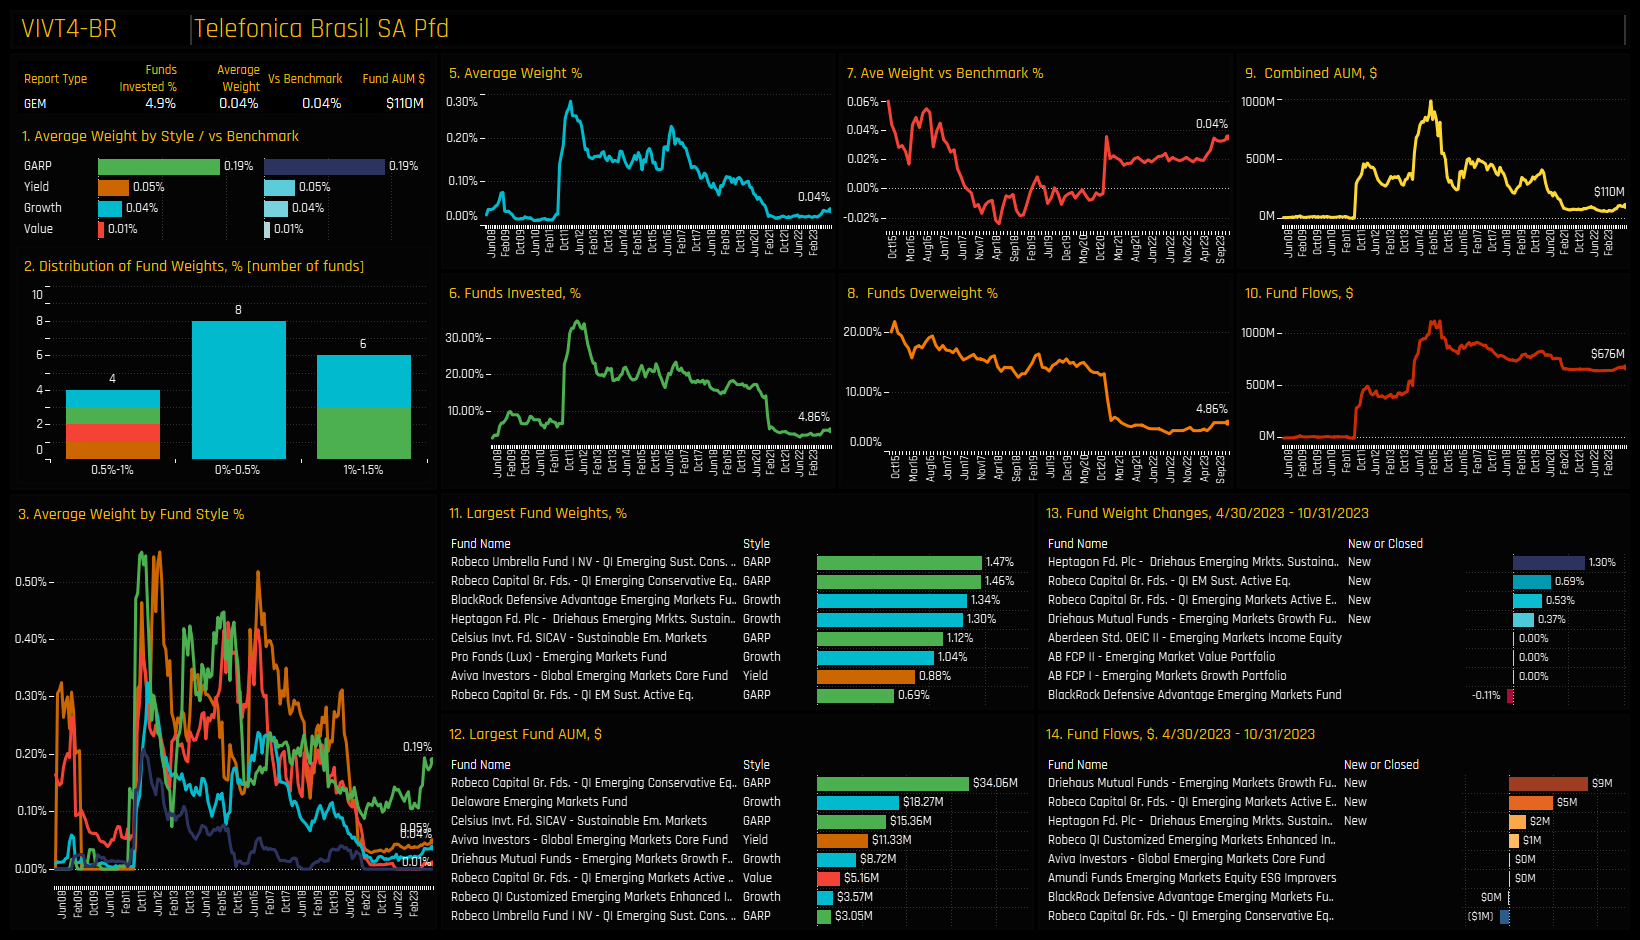
Focusing on the bottom right chart, we see Tata Motors and Telefonica Brasil positioned at the lower extremes of their ownership history; however a recovery is underway for both. The top right chart indicates that Accton Technology Corp and Bajaj Auto Ltd have reached record levels of ownership after months of increasing fund engagement. More in-depth profiles of these eight key stocks from the extremes of our Sentiment Grid are detailed in the charts below.
High Positioning & High Momentum: Bajaj Auto Limited
High Positioning & High Momentum: Accton Technology Corp.
High Positioning & Low Momentum: Chailease Holding Co
High Positioning & Low Momentum: Reliance Industries Limited
Low Positioning & Low Momentum: Kasikornbank Public Co
Low Positioning & Low Momentum: Country Garden Holdings Co
Low Positioning & High Momentum: Tata Motors Limited
Low Positioning & High Momentum: Telefonica Brasil SA
370 emerging market Funds, AUM $368bn
GEM Active Funds Ownership Report
Please click on the link below for the full data report on Global EM active fund positioning
For more analysis, data or information on active investor positioning in your market, please get in touch with me on steven.holden@copleyfundresearch.com
Investor Positioning Report — Copley Fund Research Ltd · Last updated: July 2026 · Registered in England and Wales
1. Who we are
Copley Fund Research Ltd provides proprietary institutional fund intelligence to listed companies and investor relations professionals. These terms govern every purchase of an Investor Positioning Report. By completing a purchase you confirm you have read, understood, and agreed to these terms in full.
2. What you are purchasing
The Investor Positioning Report is a bespoke PDF report mapping the institutional fund universe around your stock. It covers current investors, past investors, competitor investors, and white space investors. Every report is built from scratch for the specific company ordered and is not a standardised or templated product.
3. Delivery and process
Following payment or invoice issuance, Copley Fund Research will contact you within one working day to agree your competitor set. Production begins once the competitor set is confirmed in writing. The completed report will be released to you within 48 hours of production starting, provided payment has been received in full; where payment is outstanding, the report will be withheld until payment clears. If the requested company falls outside our covered fund universes, or a competitor set cannot be agreed, Copley Fund Research will issue a full refund or cancel the outstanding invoice.
4. Competitor set agreement
The competitor set is agreed with you in writing prior to production, and the report is built to that agreed specification. Requests to amend the competitor set after delivery, based on a change of preference rather than an error, may be treated as a new order.
5. Refund policy
Because each report is produced individually for your company, orders are non-refundable once production has begun, except as set out in clauses 3 and 5a below. By purchasing, you agree not to dispute the charge with your card provider on the basis that the service was not as described, provided the report has been delivered to the agreed specification or corrected under clause 5a.
5a. Quality remedy
If a delivered report contains a material error caused by Copley Fund Research — for example, an incorrect company analysed, a competitor omitted from the agreed set, or content missing from the specification in clause 2 — Copley Fund Research will correct and redeliver the report at no additional charge, within a reasonable timeframe. This is your sole remedy for such errors.
6. Data and accuracy
All fund positioning data in the report reflects holdings as disclosed at the most recently available reporting date at the time of compilation. The timing of fund holdings disclosures is determined by regulatory requirements applicable to each fund and is outside the control of Copley Fund Research Ltd. This data may not reflect current fund positions. Copley Fund Research takes reasonable care to ensure accuracy but makes no warranty, express or implied, as to the completeness or current accuracy of the underlying data — though this does not affect the quality remedy in clause 5a for errors in how that data was analysed or presented. Past fund positioning is not indicative of future fund behaviour or investment decisions.
7. Not investment advice
The Investor Positioning Report is produced for investor relations intelligence purposes only. It does not constitute investment advice, financial advice, or a recommendation to buy, hold, or sell any security. The data reflects historical fund positioning and must not be relied upon as a prediction of future fund behaviour or investment decisions. Copley Fund Research Ltd is not authorised or regulated by the Financial Conduct Authority for the provision of investment advice.
8. Permitted use and confidentiality
The report is licensed for internal use by the purchasing organisation only. You may share it with employees and directors of your organisation. You may not: reproduce, redistribute, publish, or resell the report or any part of it; share it with any third party outside your organisation without prior written consent; use the fund or portfolio manager names contained in the report to approach those individuals on behalf of Copley Fund Research or in a manner that could damage Copley Fund Research's relationships with those funds; or use the data for any purpose other than your own investor relations strategy. The data, analysis, and methodology contained in the report are the intellectual property of Copley


