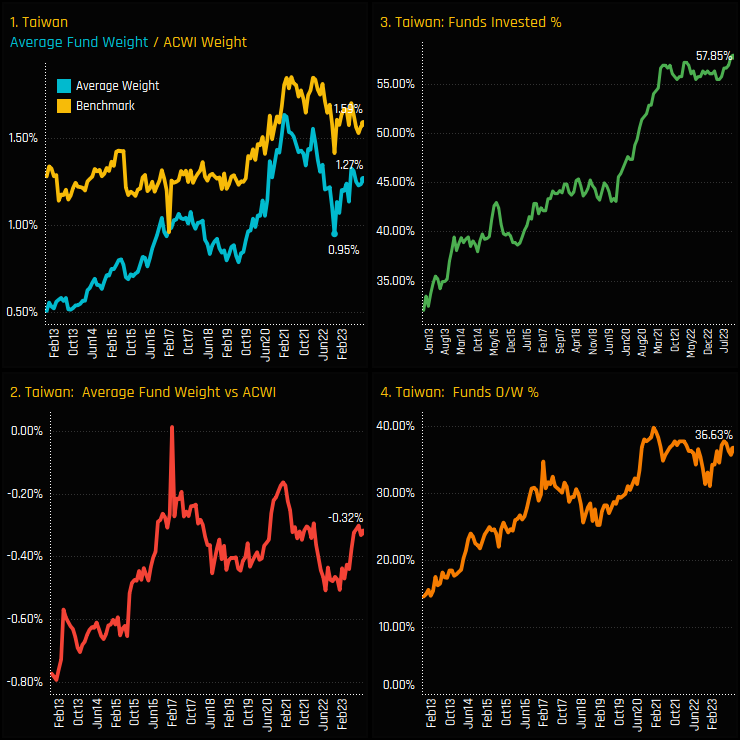
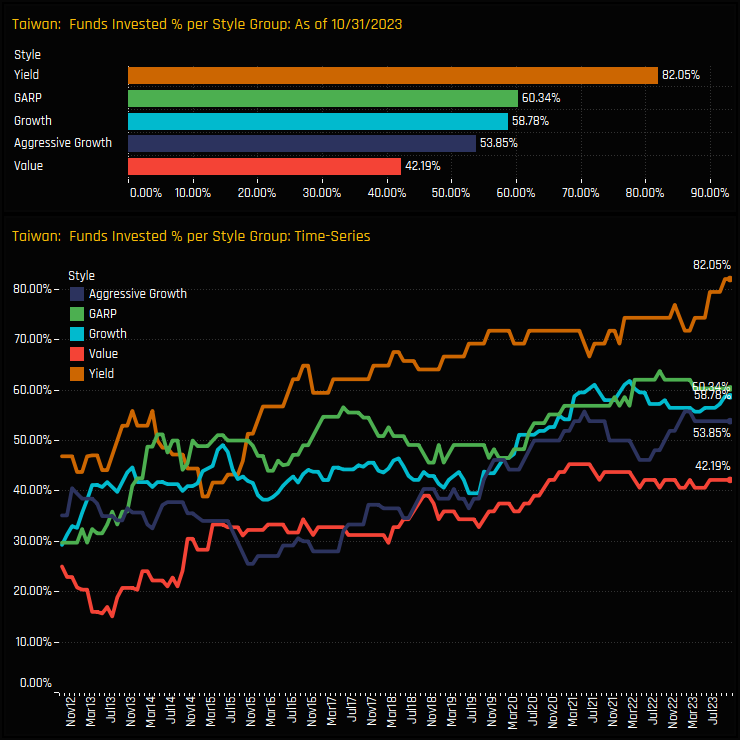
• The percentage of Global funds invested in Taiwan hits an all-time high of 57.8%.
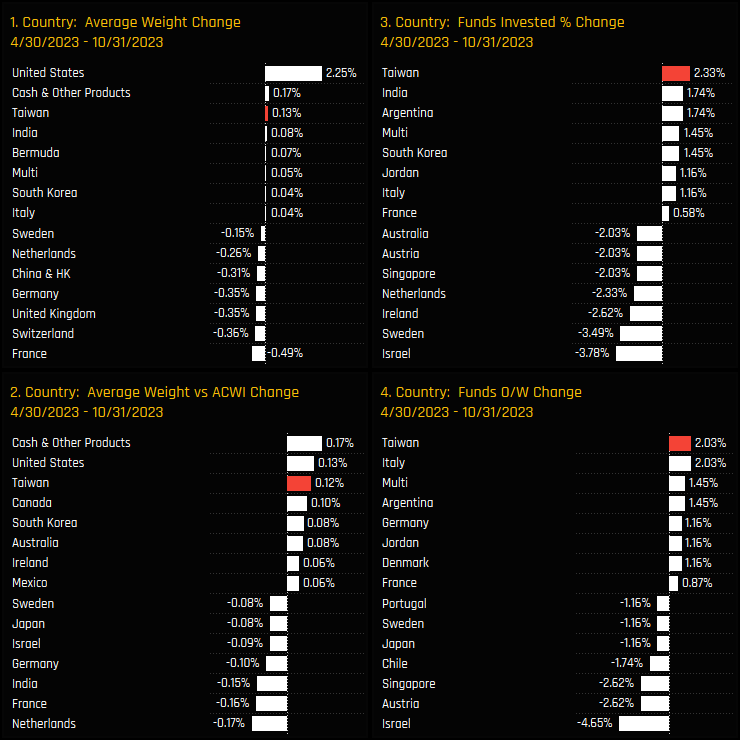
• Taiwan has been a key beneficiary of manager rotation alongside India, Argentina and South Korea over the last 6-months.
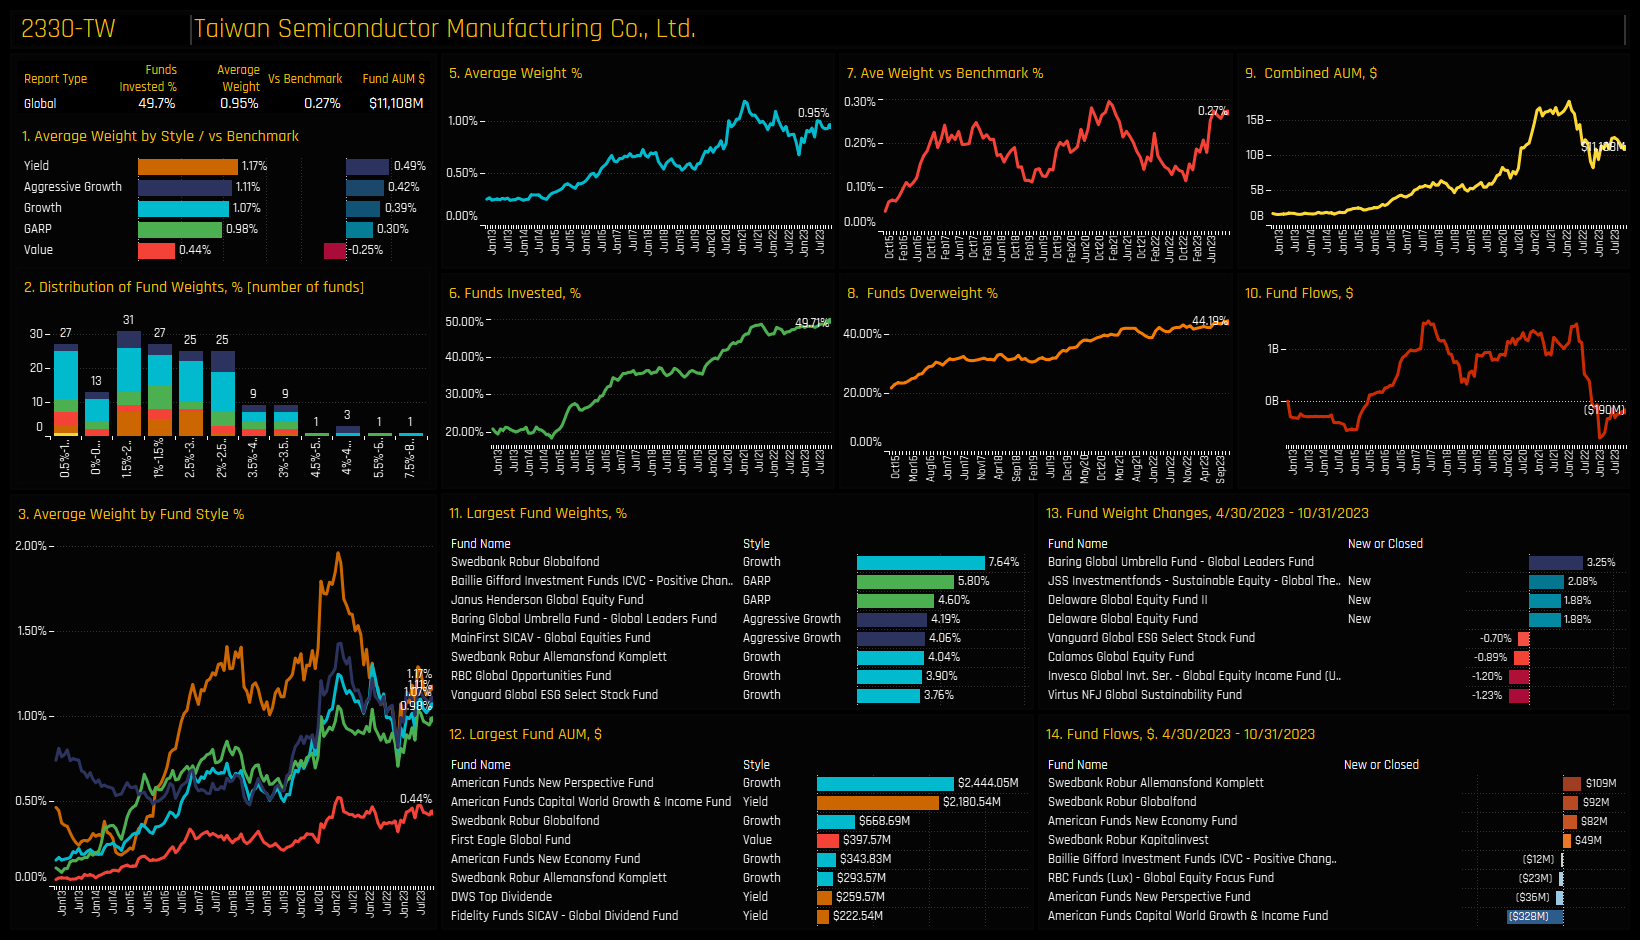
• TSMC is the dominant stock holding, with 49.8% of funds holding a position and has hit record ownership among Global funds.
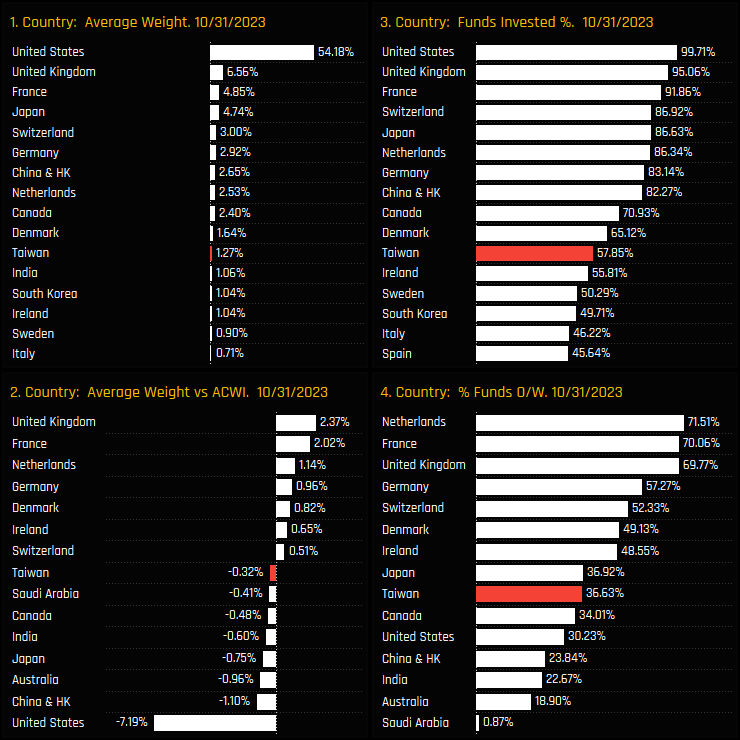
• Strong upside potential with Taiwan still a marginal allocation compared to country peers in the USA and Europe.
Time-Series and Country Rotation
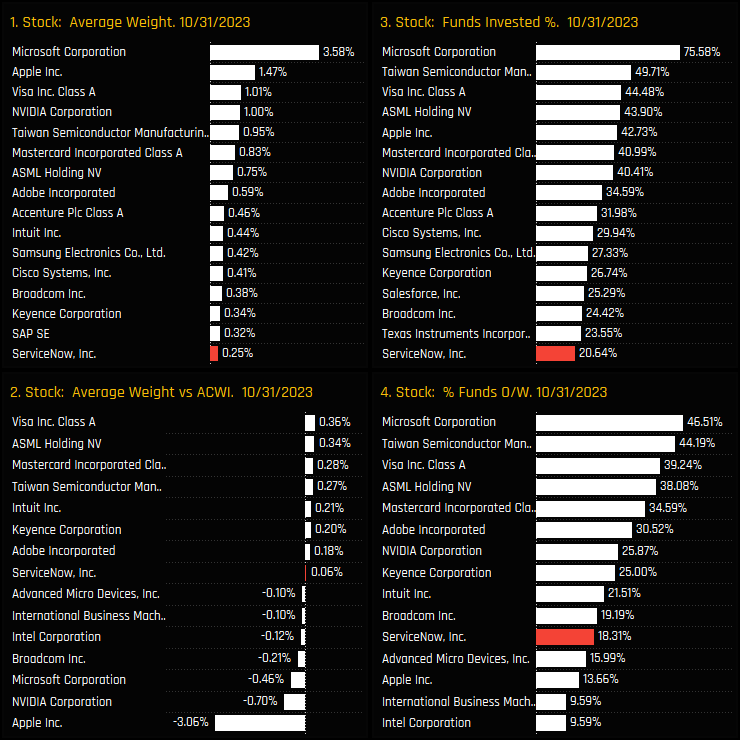
The percentage of Global equity funds with exposure to Taiwan has hit a record high of 57.85% (ch3). This latest move higher brings with it a commensurate increase in average holding weight to 1.27% from the lows of 0.95% back in late 2022 (ch1). Versus the iShares ACWI ETF benchmark, 36.6% of funds are positioned overweight (ch4) at an average underweight of -0.32% (ch2).
The last 6-months has seen Taiwan as a key beneficiary of country level rotation among managers. Taiwan captured the largest increase in the percentage of funds invested of +2.3%, heading a group of 4 Emerging Market countries to see ownership levels increase (ch3). In fact, all 4 of our ownership measures moved higher for Taiwan, highlighting the active nature of the move.
Country Positioning and Sentiment
These recent moves have cemented Taiwan as the 2nd largest Emerging Market allocation after China & HK, though it is still only the 11th largest globally. Which ever you frame it, Taiwan still is not an essential holding for Global managers, with all the major European countries and the USA held by more than 80% of managers.
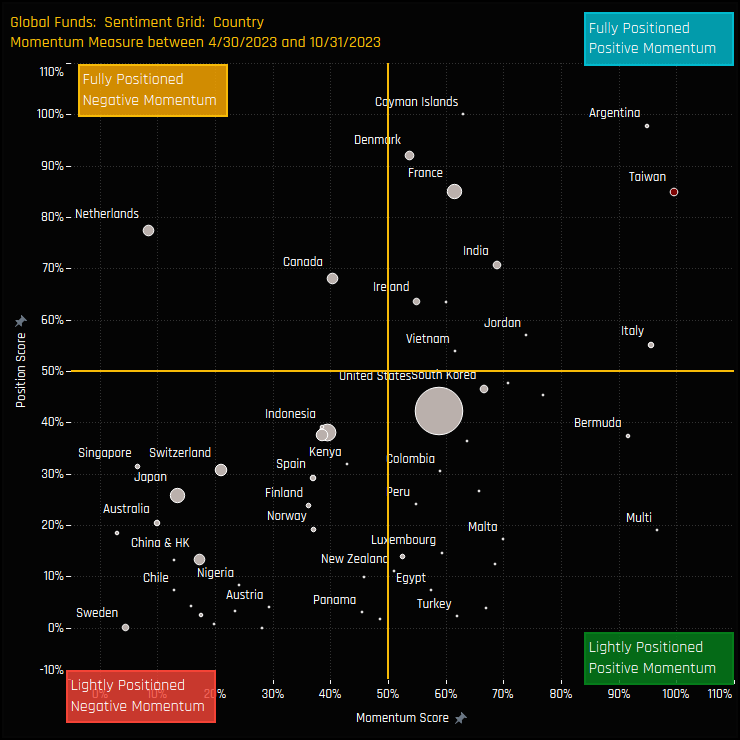
The Sentiment Grid below brings long-term positioning and short term manager activity together in a single chart. The Y-axis shows the ‘Position Score’, a measure of current positioning in each Country compared to its own history going back to 2011 on a scale of 0-100%. The X-Axis shows the ‘Momentum Score’, a measure of fund manager activity for each Country between 04/30/2023 and 10/31/2023 on a scale of 0% (maximum negative activity) to 100% (maximum positive activity). Taiwan’s position in the top-right quadrant highlights the near record positioning and strong rotation, and stands in contrast to the low positioning and negative momentum of China & HK.
Fund Activity & Latest Positioning
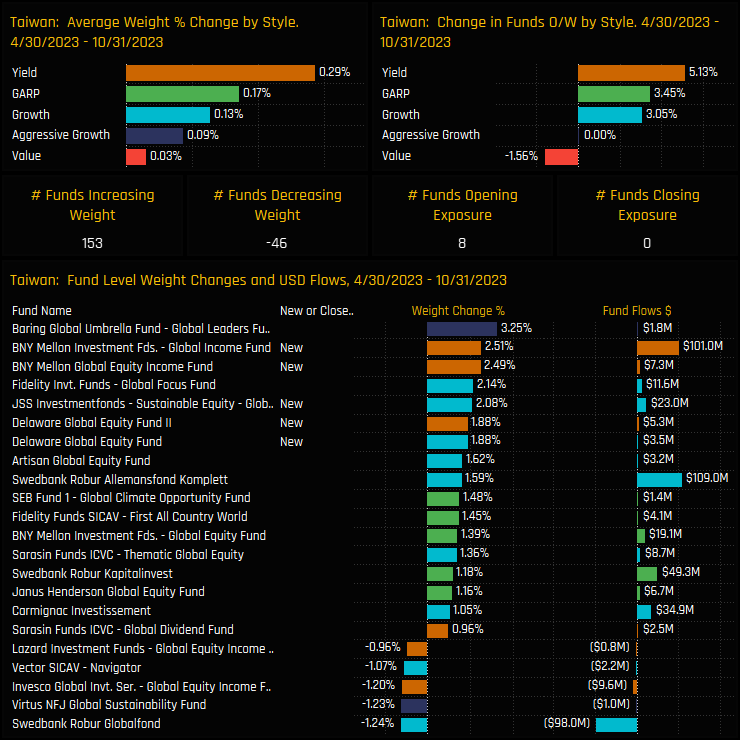
The fund level changes driving this allocation shift are highlighted in the bottom chart. Between 04/30/2023 and 10/31/2023, funds increasing Taiwanese weights outnumbered those decreasing by a factor of 3, with Baring Global Leaders (+3.25%) and BNY Mellon Global Income (+2.51%) top of the list. Split by Style, Yield funds led the increases with a further +5.13% of Yield funds adding exposure to Taiwan over the period, with average weights climbing by +0.29%.
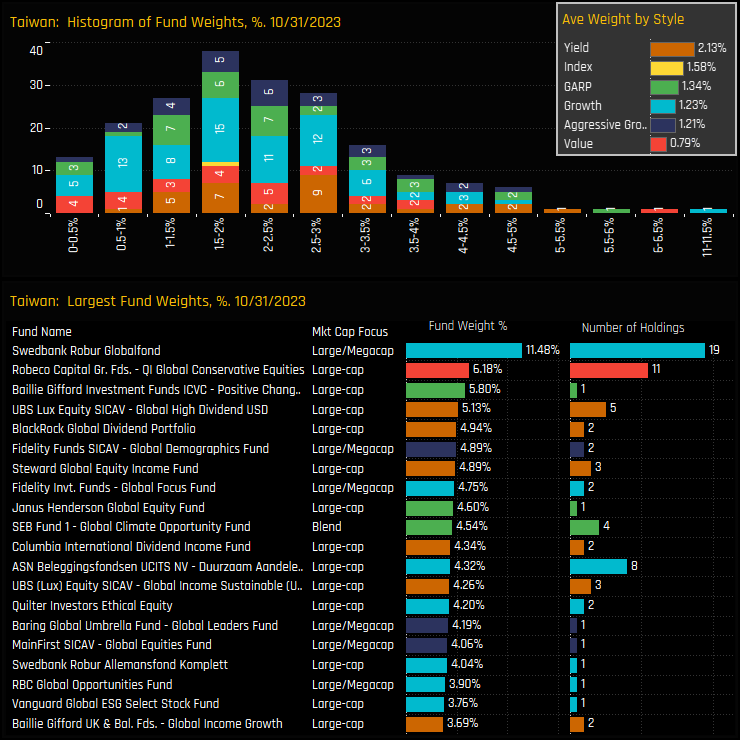
Indeed, the current snap of Global fund level positioning in Taiwan shows Yield funds as the top allocators on 2.13% and the only Style group to be overweight the benchmark. The distribution of Taiwanese fund weights are centered between the 1%-2.5% level, but with a longer tail to the upside. Top holders in the bottom chart are occupied by funds across the Style spectrum, and led by Swedbank Robur Globalfond (11.5%) and Robeco Global Conservative Equities (6.2%)
Stock Holdings & Activity
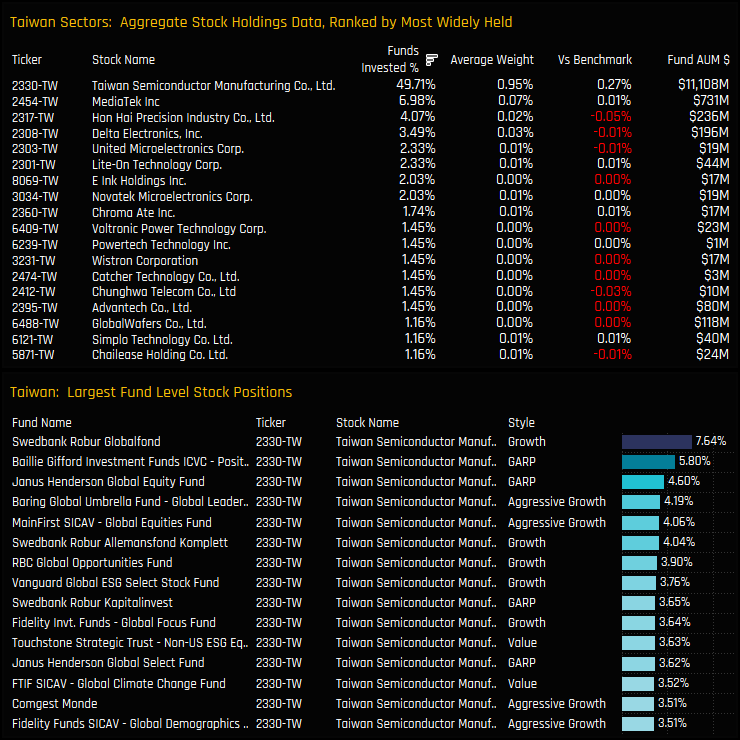
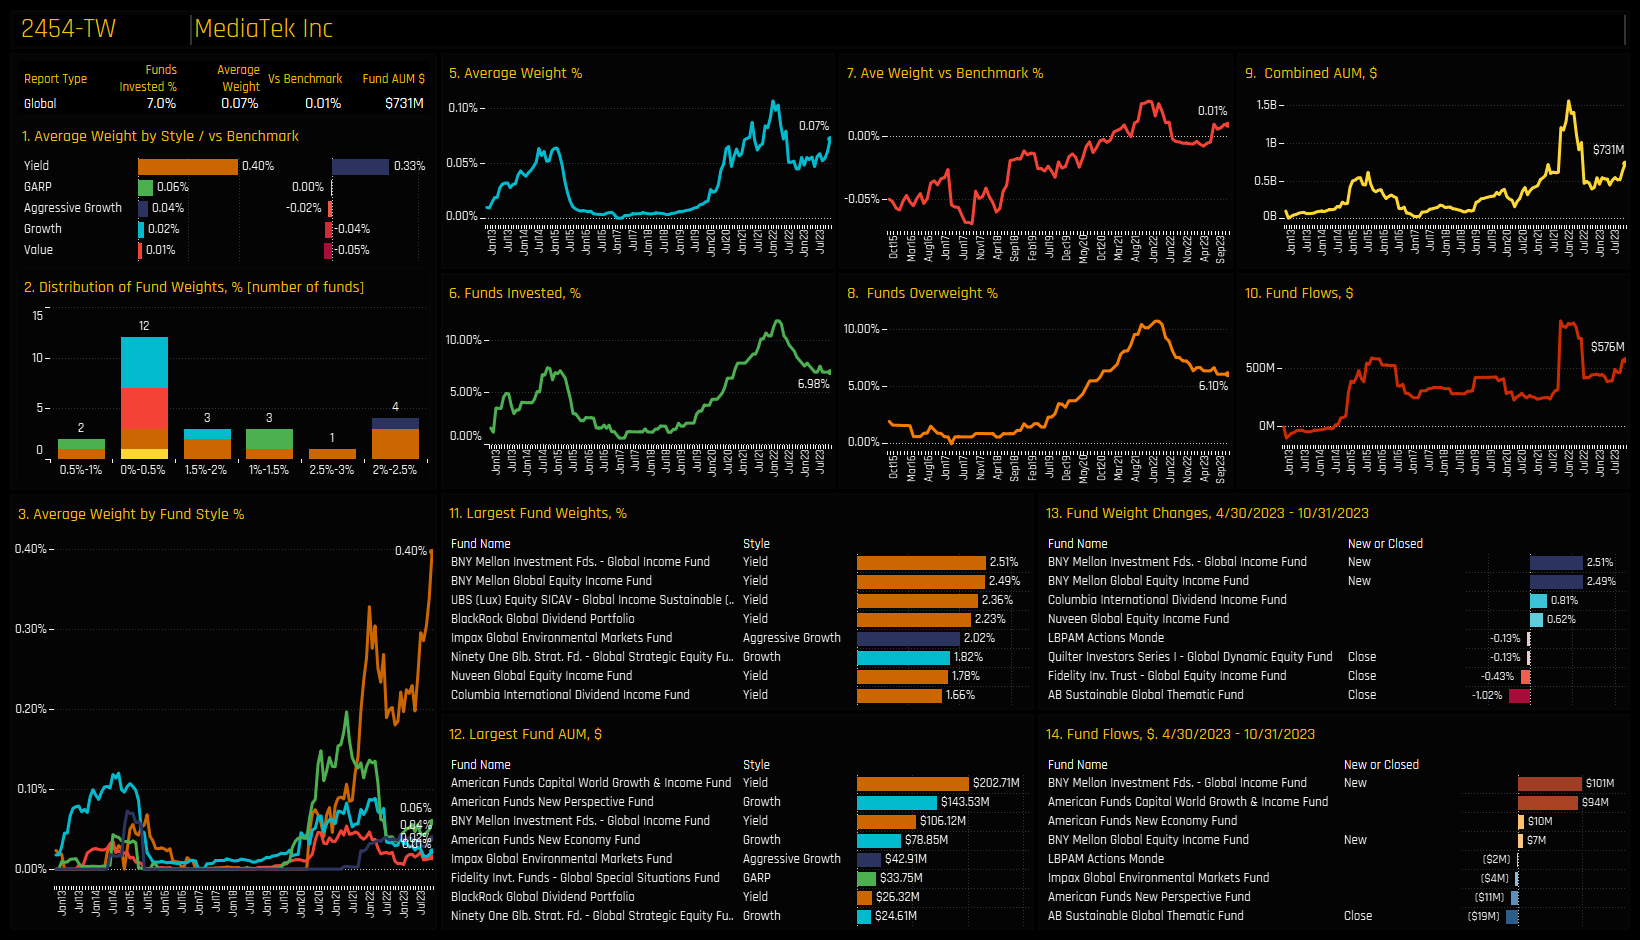
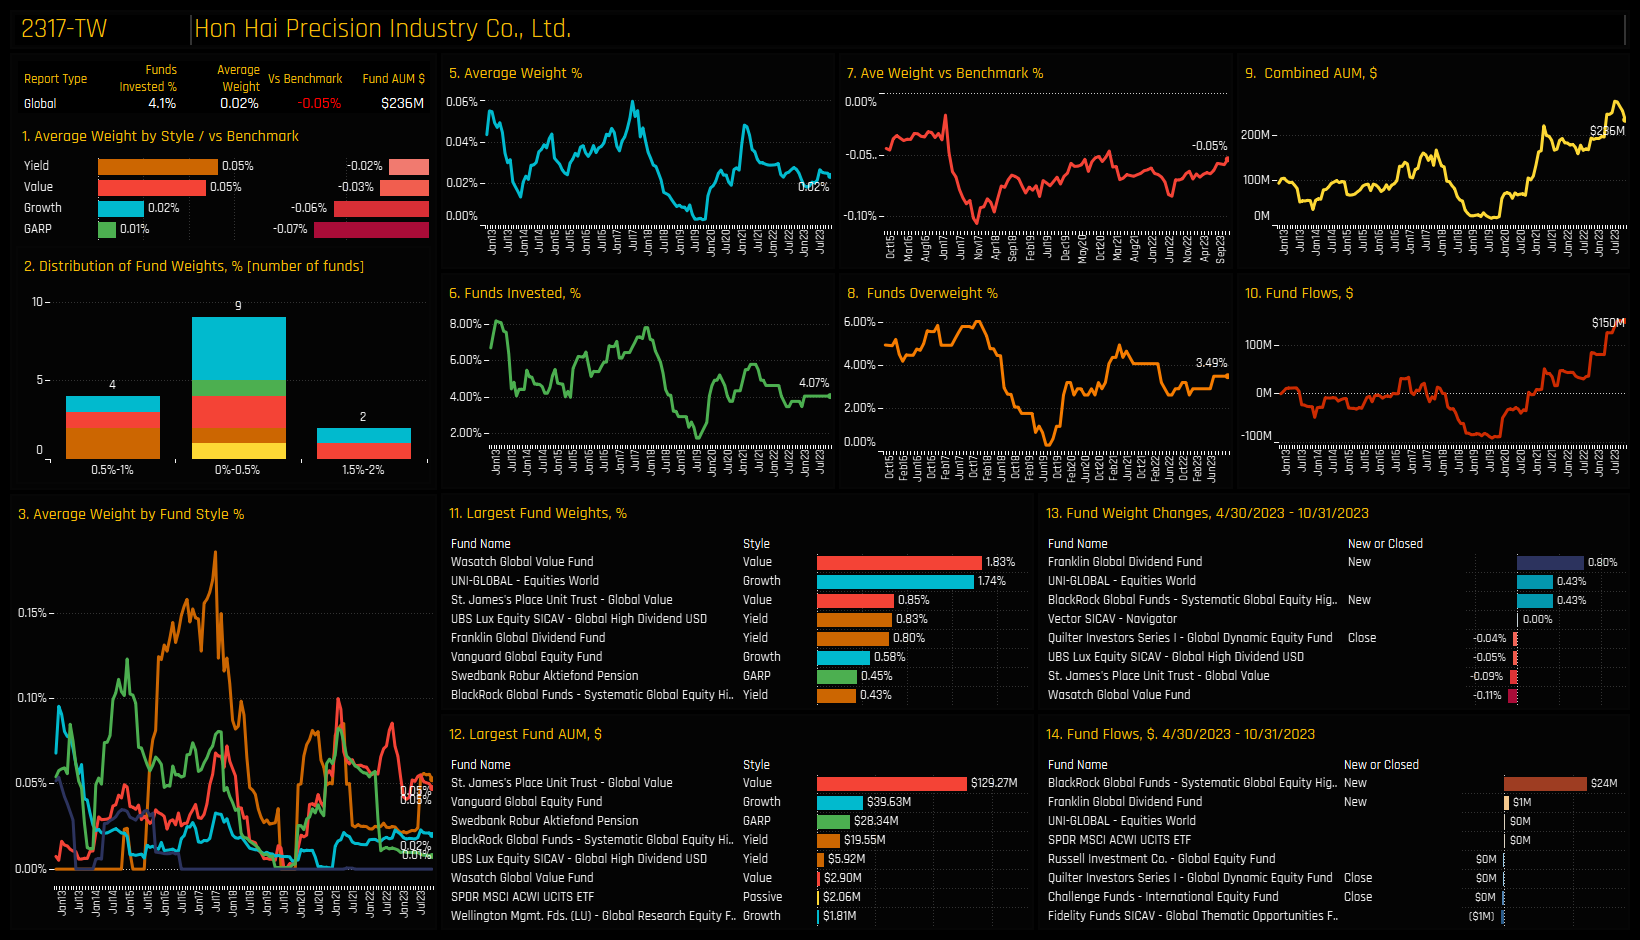
The most widely held companies in Taiwan are displayed in the top chart below. It highlights the complete dominance of TSMC, now held by a record 49.7% of Global funds at an average weight of 0.95%, or 75% of the total Taiwan allocation. MediaTek Inc and Hon Hai Precision form a kind of 2nd tier but both are held by only a small number of funds. The bottom chart shows the largest stock level fund holdings in Taiwan, and once again is dominated by large positions in TSMC.
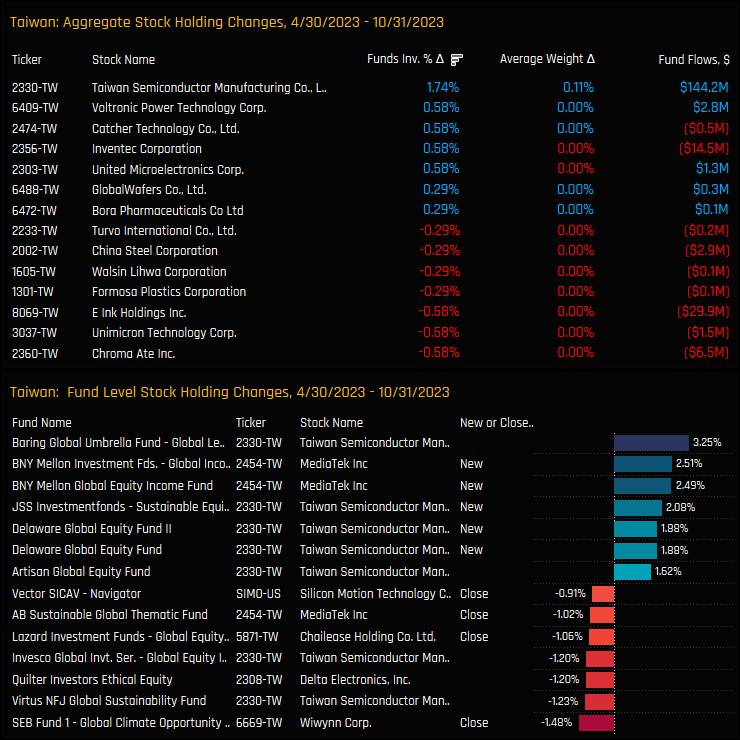
The stocks underpinning the rise in Taiwanese investment are highlighted in the charts below. Ownership increases were led by TSMC, with the percentage of funds invested moving higher by +1.74% and average weights by +0.11%. Outside of TSMC, smaller increases in ownership were seen in Voltronic Power Technology, Cather Technology and Inventec Corporation, whilst Chroma Ate Inc and Unimocron Technology Corp led the modest declines.
Conclusions and Data Report
The chart opposite shows the percentage of Global funds invested in Taiwan, split by the Style of the fund. Whilst it’s common to think of Taiwan’s tech-heavy stock market as a beacon for high growth, for the Global funds in our analysis the real attraction is for dividends. The chart clearly shows a significant ownership gap between Global Yield funds and the chasing pack, with Value funds notable in their lighter levels of ownership.
But that’s not to say that Taiwan doesn’t hold an attraction across the Style spectrum. The chart also shows that both Growth, GARP and Aggressive Growth funds are close to their maximum levels of investment.
But whilst we have record levels of exposure in terms of Taiwan’s own history, it still lags behind its counterparts in the USA and Europe. Perhaps the recent move higher represents a changing attitude and willingness among managers to include Taiwan as part of their investment mix.
Please click the link below for an extended data report on Taiwan. Scroll down for stock profiles on TSMC, MediaTek and Hon Hai Precision.
• Global Fund exposure in ServiceNow, Inc. hits all-time high with 20.6% of funds invested. Funds move to overweight.
• Positive rotation across all metrics driven by Growth and Aggressive Growth managers.
• Positioning relative to technology sector peers suggests room for even broader market penetration.
Time-Series & Technology Stock Rotation
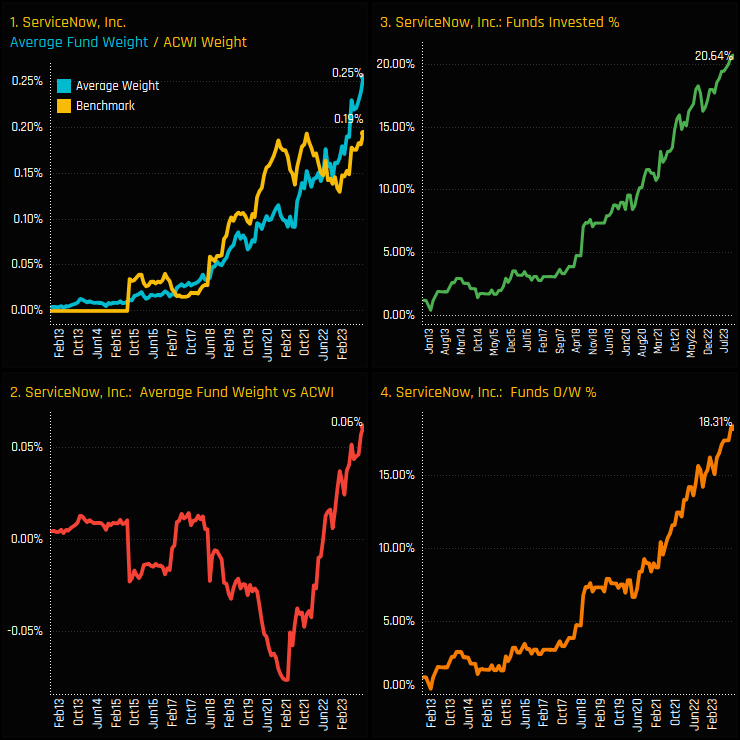
Global Fund exposure in ServiceNow, Inc. has reached new highs. The percentage of Global funds invested in ServiceNow, Inc. stands at a record 20.6% (ch3) after seeing an almost linear growth in investment over the past decade. This has pushed average holding weights to 0.25%, breaking away from the iShares MSCI ACWI index in recent months to place active managers at record overweights of +0.06% (ch1&2).
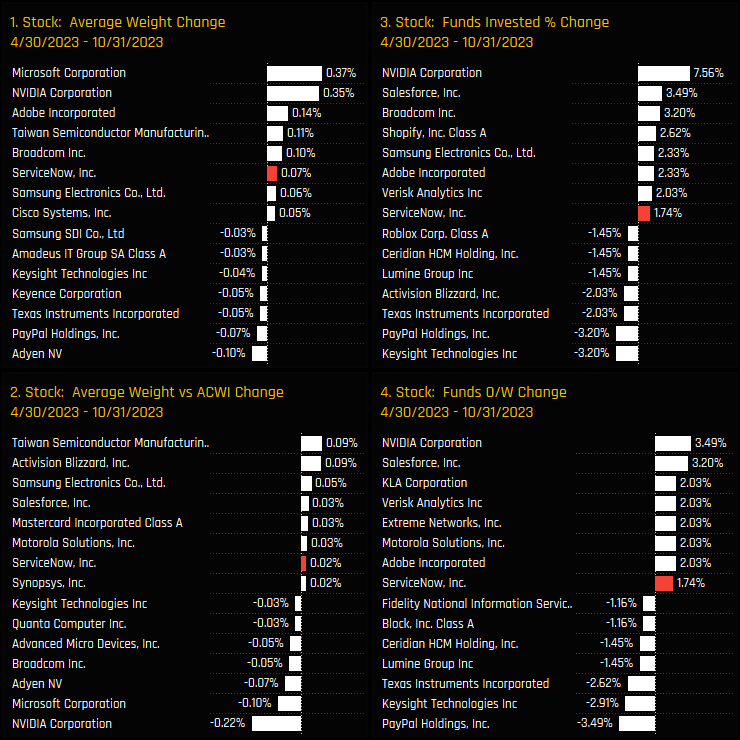
The below charts show the changes in our fund ownership metrics for stocks in the Information Technology sector between 04/30/2023 and 10/31/2023. Whilst the larger moves were taken by industry heavyweights such as NVIDIA Corp and Salesforce, nevertheless, ServiceNow, Inc. saw all 4 measures of ownership move higher. Sentiment towards the stock has never been higher.
Fund Activity & Latest Holdings
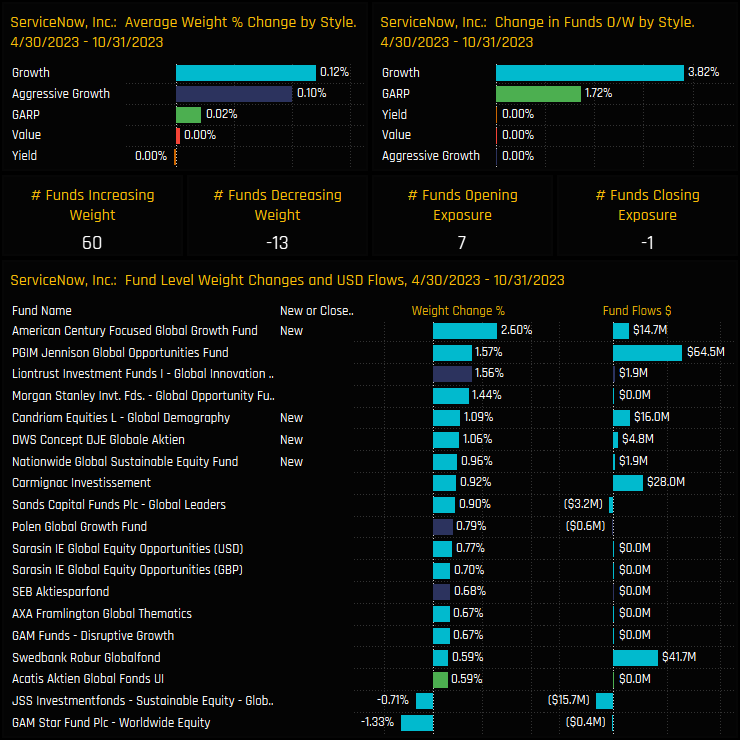
The fund level activity behind these moves shows an heavily one-sided picture. A total of 60 funds increased weights in ServiceNow, Inc. compared to 13 decreasing, whilst 7 opened new positions versus 1 closing. Growth and Aggressive Growth funds were the main buyers, led by new positions from American Century Global Growth (+2.6%) and increases in weight from PGIM Jennison Global Opportunities (+1.57%) and Liontrust Global Innovation (+1.56%).
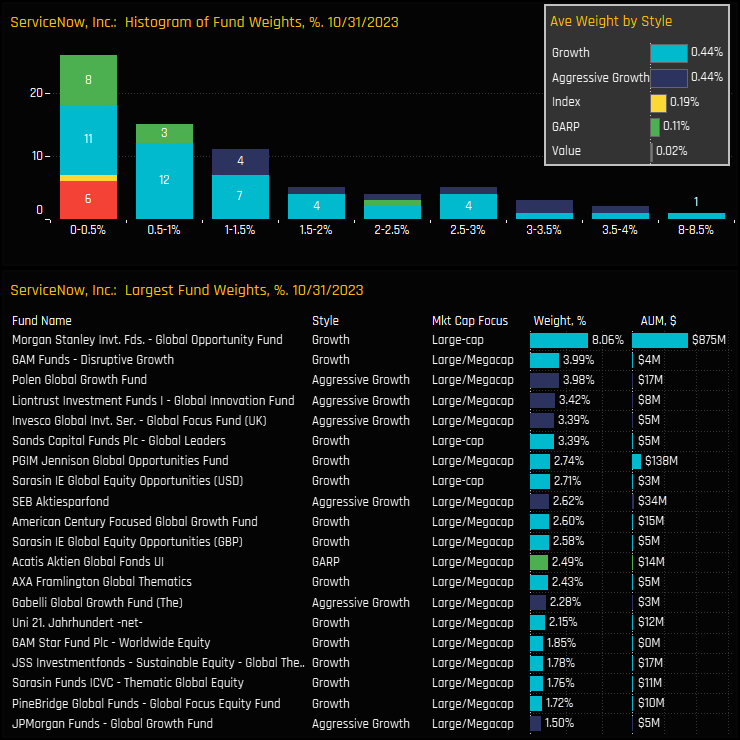
Indeed, the current investor base is dominated by Growth and Aggressive Growth strategies, with just 6 Value funds and 12 GARP funds allocating small weights to the stock. The most bullish funds are allocating >2% weights in ServiceNow, Inc., but far out in front is the Morgan Stanley Global Opportunity Fund with a considerable 8.06% weight and total $875m investment.
Conclusions & Data Report
The adjacent charts display the latest ownership statistics for Information Technology sector stocks. When compared to its peers within the sector, ServiceNow, Inc. remains relatively underrepresented, ranking as the 20th most widely held stock despite its recent popularity gains.
So in conclusion, ServiceNow, Inc. has reached new heights in fund ownership, reflecting real strength in the investment case from selected managers. However, its position relative to technology sector peers suggests there is room for even broader market penetration.
Click below for a detailed positioning report on ServiceNow, Inc.
• Investment levels vary significantly across the Global investible universe, with some stocks being widely held while others are scarcely owned, and these ownership levels fluctuate monthly.
• Our analysis synthesizes current and historical data on fund positioning with recent manager activity to accurately assess sentiment for each stock within our Global coverage.
• We spotlight eight stocks that not only sit at the extreme ends of their historical positioning but have also experienced notable shifts in fund ownership in recent months.
The Sentiment Grid
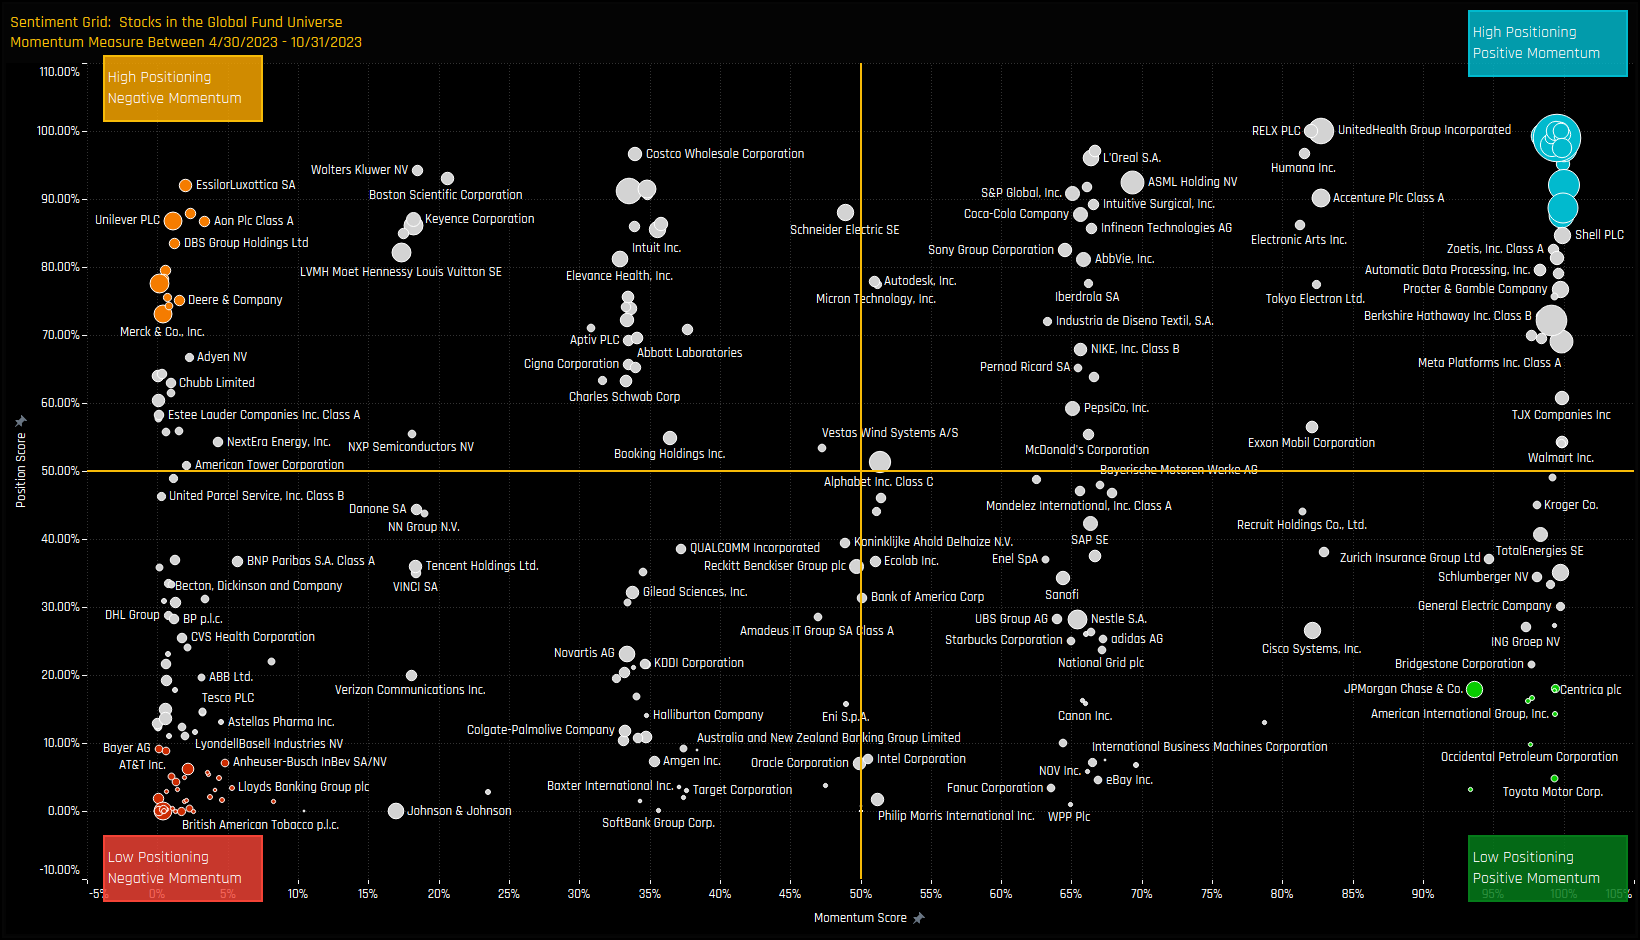
The Sentiment Grid below is designed to visualize the interplay between current fund positioning, long-term fund positioning and shorter-term fund manager activity for all stocks in the Global active fund universe. The Y-axis shows the ‘Position Score’, a measure of current positioning in each stock compared to its own history going back to 2012 on a scale of 0-100%. It takes in to account the percentage of funds invested in each stock versus history, the average fund weight versus history and the percentage of funds overweight the benchmark versus history. The higher the number, the more heavily a stock is owned by active Global managers compared to its own history.
The X-Axis shows the ‘Momentum Score’, a measure of fund manager activity for each stock between 04/30/2022 and 10/31/2023 on a scale of 0% (maximum negative activity) to 100% (maximum positive activity). The Momentum Score takes in to account the change in the percentage of funds invested in each stock over the period, the change in average weight and the change in the percentage of funds overweight. The chart also highlights the companies at the extreme ends of each quadrant by colour, which will shall explore in more detail below.
Extreme Stocks
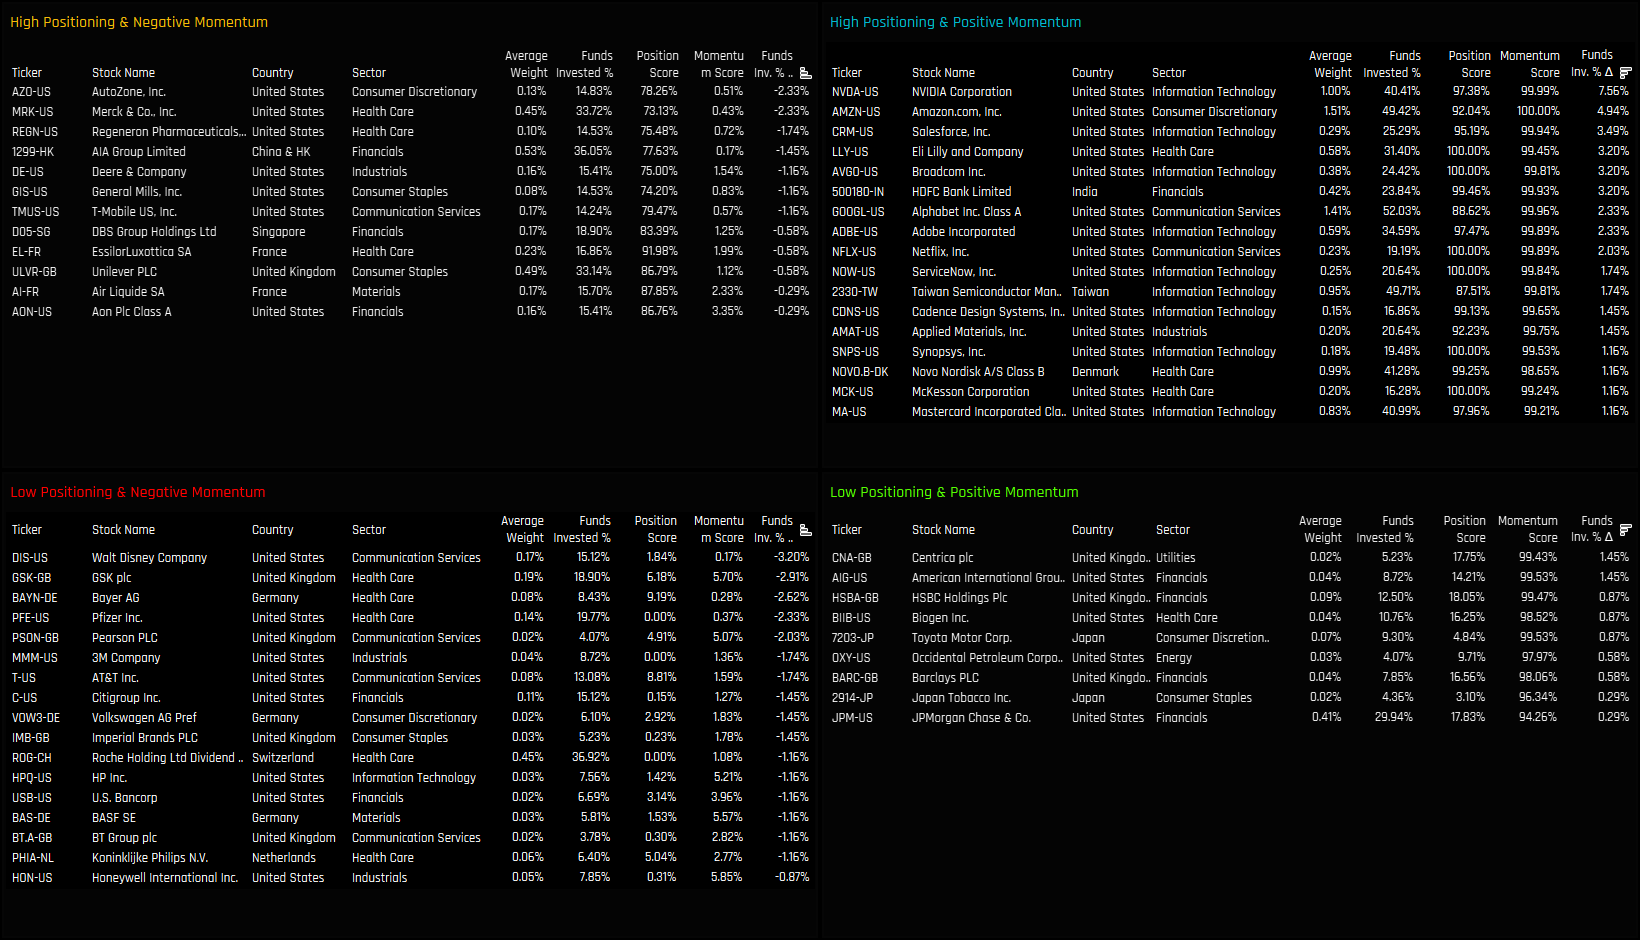
The tables below list the stocks in the extreme corners of each quadrant. The screening methodology is as follows:
High Positioning & Negative Momentum: Position Score > 70%. Momentum Score < 5%
High Positioning & Positive Momentum: Position Score > 95%. Momentum Score > 95%
Extreme Stocks
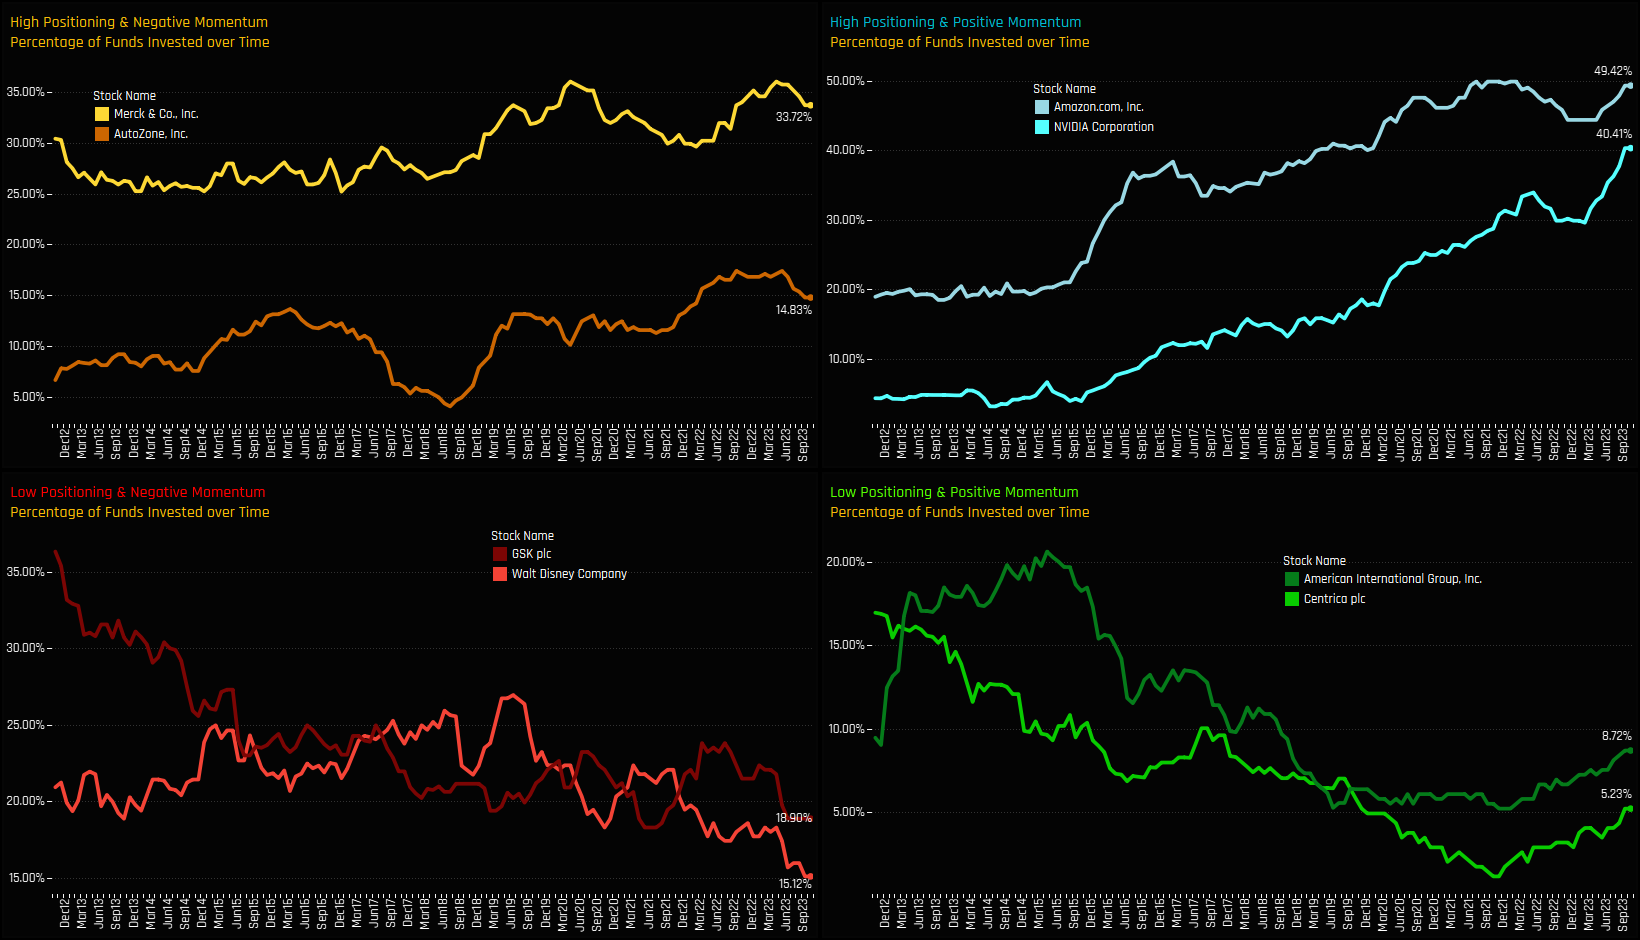
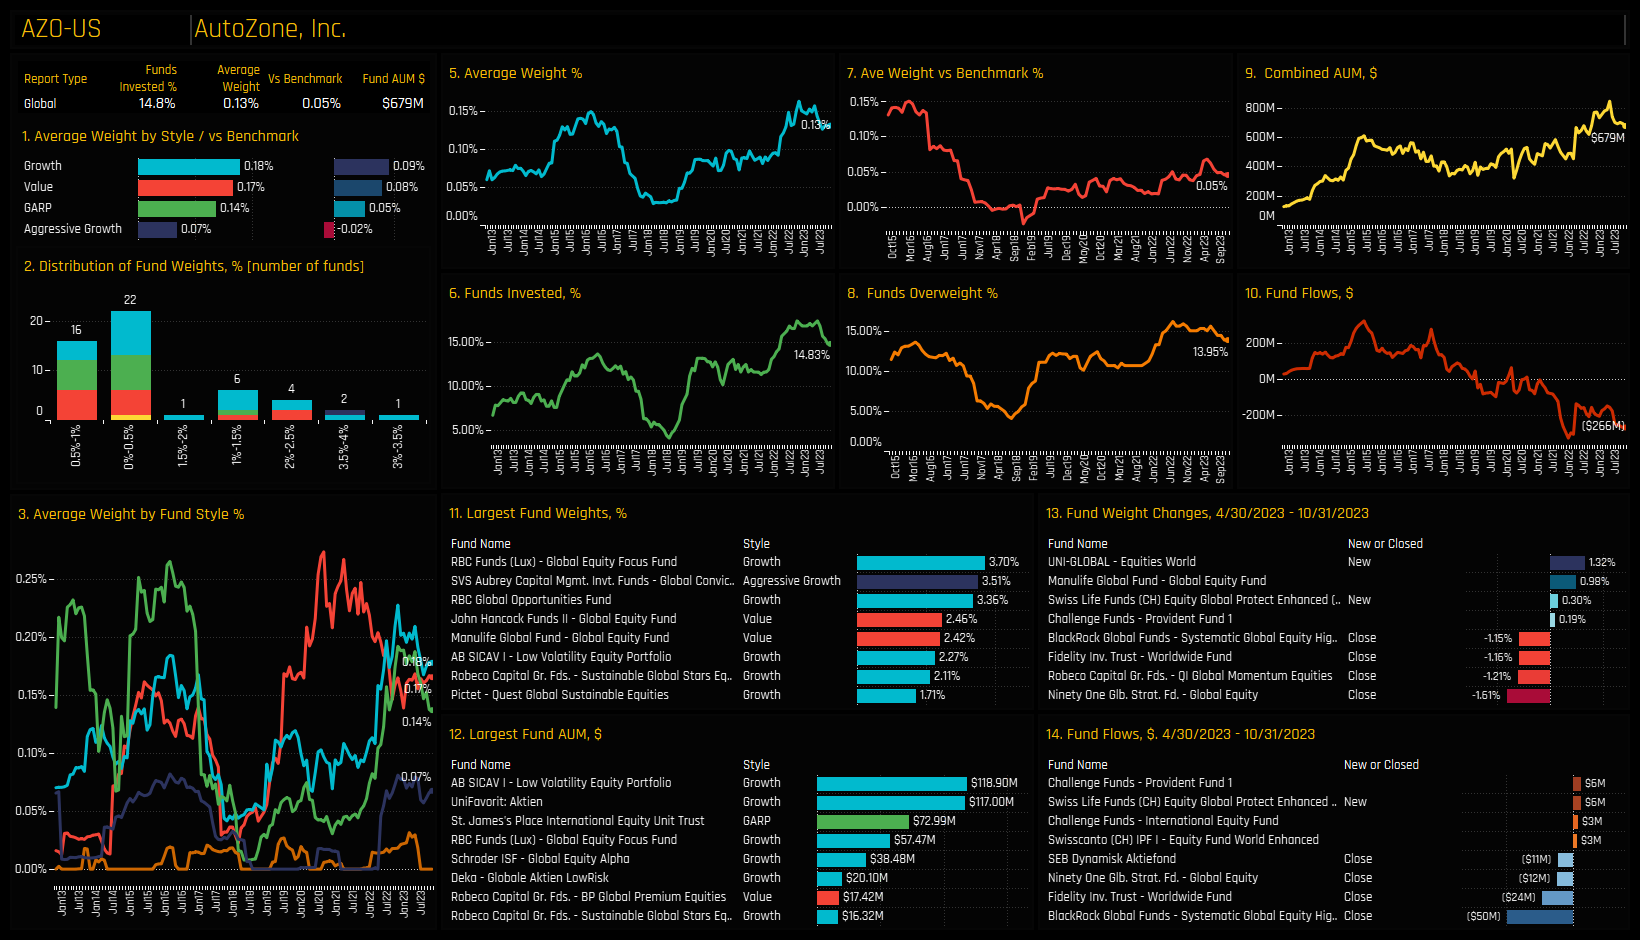
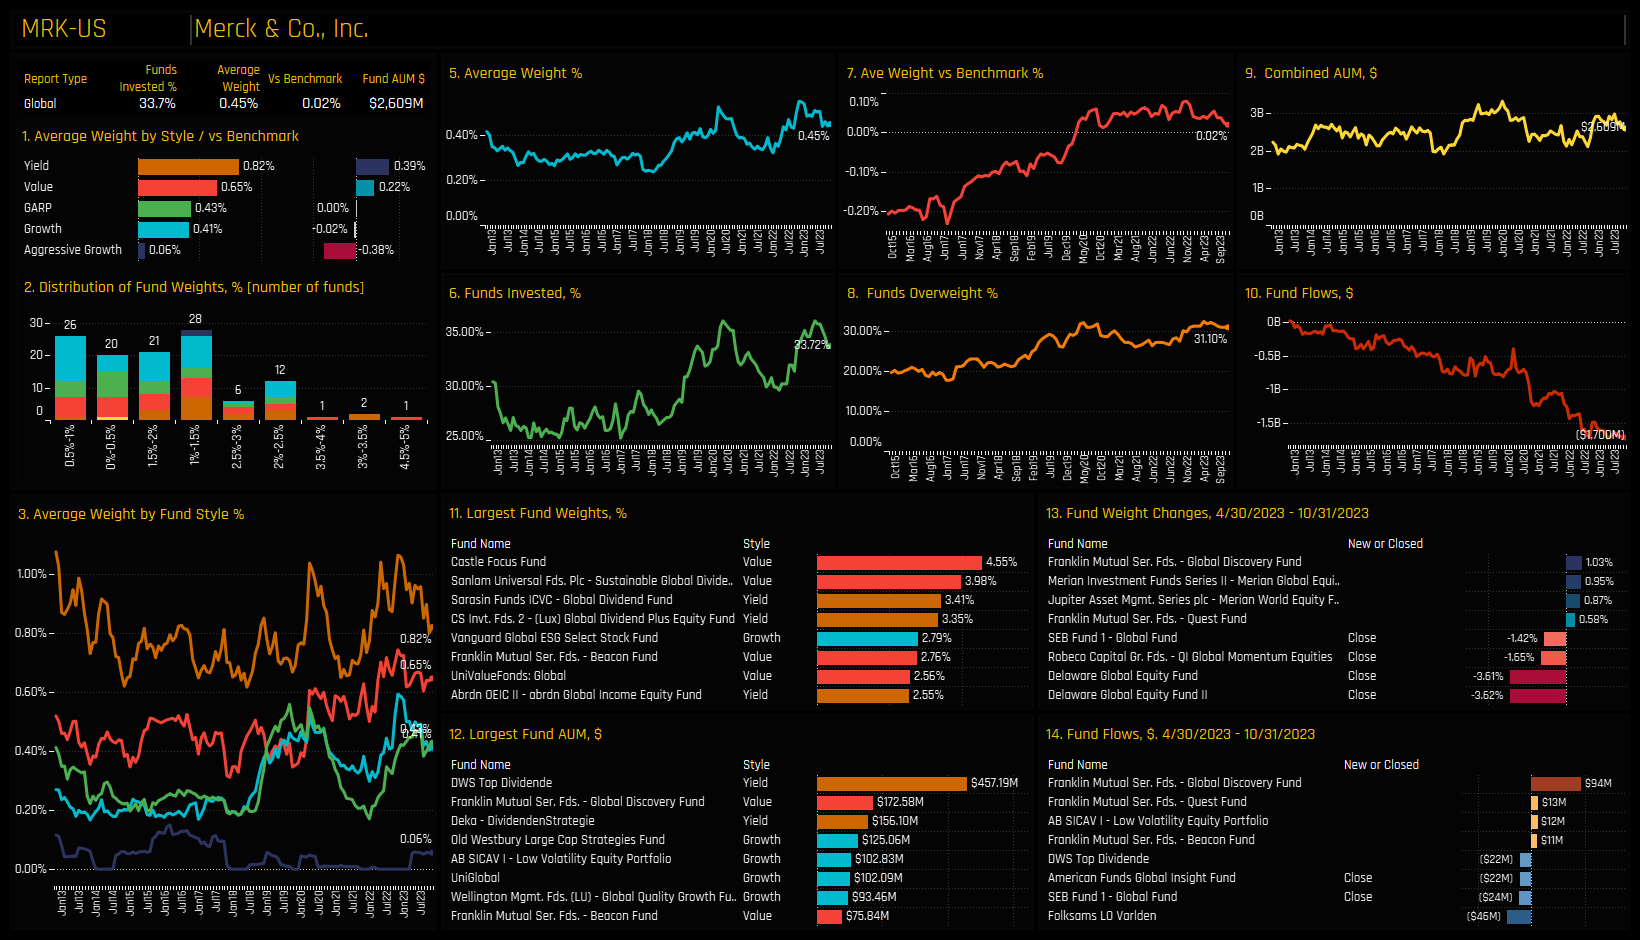
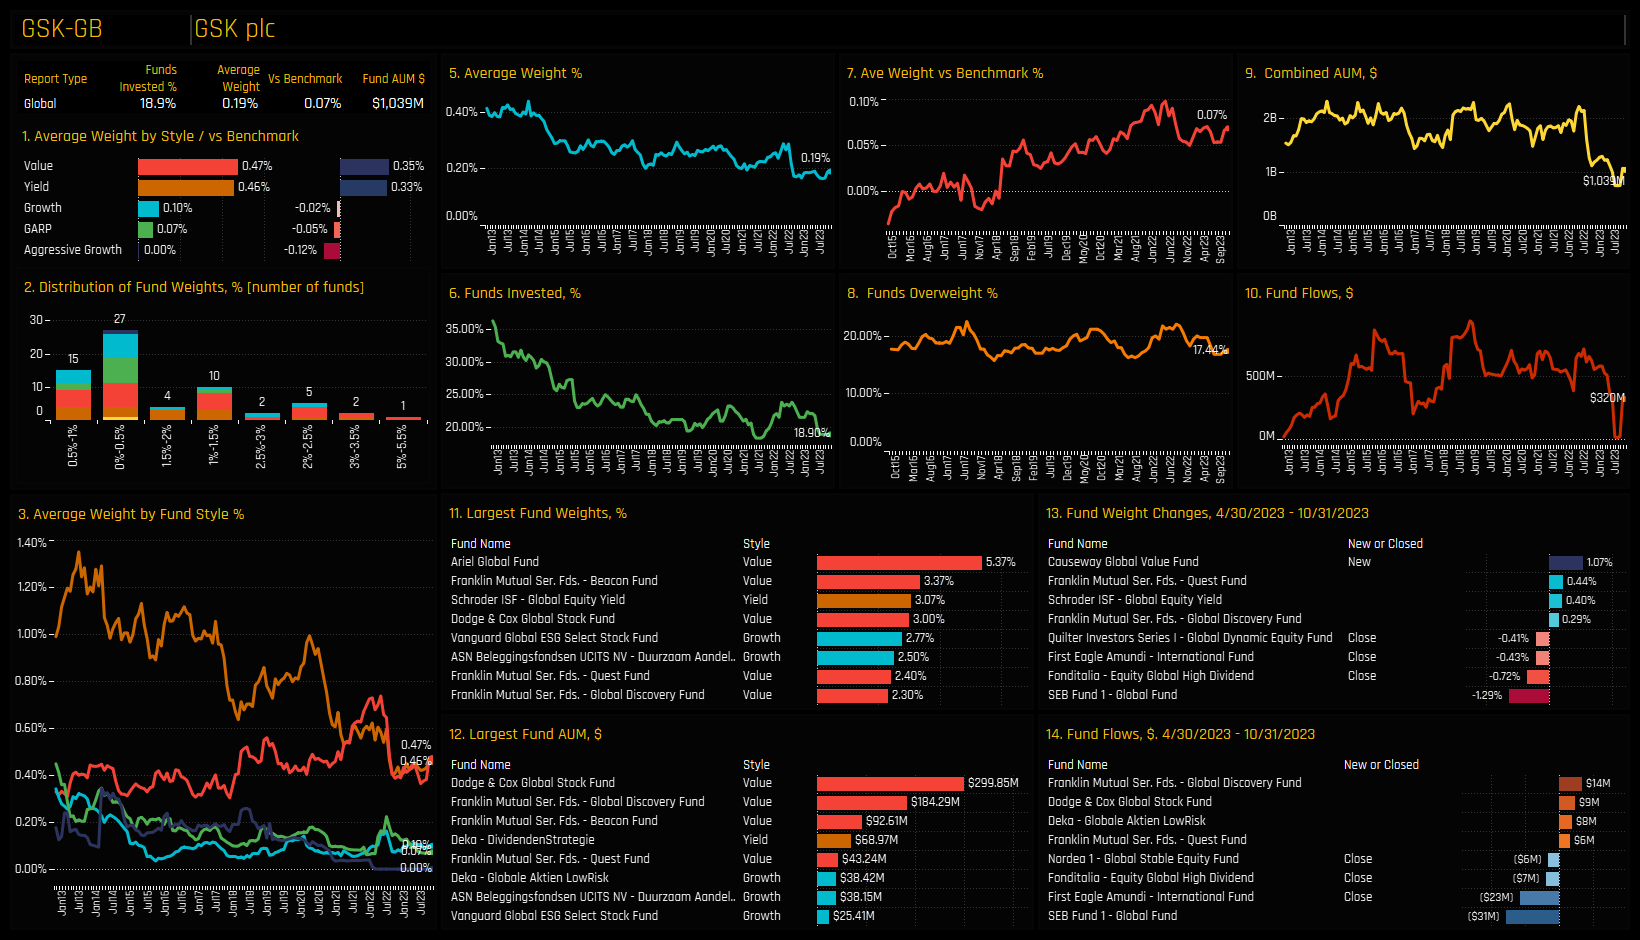
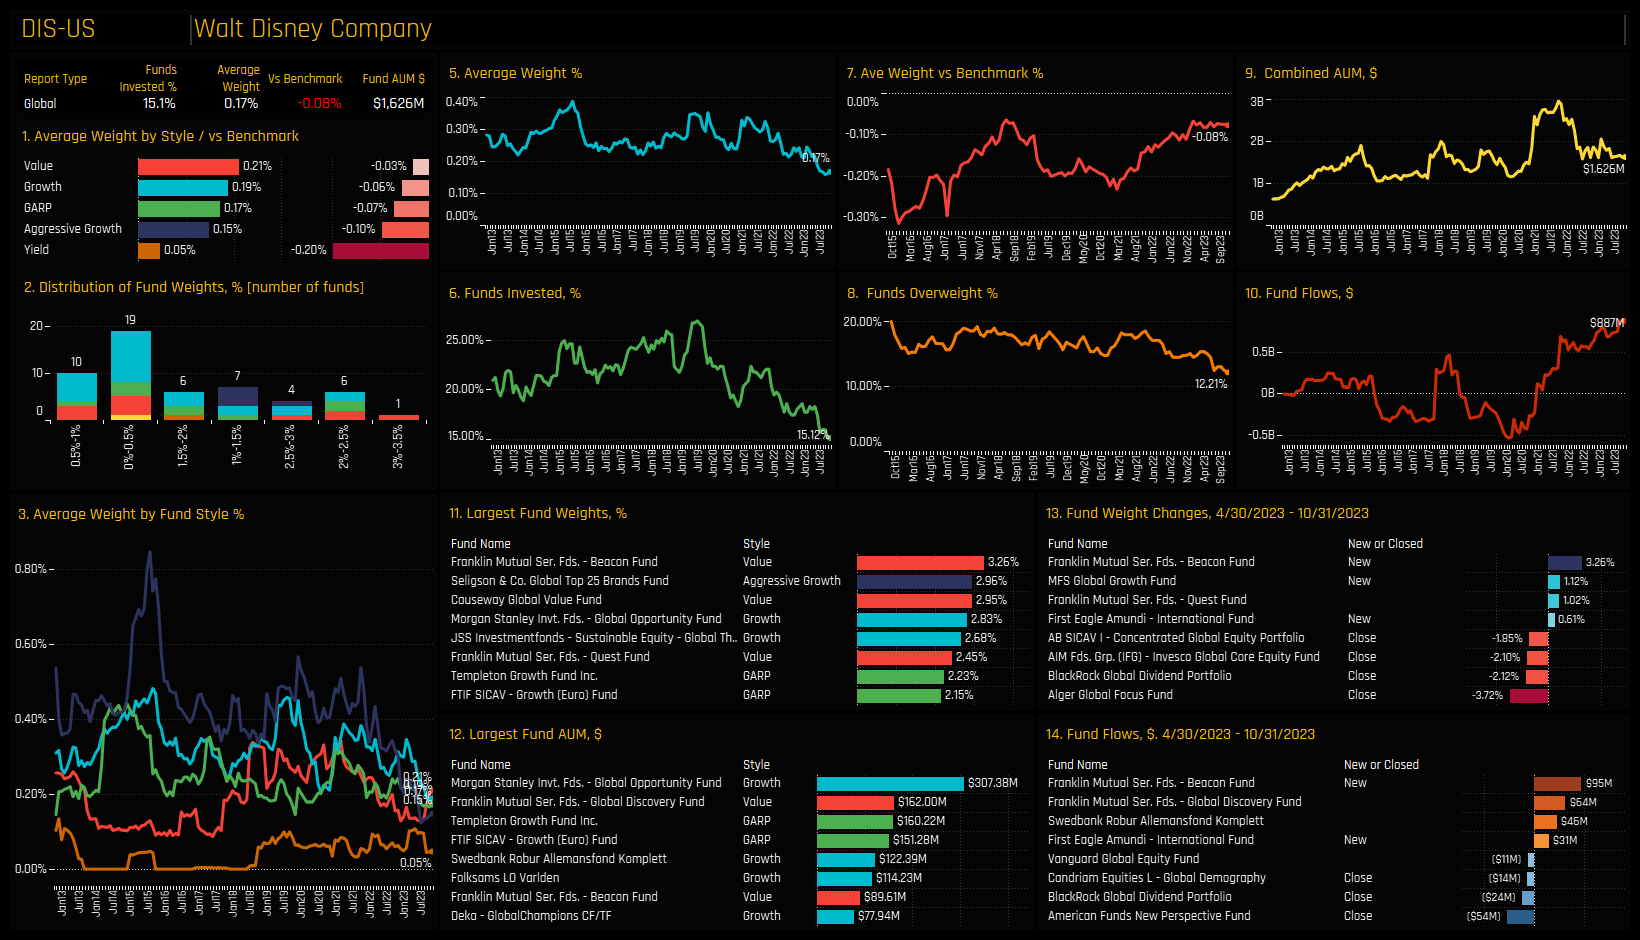
The charts below track the percentage of active funds invested in each of the top 2 stocks across the 4 categories. For example, the top-left chart highlights Merck & Co and AutoZone at the higher end of their ownership ranges, but falling from their peak levels more recently. In the bottom-left chart, GSK and Walt Disney have witnessed consistent ownership declines over the last decade, with today’s exposure near the lowest on record.
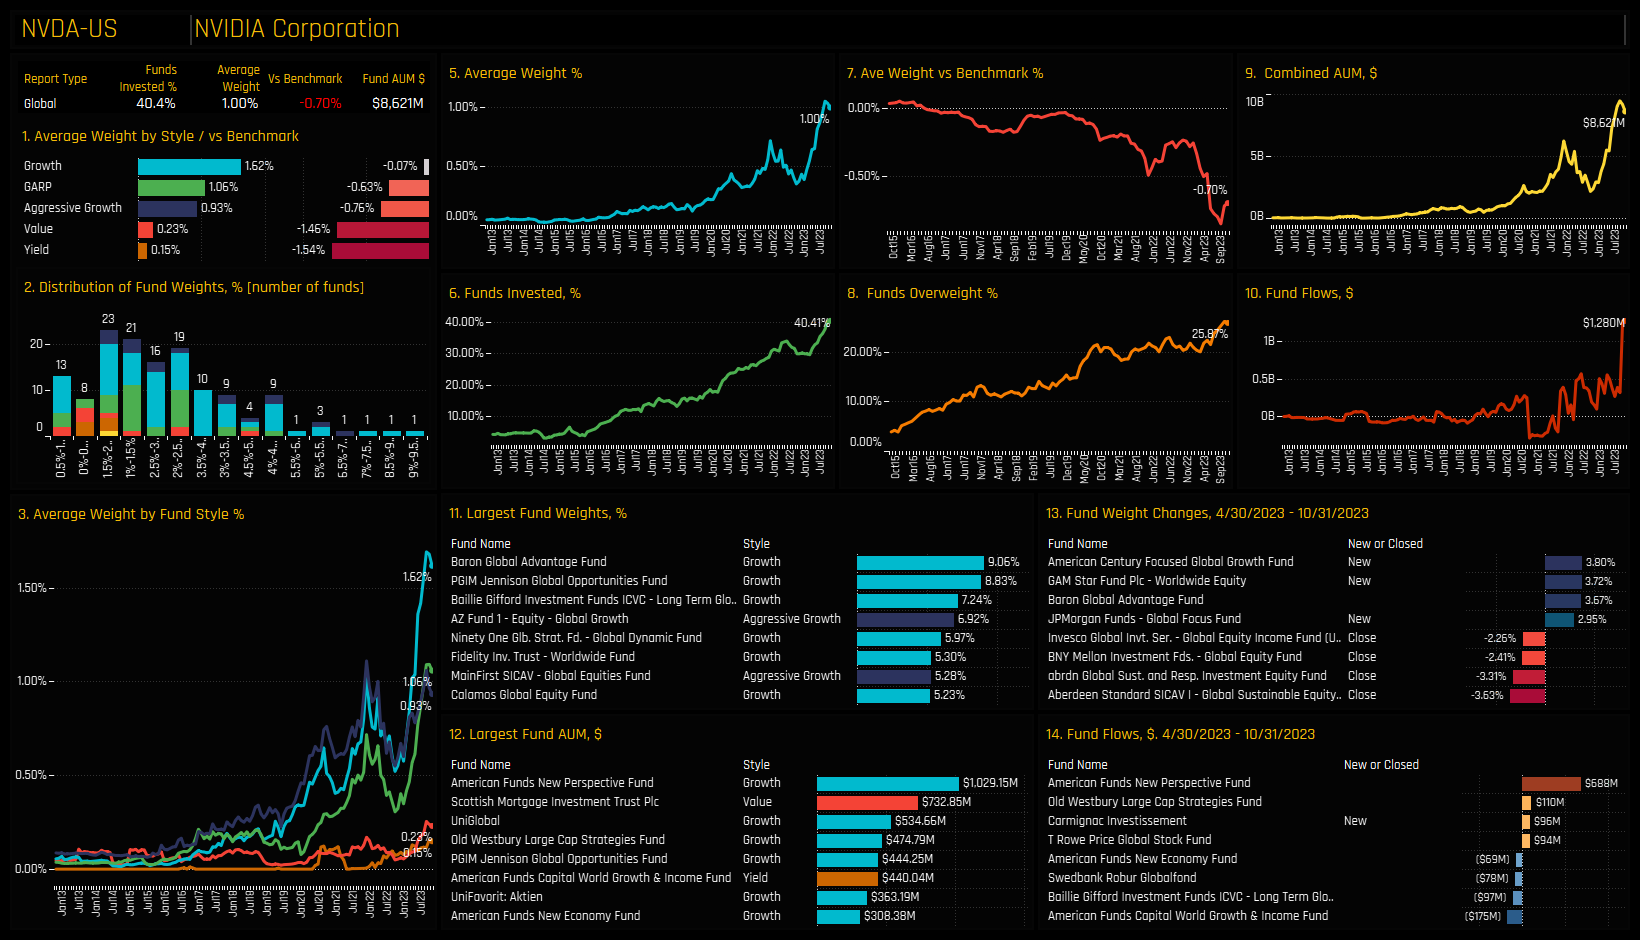
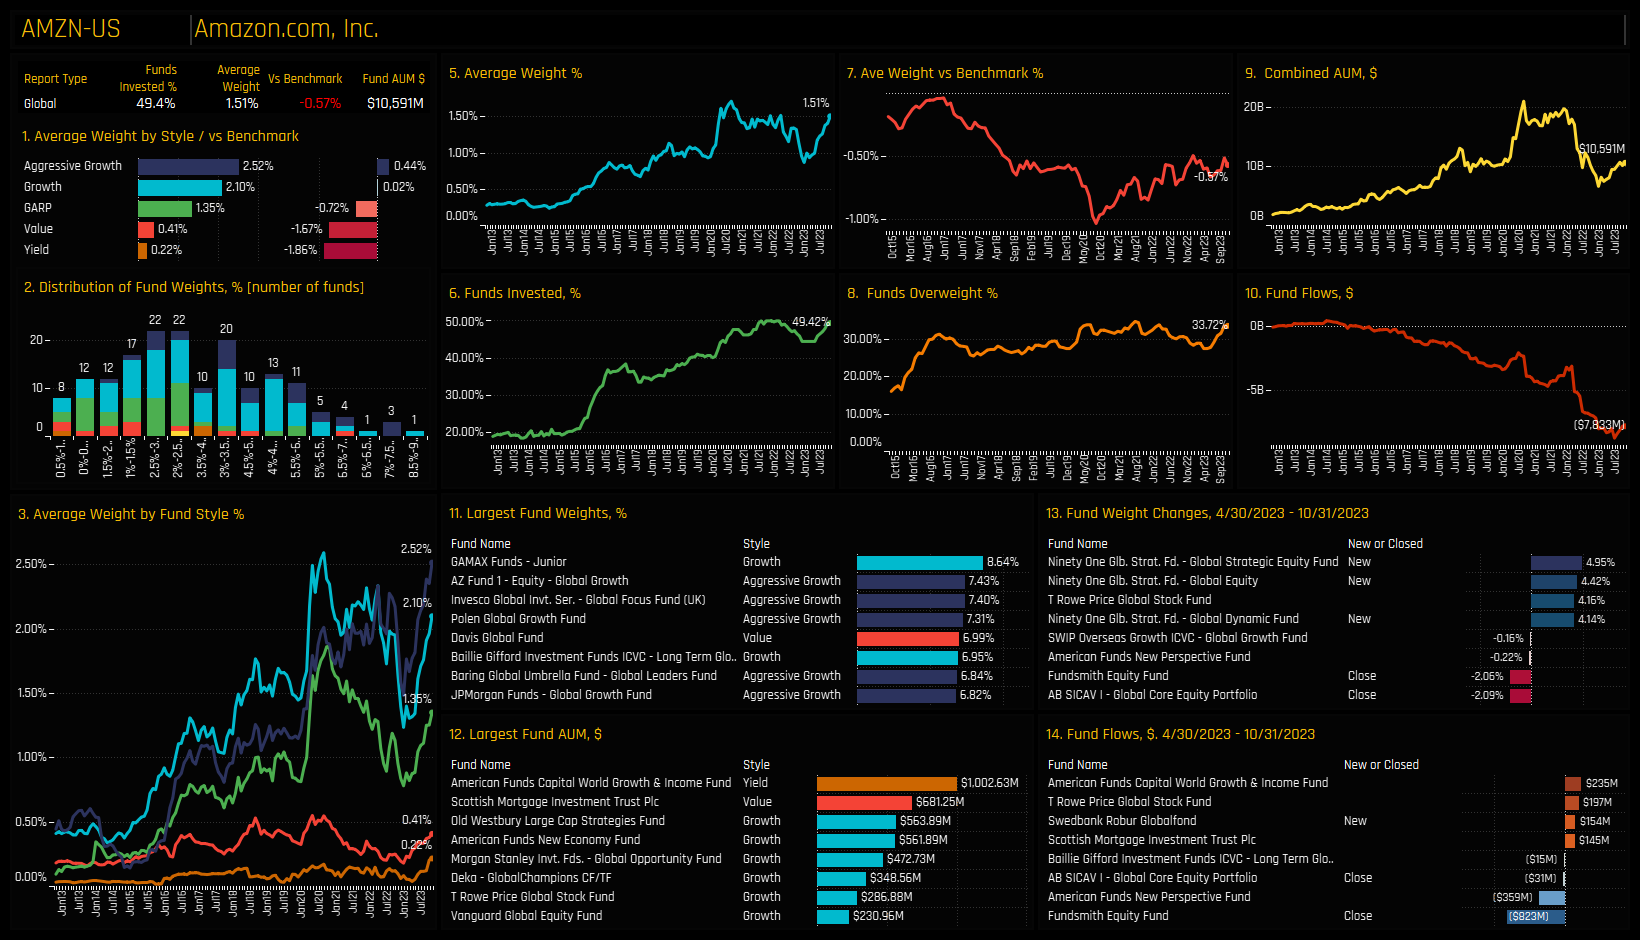
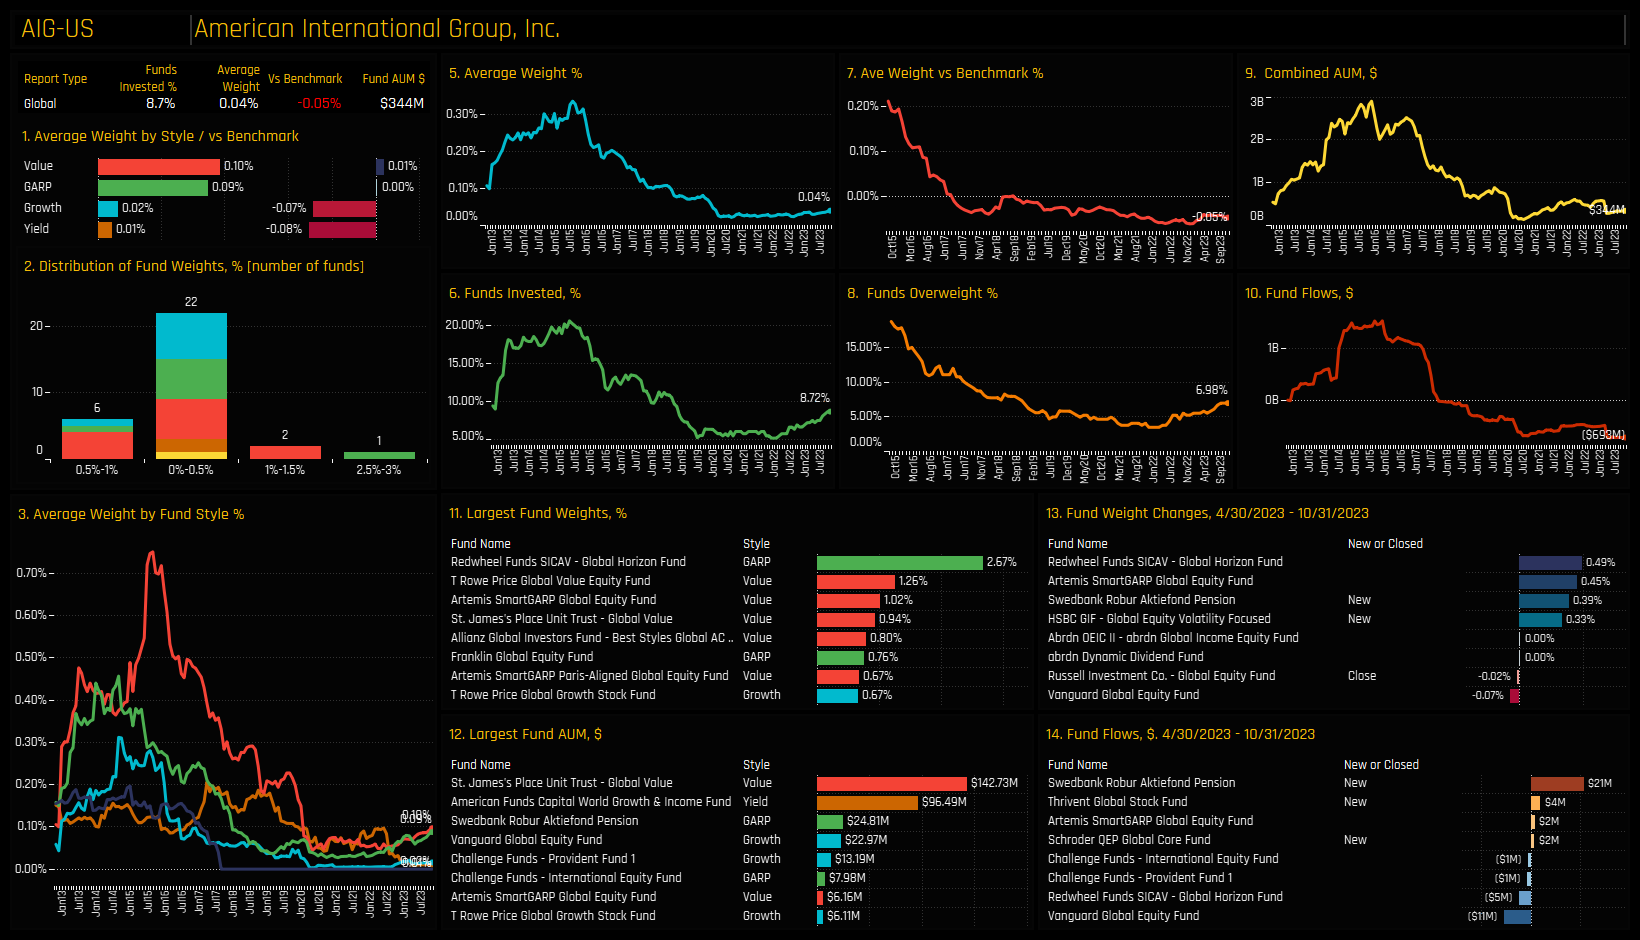
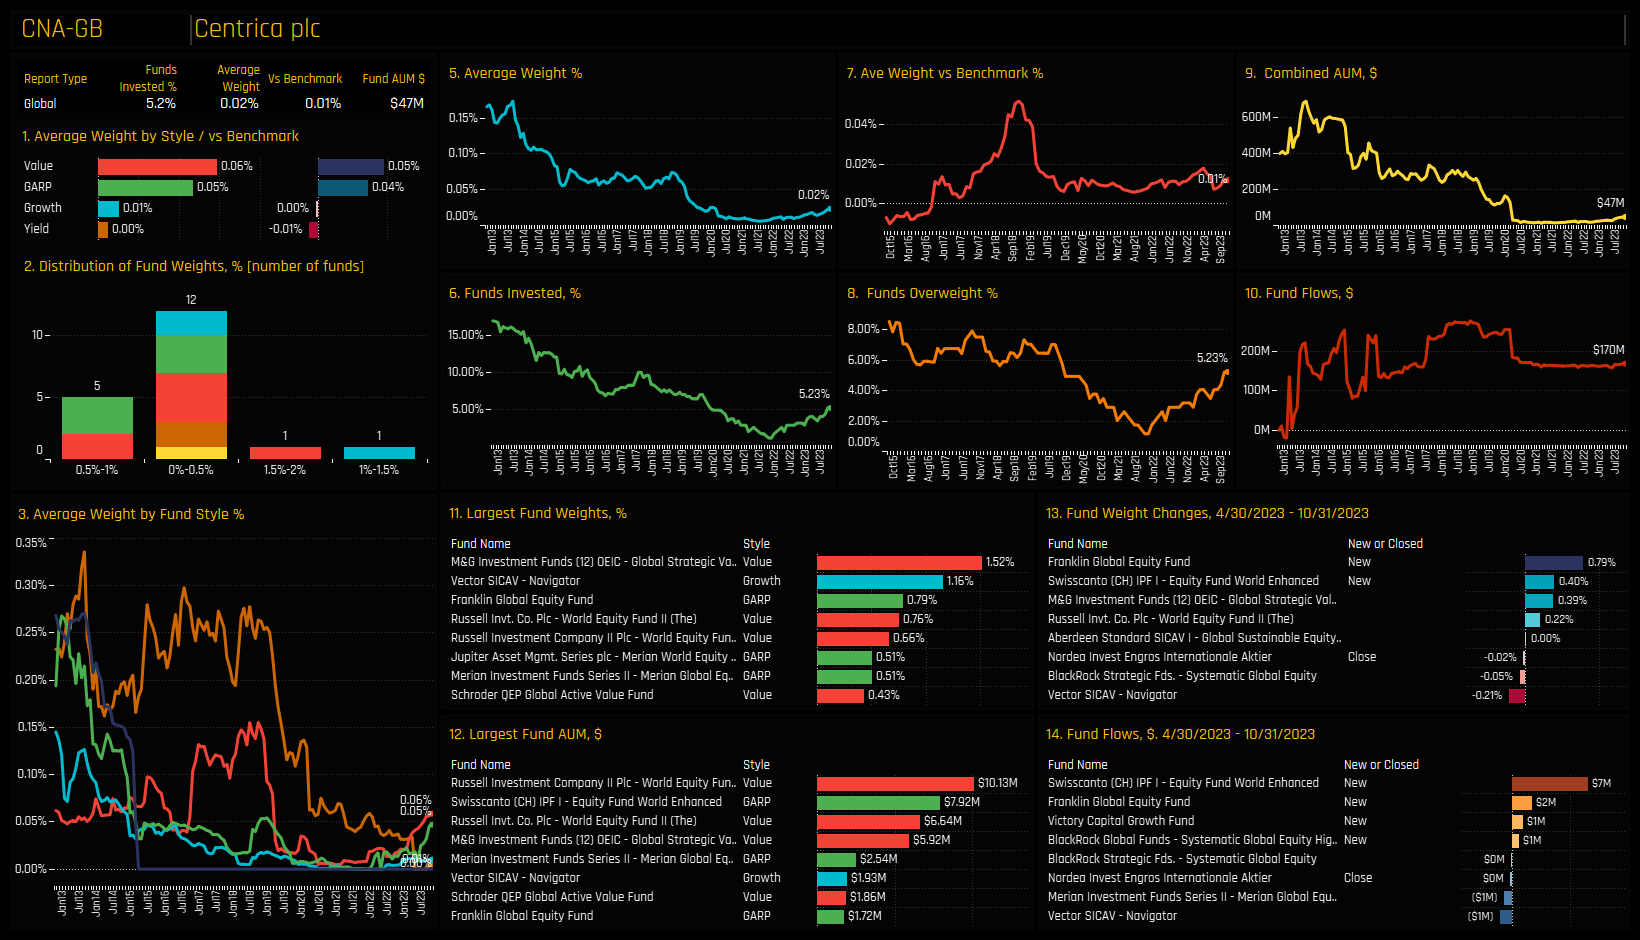
In the opposite case (bottom right), both American International Group and Centrica plc are at the bottom of their historical ownership ranges but both have started to climb from the lows. Top right shows Amazon.com and NVIDIA Corp capturing sustained increases in fund ownership in recent months to leave Global funds at their highest levels on record. In the charts that follow we provide more detailed profiles of each of the 8 stocks at the extreme corners of our Sentiment Grid.
High Positioning & High Momentum: NVIDIA Corporation
High Positioning & High Momentum: Amazon.com Inc.
High Positioning & Low Momentum: AutoZone, Inc
High Positioning & Low Momentum: Merck & Co, Inc
Low Positioning & Low Momentum: GSK plc
Low Positioning & Low Momentum: Walt Disney Company
Low Positioning & High Momentum: American International Group, Inc
Low Positioning & High Momentum: Centrica plc
344 Global Equity Funds, AUM $905bn
Global Active Funds Ownership Report
To round off this month's Global research, please click on the link below for the full data report on Global active fund positioning
For more analysis, data or information on active investor positioning in your market, please get in touch with me on steven.holden@copleyfundresearch.com
Investor Positioning Report — Copley Fund Research Ltd · Last updated: July 2026 · Registered in England and Wales
1. Who we are
Copley Fund Research Ltd provides proprietary institutional fund intelligence to listed companies and investor relations professionals. These terms govern every purchase of an Investor Positioning Report. By completing a purchase you confirm you have read, understood, and agreed to these terms in full.
2. What you are purchasing
The Investor Positioning Report is a bespoke PDF report mapping the institutional fund universe around your stock. It covers current investors, past investors, competitor investors, and white space investors. Every report is built from scratch for the specific company ordered and is not a standardised or templated product.
3. Delivery and process
Following payment or invoice issuance, Copley Fund Research will contact you within one working day to agree your competitor set. Production begins once the competitor set is confirmed in writing. The completed report will be released to you within 48 hours of production starting, provided payment has been received in full; where payment is outstanding, the report will be withheld until payment clears. If the requested company falls outside our covered fund universes, or a competitor set cannot be agreed, Copley Fund Research will issue a full refund or cancel the outstanding invoice.
4. Competitor set agreement
The competitor set is agreed with you in writing prior to production, and the report is built to that agreed specification. Requests to amend the competitor set after delivery, based on a change of preference rather than an error, may be treated as a new order.
5. Refund policy
Because each report is produced individually for your company, orders are non-refundable once production has begun, except as set out in clauses 3 and 5a below. By purchasing, you agree not to dispute the charge with your card provider on the basis that the service was not as described, provided the report has been delivered to the agreed specification or corrected under clause 5a.
5a. Quality remedy
If a delivered report contains a material error caused by Copley Fund Research — for example, an incorrect company analysed, a competitor omitted from the agreed set, or content missing from the specification in clause 2 — Copley Fund Research will correct and redeliver the report at no additional charge, within a reasonable timeframe. This is your sole remedy for such errors.
6. Data and accuracy
All fund positioning data in the report reflects holdings as disclosed at the most recently available reporting date at the time of compilation. The timing of fund holdings disclosures is determined by regulatory requirements applicable to each fund and is outside the control of Copley Fund Research Ltd. This data may not reflect current fund positions. Copley Fund Research takes reasonable care to ensure accuracy but makes no warranty, express or implied, as to the completeness or current accuracy of the underlying data — though this does not affect the quality remedy in clause 5a for errors in how that data was analysed or presented. Past fund positioning is not indicative of future fund behaviour or investment decisions.
7. Not investment advice
The Investor Positioning Report is produced for investor relations intelligence purposes only. It does not constitute investment advice, financial advice, or a recommendation to buy, hold, or sell any security. The data reflects historical fund positioning and must not be relied upon as a prediction of future fund behaviour or investment decisions. Copley Fund Research Ltd is not authorised or regulated by the Financial Conduct Authority for the provision of investment advice.
8. Permitted use and confidentiality
The report is licensed for internal use by the purchasing organisation only. You may share it with employees and directors of your organisation. You may not: reproduce, redistribute, publish, or resell the report or any part of it; share it with any third party outside your organisation without prior written consent; use the fund or portfolio manager names contained in the report to approach those individuals on behalf of Copley Fund Research or in a manner that could damage Copley Fund Research's relationships with those funds; or use the data for any purpose other than your own investor relations strategy. The data, analysis, and methodology contained in the report are the intellectual property of Copley


