• Rotation in to China Precious Metals stocks pushes ownership to record levels, bucking the trend of overall Materials sector decline.
• Precious Metals overtake Industrials Specialties as the largest industry holding in the Materials sector.
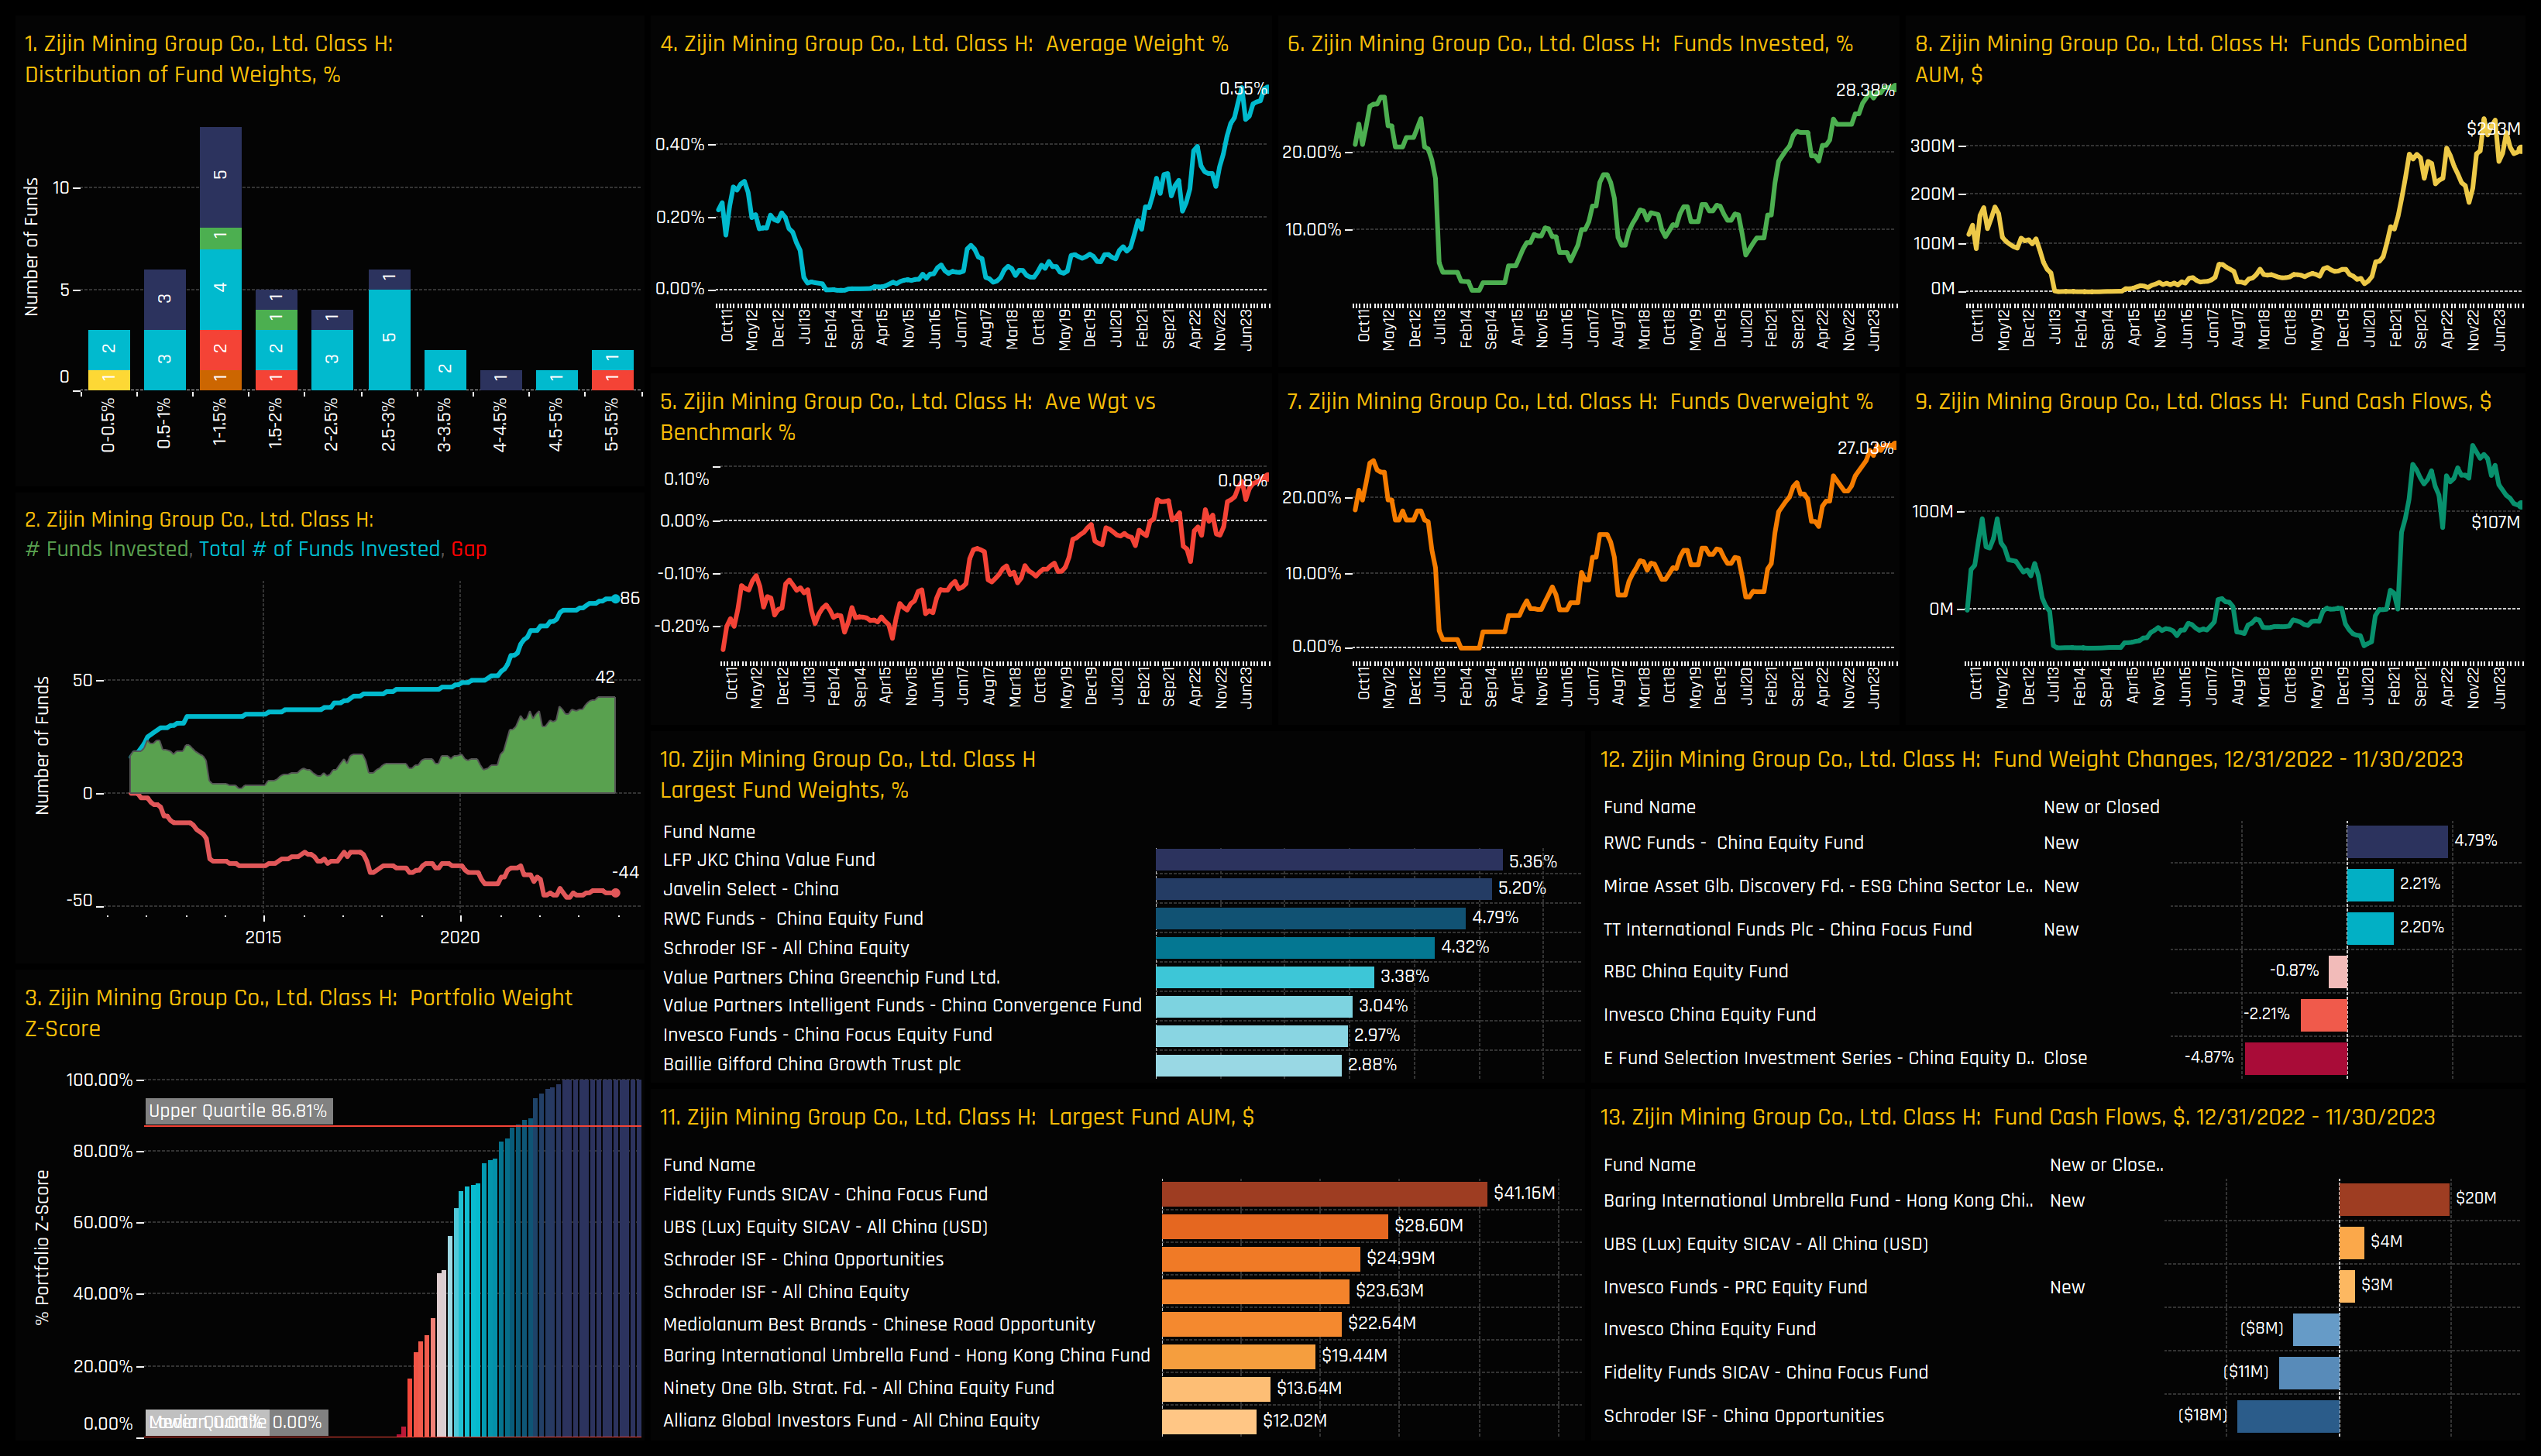
• Zijin Mining Group soars to new ownership highs, attracting funds such as RWC, Mirae and TT International over the course of 2023.
• Second tier stocks showing signs of life, though remain lightly held among investors.
Precious Metals vs China Materials
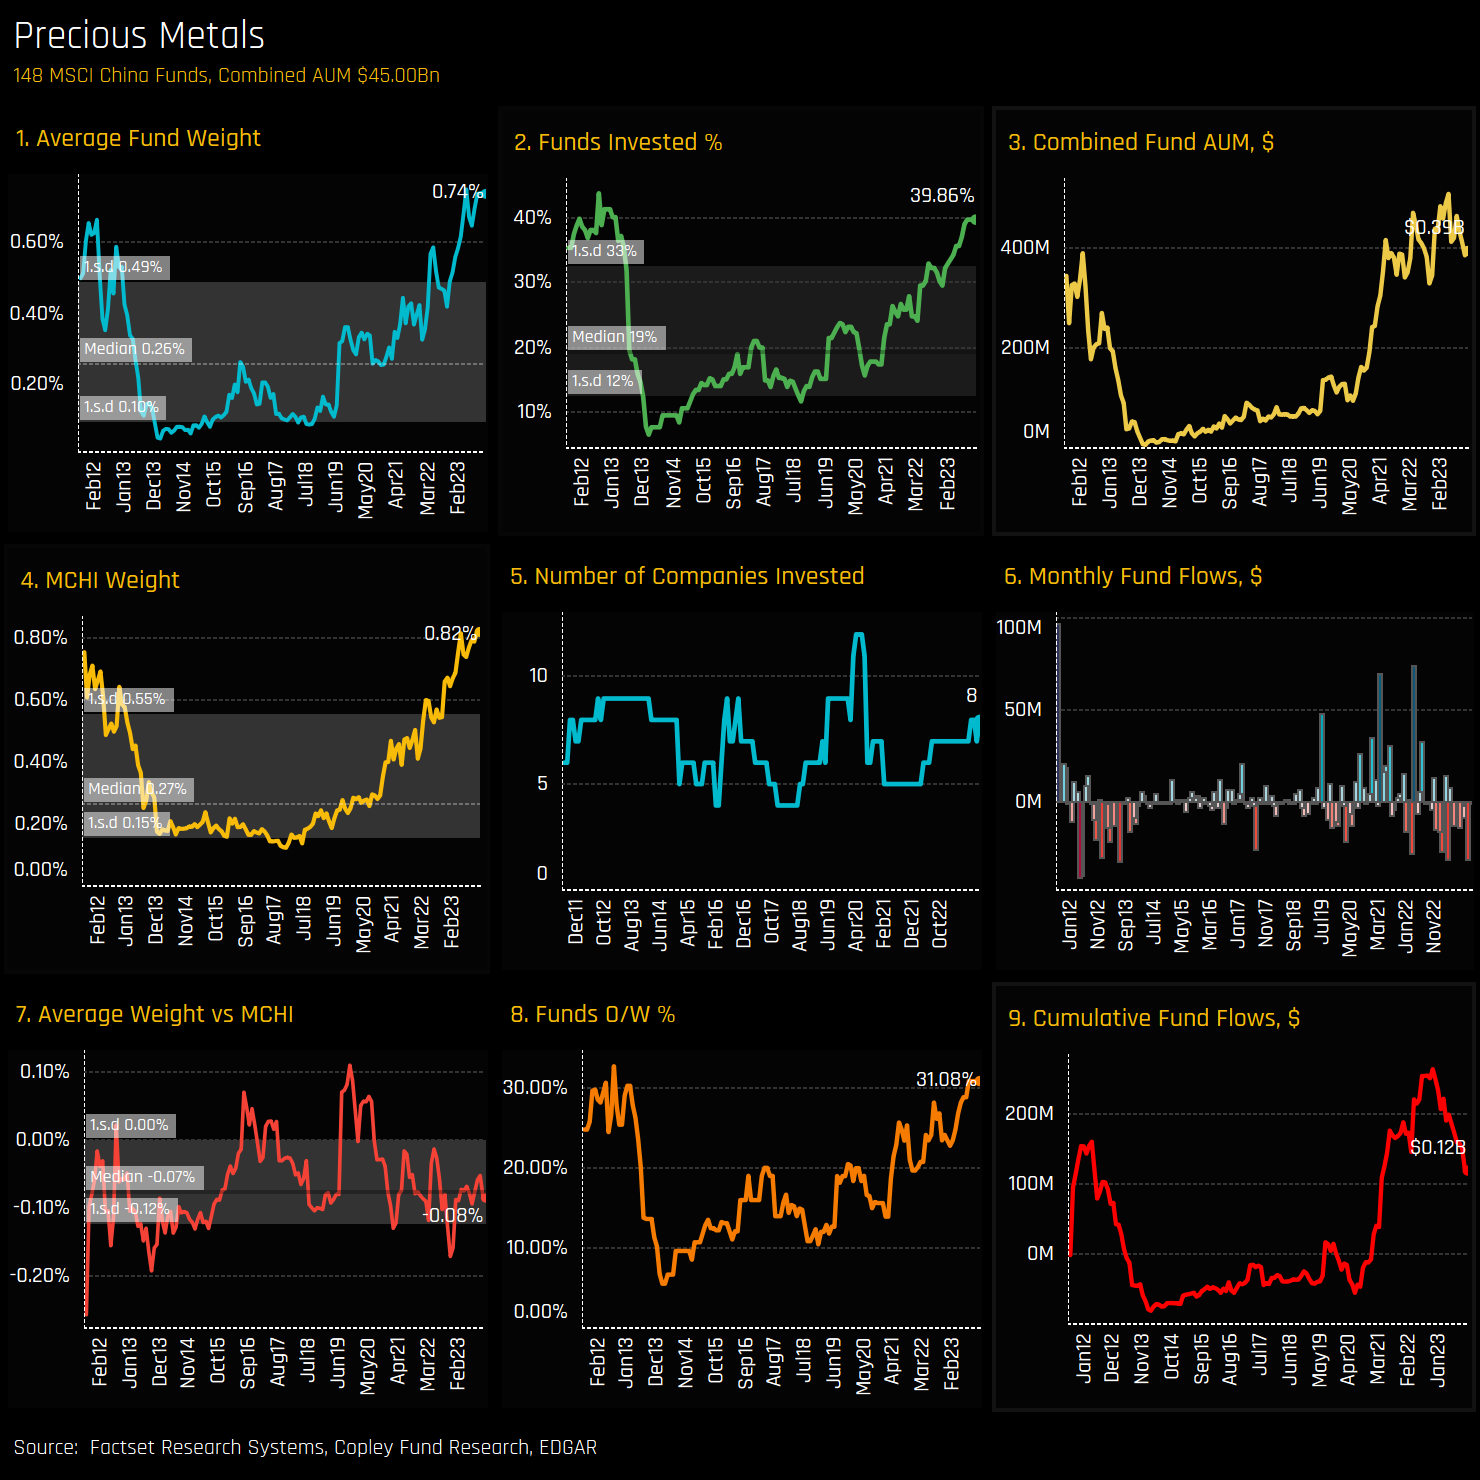
Active China funds continue to raise allocations to the Precious Metals sector. The 9-chart dashboard below documents this rise, with most measures of fund ownership in a multi-year bull trend. Average fund weights of 0.74% are near all-time highs (ch1), so too the percentage of funds with exposure at 39.9% (ch2). Commensurate with these increases, the iShares MCHI ETF is also at peak weights, so active China funds are merely keeping in line with the benchmark, as chart 7 depicts.
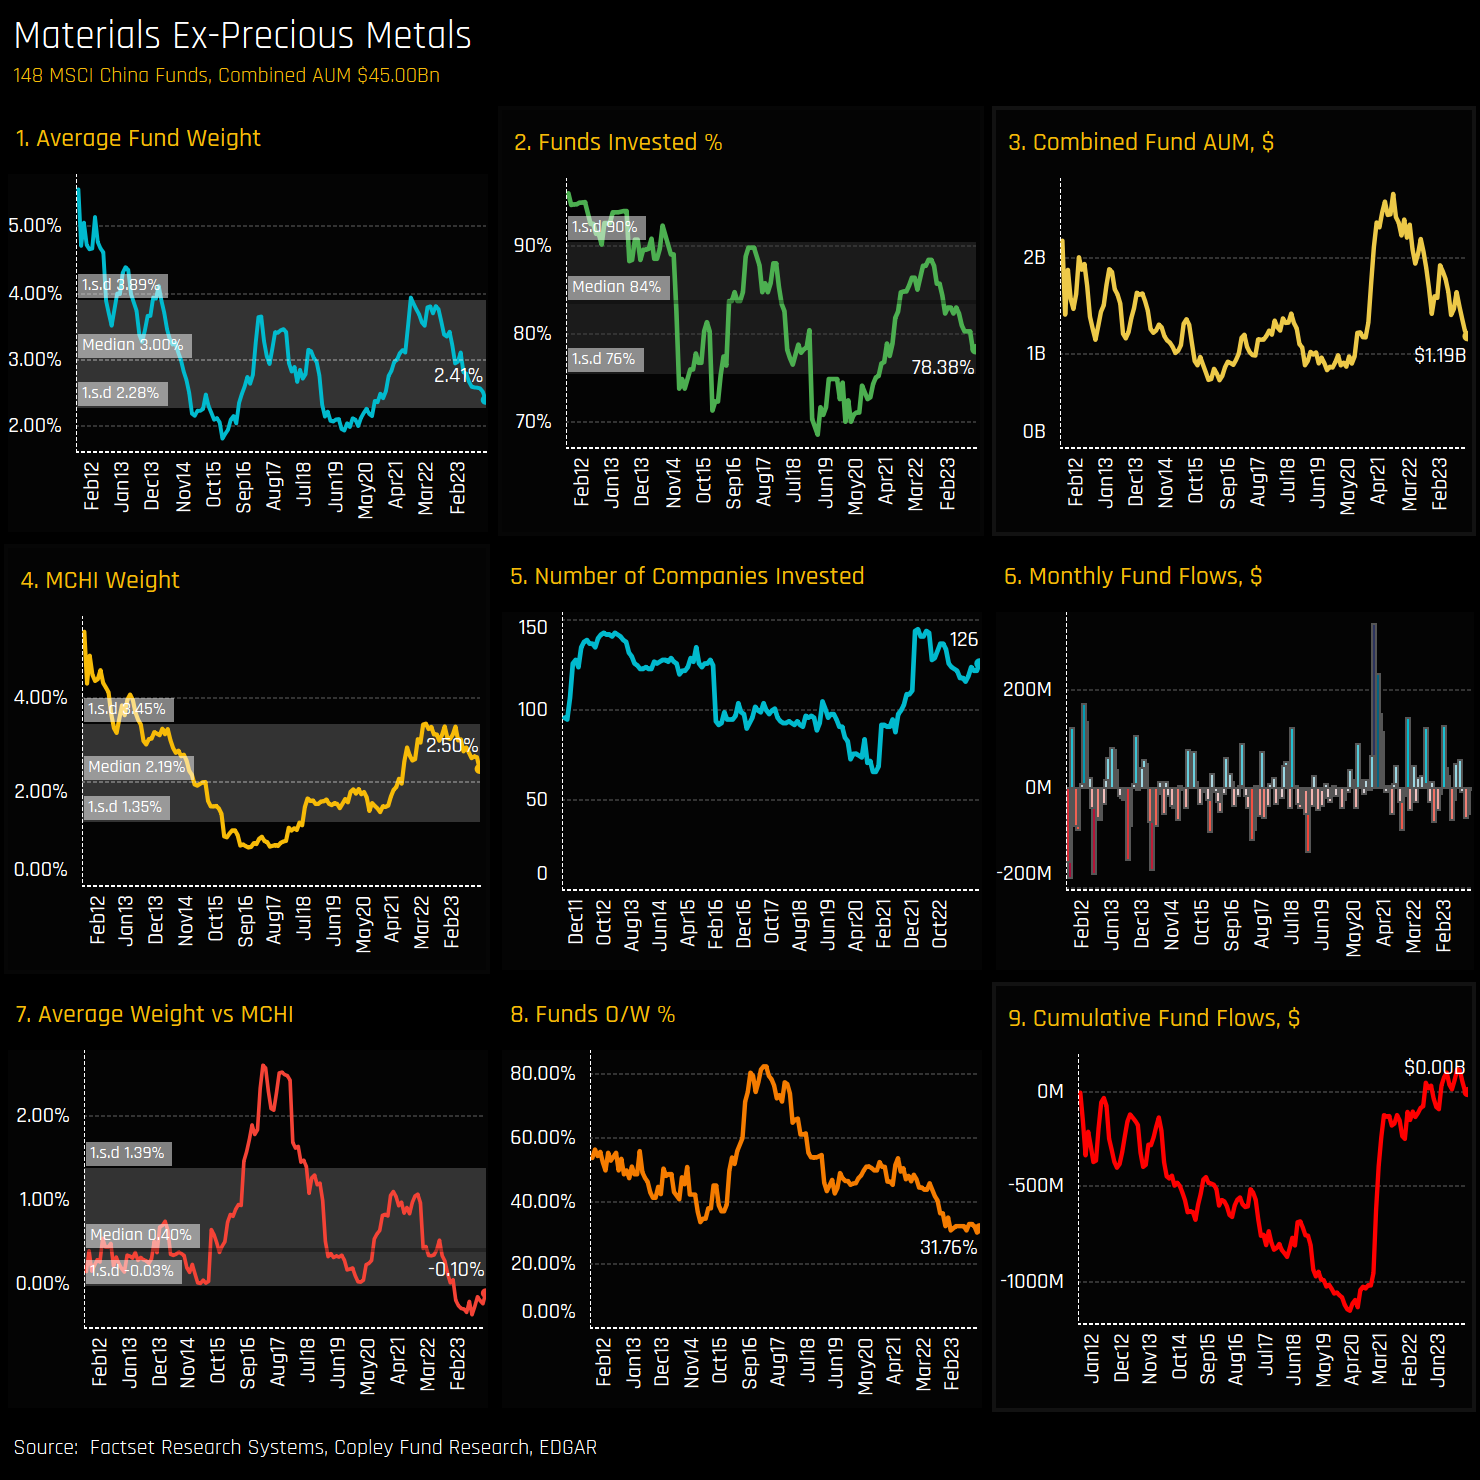
The increased focus on the Precious Metals sector is in contrast to the broader trends observed in the Materials sector. The charts below show the same ownership statistics for the Materials sector, excluding the Precious Metals industry group. Although allocations in the Materials sector (ex-Precious Metals) increased from 2020 to 2021, a downward trend began around mid-2022. Since then, there has been a noticeable decline in both fund weights and overall ownership, with exposure levels close to the lower end of the 10-year range.
Industry Sentiment & Long-Term Trends
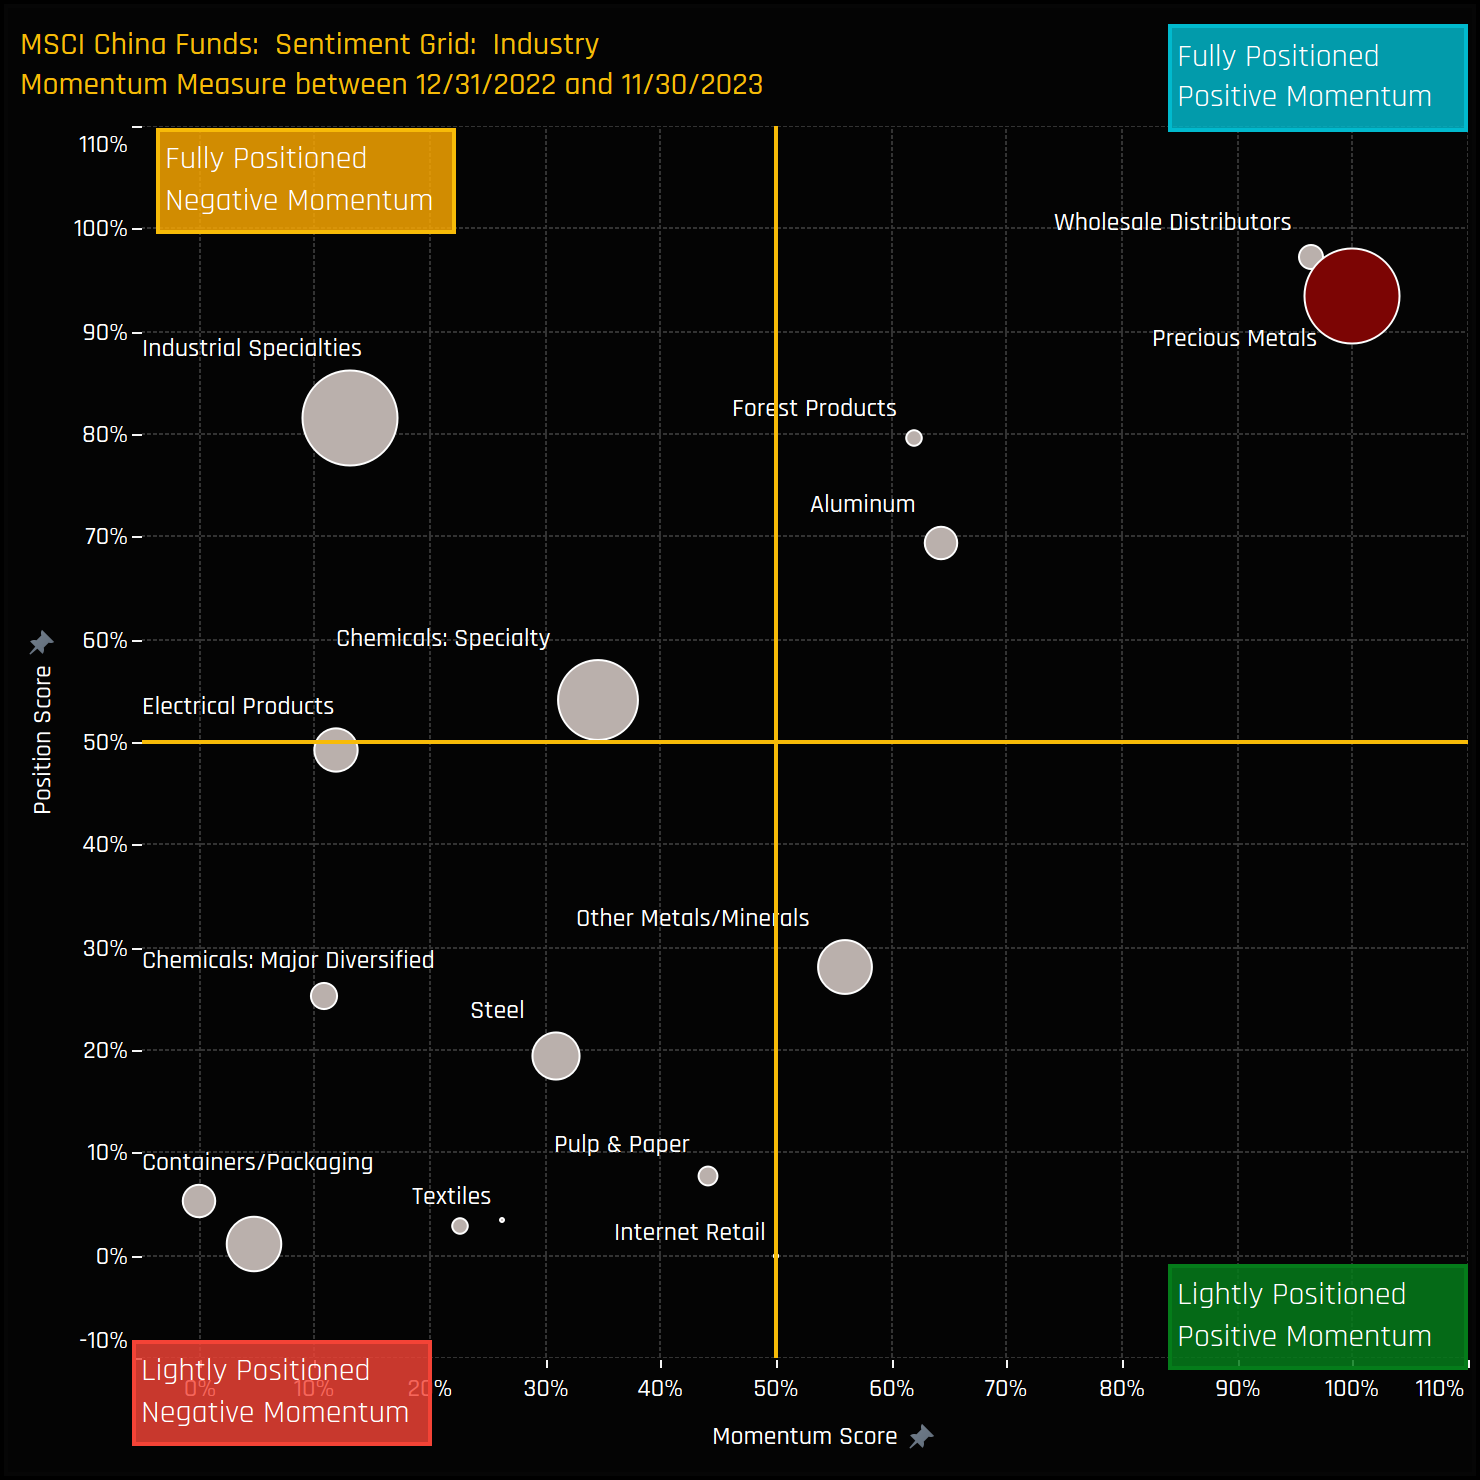
This disparity becomes more apparent when we analyze the positioning and momentum of each industry group within the Materials sector. The Grid’s Y-axis below represents the ‘Position Score,’ which quantifies the current positioning of each industry relative to its own history since 2011, scaled from 0 to 100%. The X-axis displays the ‘Momentum Score’, reflecting the activity of fund managers in each industry from 12/31/2022 to 11/30/2023, ranging from 0% (maximum negative activity) to 100% (maximum positive activity). In this context, Precious Metals, positioned in the top-right quadrant, markedly differs from other major industry groups, which are either experiencing negative momentum or lower levels of positioning compared to their historical averages.
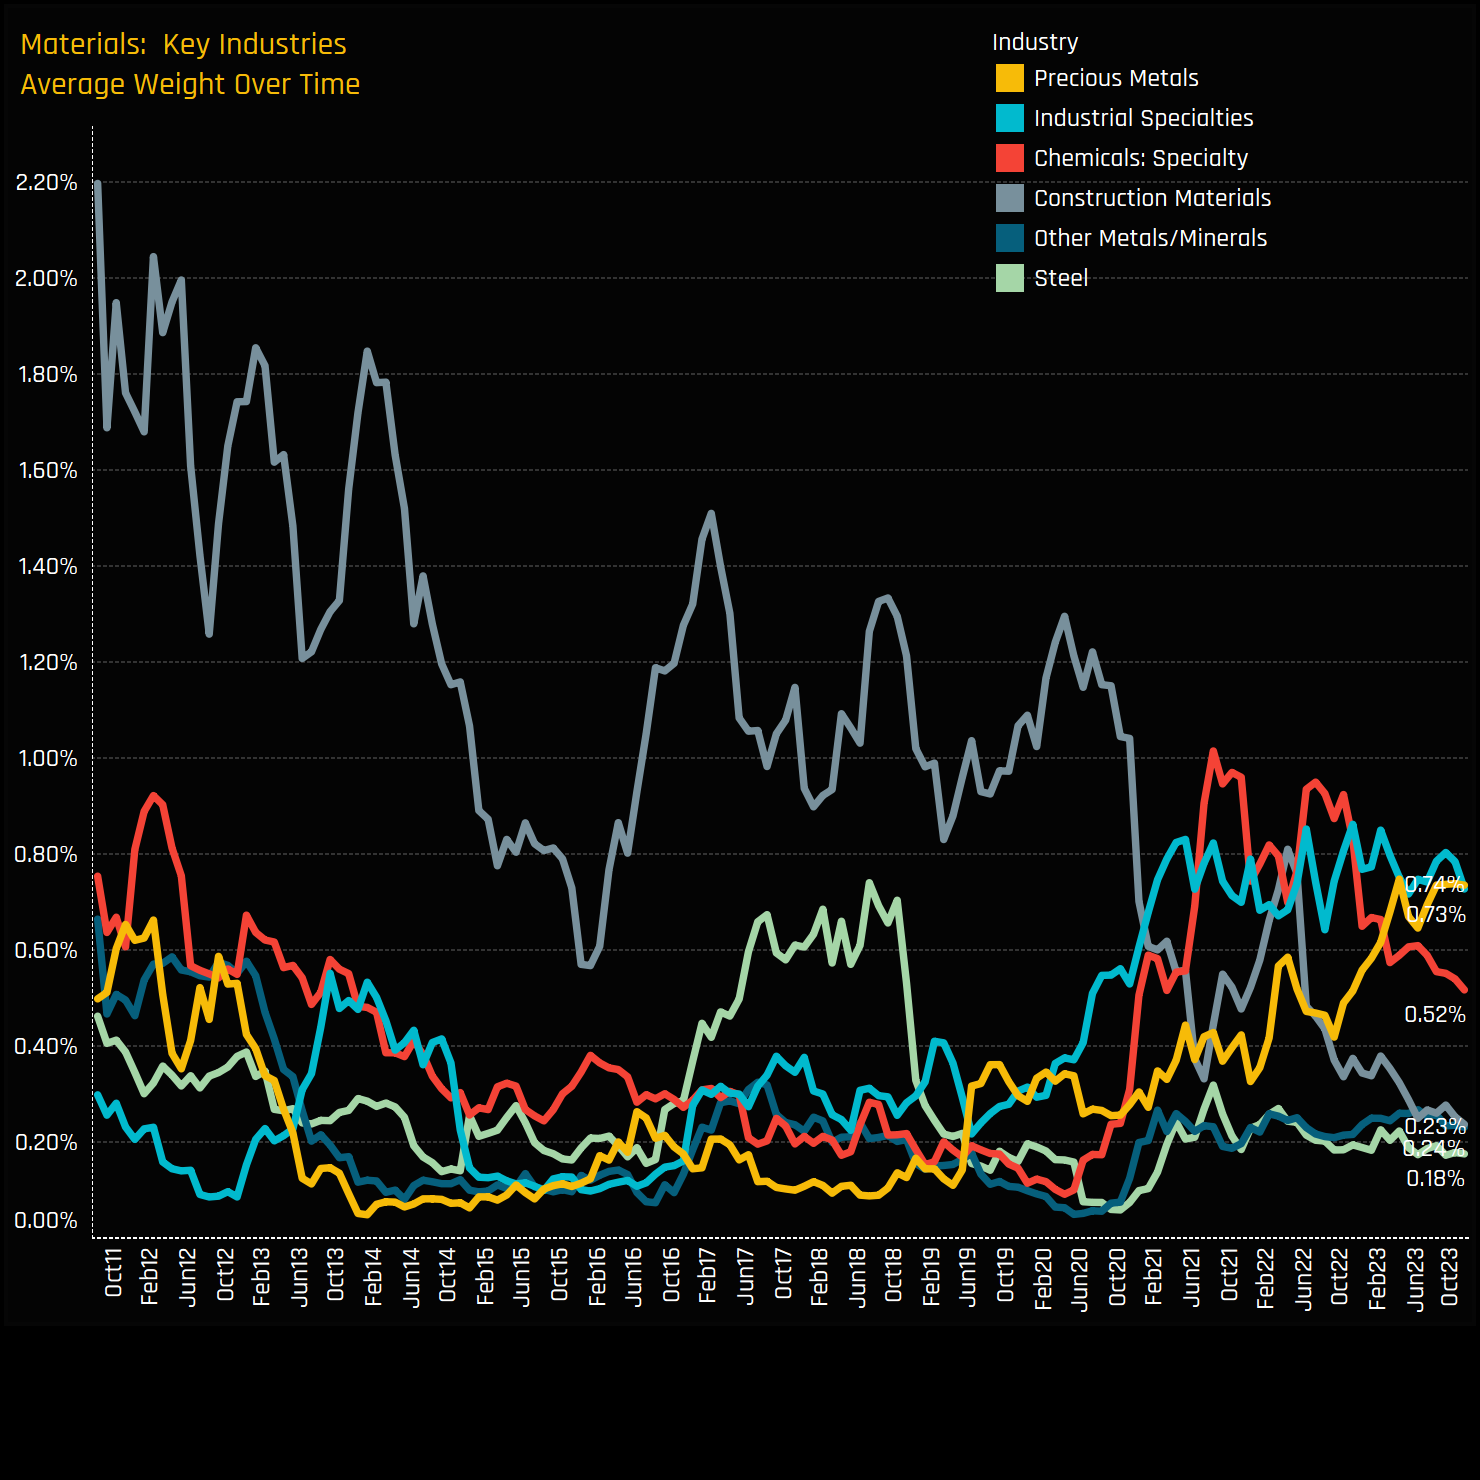
The time series chart below tracks the average weights of the six largest industry groups in the Materials sector, providing insights into the sector’s composition changes over time. A key observation is the significant decline in the Construction Materials industry group, where weights have fallen from over 2% in 2011 to just 0.24% today. More recently, weights in the Specialty Chemicals group have decreased from their highs, while those in Industrial Specialties have remained stagnant. This is against a backdrop of steadily increasing weights in the Precious Metals industry group.
Fund Holdings & Activity
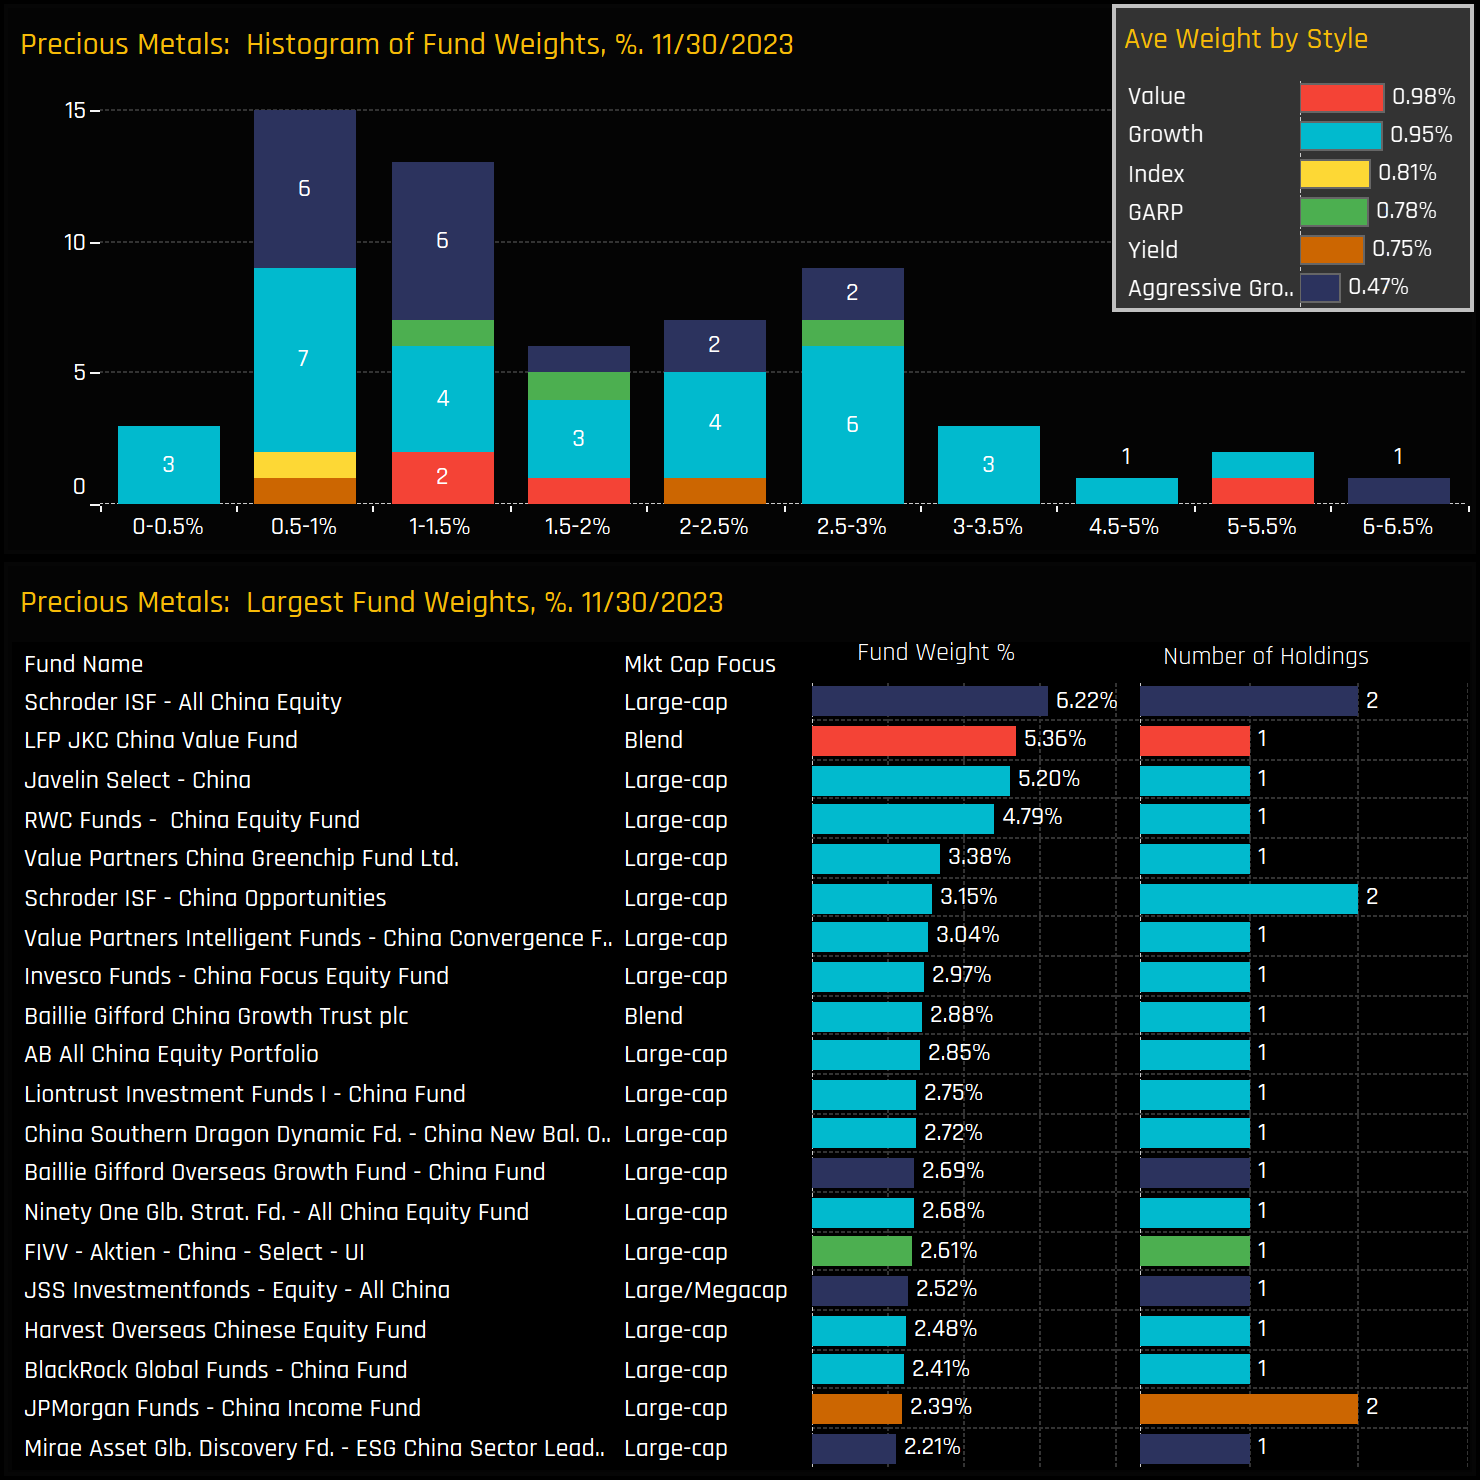
Analyzing fund allocations within the Precious Metals industry group, the top chart below presents a histogram of fund weights. Most funds are concentrated in the range of 0.5% to 3%, with a few outliers at the top end, notably Schroders All China Equity at 6.22% and LFP JKC China Value at 5.36%. All style groups appear well represented, with the small number of Value funds in our analysis sharing similar allocations to the many Growth and Aggressive Growth strategies.
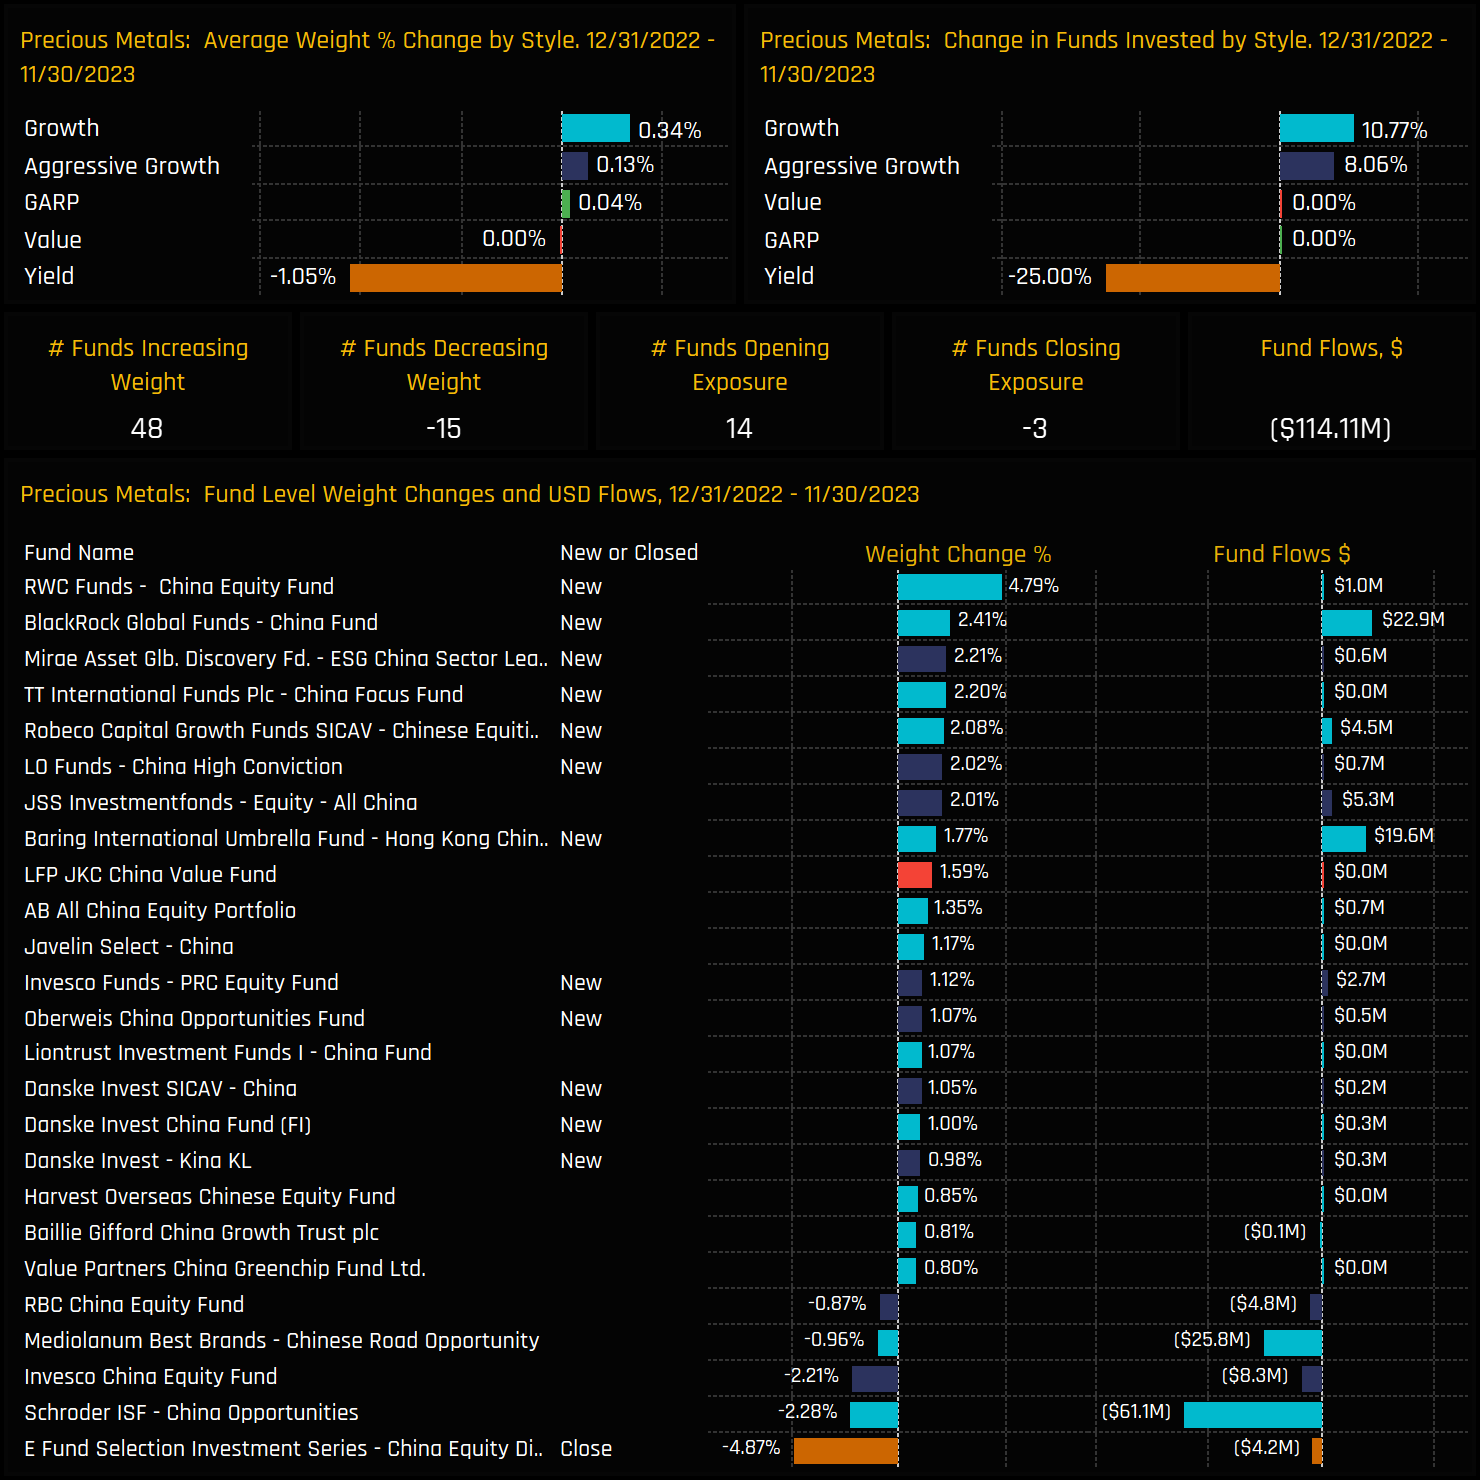
Fund activity through the course of the year shows a definite positive skew, backing up what we see at the aggregate level. Over the period, 48 funds saw weights increase compared to 15 decreasing, with 14 funds opening new exposure compared to 3 closing. The momentum was largely driven by international players, with RWC China Equity opening a significant 4.79% position. BlackRock China and Mirae ESG China followed suit with 2.41% and 2.21% positions respectively. Despite these positive movements, the sector experienced net outflows of $114 million, primarily due to position reductions by Schroders and Mediolanum.
Stock Holdings & Activity
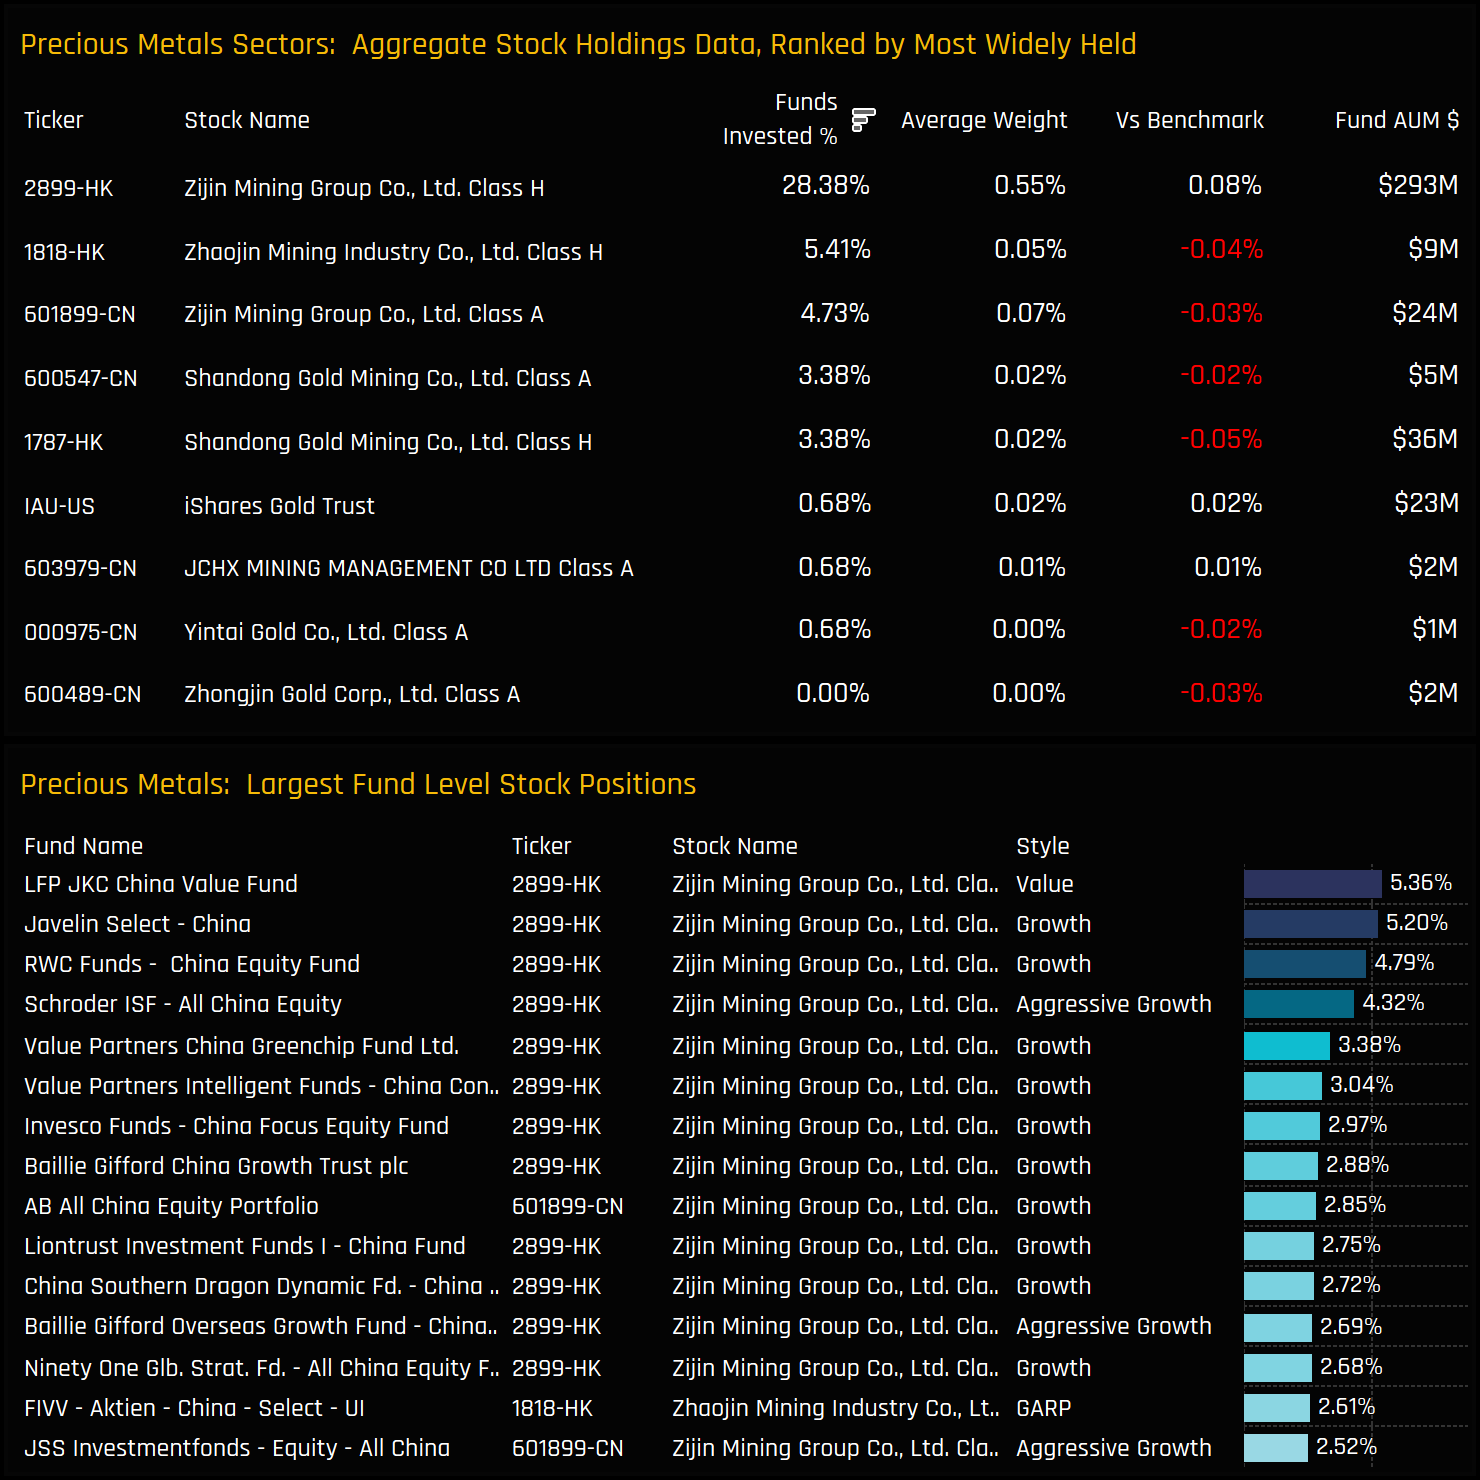
The Precious Metals Industry group is comprised of holdings in just 8 companies, but heavily skewed towards 1. Zijin Mining Group is owned by 28.4% of funds and accounts for 74% of the total Precious Metals allocation. It also accounts for 14 of the largest 15 individual fund positions, as shown in the bottom chart. There are other players in the picture though, with small but not insignificant holdings in Zhaojin Mining Industry and Shandong Gold Mining.
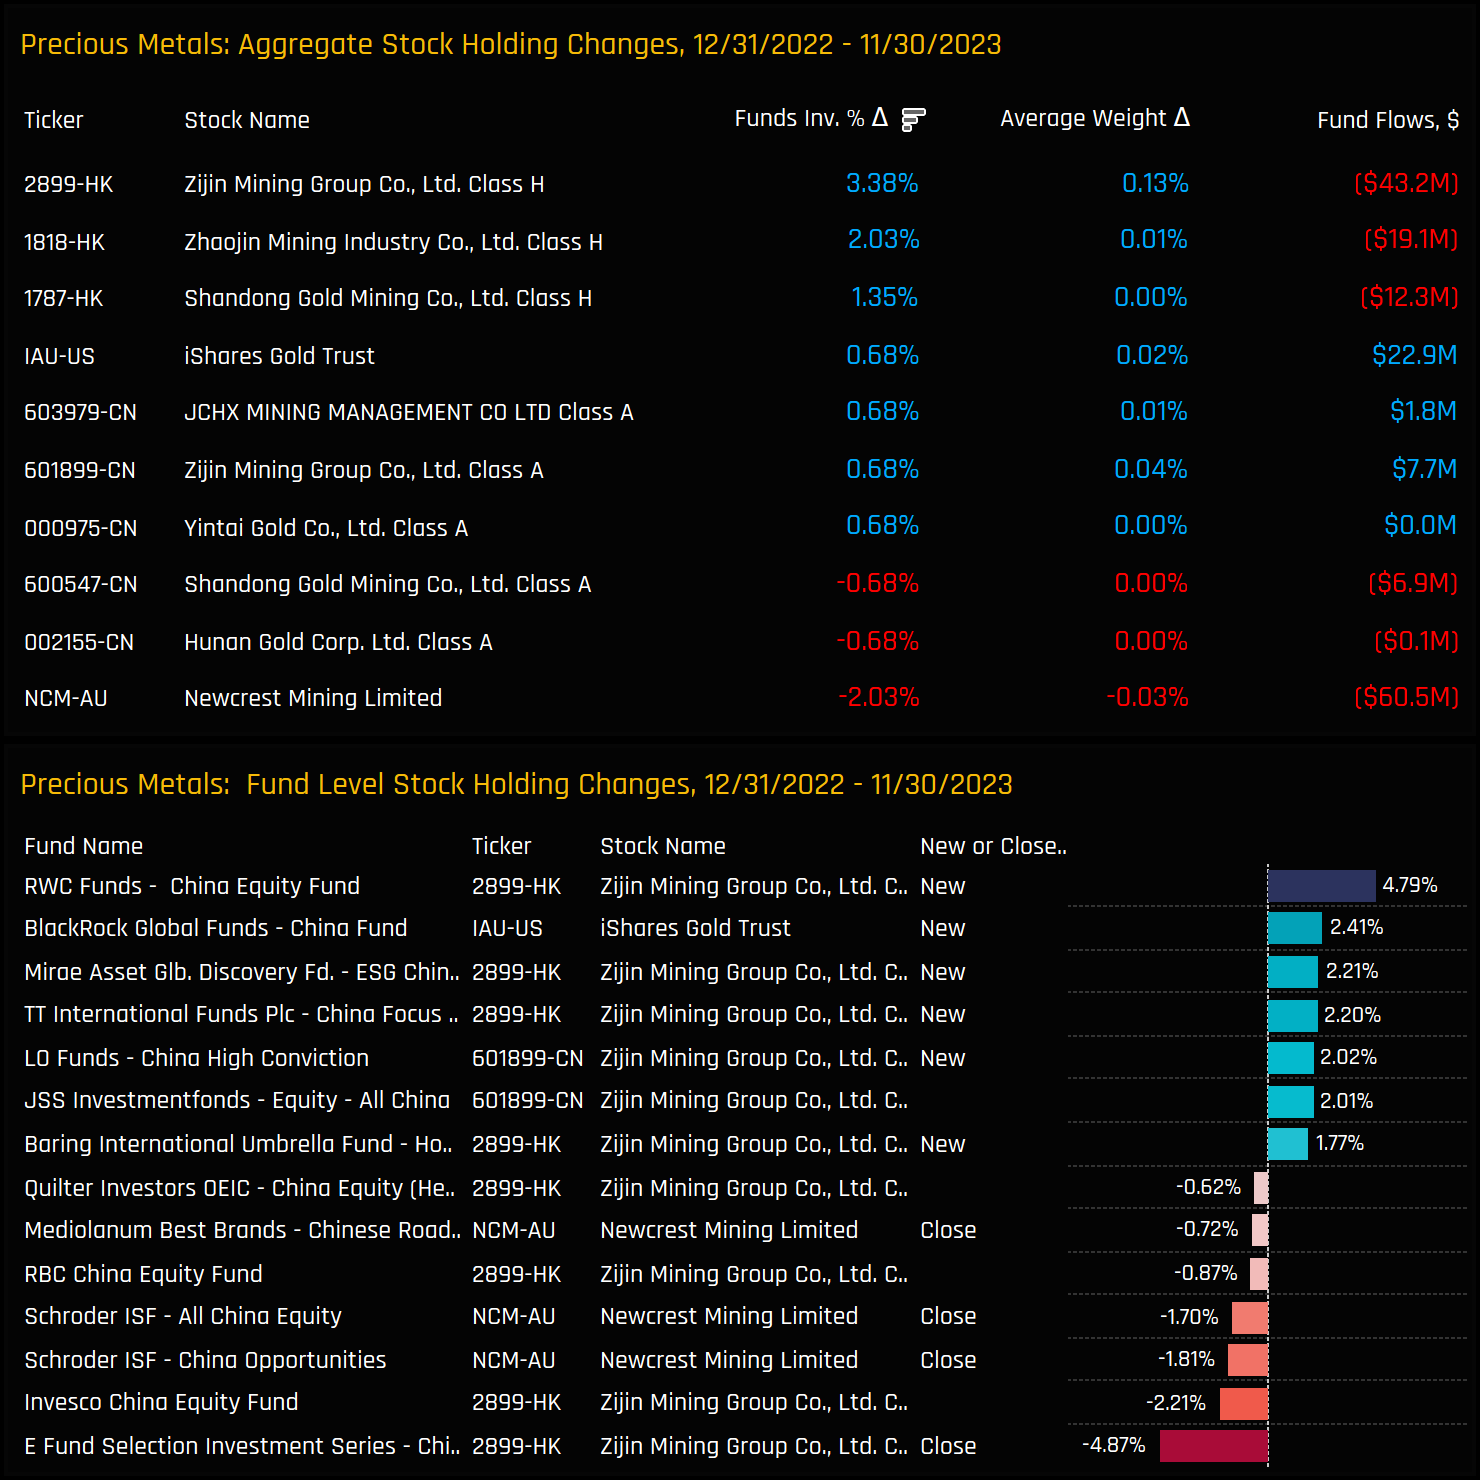
Throughout 2023, stock activity reflected the overall positive trend, although it wasn’t entirely one-directional. Zijin Mining Group experienced a notable uptick in interest, with a net +3.4% of the 149 funds in our analysis initiating positions. Zhaojin Mining Industry and Shandong Gold Mining also saw smaller yet significant increases in ownership. On the other hand, two Schroders China strategies exited their positions in out-of-benchmark Newcrest Mining. The majority of the fund-level activity, however, was concentrated around Zijin Mining Group.
Stock Profile: Zijin Mining Group
The recent shift towards Zijin Mining Group has pushed ownership to unprecedented levels. This is evident across various measures: average fund weights (ch4), relative to benchmark weights (chart 5), the proportion of funds invested (chart 6), and the percentage of funds positioned overweight (chart 7) have all reached record highs. While most managers maintain portfolio allocations below 3% (chart 1), LFP JKC China Value and Javelin Select China stand out with 5%+ fund weights (chart 10). New investments by RWC China Equity, Mirae ESG China, and TT International China Focus contributed to this trend, with E Fund China Dividend being the only significant exit. Chart 2 displays the total ever (blue line) versus current (green line) number of funds invested in Zijin, suggesting that 44 funds have past experience with Zijin but are not currently invested.
Conclusions & Links
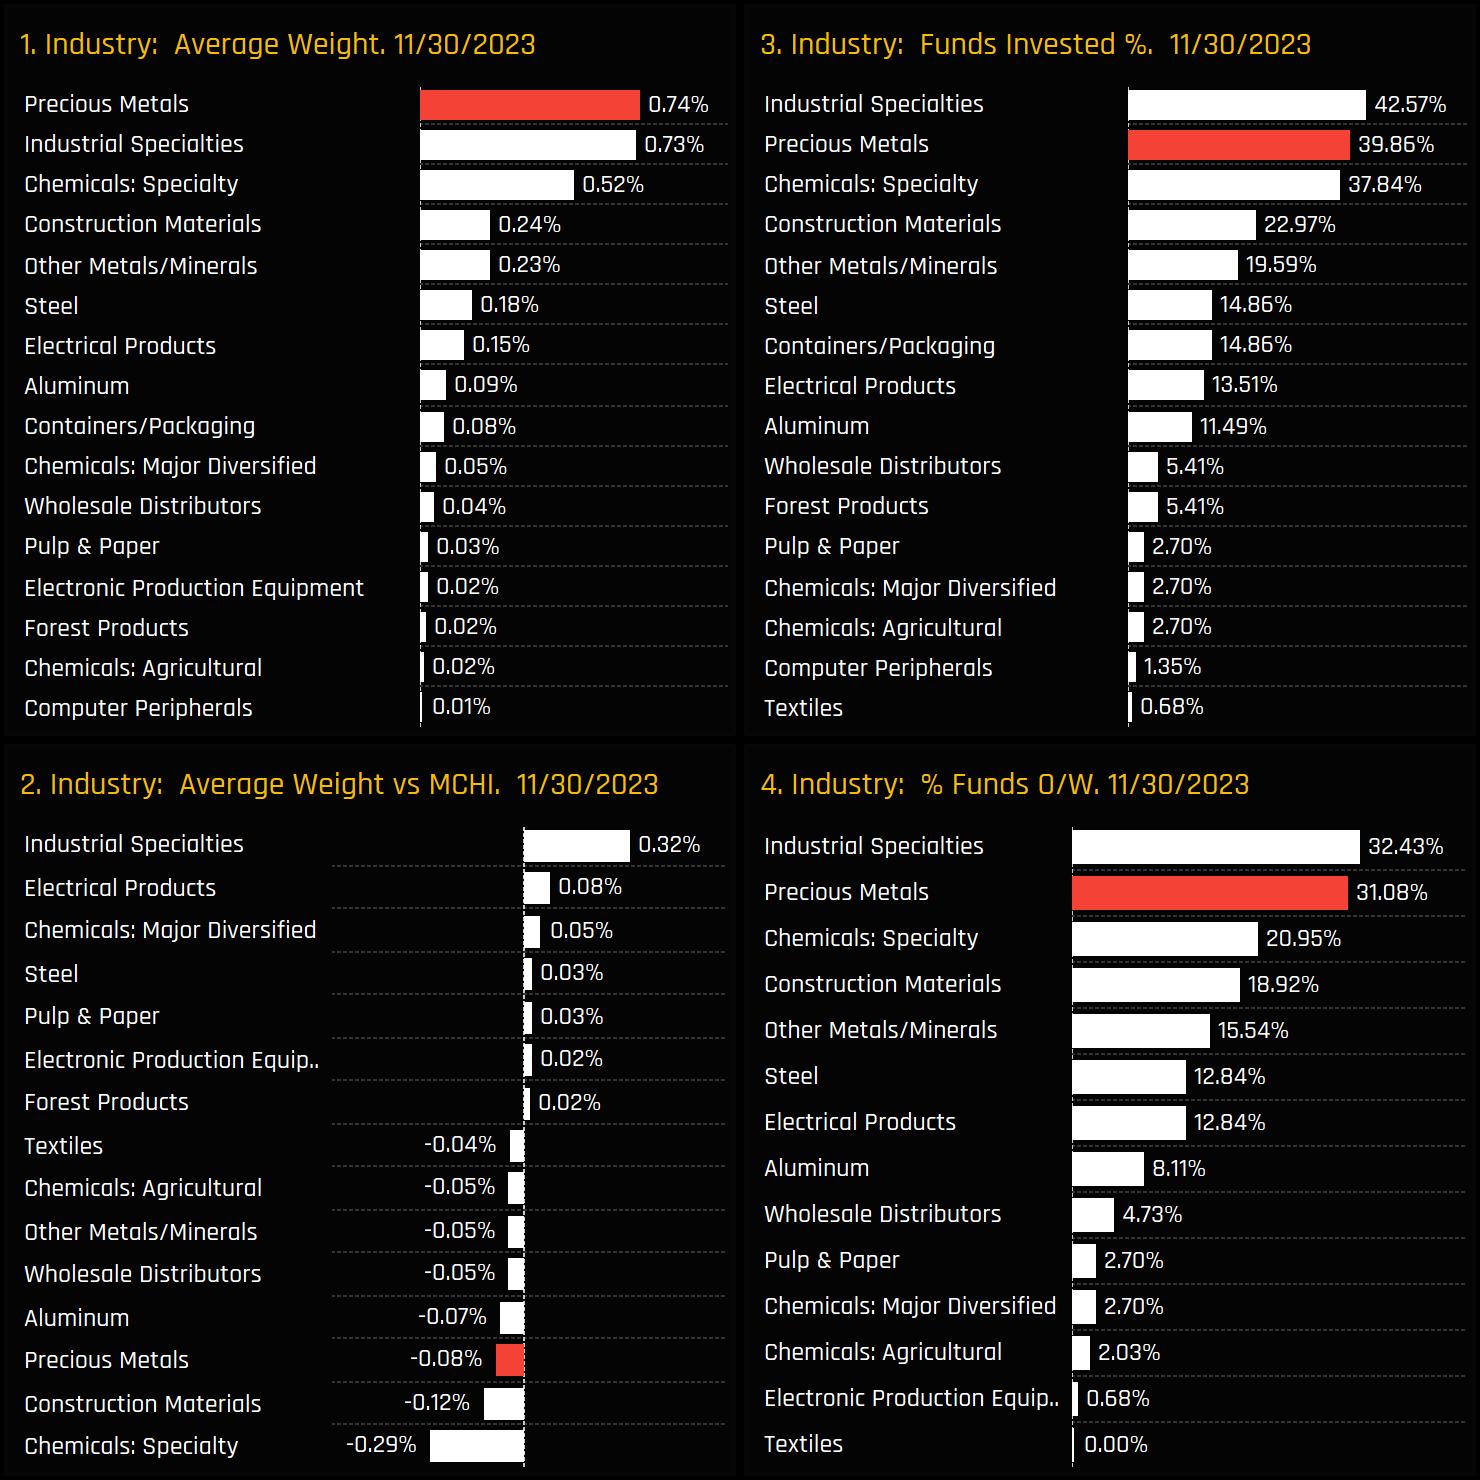
The charts on the right provide the most recent ownership data for each industry group within the China Materials sector. In this context, Precious Metals emerge as the industry with the largest average weight (ch1), whilst ranking second in both funds invested (ch3) and funds positioned overweight (ch4).
Compared to the benchmark, industry-level positioning generally aligns closely with the iShares MSCI China ETF, with overweights in Industrial Specialties offset by underweights in Specialty Chemicals (ch2). Precious Metals positioning is largely in line with the benchmark on an average weight basis, but as chart 4 indicates, the majority (69%) of funds are still positioned underweight.
On a stock level, Zijin Mining Group stands out as the preferred choice. However, as this stock becomes more crowded, the potential value in second-tier stocks like Zhaojin Mining Industry and Shandong Gold Mining should also be a consideration.
Click below for the extended data report on China’s Precious Metals Industry Group.
For more analysis, data or information on active investor positioning in your market, please get in touch with me on steven.holden@copleyfundresearch.com
Investor Positioning Report — Copley Fund Research Ltd · Last updated: July 2026 · Registered in England and Wales
1. Who we are
Copley Fund Research Ltd provides proprietary institutional fund intelligence to listed companies and investor relations professionals. These terms govern every purchase of an Investor Positioning Report. By completing a purchase you confirm you have read, understood, and agreed to these terms in full.
2. What you are purchasing
The Investor Positioning Report is a bespoke PDF report mapping the institutional fund universe around your stock. It covers current investors, past investors, competitor investors, and white space investors. Every report is built from scratch for the specific company ordered and is not a standardised or templated product.
3. Delivery and process
Following payment or invoice issuance, Copley Fund Research will contact you within one working day to agree your competitor set. Production begins once the competitor set is confirmed in writing. The completed report will be released to you within 48 hours of production starting, provided payment has been received in full; where payment is outstanding, the report will be withheld until payment clears. If the requested company falls outside our covered fund universes, or a competitor set cannot be agreed, Copley Fund Research will issue a full refund or cancel the outstanding invoice.
4. Competitor set agreement
The competitor set is agreed with you in writing prior to production, and the report is built to that agreed specification. Requests to amend the competitor set after delivery, based on a change of preference rather than an error, may be treated as a new order.
5. Refund policy
Because each report is produced individually for your company, orders are non-refundable once production has begun, except as set out in clauses 3 and 5a below. By purchasing, you agree not to dispute the charge with your card provider on the basis that the service was not as described, provided the report has been delivered to the agreed specification or corrected under clause 5a.
5a. Quality remedy
If a delivered report contains a material error caused by Copley Fund Research — for example, an incorrect company analysed, a competitor omitted from the agreed set, or content missing from the specification in clause 2 — Copley Fund Research will correct and redeliver the report at no additional charge, within a reasonable timeframe. This is your sole remedy for such errors.
6. Data and accuracy
All fund positioning data in the report reflects holdings as disclosed at the most recently available reporting date at the time of compilation. The timing of fund holdings disclosures is determined by regulatory requirements applicable to each fund and is outside the control of Copley Fund Research Ltd. This data may not reflect current fund positions. Copley Fund Research takes reasonable care to ensure accuracy but makes no warranty, express or implied, as to the completeness or current accuracy of the underlying data — though this does not affect the quality remedy in clause 5a for errors in how that data was analysed or presented. Past fund positioning is not indicative of future fund behaviour or investment decisions.
7. Not investment advice
The Investor Positioning Report is produced for investor relations intelligence purposes only. It does not constitute investment advice, financial advice, or a recommendation to buy, hold, or sell any security. The data reflects historical fund positioning and must not be relied upon as a prediction of future fund behaviour or investment decisions. Copley Fund Research Ltd is not authorised or regulated by the Financial Conduct Authority for the provision of investment advice.
8. Permitted use and confidentiality
The report is licensed for internal use by the purchasing organisation only. You may share it with employees and directors of your organisation. You may not: reproduce, redistribute, publish, or resell the report or any part of it; share it with any third party outside your organisation without prior written consent; use the fund or portfolio manager names contained in the report to approach those individuals on behalf of Copley Fund Research or in a manner that could damage Copley Fund Research's relationships with those funds; or use the data for any purpose other than your own investor relations strategy. The data, analysis, and methodology contained in the report are the intellectual property of Copley


