Greater China Funds: 2022 Performance & Attribution Report

45 Active Greater China Funds, AUM $17bn.

2022 Performance & Attribution Report

In this report, we provide an overview of 2022 performance among the Greater China funds in our analysis. We look at annual performance broken down by Style and Market Cap focus, together with longer-term analysis of active versus passive. We then identify the drivers behind 2022 performance based on the average active Greater China fund stock portfolio versus the SPDRs FTSE Greater China ETF (3073-HK).

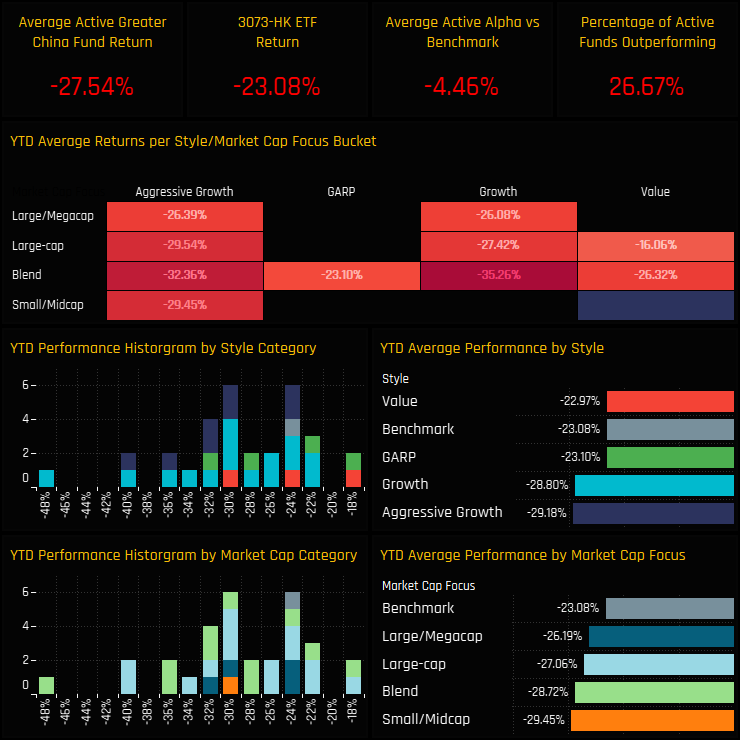
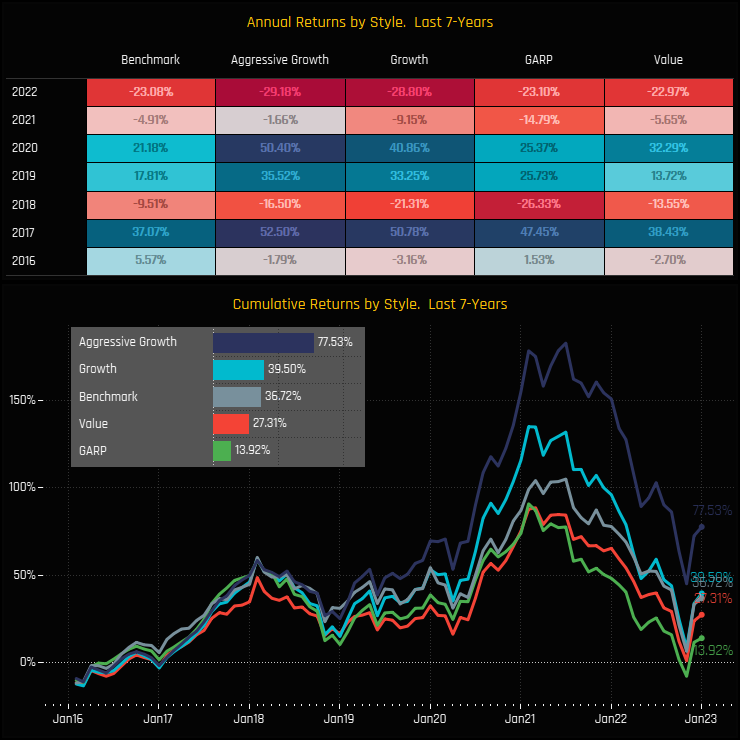
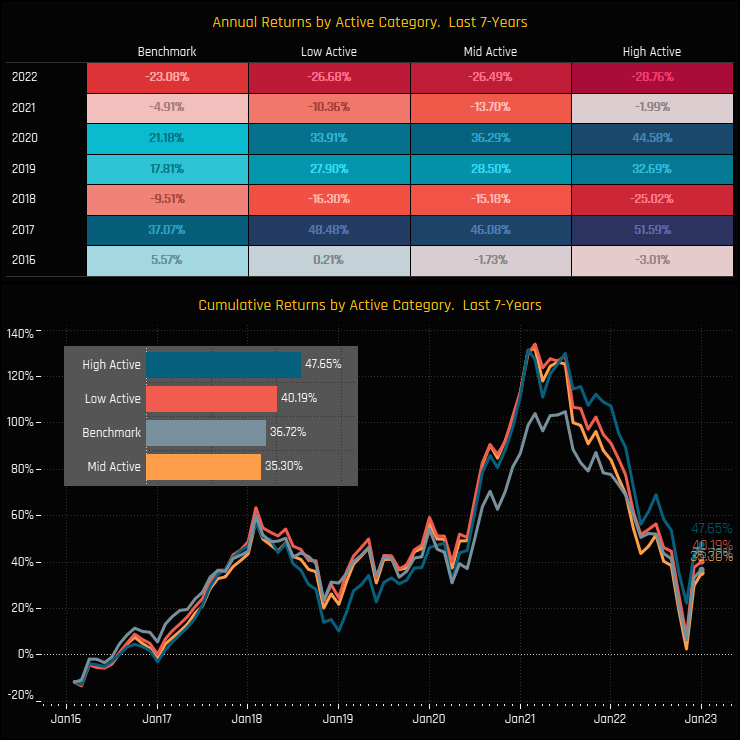
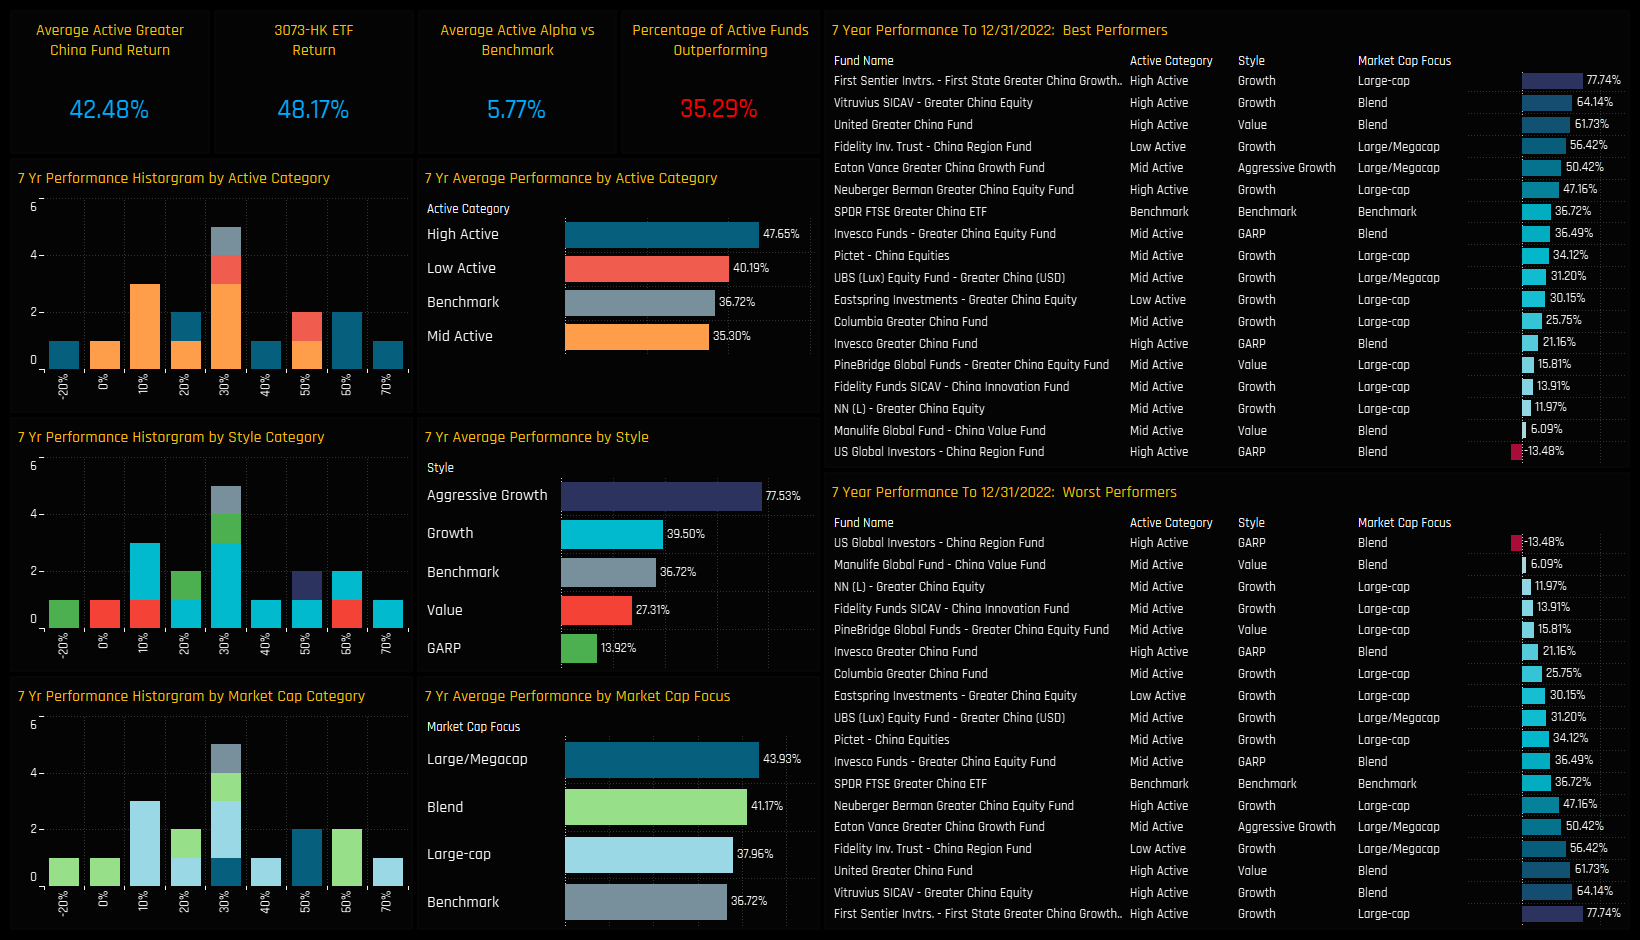
In line with both MSCI China and China A-Share active funds, Greater China managers had a dreadful 2022.  Average returns of -27.54% fell some way short of the SPDRs FTSE Greater China ETF of -23.08%, with nearly 3/4 of funds underperforming the benchmark.  Value and GARP Funds had the advantage over Growth and Aggressive Growth, and Large-cap beat Small/Midcap and Blend funds over the course of the year.

The top and bottom performers on the year are listed below.  GARP and Value funds occupy the podium positions, led by Invesco Greater China (-16.02%) and PineBridge Greater China (-16.06%)


Time-Series Active v Passive

The underperformance started in January and never really recovered.  Outperformance in May and June couldn’t overcome significant underperformance in January, March and November.

The relative performance of active Greater China funds versus their benchmark has see-sawed over the last 7-years.  Despite the last 2 years of underperformance, strong outperformance in 2019 and 2020 leaves active funds ahead by +5.8% over the period.

Time-Series Active v Passive

The charts below show the average annual performance (top) and cumulative performance (bottom) split by fund Style over the last 7-years.  Returns over this period are almost a mirror image of the performance seen in 2022.  Despite the outperformance of GARP funds in 2022, they remain well behind Aggressive Growth over the 7-year cycle.

In line with MSCI China and China A-Share funds, Greater China fund performance split by active category provides evidence that an active approach provides the best returns in China.  High Active funds (active share >75%) have outperformed the SPDR Greater China ETF by over 10% over a 7-year period.

7-Year Performance Summary

Contribution & Attribution Analysis

We now look at the drivers behind last year’s absolute and relative performance.  We do this by creating a portfolio based on the average allocations of the 45 active strategies in our analysis.  This theoretical portfolio, with no fees and based on monthly holding observations returned -24.04% on the year.  On a sector level, -8.71% of this was driven by Information Technology holdings, the largest sector allocation and big underperformer on the year (ch1).  Consumer Discretionary (-3.95%) and Industrials (-3.49%) added to the negative returns, with Cash and Energy providing minor respite.  On a stock level, the major holdings in the portfolio dragged on returns, led by TSMC, Tencent and Alibaba Group.

To understand where last year’s underperformance came from, we measure the attributes of this portfolio versus a representation of the benchmark based on the SPDRs FTSE Greater China ETF (3073%).  The active portfolio underperformed by -2.58% in 2022.  The key drivers of this underperformance were underweights in Financials and poor stock selection in Tech, Materials and Industrials (ch3).  On a stock level, underweights in AIA Group and CCB, together with overweights in Silergy Corp and Yunnan Energy New Material dragged on relative returns (ch4).  Cash holdings, underweights in TSMC and overweights in Pinduoduo salvaged some outperformance for Greater China managers on the year.

For more analysis, data or information on active investor positioning, please get in touch with me on steven.holden@copleyfundresearch.com