In this issue:
China Stock Radar
A-Share Construction Materials Slump
A-Share Packaged Software Revival
152 MSCI China Equity Funds, AUM $55bn
MSCI China Stock Radar
Investment levels among the thousands of stocks in the investible China universe differ greatly. Some stocks are widely owned, others largely avoided with ownership levels changing every month. We combine current and historical positioning against shorter-term manager activity to get a handle on where sentiment lies for every stock in our MSCI China analysis. We highlight 8 stocks at the extreme ends of their own positioning ranges whilst also seeing significant changes in fund ownership.
Stock Sentiment
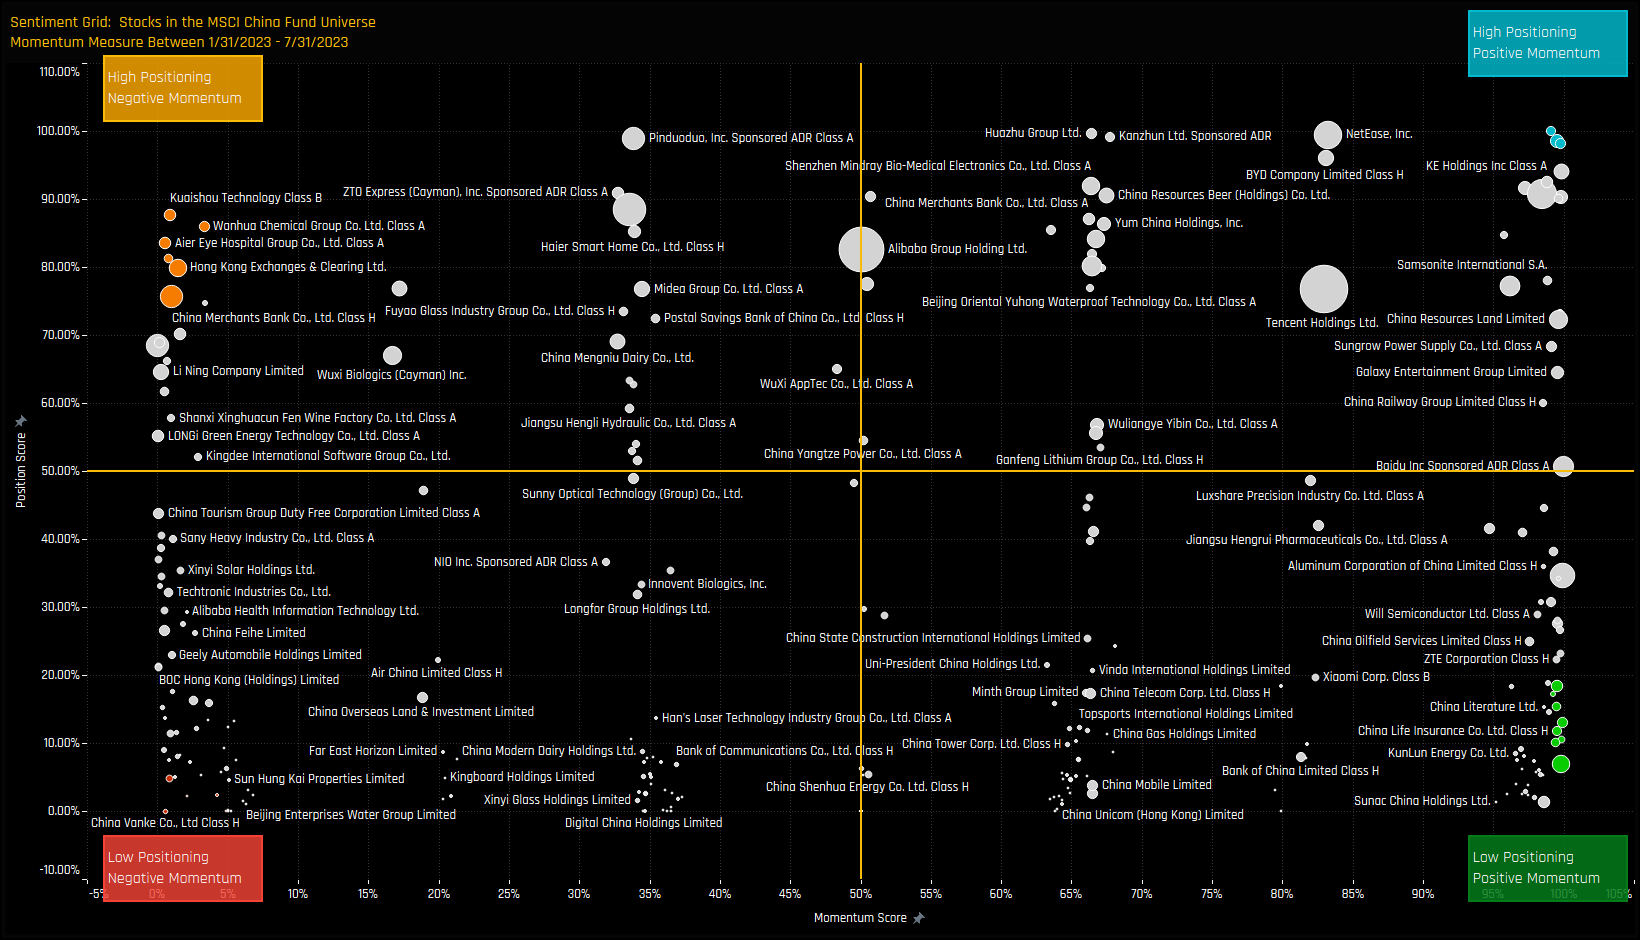
The Sentiment Grid below is designed to visualize the interplay between current fund positioning, long-term fund positioning and shorter-term fund manager activity for all stocks in the MSCI China fund active universe. The Y-axis shows the ‘Position Score’, a measure of current positioning in each stock compared to its own history going back to 2011 on a scale of 0-100%. It takes in to account the percentage of funds invested in each stock versus history, the average fund weight versus history and the percentage of funds overweight the benchmark versus history. The higher the number, the more heavily a stock is owned by active China managers compared to its own history.
The X-Axis shows the ‘Momentum Score’, a measure of fund manager activity for each stock between 1/31/2023 and 07/31/2023 on a scale of 0% (maximum negative activity) to 100% (maximum positive activity). The Momentum Score takes in to account the change in the percentage of funds invested in each stock over the period, the change in average weight and the change in the percentage of funds overweight. The chart also highlights the companies at the extreme ends of each quadrant by colour, which will shall explore in more detail below.
Extreme Stocks
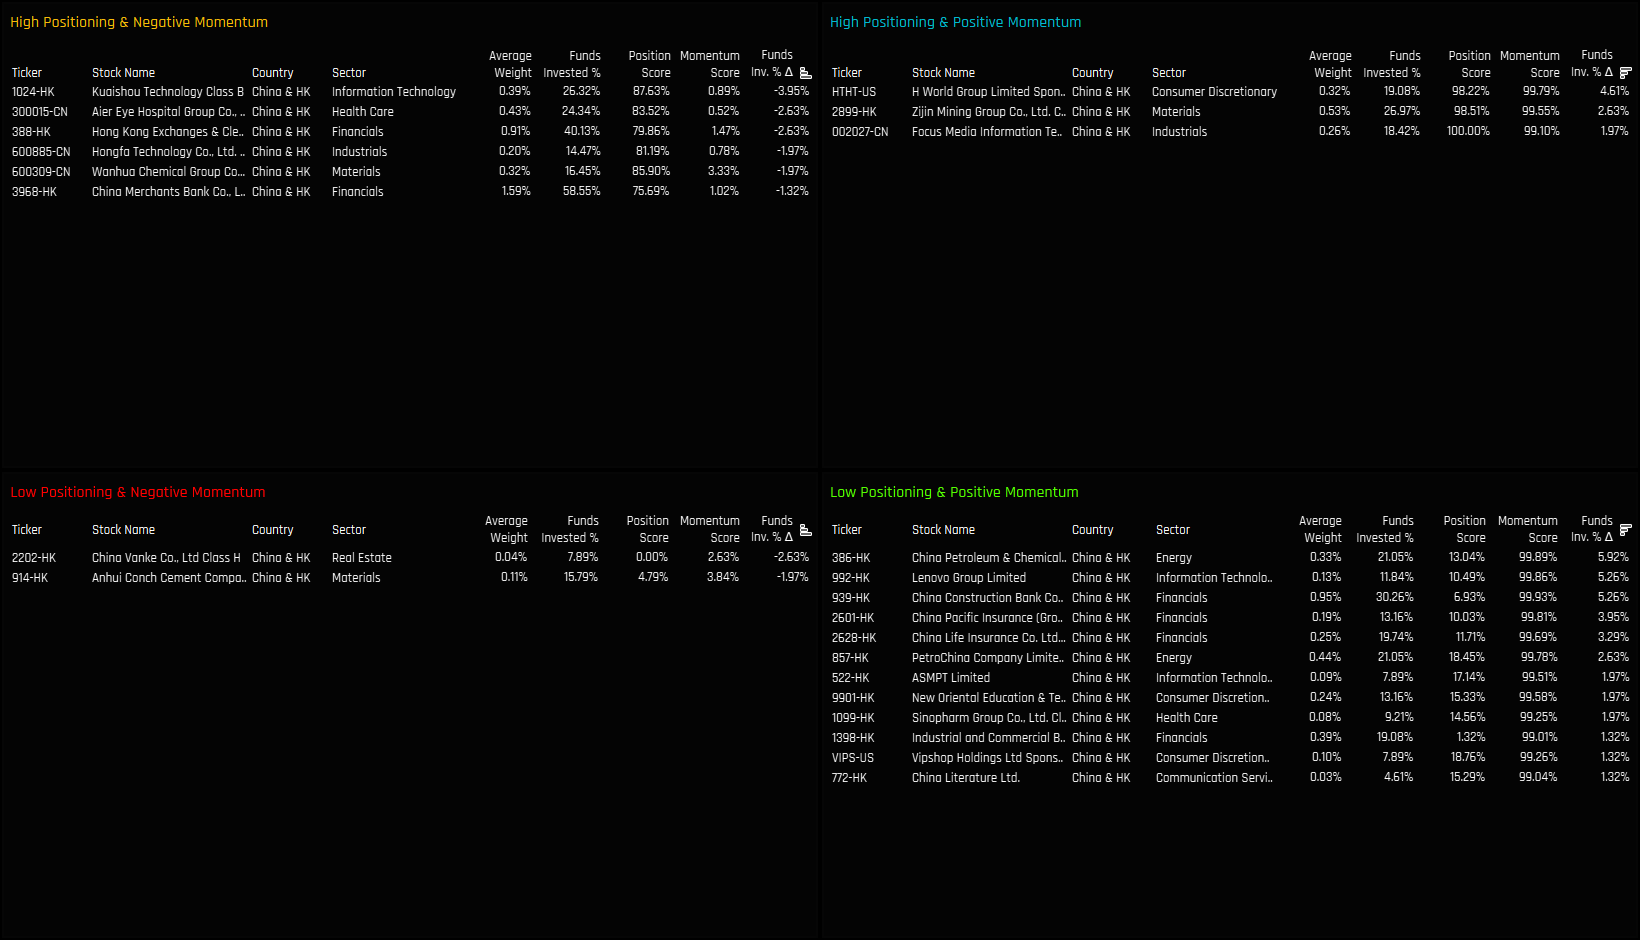
The tables below list the stocks in the extreme corners of each quadrant. The screening methodology is as follows:
High Positioning & Negative Momentum: Position Score > 75%. Momentum Score < 5%
High Positioning & Positive Momentum: Position Score > 95%. Momentum Score > 99%
Extreme Stocks Focus
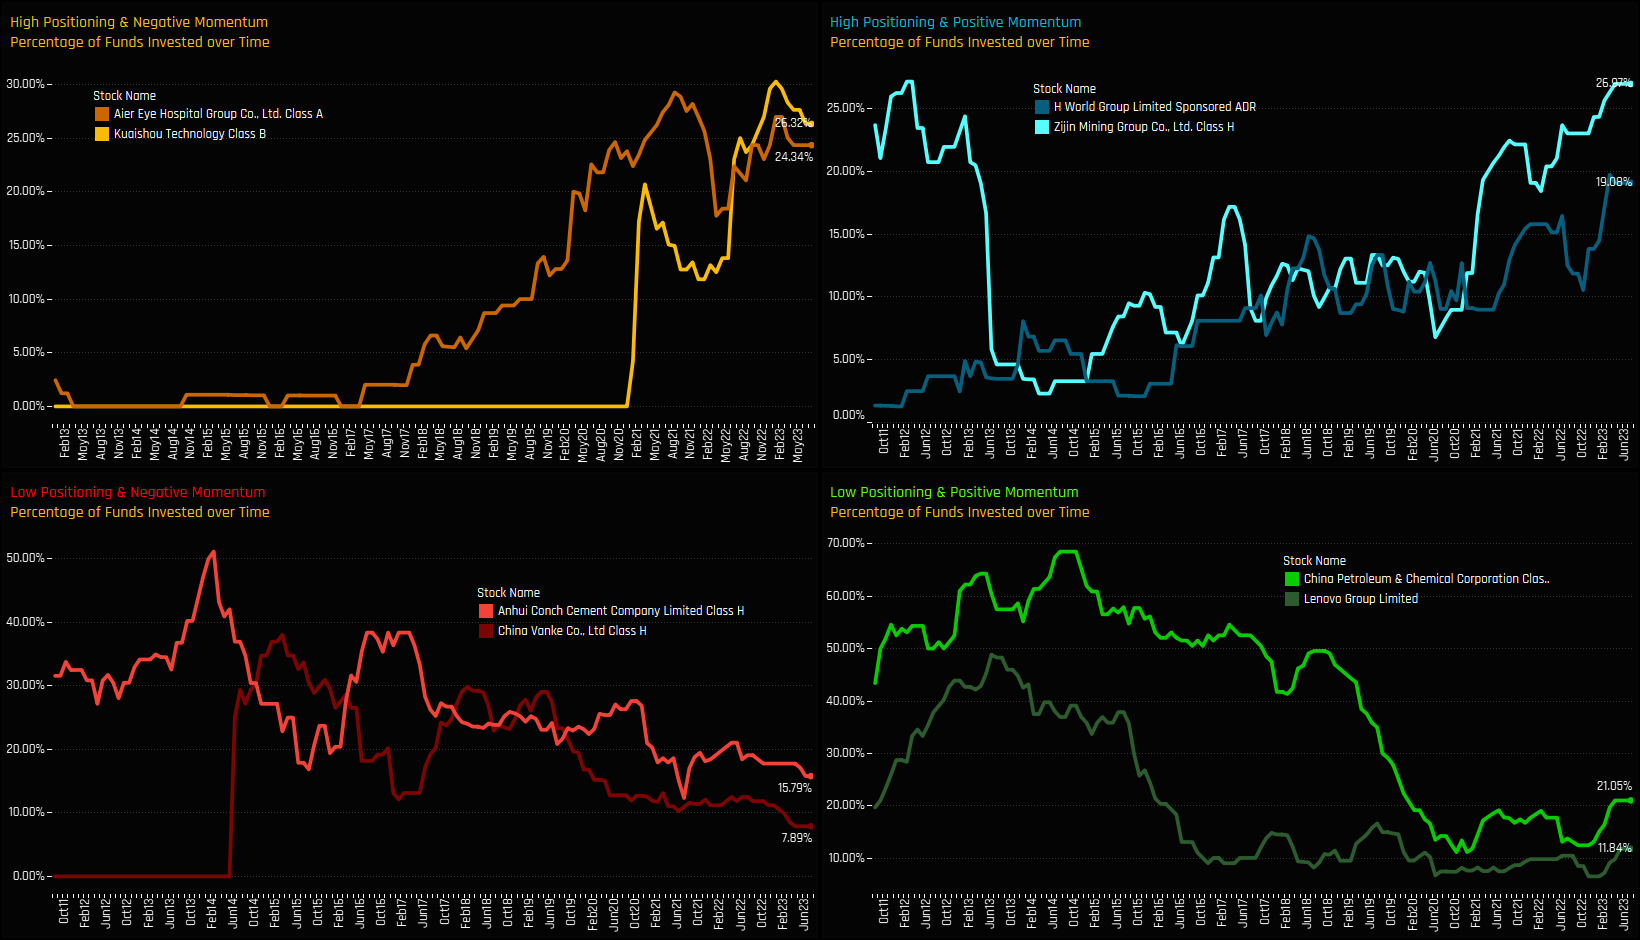
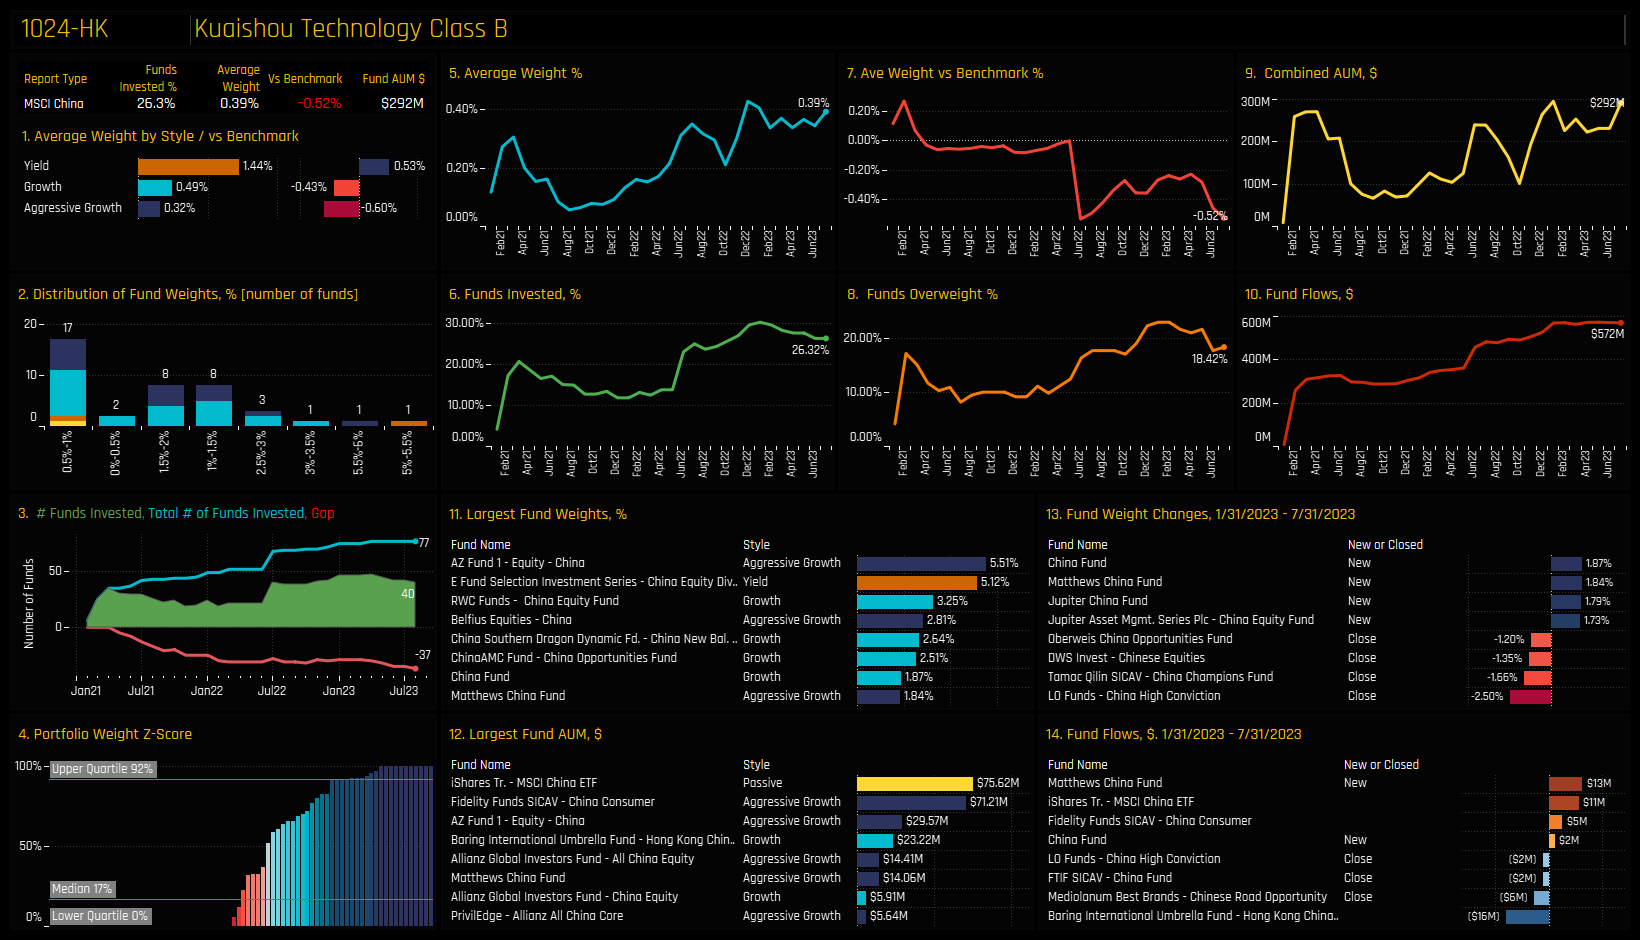
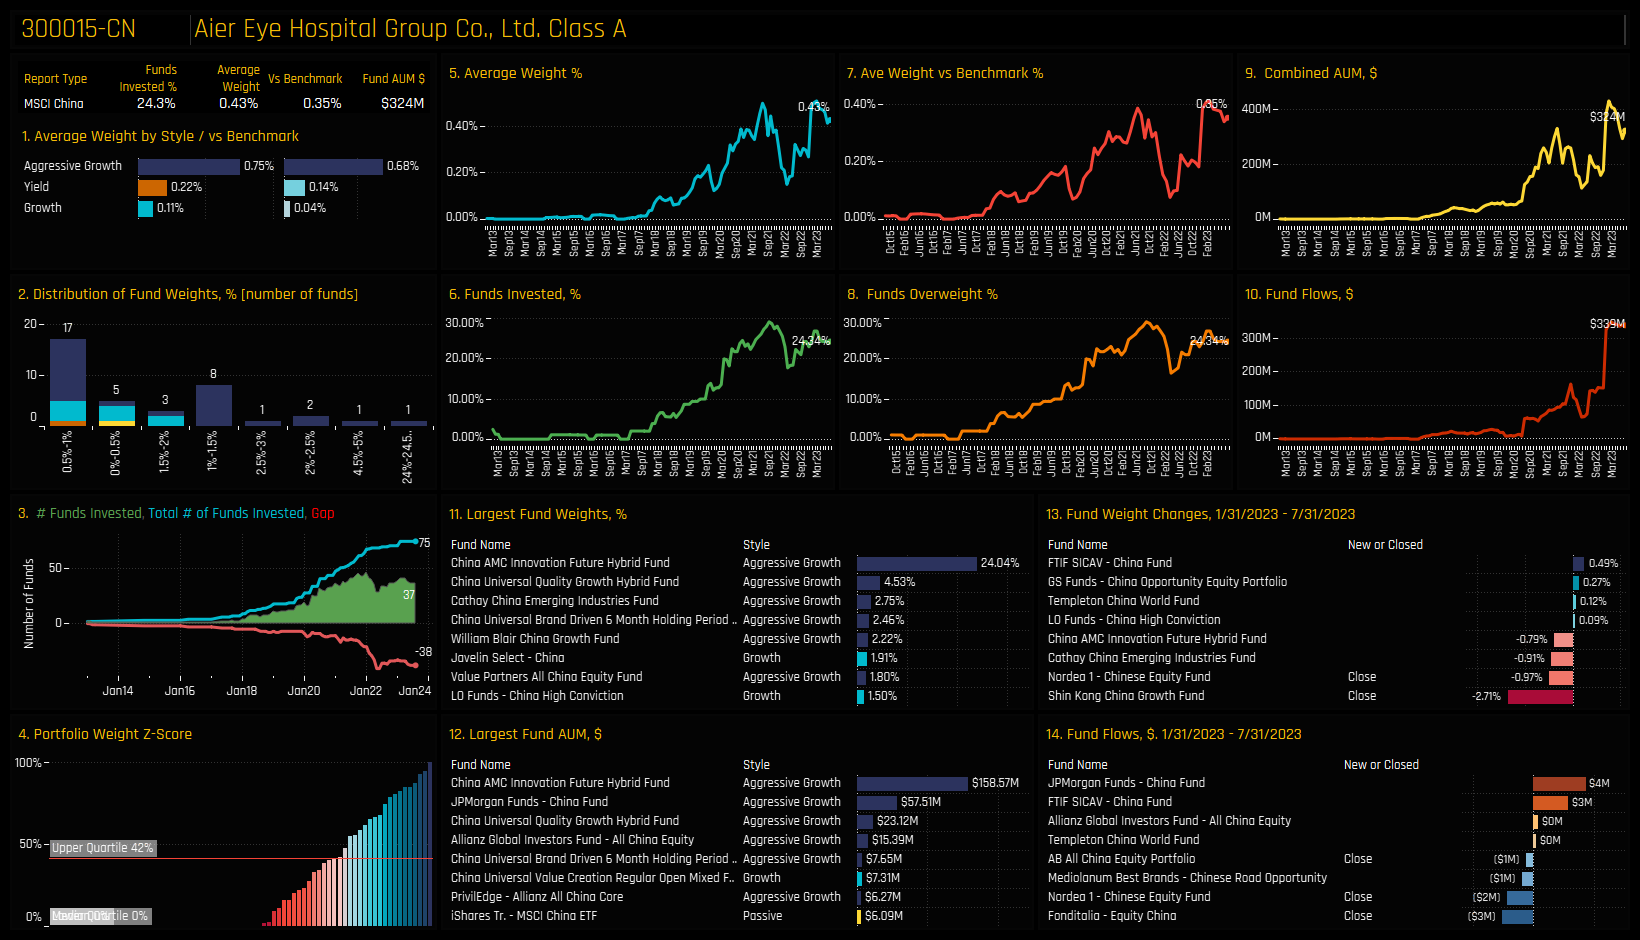
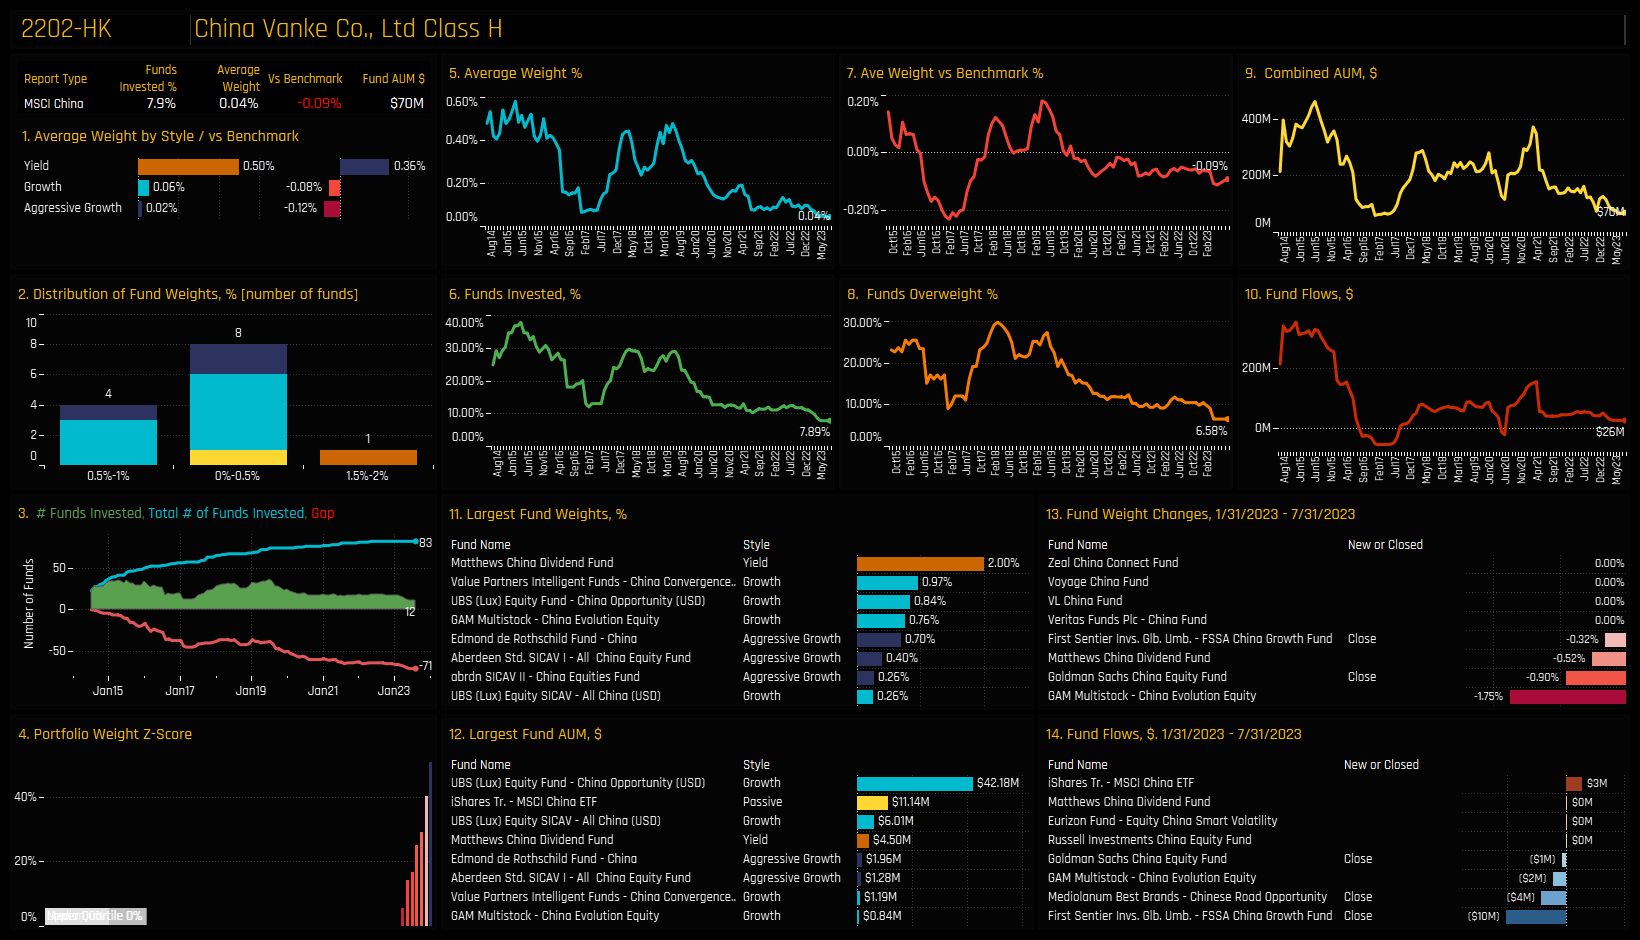
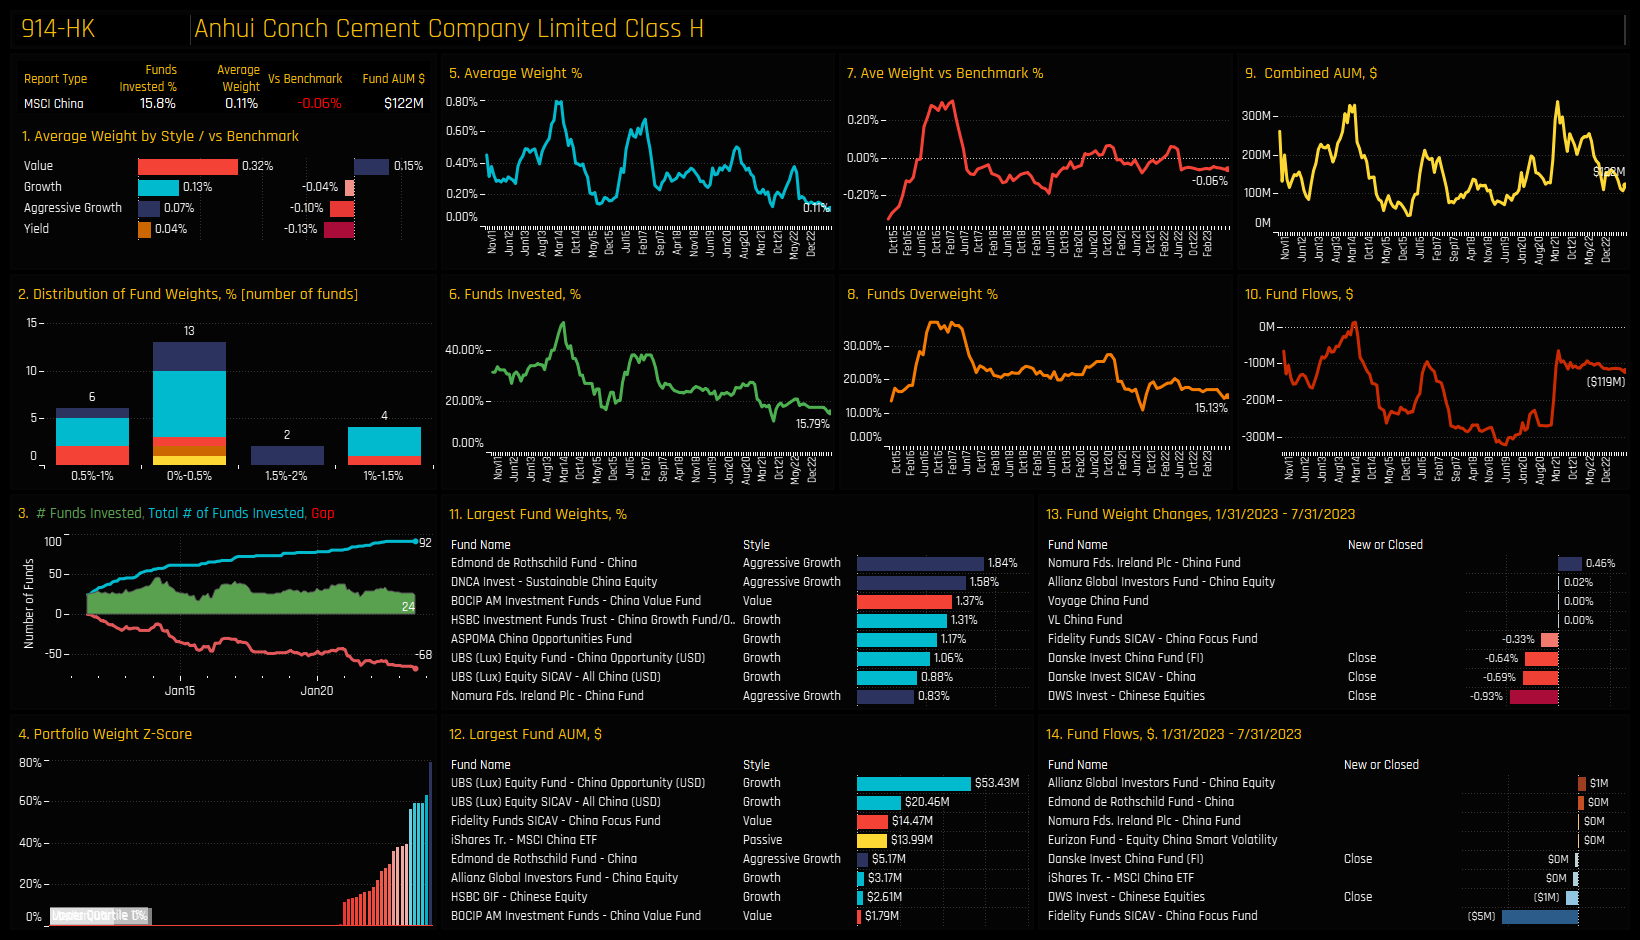
The following charts illustrate the proportion of active funds invested in the top 2 stocks within each of the 4 categories. This visualization provides an additional perspective how the Sentiment Grid works. For instance, in the chart located at the top-left, Aier Eye Hospital Group and Kuaishou Technology have experienced a decline in fund ownership from historically high levels. Moving to the chart in the bottom-left, both Anhui Conch and China Vanke are close to record low levels of ownership after multi-year declines.
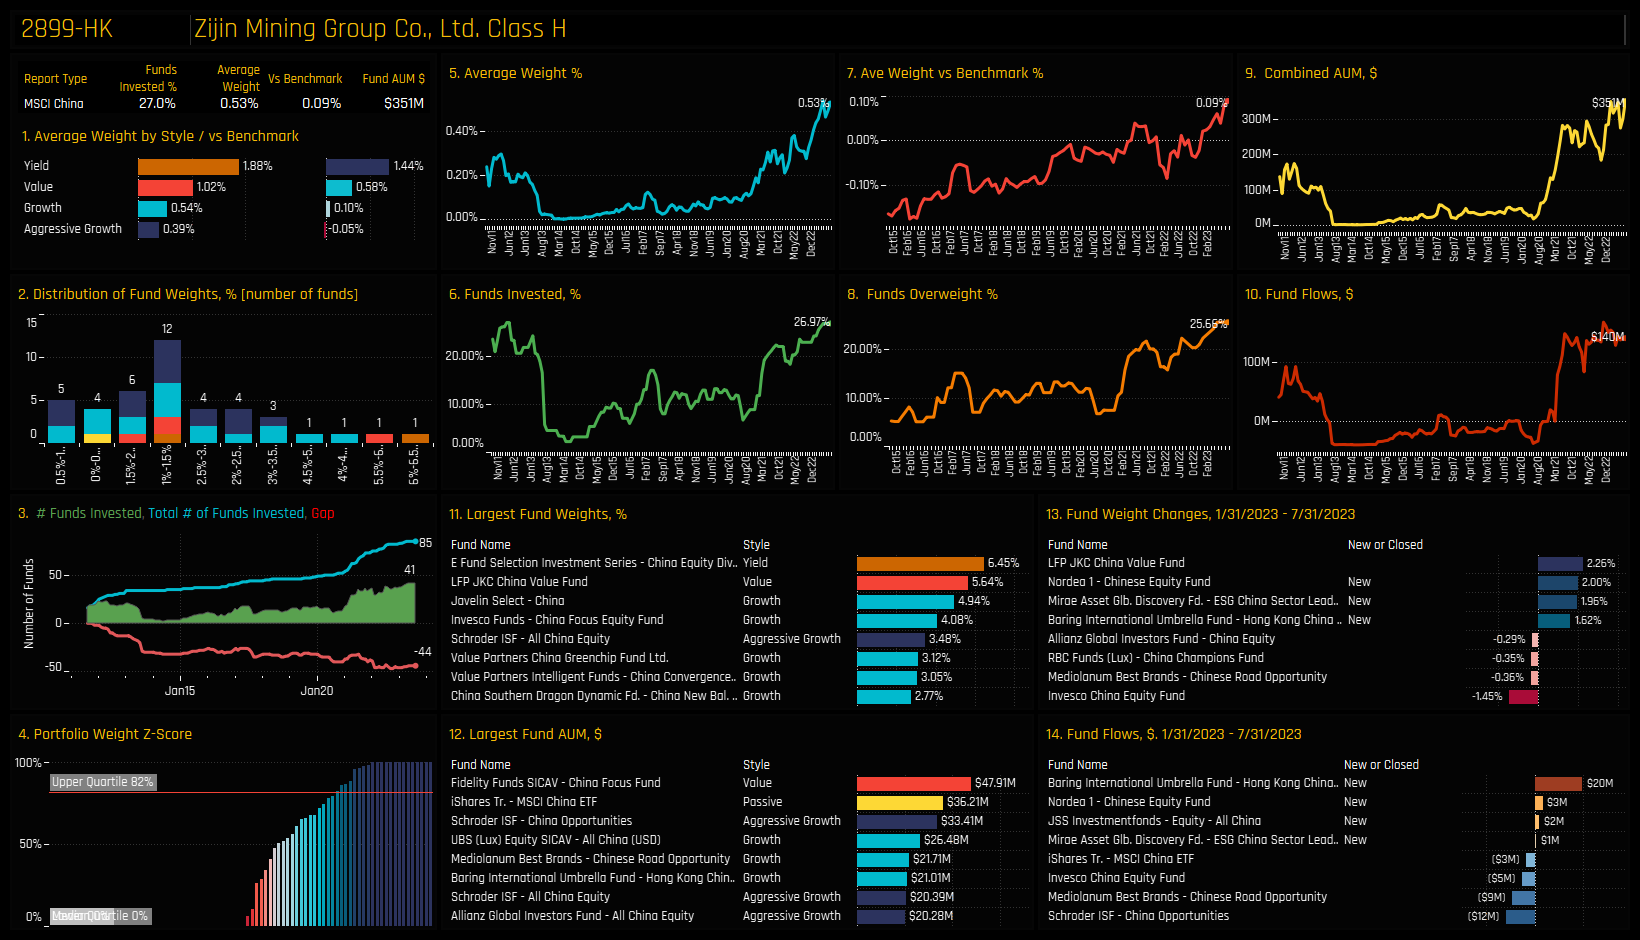
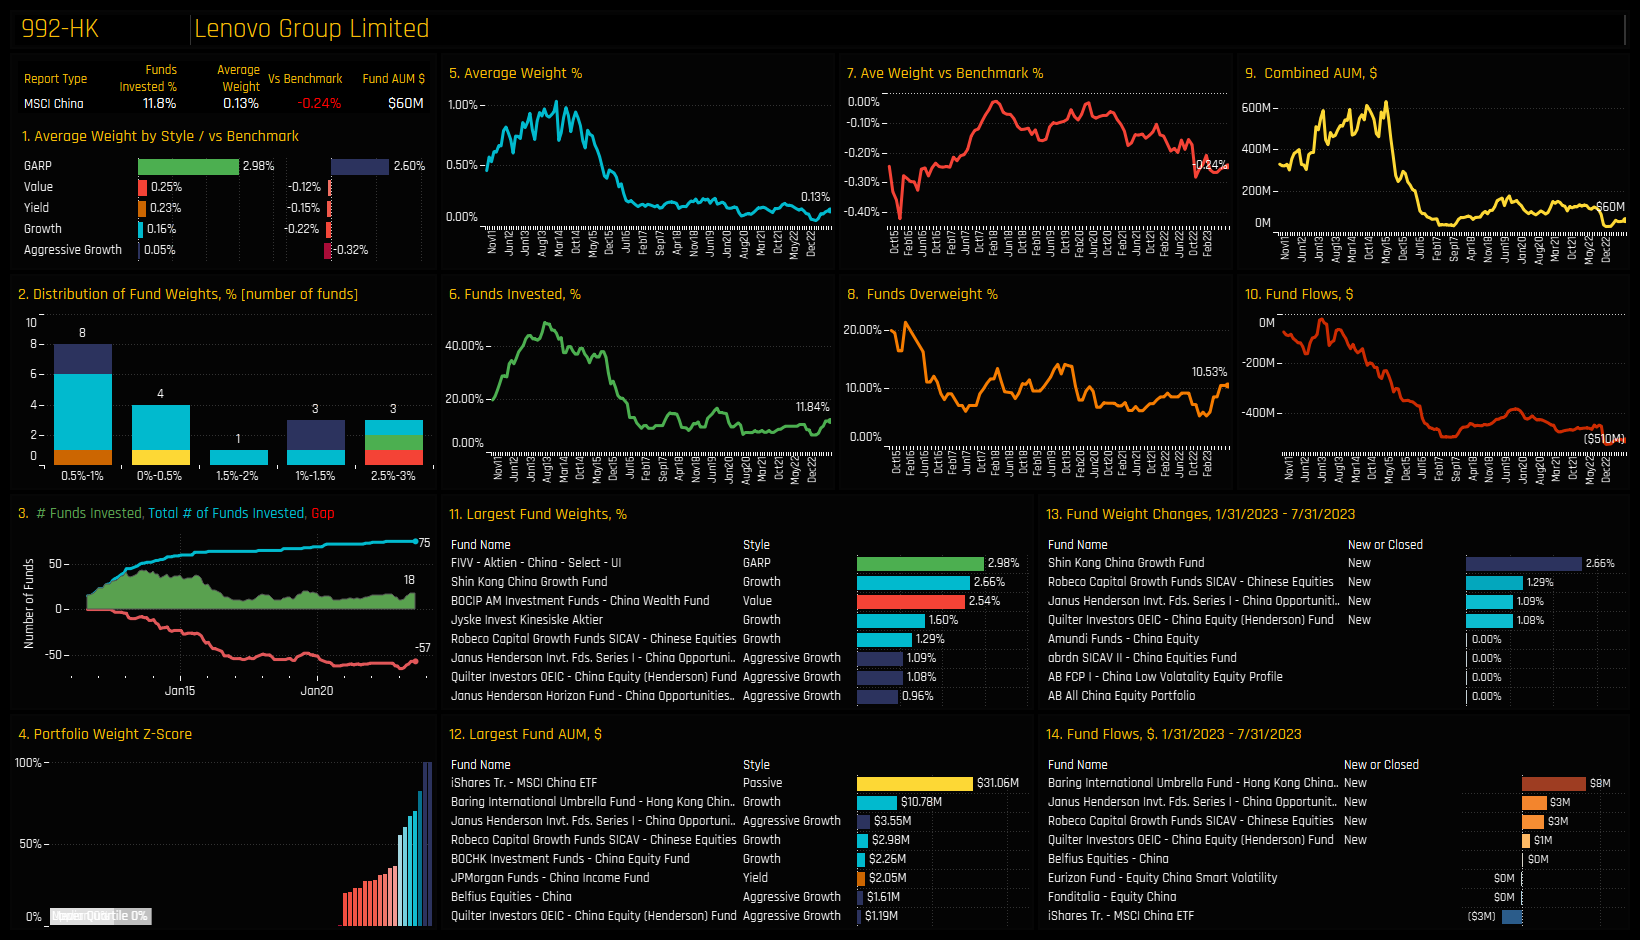
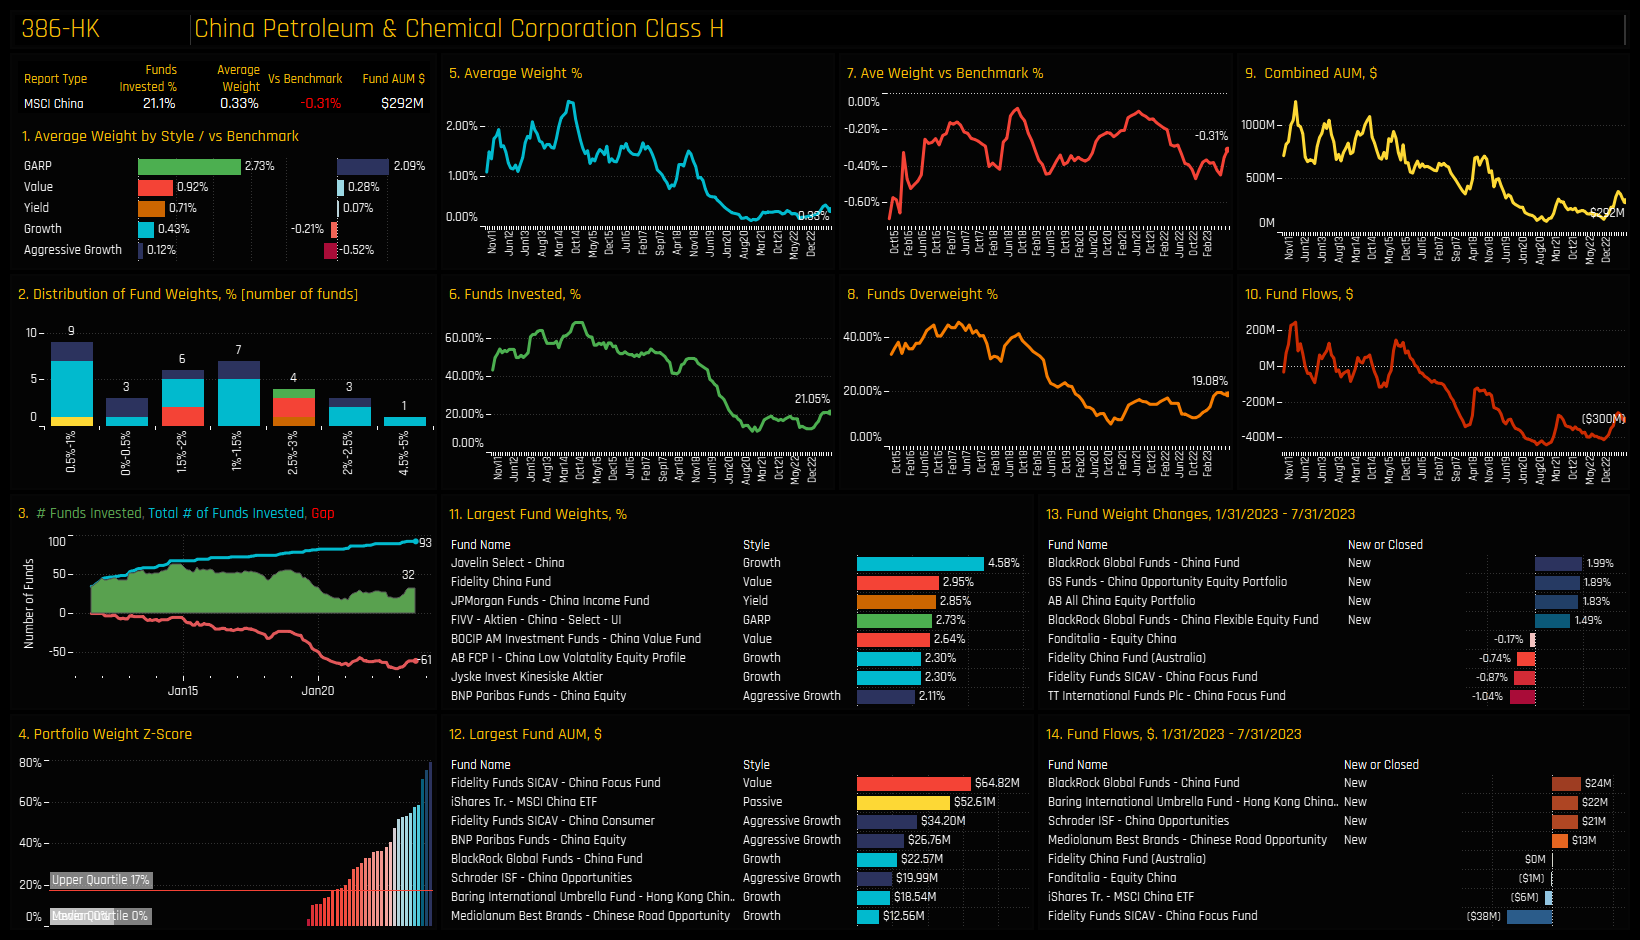
In the bottom right chart, both Lenovo Group and China Petroleum & Chemical Corp are at the lower end of their historical ownership ranges. However, both stocks have started to rebound from their lows, indicating a change in sentiment among selected managers. Finally, in the top right chart, H World Group and Zijin Mining Group are at peak levels of ownership following consistent increases in fund exposure over the past few months. In the subsequent charts, we offer more comprehensive profiles of each of the 8 stocks located at the extreme corners of our Sentiment Grid.
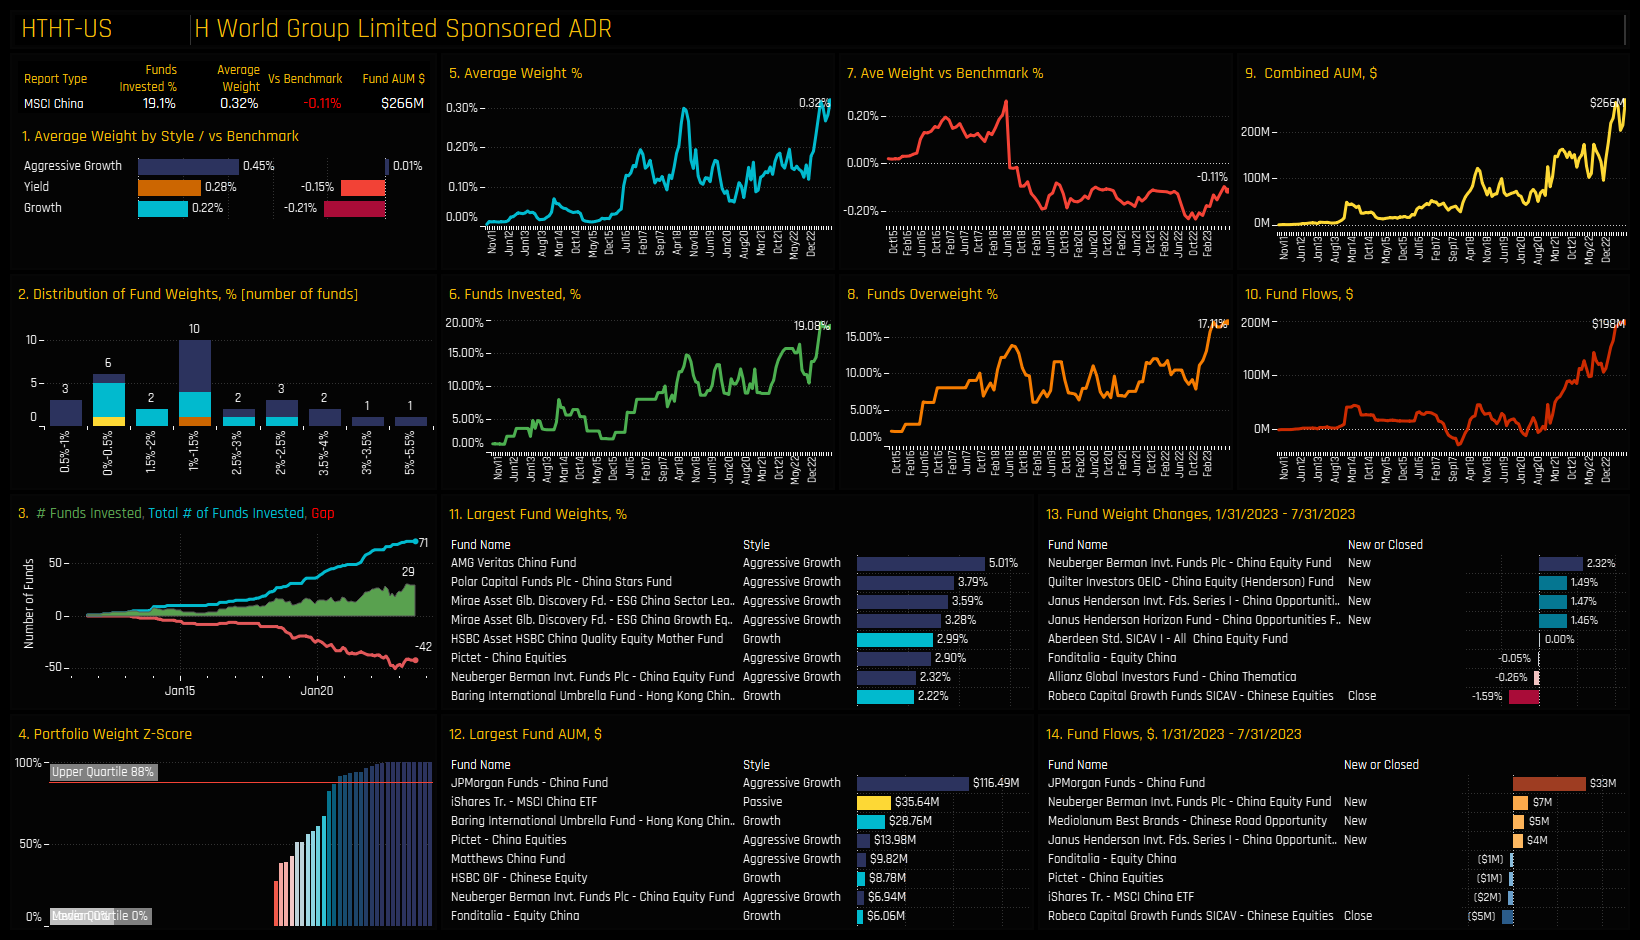
High Positioning & High Momentum: H World Group
High Positioning & High Momentum: Zijin Mining Group
High Positioning & Low Momentum: Kuaishou Technology Class B
High Positioning & Low Momentum: Aier Eye Hospital
Low Positioning & Low Momentum: China Vanke
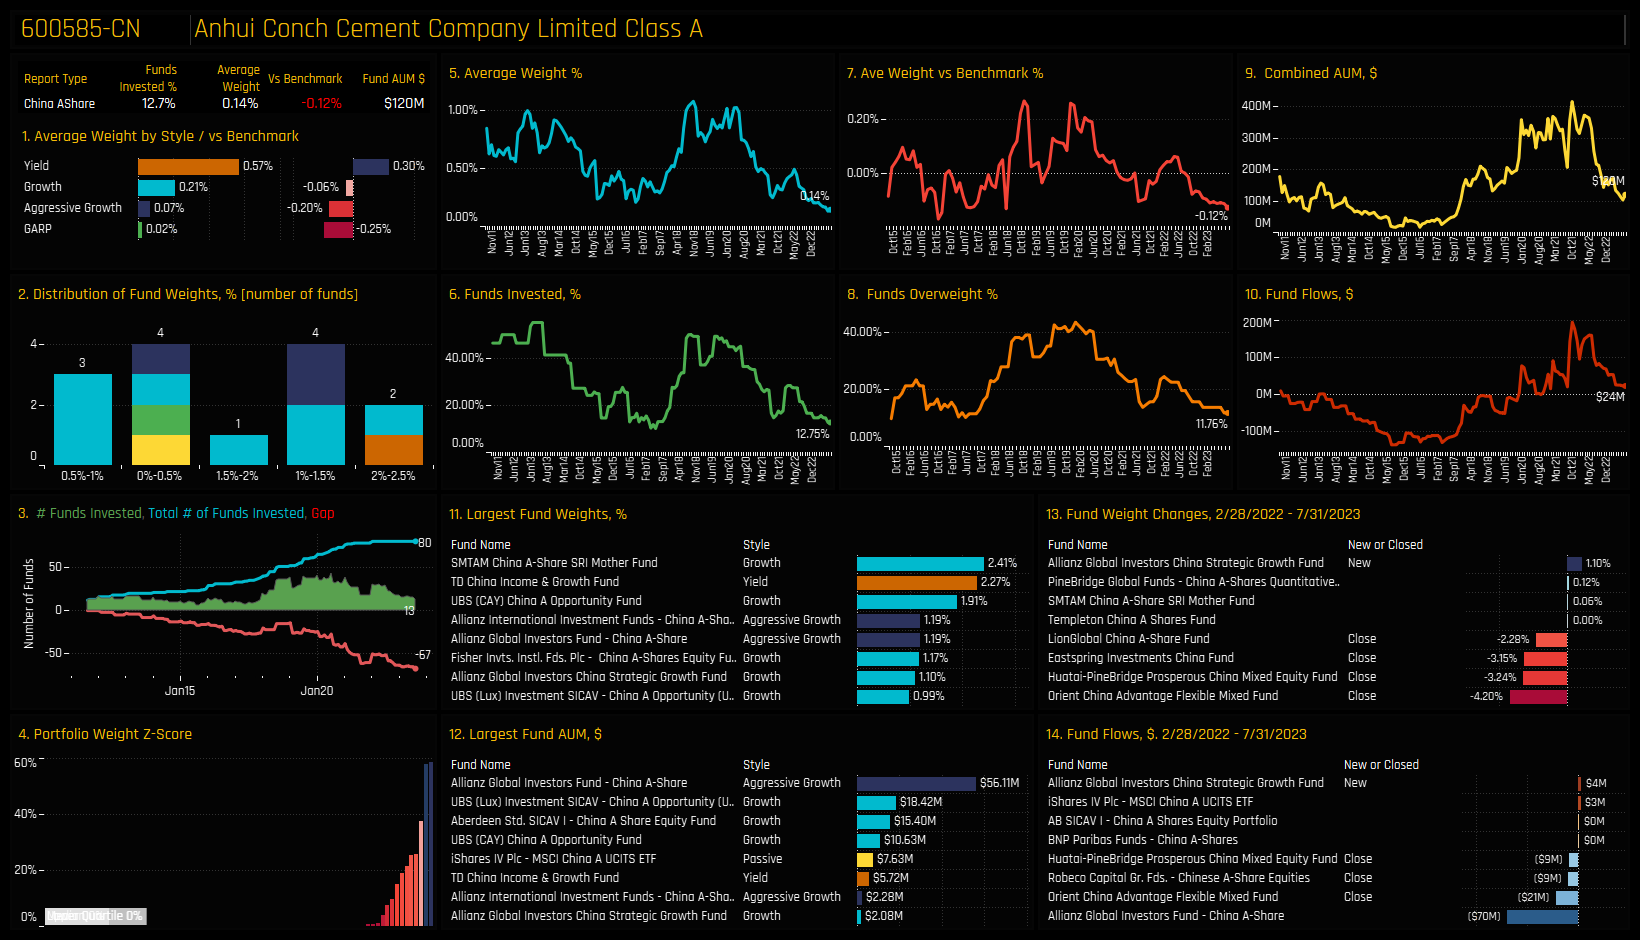
Low Positioning & Low Momentum: Anhui Conch Cement Co
Low Positioning & High Momentum: Lenovo Group Limited
Low Positioning & High Momentum: China Petroleum & Chemical Corp
102 China A-Share Funds, AUM $45bn
A-Share Construction Materials Slump
Exposure to Chinese domestic Construction Materials stocks heads to towards its lowest levels on record.
Time-Series Analysis & Industry Rotation
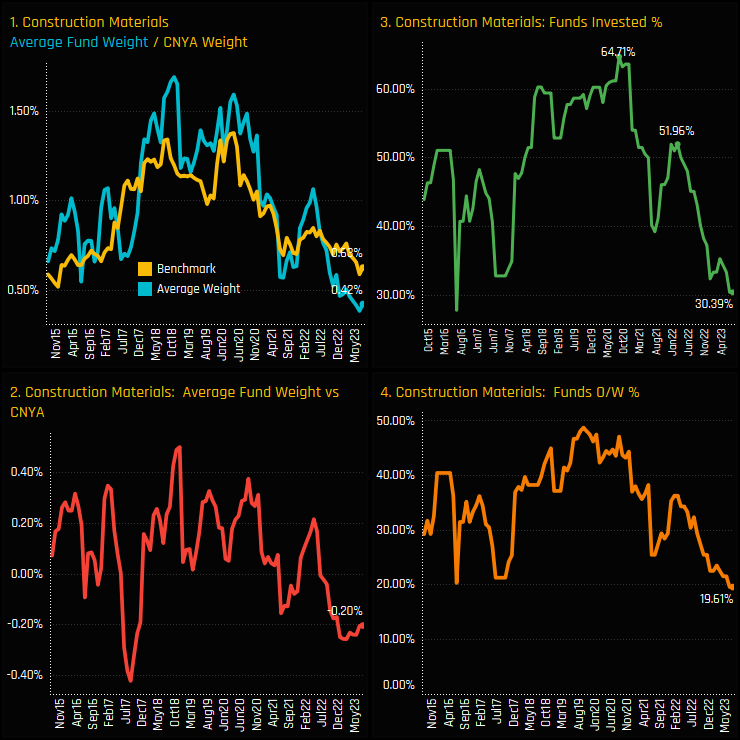
Ownership levels among active China A-Share funds in the Construction Materials sector are approaching their lowest levels on record. The percentage of funds with exposure has fallen from over 60% in late 2020 to just 30.4% today. This has driven average holding weights to record lows of 0.42%, moving managers to underweight the iShares CNYA ETF by -0.2% on average.
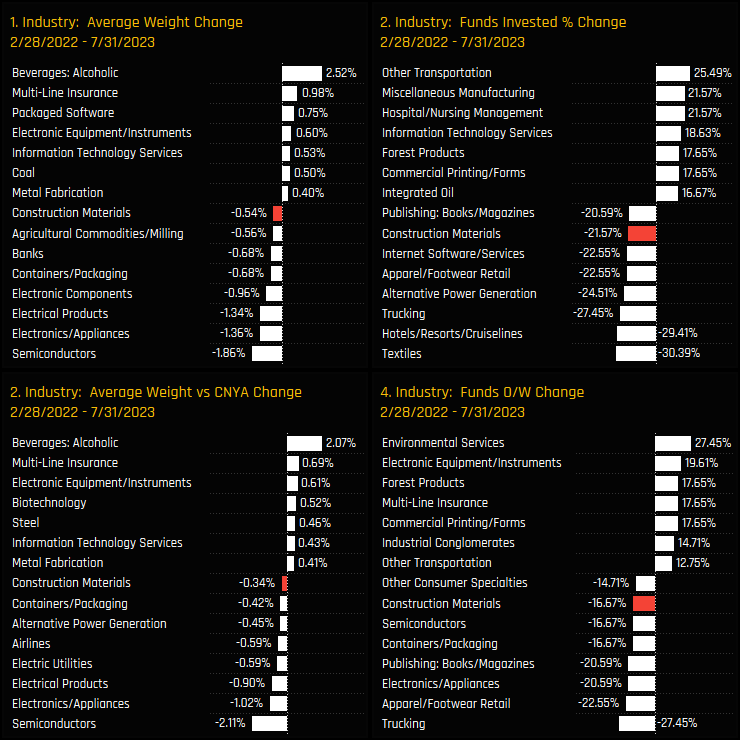
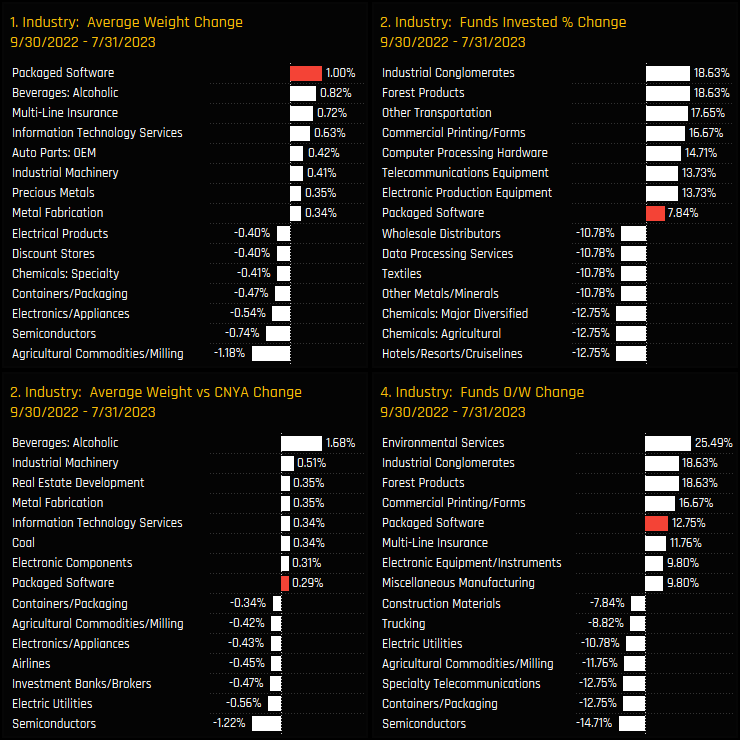
Since the last peak in ownership back in February 2022, Construction Materials have been the victim of some fairly aggressive manager rotation. All 4 of our ownership measures fell over the period, most notably the percentage of funds invested by -21.6% and average weights by -0.54%, both among the largest moves of any industry group. Active A-Share managers instead raised exposure to Alcoholic Beverages, Insurance and Packaged Software, among others.
Fund Activity & Latest Fund Holdings
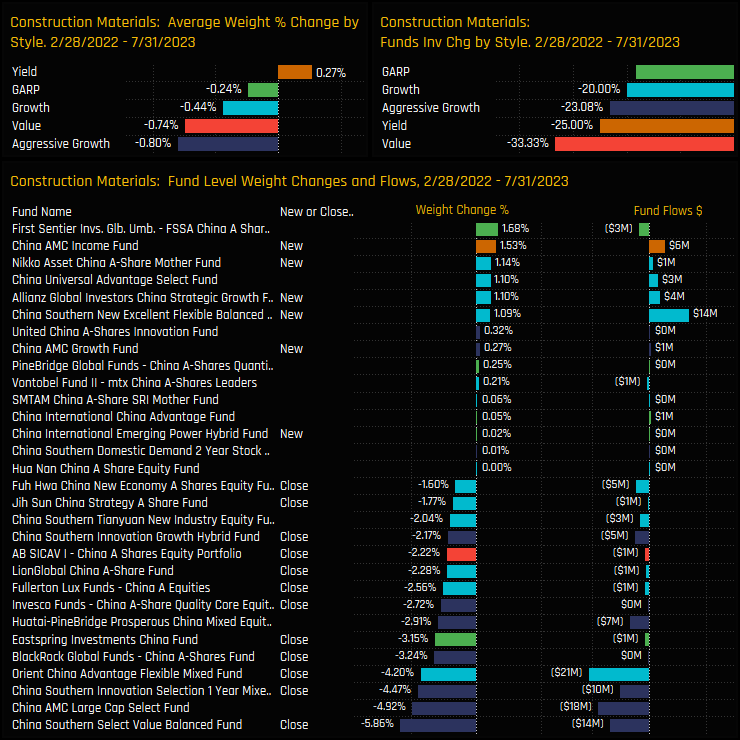
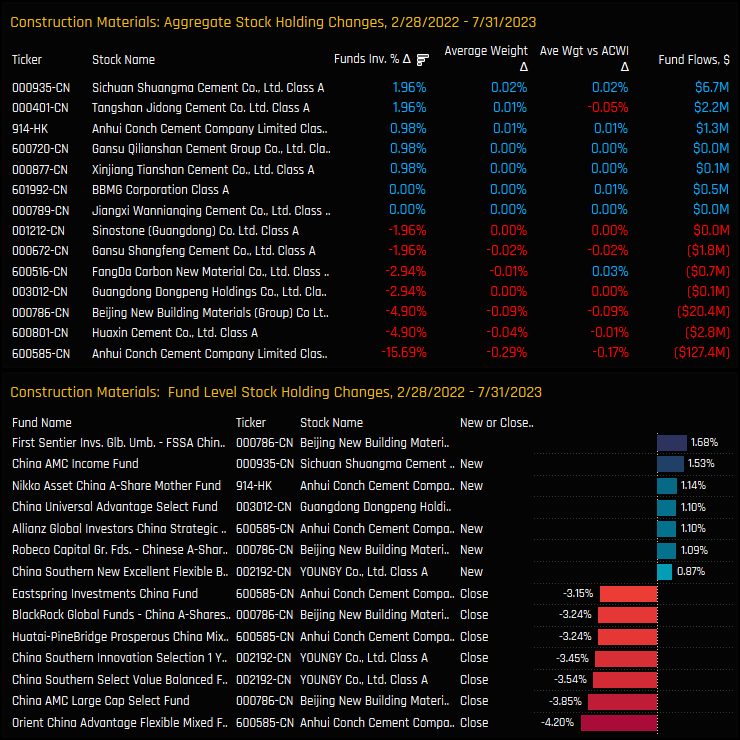
The charts below show the funds that have been behind this drop in exposure. Over the same period 02/28/2022 – 07/31/2023, 28 funds closed positions compared to just 6 opening, led by a mixture of domestic funds (China AMC, China Southern) and international funds (Invesco, BlackRock, Fullerton, Alliance Bernstein). All Style groups saw outright ownership levels fall.
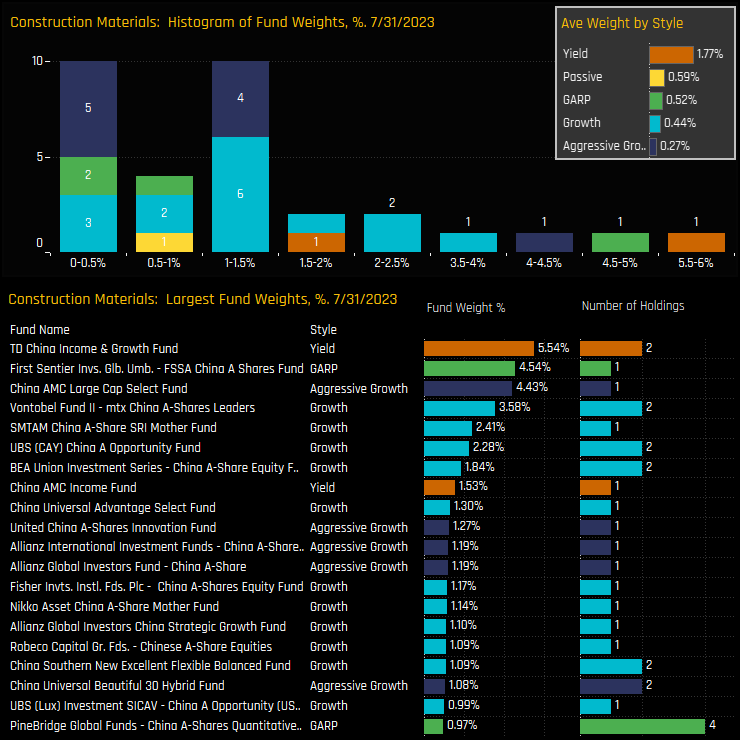
Those that do hold exposure to the Construction Materials sector typically hold less than a 1.5% stake, as shown in the top histogram below. Those with a more bullish view include 6 funds with a 2%+ allocation, led by TD China Income & Growth (5.54%) and First Sentier China A-Shares Fund (4.54%).
Latest Stock Holdings & Activity
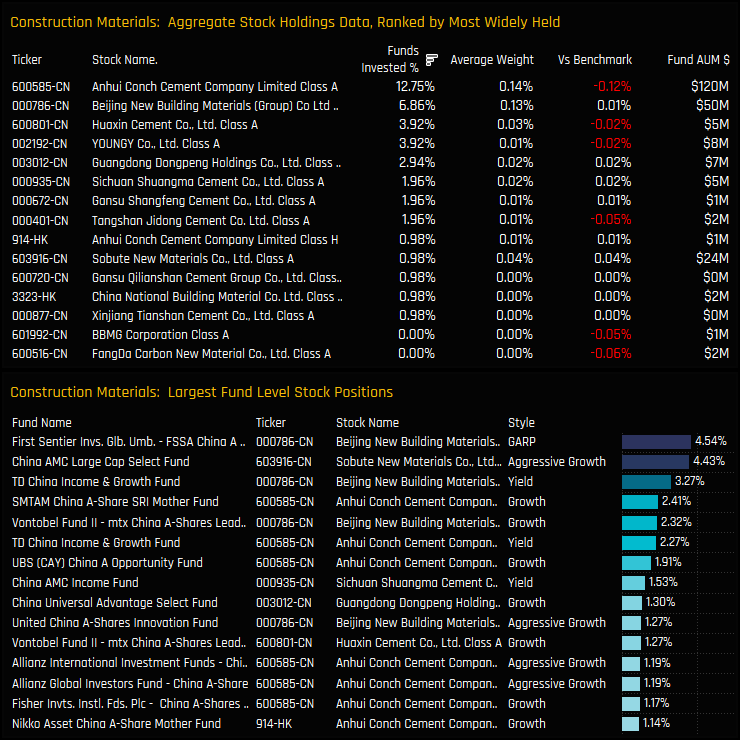
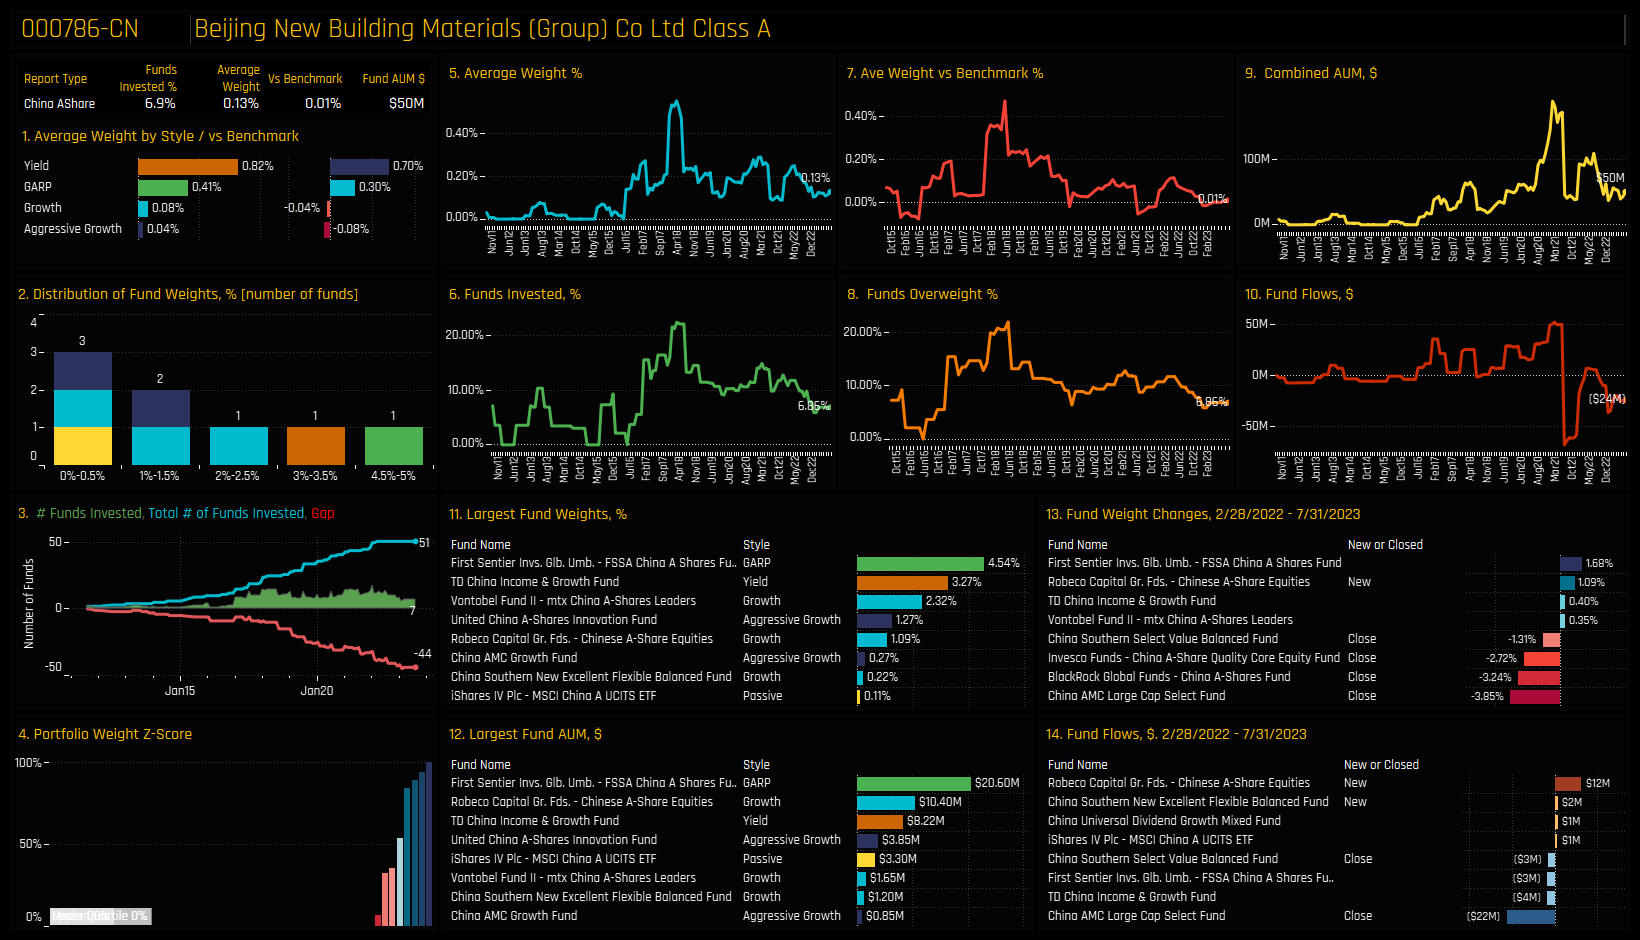
Stock ownership in the Construction Materials sector is spread across 13 companies, though exposure is heavily skewed towards the top 2 names. Anhui Conch Cement and Beijing New building Materials Group are owned by 12.8% and 6.9% of funds respectively and collectively account for over 60% of the total industry allocation. They also dominate the list of large individual fund holdings in the bottom chart, led by the First Sentier China A-Share fund’s 4.5% position in Beijing New Building Materials.
Aggregate stock level ownership changes over the same period are highlighted in the top chart below. It shows a large drop in ownership for Anhui Conch Cement, with a net 15.7% of the 102 funds in our A-Share analysis closing exposure. Huaxin Cement and Beijing New Building Materials also saw ownership levels fall but to a lesser extent. Single fund activity in the bottom chart shows the imbalance in position size between the closing and opening positions over the period.
Conclusions & Links
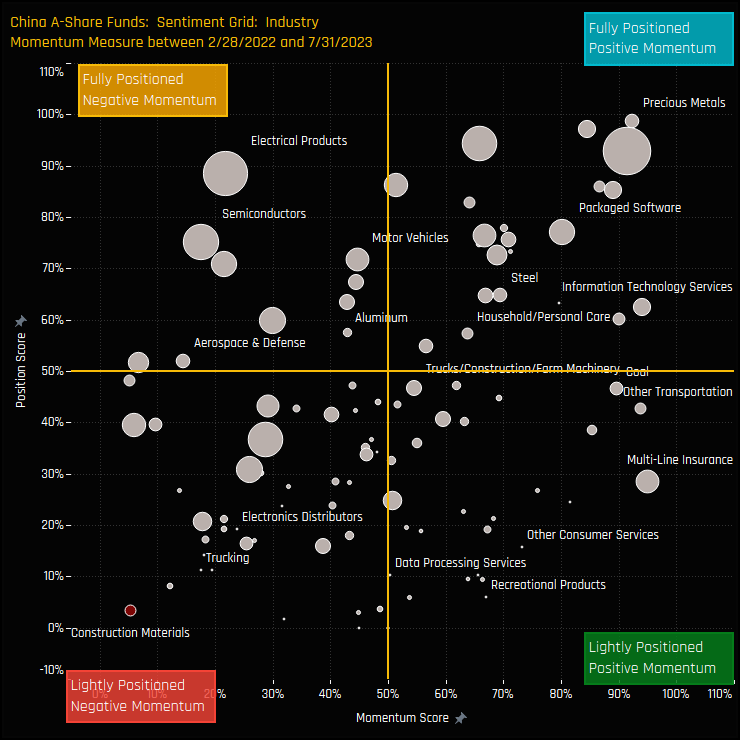
The sentiment grid opposite shows where current positioning in each Industry group sits versus its own history going back to 2015 on a scale of 0-100% (y-axis), against a measure of fund activity for each Industry between 02/28/2022 and 07/31/2023 (x-axis). The China A-Share Construction Materials industry group is out on its own in the extreme bottom-left quadrant, indicative of it’s record low positioning and continued outward rotation by active China funds.
Whilst some of this can be attributed to Anhui Conch Cement alone, the fact remains that there are very few bright spots to speak of in terms of positive activity over the last 18-months. Sentiment, as measured by fund activity and positioning, is as low as it gets.
Click on the link below for a more detailed data pack on A-Share fund positioning in the Construction Materials industry group. Scroll down for fund profiles on Anhui Conch Cement and Beijing New Building Materials.
Stock Profile: Beijing New Building Materials Class A
103 China A-Share Funds, AUM $44bn
China A-Share Funds: Package Software Revival
Packaged Software allocations reverse course and continue bullish run.
Time Series & Industry Rotation
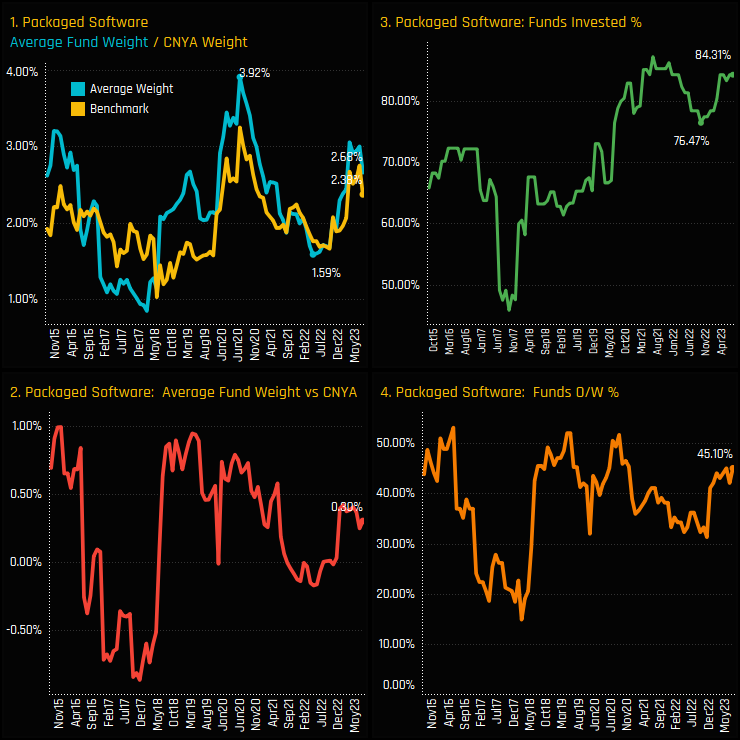
Ownership levels in the Packaged Software industry group are back on the up. Packaged Software allocations last peaked in mid 2020 with average weights of 3.92%, but slumped to just 1.59% over the next 2-years as investors reduced exposure. The recent revival has taken the percentage of funds invested from 76.5% to 84.3% and average weights back up to 2.68%. Versus the iShares CNYA ETF benchmark, 45.1% of funds are overweight the benchmark by +0.3% on average.
Since the last trough in September 2022, Packaged Software stocks have been among the key beneficiaries of manager rotation. All measures of ownership moved higher over the period, with average weight increases of 1% the most of any industry, driven by +7.8% of funds adding exposure and 12.75% moving to overweight. This was an active and deliberate rotation.
Fund Level Activity & Latest Holdings
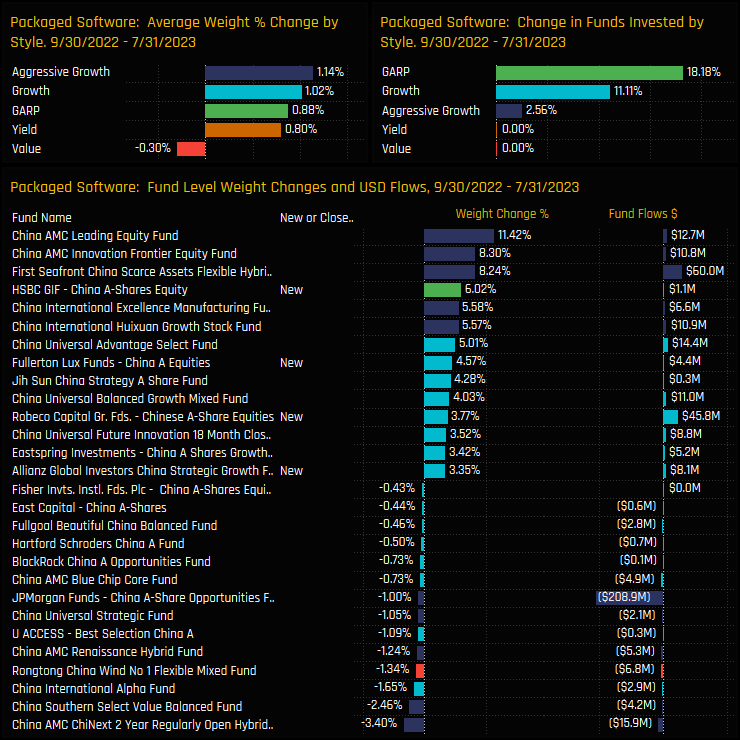
The funds driving allocations higher over this period were led by China AMC Leading Equity (+11.42%) and China AMC Innovation Frontier Equity (+8.3%), alongside new exposures from HSBC China A-Share (+6.02%) and Fullerton China A Equities (+4.57%). On a Style basis, Aggressive Growth and Growth funds saw allocations rise by 1.14% and 1.02% respectively, whilst Value funds decreased by 0.30% on average.
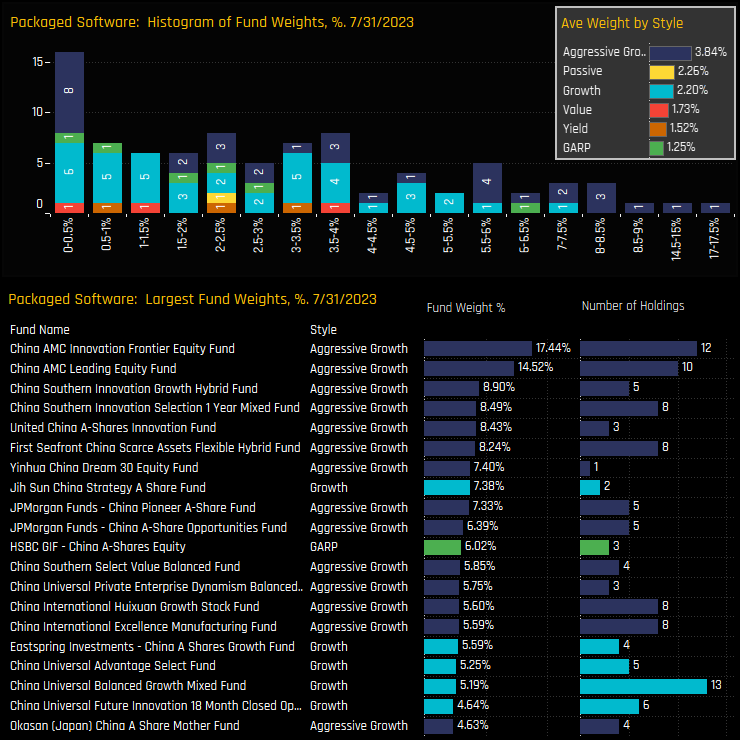
Funds that follow an Aggressive Growth strategy are the most bullish on the sector with average weights of 3.84%, making them the only Style group positioned overweight the CNYA benchmark. The histogram chart shows the bulk of allocations sitting below 4%, with the extended tail to the upside mainly occupied by high growth strategies. China AMC Innovation and Leading Equity top the list with 17.4% and 14.5% allocations respectively.
Latest Stock Holdings & Activity
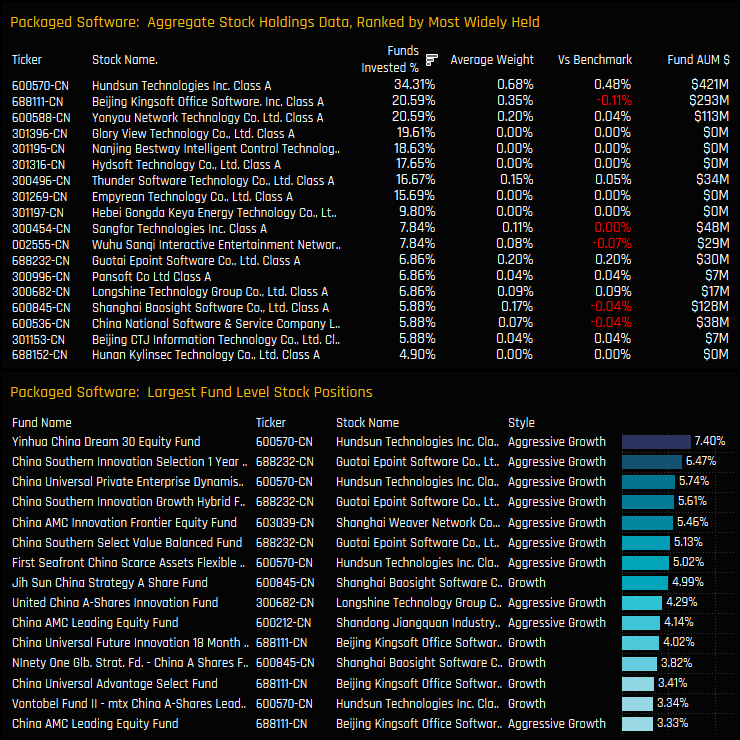
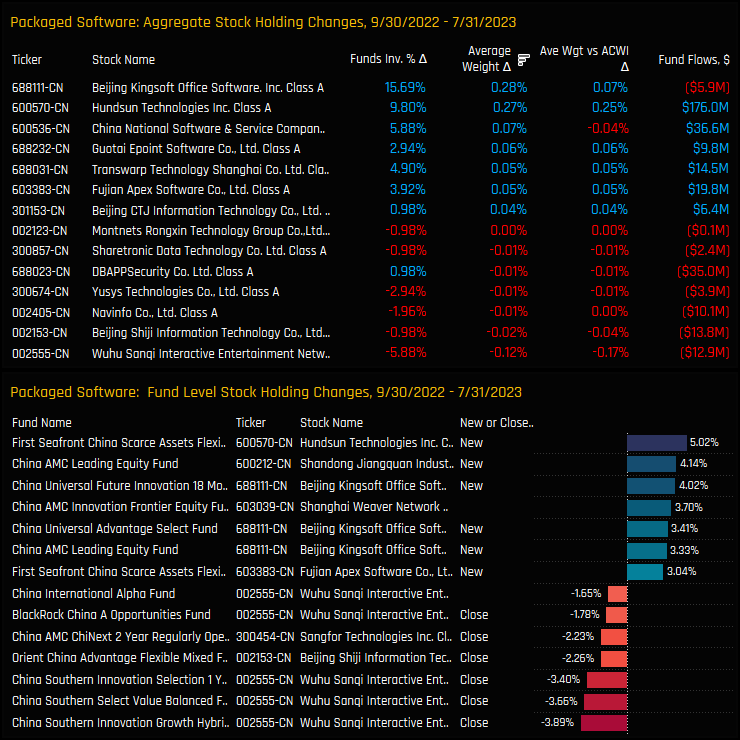
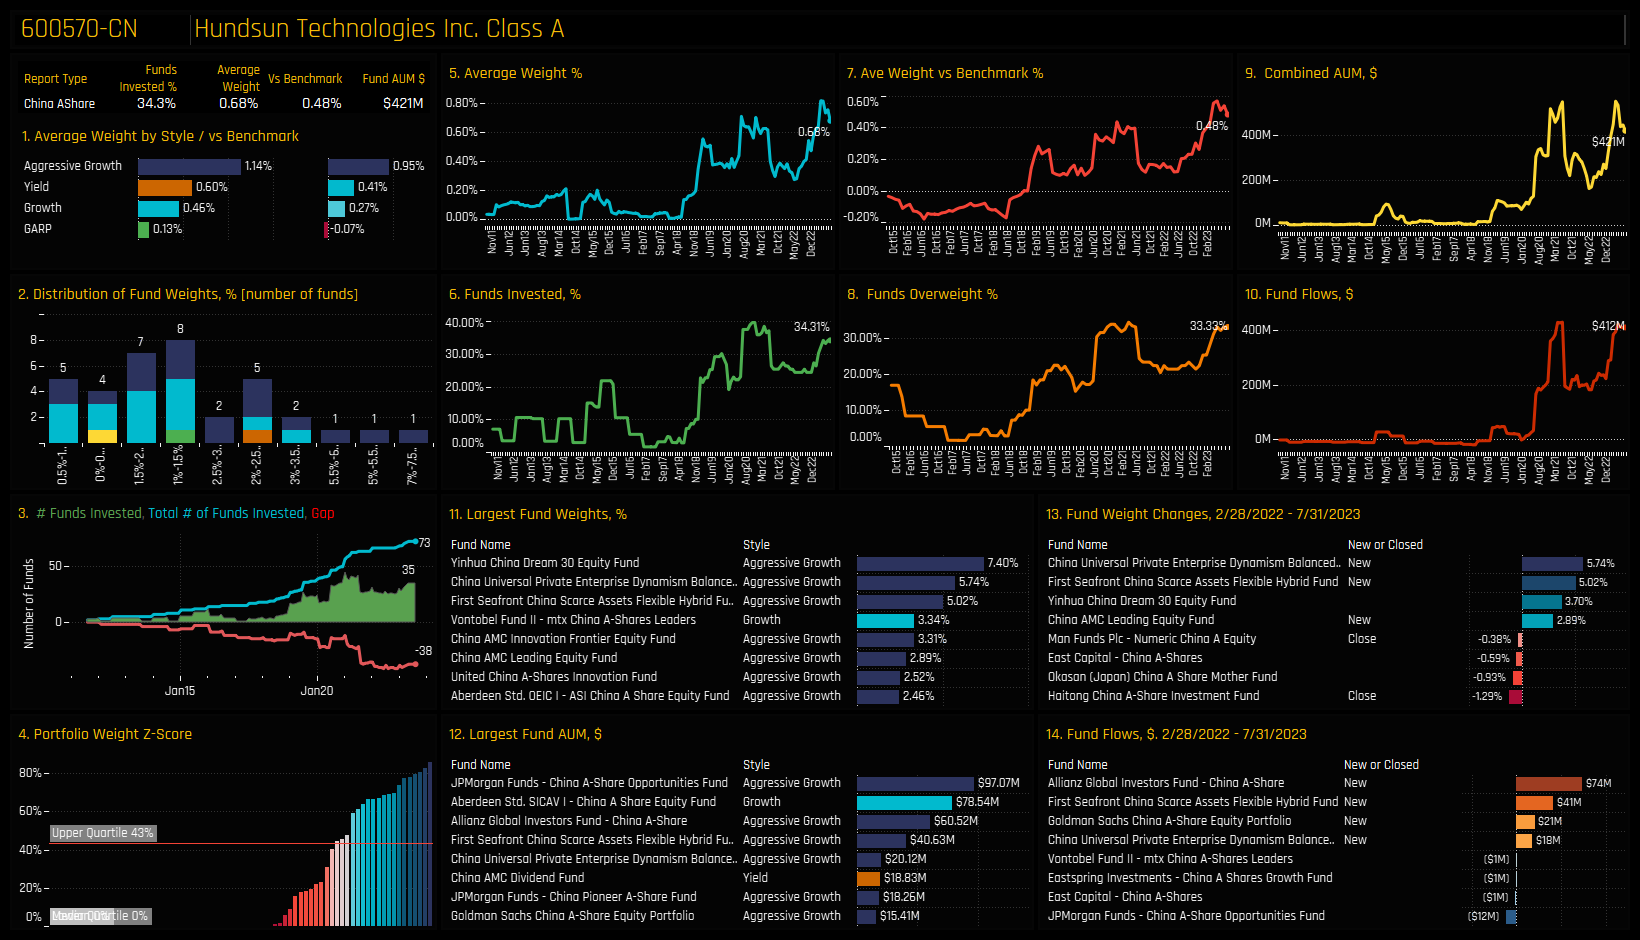
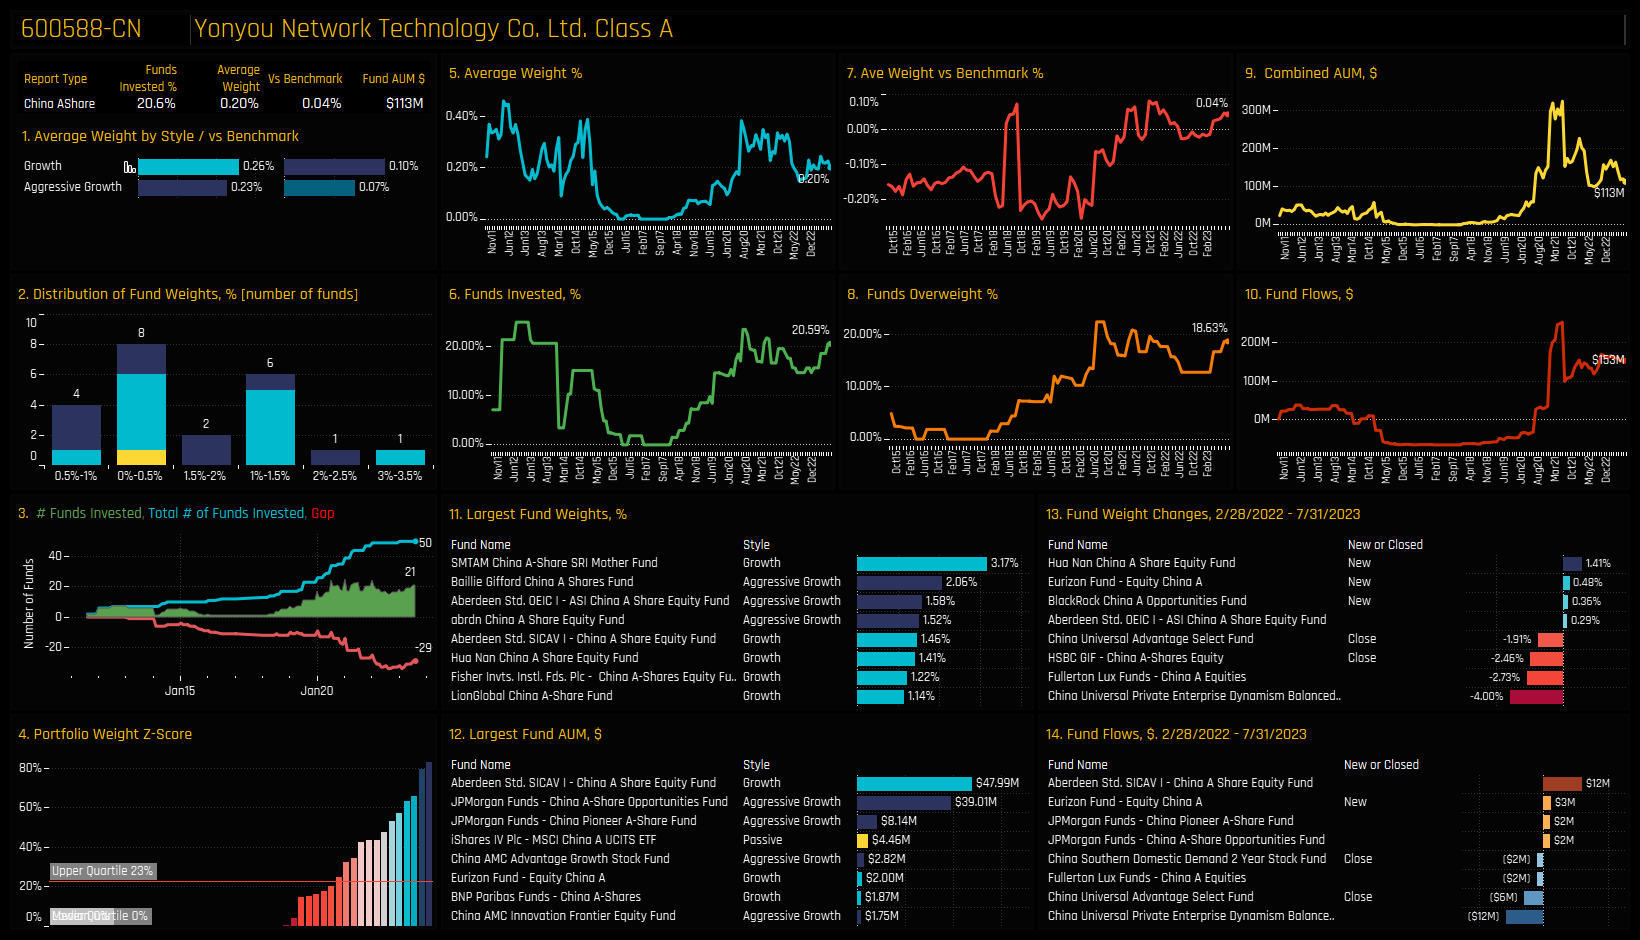
On a stock level, 3 companies dominate the holdings picture. Hundsun Technologies, Beijing Kingsoft Office Software and Yonyou Network Technology account for 46% of the total Packaged Software allocation. Hundsun is the most widely held, owned by 34.3% of funds at an average weight of 0.68% and is prevalent among the high conviction fund positions in the bottom chart.
Stock level activity between 09/30/2022 and 07/31/2023 highlights Beijing Kingsoft Office Software and Hundsun Technologies as the key drivers behind the overall increase in Packaged Software allocations. The percentage of funds invested in Beijing Kingsoft increased by 15.7% and in Hundsun by 9.8%. Smaller increases were seen in China National Software, Guotai Epoint Software and Transwarp Technology, which more than offset decreases in Wuhu Sanqi Interactive Entertainment and Navinfo Co, among others.
Conclusions & Data Pack
This favorable rotation over the last 10 months has moved Packaged Software up the pecking order of Industry allocations among active China A-Share managers. It is now the 9th most widely held Industry group, sharing similar ownership characteristics to Major Pharma, Electronic Components and Specialty Chemicals (see data pack below).
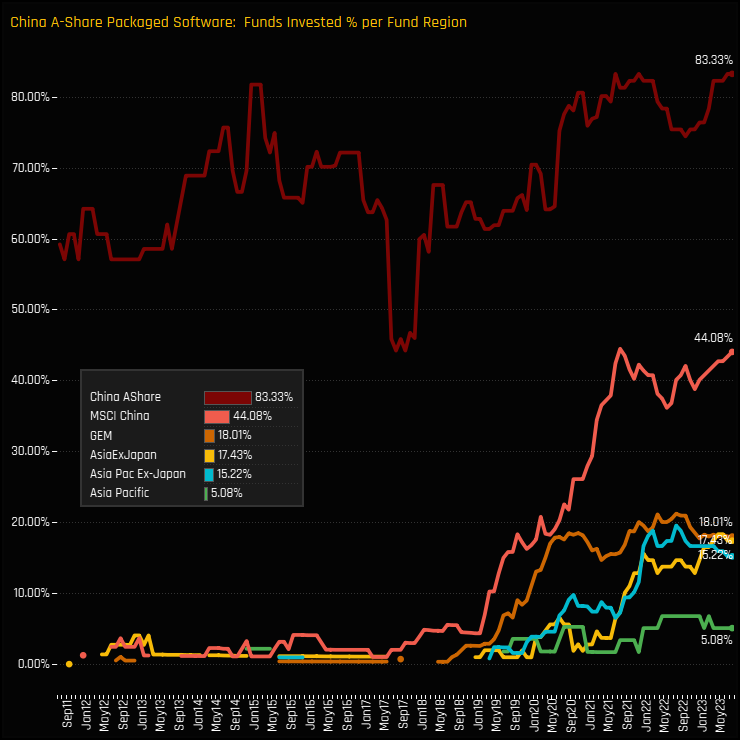
If we extend our analysis to the other fund groups with China exposure, China A-Share Packaged Software positioning has seen a similar rise in recent years, but hasn’t penetrated to the same degree as in dedicated China A-Share funds. For example, whereas over 80% of China A-Share managers have exposure, just 44.1% of MSCI China active funds and 18% of active Global Emerging Market Funds have an A-Share Package Software allocation.
Whilst this is understandable given the wealth of alternatives that these broader mandates allow, it still hints at the potential for further investment growth. Watch this space.
Click on the link below for an extended data pack on Packaged Software positioning among active China A-Share funds. Scroll down for stock profiles on Hundsun Technologies, Beijing Kingsoft Office Software and Yonyou Network Technology, together with links to the latest China positioning PDF reports.
For more analysis, data or information on active investor positioning in your market, please get in touch with me on steven.holden@copleyfundresearch.com
Investor Positioning Report — Copley Fund Research Ltd · Last updated: July 2026 · Registered in England and Wales
1. Who we are
Copley Fund Research Ltd provides proprietary institutional fund intelligence to listed companies and investor relations professionals. These terms govern every purchase of an Investor Positioning Report. By completing a purchase you confirm you have read, understood, and agreed to these terms in full.
2. What you are purchasing
The Investor Positioning Report is a bespoke PDF report mapping the institutional fund universe around your stock. It covers current investors, past investors, competitor investors, and white space investors. Every report is built from scratch for the specific company ordered and is not a standardised or templated product.
3. Delivery and process
Following payment or invoice issuance, Copley Fund Research will contact you within one working day to agree your competitor set. Production begins once the competitor set is confirmed in writing. The completed report will be released to you within 48 hours of production starting, provided payment has been received in full; where payment is outstanding, the report will be withheld until payment clears. If the requested company falls outside our covered fund universes, or a competitor set cannot be agreed, Copley Fund Research will issue a full refund or cancel the outstanding invoice.
4. Competitor set agreement
The competitor set is agreed with you in writing prior to production, and the report is built to that agreed specification. Requests to amend the competitor set after delivery, based on a change of preference rather than an error, may be treated as a new order.
5. Refund policy
Because each report is produced individually for your company, orders are non-refundable once production has begun, except as set out in clauses 3 and 5a below. By purchasing, you agree not to dispute the charge with your card provider on the basis that the service was not as described, provided the report has been delivered to the agreed specification or corrected under clause 5a.
5a. Quality remedy
If a delivered report contains a material error caused by Copley Fund Research — for example, an incorrect company analysed, a competitor omitted from the agreed set, or content missing from the specification in clause 2 — Copley Fund Research will correct and redeliver the report at no additional charge, within a reasonable timeframe. This is your sole remedy for such errors.
6. Data and accuracy
All fund positioning data in the report reflects holdings as disclosed at the most recently available reporting date at the time of compilation. The timing of fund holdings disclosures is determined by regulatory requirements applicable to each fund and is outside the control of Copley Fund Research Ltd. This data may not reflect current fund positions. Copley Fund Research takes reasonable care to ensure accuracy but makes no warranty, express or implied, as to the completeness or current accuracy of the underlying data — though this does not affect the quality remedy in clause 5a for errors in how that data was analysed or presented. Past fund positioning is not indicative of future fund behaviour or investment decisions.
7. Not investment advice
The Investor Positioning Report is produced for investor relations intelligence purposes only. It does not constitute investment advice, financial advice, or a recommendation to buy, hold, or sell any security. The data reflects historical fund positioning and must not be relied upon as a prediction of future fund behaviour or investment decisions. Copley Fund Research Ltd is not authorised or regulated by the Financial Conduct Authority for the provision of investment advice.
8. Permitted use and confidentiality
The report is licensed for internal use by the purchasing organisation only. You may share it with employees and directors of your organisation. You may not: reproduce, redistribute, publish, or resell the report or any part of it; share it with any third party outside your organisation without prior written consent; use the fund or portfolio manager names contained in the report to approach those individuals on behalf of Copley Fund Research or in a manner that could damage Copley Fund Research's relationships with those funds; or use the data for any purpose other than your own investor relations strategy. The data, analysis, and methodology contained in the report are the intellectual property of Copley


